preliminary statistical update balance of payments external sector statistics unit economic...
TRANSCRIPT
THE BALANCE OF PAYMENTS
External Sector Statistics Unit Economic Information & Publications Department
RESEARCH AND ECONOMIC PROGRAMMING DIVISION
BANK OF JAMAICA P.O. Box 621
Kingston, Jamaica
Preliminary STATISTICAL UPDATE
January 2006

TABLE OF CONTENTS Pages External Trade ............................................................................................................1 Exports....................................................................................................................…3 Garments.................................................................................................................…5 Bauxite...................................................................................................................…7 Selected Non -Traditionals........................................................................................9 Tourism ................................................................................................................…10 Private Transfer flows..............................................................................................14 B. O. P. Reports.......................................................................................................16

EXTERNAL TRADE US$000
JAN JAN 1/ CHANGE %CHANGE APR-JAN APR-JAN 1/ CHANGE %CHANGE2004/2005 2005/2006 2004/2005 2005/2006
TOTAL GOODS EXPORTS(F.O.B) 118588 142816 24228 20.4 1304246 1421663 117417 9.0TOTAL GOODS IMPORTS(C.I.F) 383993 387865 3872 1.0 3521216 4127129 605913 17.2
TRADE BALANCE -265405 -245049 20356 7.7 -2216970 -2705466 -488496 -22.0
VALUE OF TOTAL GOODS EXPORTS US$000
JAN JAN CHANGE %CHANGE APR-JAN APR-JAN CHANGE %CHANGE2004/2005 2005/2006 2004/2005 2005/2006
O.FOOD 9390 21629 12239 130.3 174992 156155 -18837 -10.81.BEVER. & TOBAC 5712 7810 2098 36.7 54289 68531 14242 26.22.CRUDE MATS 89368 80107 -9261 -10.4 781679 880022 98343 12.63.MINERAL FUELS 47 18542 18495 39351.1 27007 124764 97757 362.04.ANI.& VEG OILS 17 0 -17 -100.0 64 94 30 46.95.CHEMICALS 1511 2480 969 64.1 57277 41886 -15391 -26.96.MANUF. GOODS 592 589 -3 -0.5 8347 9142 795 9.57.MACH.& TRANSP. 1228 1887 659 53.7 16340 15601 -739 -4.58.MISC. MANUF 1410 1225 -185 -13.1 17797 18141 344 1.99.MISC. COMMDS. 0 0 0 0.0 0 0 0 0.0GENERAL MERCHANDISE EXPS. 109275 134269 24994 22.9 1137792 1314336 176544 15.5FREEZONE EXPORTS 3454 2688 -766 -22.2 107860 48733 -59127 -54.8GOODS PROCURED IN PORTS 5859 5859 0 0.0 58594 58594 0 0.0 TOTAL GOODS EXPORTS 118588 142816 24228 20.4 1304246 1421663 117417 9.0
TRADITIONAL & NON-TRADITIONAL EXPORTS US$000
JAN JAN CHANGE %CHANGE APR-JAN APR-JAN CHANGE %CHANGE2004/2005 2005/2006 2004/2005 2005/2006
MAJOR TRAD. EXPORT 89633 90836 1203 1.3 824132 923627 99495 12.1 BAUXITE 9566 8869 -697 -7.3 65841 81903 16062 24.4 ALUMINA 78820 67592 -11228 -14.2 693279 777281 84002 12.1 SUGAR 1247 13421 12174 976.3 56840 58796 1956 3.4 BANANAS 0 954 954 0.0 8172 5647 -2525 -30.9OTHER TRAD. EXPORT 4020 5173 1153 28.7 63020 49544 -13476 -21.4 CITRUS 300 148 -152 -50.7 1249 726 -523 -41.9 COCOA 145 97 -48 -33.1 1769 1017 -752 -42.5 COFFEE 571 686 115 20.1 32233 13569 -18664 -57.9 PIMENTO 160 355 195 100.0 1754 2839 1085 61.9 RUM 2543 3861 1318 51.8 24380 29789 5409 22.2 GYPSUM 301 26 -275 -91.4 1635 1604 -31 -1.9NON-TRAD. EXPORTS 13544 35314 21770 160.7 224737 315639 90902 40.4RE-EXPORTS 2078 2946 868 41.8 25903 25526 -377 -1.5GENERAL MERCHANDISE EXPS. 109275 134269 24994 22.9 1137792 1314336 176544 15.5FREEZONE EXPORTS 3454 2688 -766 -22.2 107860 48733 -59127 -54.8GOODS PROCURED IN PORTS 5859 5859 0 0.0 58594 58594 0 0.0
TOTAL GOODS EXPORTS 118588 142816 24228 20.4 1304246 1421663 117417 9.0
1

VALUE OF GOODS IMPORTS BY S.I.T.C. US$000
JAN JAN 1/ CHANGE %CHANGE APR-JAN APR-JAN 1/ CHANGE %CHANGE2004/2005 2005/2006 2004/2005 2005/2006
0.FOOD 48552 54109 5557 11.4 442620 517281 74661 16.91.BEV. & TOBAC 5387 5120 -267 -5.0 40686 48339 7653 18.82.CRUDE MATS. 6106 5441 -665 -10.9 59651 63782 4131 6.93.MIN.FUEL 102176 110416 8240 8.1 788173 1170030 381857 48.44.ANI & VEG OIL 3850 1399 -2451 -63.7 28969 21004 -7965 -27.55.CHEMICAL 43449 36326 -7123 -16.4 335751 463245 127494 38.06.MANUF. GOOD 51701 45339 -6362 -12.3 503227 523443 20216 4.07.MACH.& TRANSP 73697 74309 612 0.8 751197 740289 -10908 -1.58.MISC.MAN.GOOD 33448 39260 5812 17.4 360166 409715 49549 13.89.MISC. COMMDS. 4592 5578 986 21.5 59203 64368 5165 8.7GENERAL MERCHANDISE IMPORTS 372958 377297 4339 1.2 3369643 4021496 651853 19.3FREEZONE IMPORTS 1677 1210 -467 -27.8 57993 12053 -45940 -79.2GOODS PROCURED IN PORTS 9358 9358 0 0.0 93580 93580 0 0.0 TOTAL GOODS IMPORTS 383993 387865 3872 1.0 3521216 4127129 605913 17.2
1/PROVISIONAL
2

MAJOR TRADITIONALS (VOLUME, VALUE, PRICE)
JAN JAN CHANGE %CHANGE APR-JAN APR-JAN CHANGE %CHANGE2004/2005 2005/2006 2004/2005 2005/2006
BAUXITE Volume ('000 tonnes) 393.0 350.0 -43.0 -11.0 2744.2 3350.6 606.4 22.1 Value (U.S. $000) 9566.0 8869.0 -697.0 -7.3 65841.0 81903.0 16062.0 24.4 Price (US $/tonne) 24.3 25.3 1.0 4.1 24.0 24.4 0.5 1.9
ALUMINA Volume ('000 tonnes) 358.4 273.7 -84.8 -23.6 3362.8 3482.8 120.0 3.6 Value (U.S. $000) 78820.0 67592.0 -11228.0 -14.2 693279.0 777280.8 84001.8 12.1 Price (US $/tonne) 219.9 247.0 27.1 12.3 206.2 223.2 17.0 8.3
SUGAR Volume ('000 tonnes) 2.8 21.0 18.2 644.4 93.4 89.0 -4.4 -4.7 Value (U.S. $000) 1247.0 13421.0 12174.0 976.3 56840.0 58796.0 1956.0 3.4 Price (US $/tonne) 441.7 638.7 196.9 44.6 608.4 660.5 52.1 8.6
BANANAS Volume ('000 tonnes) 0.0 2.7 2.7 - 18.1 14.4 -3.7 -20.5 Value (U.S. $000) 0.0 954.0 954.0 - 8172.0 5647.0 -2525.0 -30.9 Price (US $/tonne) 0.0 353.5 353.5 - 450.8 391.8 -59.0 -13.1
1/PROVISIONAL
External Sector Statistics Unit.2006 May
3

2001 2002IMPORTS 1445.6 1551.2EXPORTS 537.5 551.8
0500
10001500200025003000350040004500
Mill
ions
2004/2005 2005/2006
VALUE OF IMPORTS & EXPORT US$Mn APR - JAN
IMPORTSEXPORTS

GARMENTS EXPORTSUS$Mn.
2005 2006 CHANGE %CHANGE
JANUARY 0.8 0.5 -0.3 -37.5
2004/2005 2005/2006 CHANGE %CHANGE
APRIL 1.2 0.9 -0.3 -25.0 MAY 0.9 0.8 -0.1 -11.1 JUNE 0.8 0.9 0.1 12.5
APRIL-JUNE 2.9 2.6 -0.3 -10.3
JULY 0.8 0.9 0.1 12.5 AUGUST 0.8 0.9 0.1 12.5 SEPTEMBER 0.6 0.9 0.3 50.0
APRIL-SEPT 5.1 5.3 0.2 3.9
OCTOBER 0.9 0.5 -0.4 -44.4 NOVEMBER 1 0.7 -0.3 -30.0 DECEMBER 1.1 0.4 -0.7 -63.6
APRIL-DEC 8.1 6.9 -1.2 -14.8
JANUARY 0.8 0.5 -0.3 -37.5
APRIL-JAN 8.9 7.4 -1.5 -52.3
SOURCE: STATISTICAL INSTITUTE OF JAMAICAEXTERNAL SECTOR STATISTICS2006 May
5

02468
10
Mill
ions
APR-JAN JAN
GARMENTS EXPORT US$Mn APR-JAN
2004/05
2005/06
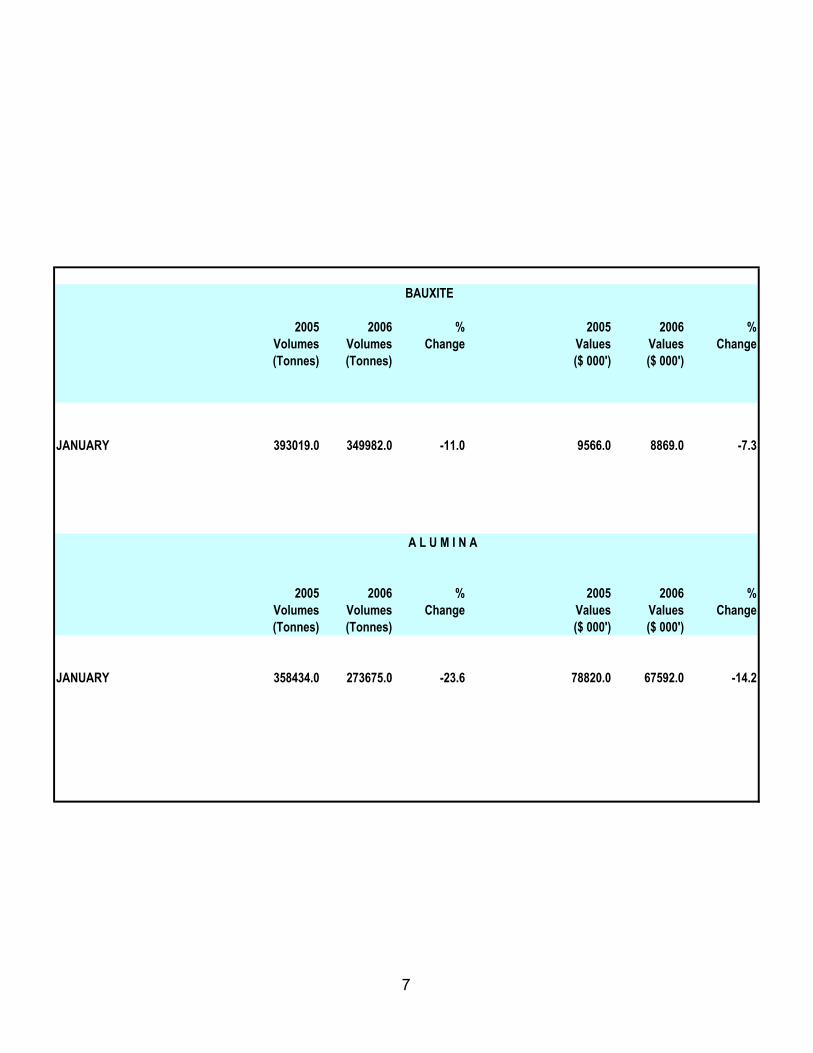
BAUXITE
2005 2006 % 2005 2006 % Volumes Volumes Change Values Values Change (Tonnes) (Tonnes) ($ 000') ($ 000')
JANUARY 393019.0 349982.0 -11.0 9566.0 8869.0 -7.3
A L U M I N A
2005 2006 % 2005 2006 % Volumes Volumes Change Values Values Change (Tonnes) (Tonnes) ($ 000') ($ 000')
JANUARY 358434.0 273675.0 -23.6 78820.0 67592.0 -14.2
7
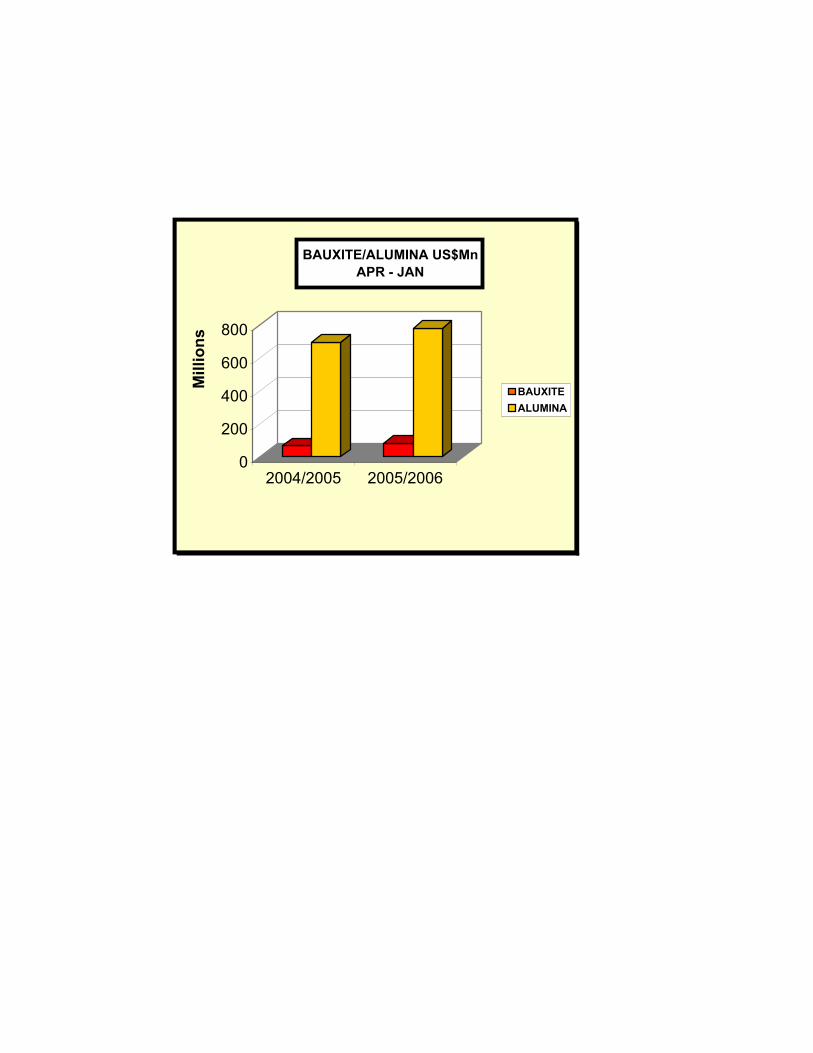
0
200
400
600
800
Mill
ions
2004/2005 2005/2006
BAUXITE/ALUMINA US$Mn APR - JAN
BAUXITEALUMINA
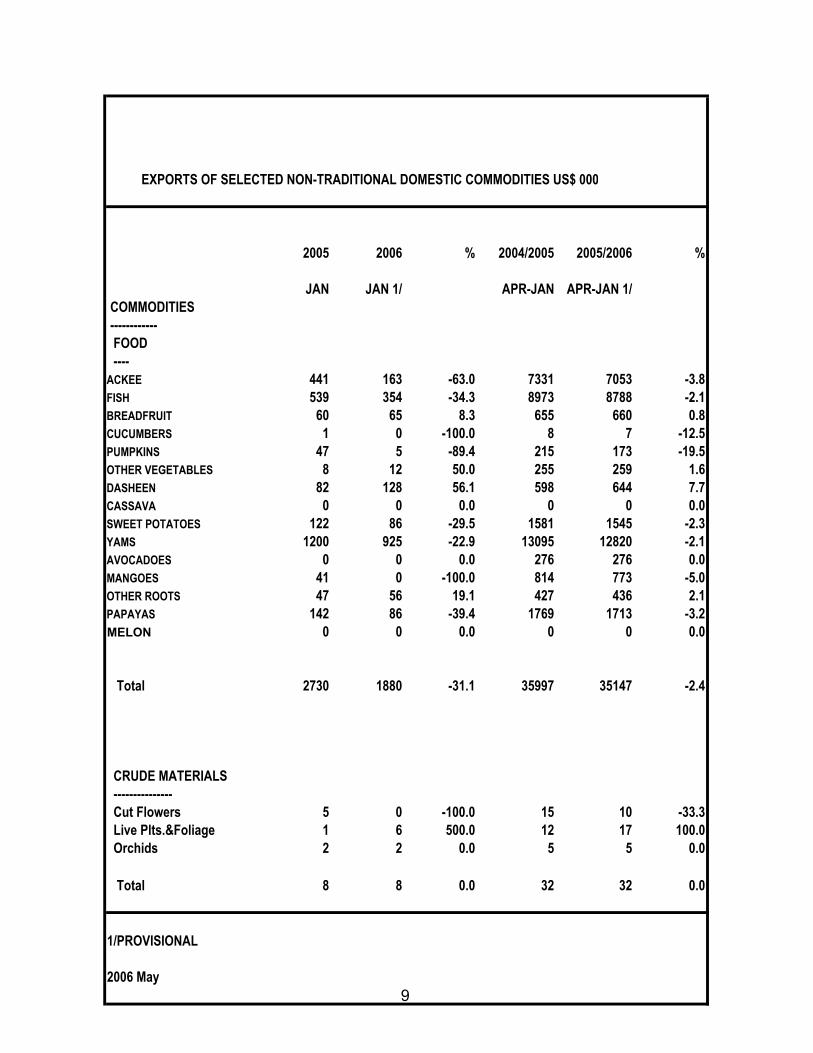
EXPORTS OF SELECTED NON-TRADITIONAL DOMESTIC COMMODITIES US$ 000
2005 2006 % 2004/2005 2005/2006 %
JAN JAN 1/ APR-JAN APR-JAN 1/ COMMODITIES ------------ FOOD ----ACKEE 441 163 -63.0 7331 7053 -3.8FISH 539 354 -34.3 8973 8788 -2.1BREADFRUIT 60 65 8.3 655 660 0.8CUCUMBERS 1 0 -100.0 8 7 -12.5PUMPKINS 47 5 -89.4 215 173 -19.5OTHER VEGETABLES 8 12 50.0 255 259 1.6DASHEEN 82 128 56.1 598 644 7.7CASSAVA 0 0 0.0 0 0 0.0SWEET POTATOES 122 86 -29.5 1581 1545 -2.3YAMS 1200 925 -22.9 13095 12820 -2.1AVOCADOES 0 0 0.0 276 276 0.0MANGOES 41 0 -100.0 814 773 -5.0OTHER ROOTS 47 56 19.1 427 436 2.1PAPAYAS 142 86 -39.4 1769 1713 -3.2MELON 0 0 0.0 0 0 0.0
Total 2730 1880 -31.1 35997 35147 -2.4
CRUDE MATERIALS --------------- Cut Flowers 5 0 -100.0 15 10 -33.3 Live Plts.&Foliage 1 6 500.0 12 17 100.0 Orchids 2 2 0.0 5 5 0.0
Total 8 8 0.0 32 32 0.0
1/PROVISIONAL
2006 May9
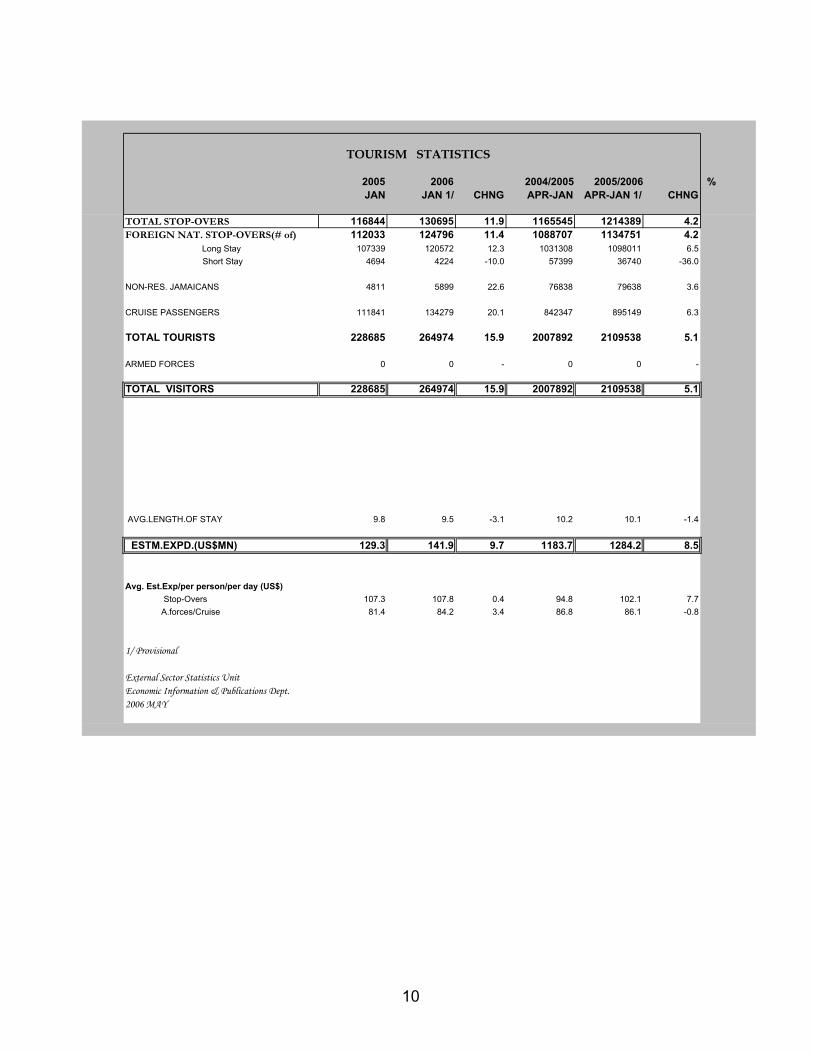
TOURISM STATISTICS
2005 2006 2004/2005 2005/2006 %JAN JAN 1/ CHNG APR-JAN APR-JAN 1/ CHNG
TOTAL STOP-OVERS 116844 130695 11.9 1165545 1214389 4.2FOREIGN NAT. STOP-OVERS(# of) 112033 124796 11.4 1088707 1134751 4.2
Long Stay 107339 120572 12.3 1031308 1098011 6.5 Short Stay 4694 4224 -10.0 57399 36740 -36.0
NON-RES. JAMAICANS 4811 5899 22.6 76838 79638 3.6
CRUISE PASSENGERS 111841 134279 20.1 842347 895149 6.3
TOTAL TOURISTS 228685 264974 15.9 2007892 2109538 5.1
ARMED FORCES 0 0 - 0 0 -
TOTAL VISITORS 228685 264974 15.9 2007892 2109538 5.1
AVG.LENGTH.OF STAY 9.8 9.5 -3.1 10.2 10.1 -1.4
ESTM.EXPD.(US$MN) 129.3 141.9 9.7 1183.7 1284.2 8.5
Avg. Est.Exp/per person/per day (US$) Stop-Overs 107.3 107.8 0.4 94.8 102.1 7.7 A.forces/Cruise 81.4 84.2 3.4 86.8 86.1 -0.8
1/ Provisional
External Sector Statistics UnitEconomic Information & Publications Dept.2006 MAY
10
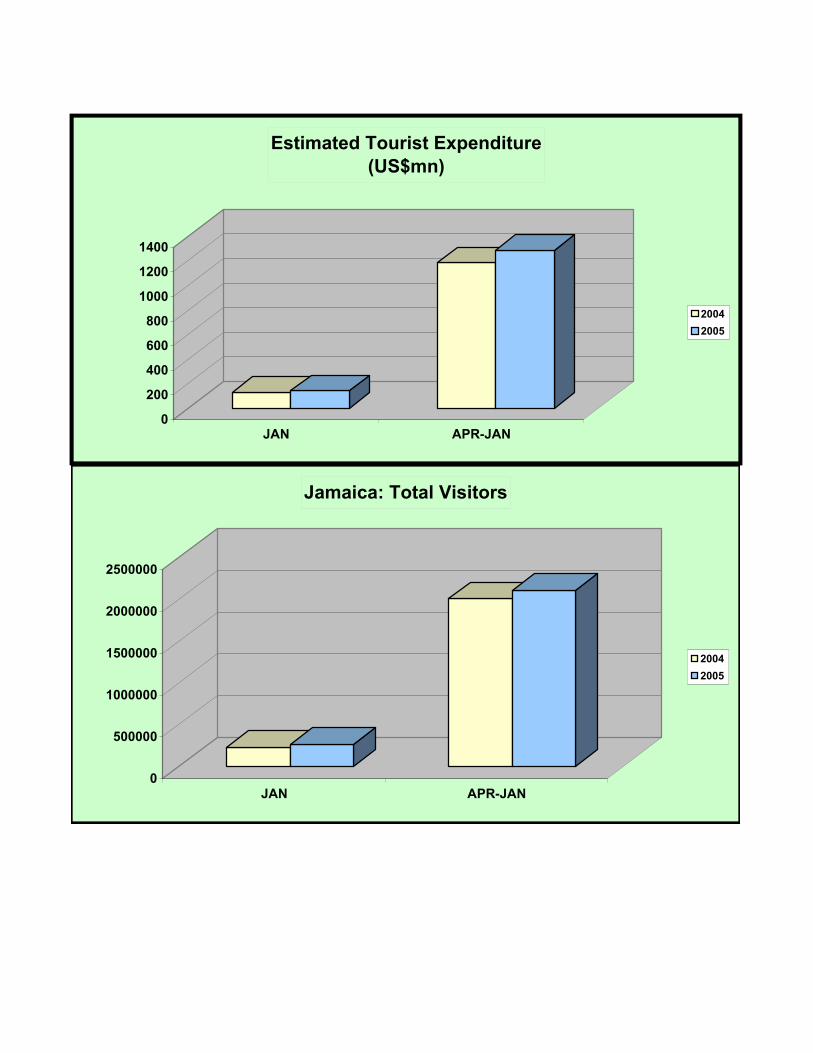
0
200
400
600
800
1000
1200
1400
JAN APR-JAN
Estimated Tourist Expenditure (US$mn)
20042005
0
500000
1000000
1500000
2000000
2500000
JAN APR-JAN
Jamaica: Total Visitors
20042005

32.747.516.83.1
Composition of Visitors January 2005
46.9%
2.1%2.1%
48.9%
For. Nat. Long Stay For. Nat. Short Stay Non-Res. Jamaicans Cruise Passengers
Composition of Visitors January 2006
45.5%
1.6%
2.2%
50.7%
For. Nat. Long Stay For. Nat. Short Stay Non-Res. Jamaicans Cruise Passengers
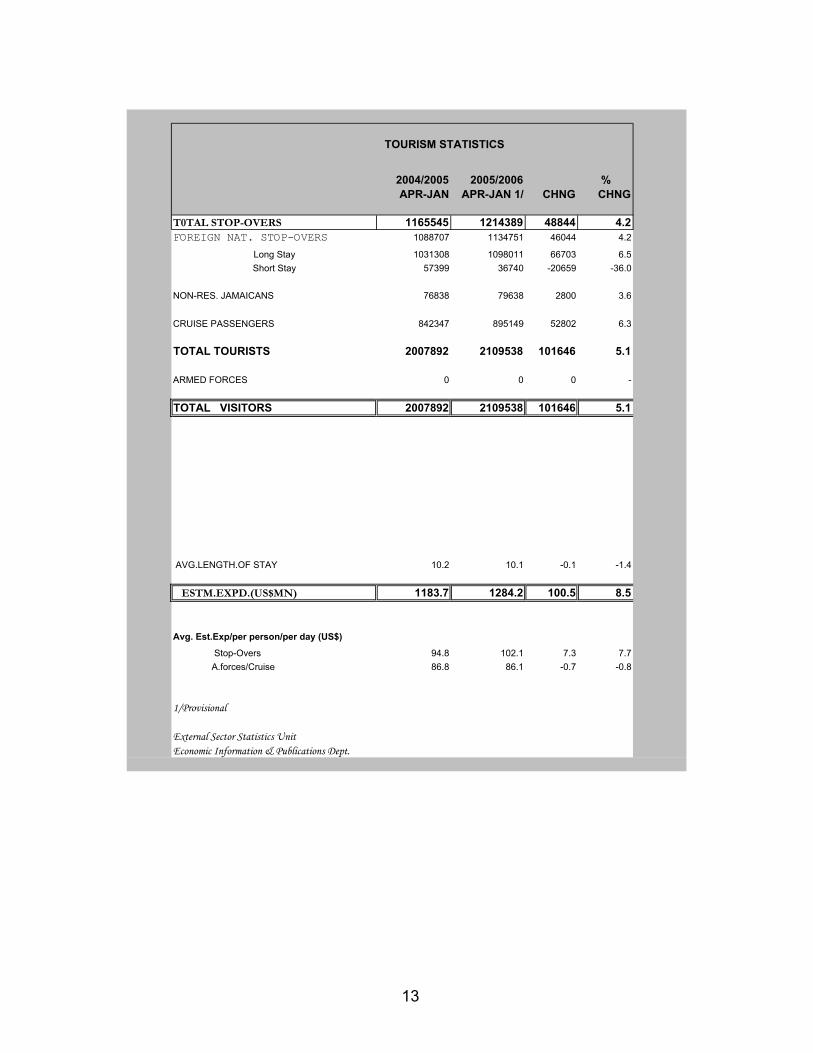
TOURISM STATISTICS
2004/2005 2005/2006 %APR-JAN APR-JAN 1/ CHNG CHNG
T0TAL STOP-OVERS 1165545 1214389 48844 4.2FOREIGN NAT. STOP-OVERS 1088707 1134751 46044 4.2
Long Stay 1031308 1098011 66703 6.5Short Stay 57399 36740 -20659 -36.0
NON-RES. JAMAICANS 76838 79638 2800 3.6
CRUISE PASSENGERS 842347 895149 52802 6.3
TOTAL TOURISTS 2007892 2109538 101646 5.1
ARMED FORCES 0 0 0 -
TOTAL VISITORS 2007892 2109538 101646 5.1
AVG.LENGTH.OF STAY 10.2 10.1 -0.1 -1.4
ESTM.EXPD.(US$MN) 1183.7 1284.2 100.5 8.5
Avg. Est.Exp/per person/per day (US$)
Stop-Overs 94.8 102.1 7.3 7.7 A.forces/Cruise 86.8 86.1 -0.7 -0.8
1/Provisional
External Sector Statistics UnitEconomic Information & Publications Dept.
13

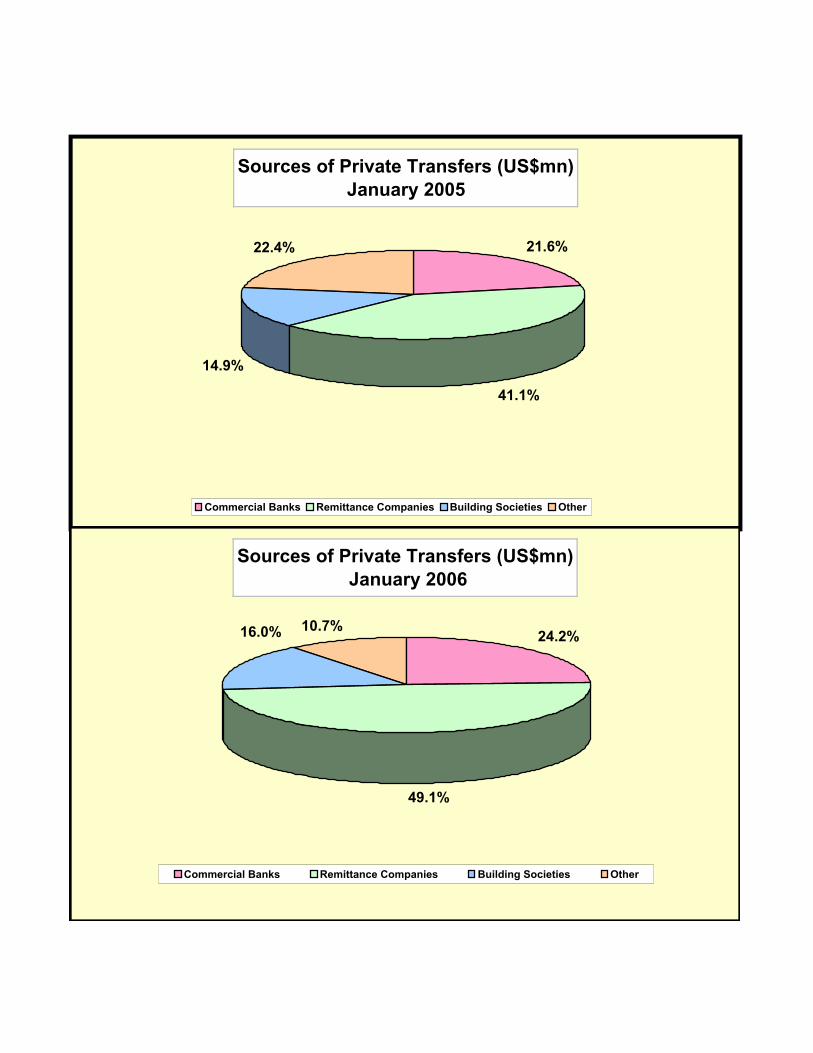
SOURCES OF PRIVATE TRANSFERS(US$Mn)
2005 2006 2004/2005 2005/2006JAN JAN 1/ CHNG %CHNG APR - JAN APR - JAN 1/ CHNG %CHNG
TOTAL INFLOWS 159.85 147.99 -11.86 -7.42 1493.48 1522.64 29.16 1.95
COMMERCIAL BANKS 34.49 35.87 1.38 4.00 299.17 297.97 -1.20 -0.40
REMITTANCE COMPS. 65.74 72.69 6.95 10.57 654.24 813.54 159.31 24.35
POST OFFICE 0.11 0.11 0.00 0.00 1.02 1.03 0.01 0.99
BUILDING SOCIETIES 23.74 23.65 -0.09 -0.40 280.66 253.31 -27.35 -9.74
OTHER 35.77 15.68 -20.09 -56.17 258.40 156.80 -101.60 -39.32
SOURCES OF PRIVATE TRANSFERS (US$Mn)
2004/2005 2005/2006APR - JAN APR - JAN 1/ CHNG %CHNG
TOTAL INFLOWS 1493.48 1522.64 29.16 1.95
COMMERCIAL BANKS 299.17 297.97 -1.20 -0.40
REMITTANCE COMPS. 654.24 813.54 159.31 24.35
POST OFFICE 1.02 1.03 0.01 0.99
BUILDING SOCIETIES 280.66 253.31 -27.35 -9.74
OTHER 258.40 156.80 -101.60 -39.32
14
TRANSFERS
Sources of Private Transfers (US$mn) January 2005
21.6%
41.1%
22.4%
14.9%
Commercial Banks Remittance Companies Building Societies Other
Sources of Private Transfers (US$mn) January 2006
24.2%
49.1%
10.7%16.0%
Commercial Banks Remittance Companies Building Societies Other
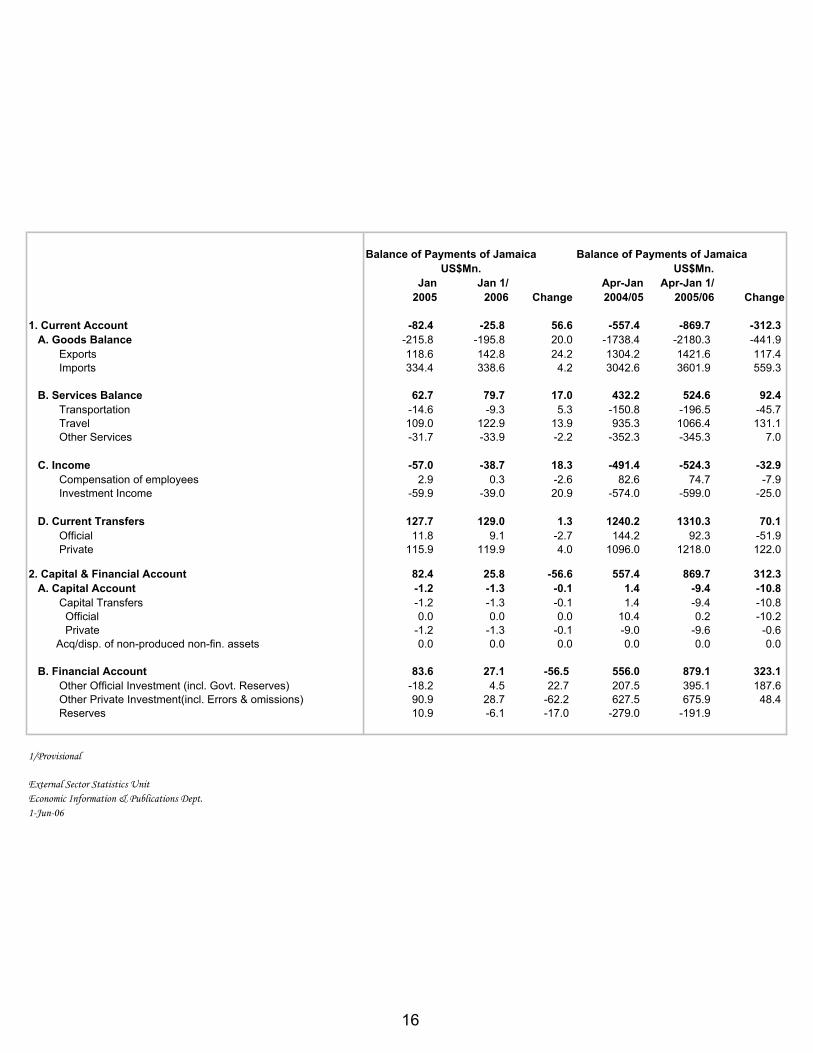
Balance of Payments of Jamaica Balance of Payments of JamaicaUS$Mn. US$Mn.
Jan Jan 1/ Apr-Jan Apr-Jan 1/2005 2006 Change 2004/05 2005/06 Change
1. Current Account -82.4 -25.8 56.6 -557.4 -869.7 -312.3 A. Goods Balance -215.8 -195.8 20.0 -1738.4 -2180.3 -441.9 Exports 118.6 142.8 24.2 1304.2 1421.6 117.4 Imports 334.4 338.6 4.2 3042.6 3601.9 559.3
B. Services Balance 62.7 79.7 17.0 432.2 524.6 92.4 Transportation -14.6 -9.3 5.3 -150.8 -196.5 -45.7 Travel 109.0 122.9 13.9 935.3 1066.4 131.1 Other Services -31.7 -33.9 -2.2 -352.3 -345.3 7.0
C. Income -57.0 -38.7 18.3 -491.4 -524.3 -32.9 Compensation of employees 2.9 0.3 -2.6 82.6 74.7 -7.9 Investment Income -59.9 -39.0 20.9 -574.0 -599.0 -25.0
D. Current Transfers 127.7 129.0 1.3 1240.2 1310.3 70.1 Official 11.8 9.1 -2.7 144.2 92.3 -51.9 Private 115.9 119.9 4.0 1096.0 1218.0 122.0
2. Capital & Financial Account 82.4 25.8 -56.6 557.4 869.7 312.3 A. Capital Account -1.2 -1.3 -0.1 1.4 -9.4 -10.8 Capital Transfers -1.2 -1.3 -0.1 1.4 -9.4 -10.8 Official 0.0 0.0 0.0 10.4 0.2 -10.2 Private -1.2 -1.3 -0.1 -9.0 -9.6 -0.6 Acq/disp. of non-produced non-fin. assets 0.0 0.0 0.0 0.0 0.0 0.0
B. Financial Account 83.6 27.1 -56.5 556.0 879.1 323.1 Other Official Investment (incl. Govt. Reserves) -18.2 4.5 22.7 207.5 395.1 187.6 Other Private Investment(incl. Errors & omissions) 90.9 28.7 -62.2 627.5 675.9 48.4 Reserves 10.9 -6.1 -17.0 -279.0 -191.9
1/Provisional
External Sector Statistics UnitEconomic Information & Publications Dept.1-Jun-06
16

Balance of Payments of Jamaica Balance of Payments of JamaicaUS$Mn. US$Mn.
Jan Jan 1/ Apr-Jan Apr-Jan 1/2005 2006 Change 2004/05 2005/06 Change
Services (Net) 62.7 79.7 17.0 432.2 524.6 92.4 Inflows 204.6 224.1 19.5 1878.2 1987.2 109.0 Outflows 141.9 144.4 2.5 1446.0 1462.6 16.6
Transportation -14.6 -9.3 5.3 -150.8 -196.5 -45.7 Inflows 43.5 50.4 6.9 395.3 401.4 6.1 Outflows 58.1 59.7 1.6 546.1 597.9 51.8
Travel 109.0 122.9 13.9 935.3 1066.4 131.1 Inflows 129.3 141.9 12.6 1183.7 1284.1 100.4 Outflows 20.3 19.0 -1.3 248.4 217.7 -30.7
Other Services -31.7 -33.9 -2.2 -352.3 -345.3 7.0 Inflows 31.8 31.8 0.0 299.2 301.7 2.5 Outflows 63.5 65.7 2.2 651.5 647.0 -4.5
Income (Net) -57.0 -38.7 18.3 -491.4 -524.3 -32.9
Compensation of Employees 2.9 0.3 -2.6 82.6 74.7 -7.9 Inflows 7.8 5.2 -2.6 127.0 123.6 -3.4 Outflows 4.9 4.9 0.0 44.4 48.8 4.4
Investment Income -59.9 -39.0 20.9 -574.0 -599.0 -25.0 Inflows 10.7 13.3 2.6 113.1 136.9 23.8 Outflows 70.6 52.3 -18.3 687.1 735.9 48.8 - Bank of Jamaica 0.0 0.0 0.0 0.2 0.6 0.3 - Government Direct 21.5 21.5 0.1 268.0 306.0 38.0 - Government Guaranteed 0.0 0.0 0.0 1.5 2.3 0.8 - Private 0.0 0.0 0.0 0.0 0.0 0.0 - Direct Investment 37.7 19.3 -18.3 302.4 312.3 9.9 - Other 11.5 11.5 0.0 114.9 114.9 0.0
Current Transfers (Net) 127.7 129.0 1.3 1240.2 1310.4 70.2 Inflows 171.9 157.4 -14.5 1640.6 1618.1 -22.5 Outflows 44.2 28.4 -15.8 400.4 307.8 -92.6
Official 11.8 9.1 -2.7 144.2 92.3 -51.9 Inflows 12.1 9.4 -2.7 147.2 95.3 -51.9 Outflows 0.3 0.3 0.0 3.0 3.0 0.0
Private 115.9 119.9 4.0 1096.0 1218.0 122.0 Inflows 159.8 148.0 -11.8 1493.4 1522.8 29.4 Outflows 43.9 28.1 -15.8 397.4 304.7 -92.7
17

Balance of Payments of Jamaica Balance of Payments of JamaicaUS$Mn. US$Mn.
Jan Jan 1/ Apr-Jan Apr-Jan 1/2005 2006 Change 2004/05 2005/06 Change
Capital & Financial Account (Net) 82.4 25.8 -56.6 557.4 869.8 312.4
Capital Account (Net) -1.2 -1.3 -0.1 1.4 -9.4 -10.8 1. Capital Transfers -1.2 -1.3 -0.1 1.4 -9.4 -10.8 Official 0.0 0.0 0.0 10.4 0.2 -10.2 Inflows 0.0 0.0 0.0 10.4 0.2 -10.2 Outflows 0.0 0.0 0.0 0.0 0.0 0.0
Private -1.2 -1.3 -0.1 -9.0 -9.6 -0.6 Inflows 1.6 1.5 -0.1 19.0 18.4 -0.6 Outflows 2.8 2.8 0.0 28.0 28.0 0.0
2. Acq/disp. of non-produced non-fin. assets 0.0 0.0 0.0 0.0 0.0 0.0 Inflows 0.0 0.0 0.0 0.0 0.0 0.0 Outflows 0.0 0.0 0.0 0.0 0.0 0.0
Financial Account (Net) 83.6 27.1 -56.5 556.0 879.2 323.2
Other Official Investments (incl. Govt. Reserves) -18.2 4.5 22.7 207.5 395.1 187.6 Inflows 1.4 18.1 16.7 650.5 1274.4 623.9 Outflows 19.6 13.6 -6.0 443.0 879.3 436.3
Other Private Investments (incl.errors & omissions) 90.9 28.7 -62.2 627.5 676.0 48.5 Inflows 270.5 230.1 -40.4 2507.5 2851.3 343.8 Outflows 179.6 201.4 21.8 1880.0 2175.4 295.4
Reserves 10.9 -6.1 -17.0 -279.0 -191.9
18

BALANCE OF PAYMENTS OF JAMAICAUS$MN
Nov Nov 1/ Jan-Nov Jan-Nov 1/ Dec Dec 1/ Jan-Dec Jan-Dec 1/ Jan 1/ Jan 1/
2004 2005 Change 2004 2005 Change 2004 2005 Change 2004 2005 Change 2005 2006 Change
1. Current Account -128.9 -95.1 33.8 -518.5 -958.3 -439.8 9.1 -16.2 -25.3 -509.4 -974.5 -465.1 -82.4 -25.8 56.6
A. Goods Balance -230.1 -209.4 20.7 -1766.6 -2373.7 -607.1 -177.9 -213.4 -35.5 -1944.5 -2587.1 -642.6 -215.8 -195.8 20.0
Exports 131.1 148.6 17.5 1455.3 1512.3 57.0 146.3 146.3 0.0 1601.6 1658.6 57.0 118.6 142.8 24.2
Imports 361.2 358.0 -3.2 3221.9 3886.0 664.1 324.2 359.7 35.5 3546.1 4245.7 699.6 334.4 338.6 4.2
B. Services Balance 18.6 44.8 26.2 486.8 561.7 74.9 84.9 108.3 23.4 571.7 670.0 98.3 62.7 79.7 17.0
Transportation -25.5 -21.8 3.7 -139.2 -205.8 -66.6 -11.1 -10.9 0.2 -150.3 -216.7 -66.4 -14.6 -9.3 5.3
Travel 78.0 99.9 21.9 1012.0 1132.8 120.8 139.5 162.9 23.4 1151.5 1295.7 144.2 109.0 122.9 13.9
Other Services -33.9 -33.3 0.6 -386.0 -365.3 20.7 -43.5 -43.7 -0.2 -429.5 -409.0 20.5 -31.7 -33.9 -2.2
C. Income -52.4 -51.1 1.3 -504.8 -562.8 -58.0 -77.9 -74.3 3.6 -582.7 -637.1 -54.4 -57.0 -38.7 18.3
Compensation of employees 14.0 10.8 -3.2 77.3 75.7 -1.6 7.2 5.5 -1.7 84.5 81.2 -3.3 2.9 0.3 -2.6
Investment Income -66.4 -61.9 4.5 -582.1 -638.5 -56.4 -85.1 -79.8 5.3 -667.2 -718.3 -51.1 -59.9 -39.0 20.9
D. Current Transfers 135.0 120.6 -14.4 1266.1 1416.5 150.4 180.0 163.2 -16.8 1446.1 1579.7 133.6 127.7 129.0 1.3
General Government 21.4 9.1 -12.3 137.7 112.1 -25.6 22.2 10.3 -11.9 159.9 122.4 -37.5 11.8 9.1 -2.7
Other Sector 113.6 111.5 -2.1 1128.4 1304.4 176.0 157.8 152.9 -4.9 1286.2 1457.3 171.1 115.9 119.9 4.0
2. Capital & Financial Account 128.9 95.1 -33.8 518.5 958.3 439.8 -9.1 16.2 25.3 509.4 974.5 465.1 82.4 25.8 -56.6
A. Capital Account 0.8 -0.4 -1.2 1.6 -10.3 -11.9 0.6 -0.8 -1.4 2.2 -11.1 -13.3 -1.2 -1.3 -0.1
Capital Transfers 0.8 -0.4 -1.2 1.6 -10.3 -11.9 0.6 -0.8 -1.4 2.2 -11.1 -13.3 -1.2 -1.3 -0.1
General Government 1.2 0.0 -1.2 12.6 0.3 -12.3 1.2 0.0 -1.2 13.8 0.3 -13.5 0.0 0.0 0.0
Other Sector -0.4 -0.4 0.0 -11.0 -10.6 0.4 -0.6 -0.8 -0.2 -11.6 -11.4 0.2 -1.2 -1.3 -0.1
Acq/disp. of non-produced non-fin. assets 0.0 0.0 0.0 0.0 0.0 0.0 0.0 0.0 0.0 0.0 0.0 0.0 0.0 0.0 0.0
B. Financial Account 128.1 95.5 -32.6 516.9 968.6 451.7 -9.7 17.0 26.7 507.2 985.6 478.4 83.6 27.1 -56.5
Official Investment (incl. Govt. Reserves) -23.9 142.4 166.3 509.9 366.7 -143.2 -30.7 -15.2 15.5 479.2 351.5 -127.7 -18.2 4.5 22.7
Central Government -23.9 -18.0 5.9 509.8 128.8 -381.0 -30.7 -26.3 4.5 479.1 102.5 -376.6 -18.2 -9.6 8.6
Other Official Investment 0.0 160.4 160.4 0.1 237.9 237.8 0.0 11.1 11.0 0.1 249.0 248.9 0.0 14.1 14.1
Private Investment (incl.errors & omissions) 141.4 -32.1 -173.5 658.1 837.2 179.1 63.5 25.8 -37.7 721.6 863.0 141.4 90.9 28.7 -62.2
Reserves 10.6 -14.8 -651.1 -235.3 -42.5 6.4 -693.6 -228.9 10.9 -6.1
1/Provisional
19
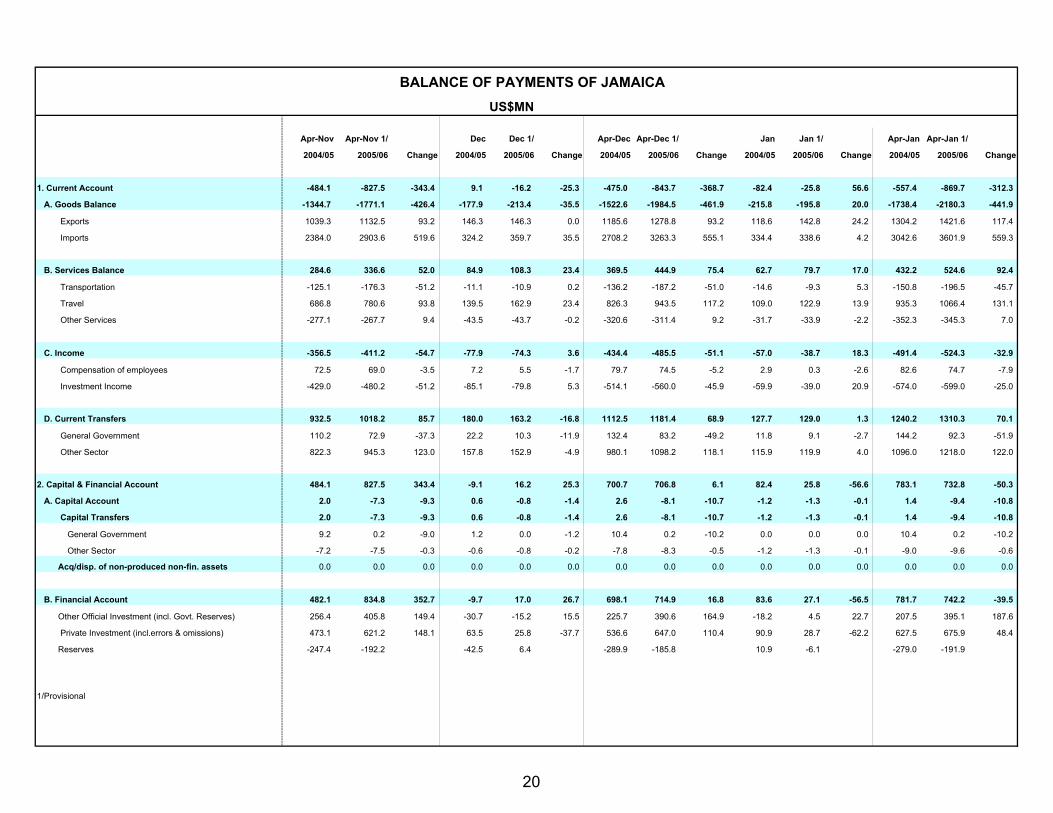
BALANCE OF PAYMENTS OF JAMAICAUS$MN
Apr-Nov Apr-Nov 1/ Dec Dec 1/ Apr-Dec Apr-Dec 1/ Jan Jan 1/ Apr-Jan Apr-Jan 1/
2004/05 2005/06 Change 2004/05 2005/06 Change 2004/05 2005/06 Change 2004/05 2005/06 Change 2004/05 2005/06 Change
1. Current Account -484.1 -827.5 -343.4 9.1 -16.2 -25.3 -475.0 -843.7 -368.7 -82.4 -25.8 56.6 -557.4 -869.7 -312.3
A. Goods Balance -1344.7 -1771.1 -426.4 -177.9 -213.4 -35.5 -1522.6 -1984.5 -461.9 -215.8 -195.8 20.0 -1738.4 -2180.3 -441.9
Exports 1039.3 1132.5 93.2 146.3 146.3 0.0 1185.6 1278.8 93.2 118.6 142.8 24.2 1304.2 1421.6 117.4
Imports 2384.0 2903.6 519.6 324.2 359.7 35.5 2708.2 3263.3 555.1 334.4 338.6 4.2 3042.6 3601.9 559.3
B. Services Balance 284.6 336.6 52.0 84.9 108.3 23.4 369.5 444.9 75.4 62.7 79.7 17.0 432.2 524.6 92.4
Transportation -125.1 -176.3 -51.2 -11.1 -10.9 0.2 -136.2 -187.2 -51.0 -14.6 -9.3 5.3 -150.8 -196.5 -45.7
Travel 686.8 780.6 93.8 139.5 162.9 23.4 826.3 943.5 117.2 109.0 122.9 13.9 935.3 1066.4 131.1
Other Services -277.1 -267.7 9.4 -43.5 -43.7 -0.2 -320.6 -311.4 9.2 -31.7 -33.9 -2.2 -352.3 -345.3 7.0
C. Income -356.5 -411.2 -54.7 -77.9 -74.3 3.6 -434.4 -485.5 -51.1 -57.0 -38.7 18.3 -491.4 -524.3 -32.9
Compensation of employees 72.5 69.0 -3.5 7.2 5.5 -1.7 79.7 74.5 -5.2 2.9 0.3 -2.6 82.6 74.7 -7.9
Investment Income -429.0 -480.2 -51.2 -85.1 -79.8 5.3 -514.1 -560.0 -45.9 -59.9 -39.0 20.9 -574.0 -599.0 -25.0
D. Current Transfers 932.5 1018.2 85.7 180.0 163.2 -16.8 1112.5 1181.4 68.9 127.7 129.0 1.3 1240.2 1310.3 70.1
General Government 110.2 72.9 -37.3 22.2 10.3 -11.9 132.4 83.2 -49.2 11.8 9.1 -2.7 144.2 92.3 -51.9
Other Sector 822.3 945.3 123.0 157.8 152.9 -4.9 980.1 1098.2 118.1 115.9 119.9 4.0 1096.0 1218.0 122.0
2. Capital & Financial Account 484.1 827.5 343.4 -9.1 16.2 25.3 700.7 706.8 6.1 82.4 25.8 -56.6 783.1 732.8 -50.3
A. Capital Account 2.0 -7.3 -9.3 0.6 -0.8 -1.4 2.6 -8.1 -10.7 -1.2 -1.3 -0.1 1.4 -9.4 -10.8
Capital Transfers 2.0 -7.3 -9.3 0.6 -0.8 -1.4 2.6 -8.1 -10.7 -1.2 -1.3 -0.1 1.4 -9.4 -10.8
General Government 9.2 0.2 -9.0 1.2 0.0 -1.2 10.4 0.2 -10.2 0.0 0.0 0.0 10.4 0.2 -10.2
Other Sector -7.2 -7.5 -0.3 -0.6 -0.8 -0.2 -7.8 -8.3 -0.5 -1.2 -1.3 -0.1 -9.0 -9.6 -0.6
Acq/disp. of non-produced non-fin. assets 0.0 0.0 0.0 0.0 0.0 0.0 0.0 0.0 0.0 0.0 0.0 0.0 0.0 0.0 0.0
B. Financial Account 482.1 834.8 352.7 -9.7 17.0 26.7 698.1 714.9 16.8 83.6 27.1 -56.5 781.7 742.2 -39.5
Other Official Investment (incl. Govt. Reserves) 256.4 405.8 149.4 -30.7 -15.2 15.5 225.7 390.6 164.9 -18.2 4.5 22.7 207.5 395.1 187.6
Private Investment (incl.errors & omissions) 473.1 621.2 148.1 63.5 25.8 -37.7 536.6 647.0 110.4 90.9 28.7 -62.2 627.5 675.9 48.4
Reserves -247.4 -192.2 -42.5 6.4 -289.9 -185.8 10.9 -6.1 -279.0 -191.9
1/Provisional
20
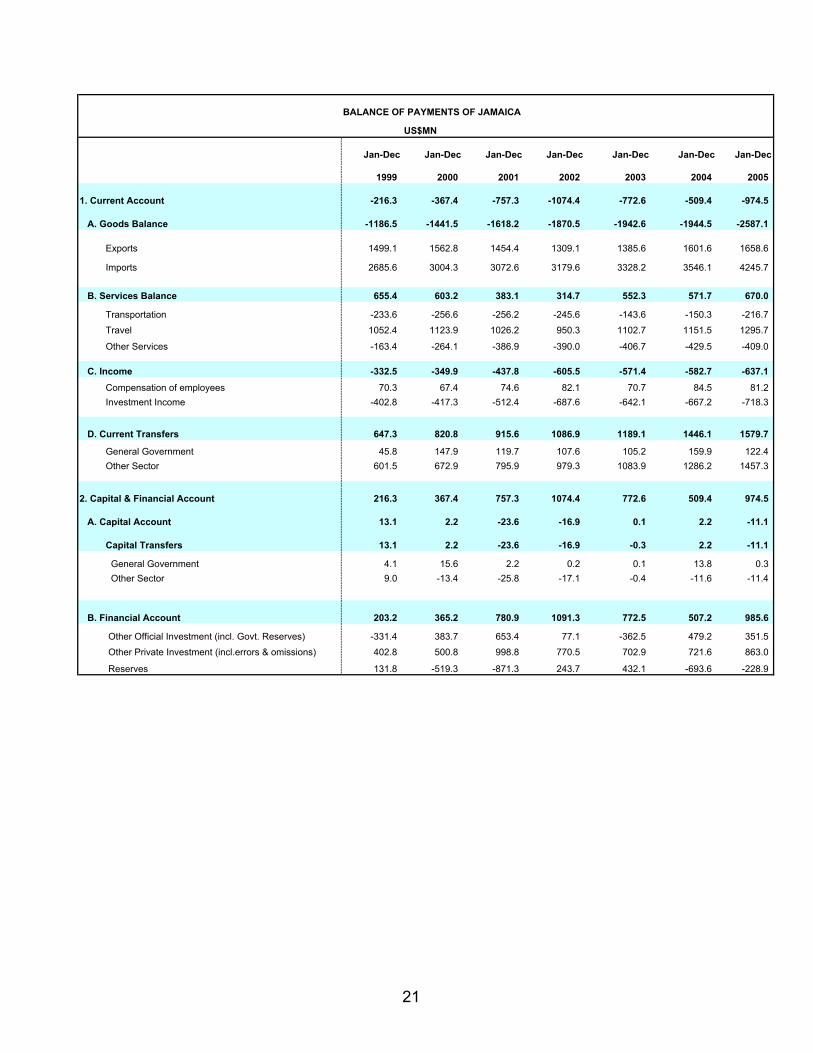
BALANCE OF PAYMENTS OF JAMAICA
US$MN
Jan-Dec Jan-Dec Jan-Dec Jan-Dec Jan-Dec Jan-Dec Jan-Dec
1999 2000 2001 2002 2003 2004 2005
1. Current Account -216.3 -367.4 -757.3 -1074.4 -772.6 -509.4 -974.5
A. Goods Balance -1186.5 -1441.5 -1618.2 -1870.5 -1942.6 -1944.5 -2587.1
Exports 1499.1 1562.8 1454.4 1309.1 1385.6 1601.6 1658.6
Imports 2685.6 3004.3 3072.6 3179.6 3328.2 3546.1 4245.7
B. Services Balance 655.4 603.2 383.1 314.7 552.3 571.7 670.0
Transportation -233.6 -256.6 -256.2 -245.6 -143.6 -150.3 -216.7 Travel 1052.4 1123.9 1026.2 950.3 1102.7 1151.5 1295.7
Other Services -163.4 -264.1 -386.9 -390.0 -406.7 -429.5 -409.0
C. Income -332.5 -349.9 -437.8 -605.5 -571.4 -582.7 -637.1 Compensation of employees 70.3 67.4 74.6 82.1 70.7 84.5 81.2 Investment Income -402.8 -417.3 -512.4 -687.6 -642.1 -667.2 -718.3
D. Current Transfers 647.3 820.8 915.6 1086.9 1189.1 1446.1 1579.7
General Government 45.8 147.9 119.7 107.6 105.2 159.9 122.4 Other Sector 601.5 672.9 795.9 979.3 1083.9 1286.2 1457.3
2. Capital & Financial Account 216.3 367.4 757.3 1074.4 772.6 509.4 974.5
A. Capital Account 13.1 2.2 -23.6 -16.9 0.1 2.2 -11.1
Capital Transfers 13.1 2.2 -23.6 -16.9 -0.3 2.2 -11.1
General Government 4.1 15.6 2.2 0.2 0.1 13.8 0.3 Other Sector 9.0 -13.4 -25.8 -17.1 -0.4 -11.6 -11.4
B. Financial Account 203.2 365.2 780.9 1091.3 772.5 507.2 985.6
Other Official Investment (incl. Govt. Reserves) -331.4 383.7 653.4 77.1 -362.5 479.2 351.5 Other Private Investment (incl.errors & omissions) 402.8 500.8 998.8 770.5 702.9 721.6 863.0
Reserves 131.8 -519.3 -871.3 243.7 432.1 -693.6 -228.9
21

BALANCE OF PAYMENTS OF JAMAICA
US$MN
Apr-Mar Apr-Mar Apr-Mar Apr-Mar Apr-Mar Apr-Mar 1/
1999/00 2000/01 2001/02 2002/03 2003/04 2004/05
1. Current Account -304.1 -497.2 -753.2 -1161.9 -561.9 -605.8
A. Goods Balance -1251.9 -1541.7 -1577.3 -2025.8 -1832.0 -2125.2
Exports 1557.7 1517.7 1423.7 1313.6 1467.4 1565.4
Imports 2809.6 3059.4 3001.0 3339.4 3299.3 3690.6
B. Services Balance 622.4 592.7 323.2 367.8 596.5 594.6
Transportation -244.1 -253.6 -253.7 -226.6 -128.0 -165.7
Travel 1058.3 1149.6 955.6 985.7 1144.6 1178.5
Other Services -191.8 -303.3 -378.7 -391.3 -420.1 -418.2
C. Income -369.5 -382.4 -457.6 -613.0 -565.8 -586.0
Compensation of employees 67.7 67.4 73.4 82.8 71.9 86.4
Investment Income -437.2 -449.8 -531.0 -695.8 -637.6 -672.4
D. Current Transfers 694.9 834.2 958.5 1109.1 1239.4 1510.8
General Government 70.4 141.5 116.5 108.7 106.3 171.6
Other Sector 624.5 692.7 842.0 1000.4 1133.1 1339.2
2. Capital & Financial Account 304.1 497.2 753.2 1161.9 561.9 605.8
A. Capital Account 12.5 -6.7 -24.2 -12.1 0.5 -0.4
Capital Transfers 12.5 -6.7 -24.2 -12.1 0.1 -0.4
General Government 9.0 10.2 0.4 0.2 3.5 10.5
Other Sector 3.5 -16.9 -24.6 -12.3 -3.4 -10.9
B. Financial Account 291.6 503.9 777.4 1174.0 561.4 606.2
Other Official Investment (incl. Govt. Reserves) -123.2 342.0 591.2 -223.3 142.0 186.6
Other Private Investment (incl.errors & omissions) 536.8 744.7 841.6 795.4 648.3 752.6
Reserves -122.0 -582.8 -655.4 601.9 -228.9 -333.0
1/Provisional
22