premium listing segments and information based trading in ... · un experimento natural...
TRANSCRIPT

Consejo latinoamericano de escuelas de administración, cladea 1
academia, revista latinoamericana de administración, 45, 2010, 1-19.Copyright 2010 de Cladea, http://revistaacademia.cladea.org
Premium listing segments and information based trading in Brazil
Segmentos de listaje premium y negociación basada en información en Brasil
Claudio Henrique BarbedoFaculdades iBmec
Eduardo Camilo da Silvauniversidade Federal Fluminense
Ricardo Pereira Câmara Lealinstituto coppead de administração da
universidade Federal do rio de janeiro, Brasil
AbstrAct
Non-traditional listing rules based on corporate governance practices may ensure investors a higher level of protection and reduce expropriation of minority shareholders. We investigate how listing levels that are different according to corporate governance practices, a natural experiment provided by the Brazilian stock exchange (Bovespa), and liquidity levels are associated to the probability of informed trading (PIN) using the number of intraday buy and sell orders. We find that PIN is lower in stricter corporate governance practices listing levels, after controlling for liquidity. Greater liquidity is associated to a lower PIN due, particularly, to the presence of non-informed investors.
Key words: market microstructure, probability of informed trading, corporate governance, Brazil.
resumen
Las normas de listaje no tradicionales basadas en las prácticas de gobierno corpo-rativo pueden garantizar a los inversores un mayor nivel de proteción y reducir la expropiación a los accionistas minoritarios. Se investiga cómo los niveles de listaje, que son diferentes de acuerdo con las prácticas de gobierno corporativo, un experimento natural proporcionado por la Bolsa de Valores de São Paulo (Bovespa), y los niveles de liquidez se asocian a la probabilidad de negocia-

2 Academia, Revista latinoamericana de administración, 45, 2010
Premium listing segments and information based trading in brazil
ción informada (PIN), para lo cual se utiliza el número de órdenes intradía de compra y venta. Encontramos que el PIN es inferior en los niveles de listaje que demandan prácticas más estrictas de gobierno corporativo, después de controlar para la liquidez. La mayor liquidez está asociada a un PIN menor debido, sobre todo, a la presencia de inversores no informados.
Palabras clave: microestructura del mercado, probabilidad de negociación infor-mada, gobierno corporativo, Brasil.
1. IntroductIon
minority shareholder protection is a key issue in any stock market around the world these days, especially in emerging markets. Expropriation of minority shareholders can be accomplished in many ways and apparently is more frequent than one would expect, according to Kraakman et al. (2004). When illegal insider trading goes unpunished, as seems to be the case in most countries in Latin America, insiders may feel at ease to use their privileged information to profit from trading in the market. Bhattacharya and Daouk (2002) provide evidence of the wealth effects of ineffective insider trading law enforcement. Suspicion of this kind of activity by investors causes adverse selection that may lead them to avoid the market or asset due to the fear, completely justified, of entering into bad transactions.
In fact, conflicts of interest, and agency conflicts, occur at several levels: shareholder vs. managers; majority vs. minority shareholders; company vs. creditors; company vs. suppliers, etc. It is very important that companies signal to the market that they are striving to minimize the potential occurrence and the harmful effects of agency conflicts by pledging to uphold certain corporate governance policies and practices.
For each type of relationship, with the potential to generate agency conflicts and expropriation, there are many strategies recommended by several authors, see for example Kraakman et al. (2004), and entities, such as corporate governance practices improvement organizations and multilateral organizations. La Porta, Lopez-de-Silanes, Shleifer & Vishny (2002), Klapper and Love (2004) and Leal and Carvalhal-da-Silva (2007) have demonstrated that markets price the quality of a firm’s corporate governance practices. This may be the reason why firms could be interested to be involved in this costly signaling about their behavior in relation to the best corporate governance practices.
Bovespa, the São Paulo Stock Exchange, has adopted an interesting strategy to deal with this potential costly signaling demand by firms. In 2001, it introduced its Differentiated Corporate Governance Practices Trading Levels, many times called Novo Mercado or New Market. These are premium trading lists with specific disclosure and corporate governance practices requirements beyond what is mandated by corporate law in Brazil. Companies pledge to practice the premium listing requirements by privately contracting with Bovespa. What was very clever about Bovespa’s new market, compared to similar experiences elsewhere, was that existing companies were free to migrate between listings when they wished. Of course,

Consejo latinoamericano de escuelas de administración, cladea 3
barbedo, da silva y leal
new public firms are free to choose their listing segment at the time of their IPO. To make migration easier for existing traditional listing firms, Bovespa created three premium listings. Bovespa’s traditional listing had no listing requirements and no disclosure and corporate governance practices requirements other than those in the corporate law. The three new premium listing segments are Level 1 (L1), that requires mostly additional disclosure, Level 2 (L2), that requires everything in L1 plus an assortment of corporate governance practices, and, finally, the Novo Mercado proper (NM) which is equal to L2 with the additional requirement prohibiting companies from using non-voting shares, that dominated the Brazilian stock market until recently. Table 1 shows a compilation of the requirements of each one of the four listings currently in use at Bovespa.
table 1Bovespa’s listing segments and requirements.
Listing segment main listing requirementsTraditional No listing requirements.Level 1 Preparation of standardized quarterly and consolidated financial statements; elaboration
of a cash flow statement; better disclosure of stock holdings by insiders; publication of an annual calendar of corporate events and the holding of at least one annual meeting with analysts; disclosure of related party transactions and insider trading on stocks; adoption of mechanisms that favor stock dispersion in public issues; and to keep a minimum of 25% of the equity capital free floating in the market.
Level 2 All Level 1 requirements plus: financial statements under the US GAAP or IFRS standards; having a board with least 5 members, 20% of which must be independent, with an unified tenure of up to 2 years; granting non-voting shares voting rights in mergers, acquisitions, and other corporate restructuring transactions as well as in some major related party transactions; adopting a mandatory bidding rule in favor of minority voting shares owners of 100% of the controlling block share price in control transfer transactions and of 80% of such price for non-voting share owners; tender the economic value for all shares when delisting from Level 2 or taking the company private; use Bovespa’s arbitration committee to solve shareholder conflicts.
New market All Level 2 requirements plus having only voting shares in the equity capital
At the beginning of 2007, Bovespa’s new market initiative was already a success. There were no IPOs first listings at the traditional segment of the market anymore. Many companies migrated to L1, L2 or Nm and these new listings now correspond to most of the trading, largely due to L1. The three premium listings reached 100 companies, about a quarter of the number of companies listed. At the same time, of its approximate US$ 2.2 billion daily trading volume, L1 corresponded to about 40%, Nm to approximately 20%, and L2 to 5%, leaving the traditional listing and its 300 or so firms in the 35% of total trading volume. On February 28, 2007 Bovespa had 399 listed firms, of which 51 were listed at the NM, 14 at L2, 36 at L1, and 298 in the traditional listing. Analysts believe that the pressure is now on the traditional listing companies to join. The traditional listing may eventually evolve into a segment of the

4 Academia, Revista latinoamericana de administración, 45, 2010
Premium listing segments and information based trading in brazil
market tainted by a bad reputation of not practicing good disclosure and corporate governance practices and of showing relatively low average liquidity.
Some studies have investigated corporate governance practices in Brazil. De Carvalho and Pennacchi (2007) studied migration to Bovespa’s new market and report positive and significant abnormal returns on the new listing segment joining day. They also report greater liquidity and potentially lower control premiums. Carvalhal-da-Silva and Subrahmanyan (2007) related lower control premiums to better corporate governance practices measured by a broad index of such practices. Leal and Carvalhal-da-Silva (2007) report on the positive impact of an improvement of corporate governance practices on the market value of Brazilian companies.
Premium listings based on corporate governance practices may foster investor confidence when trading as well. Investors may feel that there is a lower likelihood that they are at the other end of an insider initiated transaction in which they may end up losing money due to information asymmetry.
Previous works on the benefits of better corporate governance in emerging markets have concentrated on broad corporate governance practices indexes, such as the metrics found in Klapper and Love (2004) for several emerging markets and Leal and Carvalhal-da-Silva (2007) for Brazil, among many others. Others have concentrated on ownership and control concentration measures and non-management blockholders, such as Lins (2003), for many emerging markets. In general, these papers favor the notion of causality from governance practices to value. Corporate governance practices indexes are based on the presence or absence of specific practices or rules, such as board composition and voting rights for minority shareholders. Despite their utility as indicators of the level of protection that an investor enjoys at the firm level, they cannot offer an objective measure of the probability of being expropriated. In other words, corporate governance indices do not offer a measure of prevention of investor’s wealth expropriation. Besides, although the company declares to abide by these practices, we don’t really know objectively if its insiders do.
If we consider that the occurrence of agency conflicts such as the inappropriate execution and timing of insider trading cannot be identified ex-post by the metrics of those indices and that corporate governance practices identified in those indices cannot necessarily prevent insiders from performing inappropriate insider trading, one can raise the question if these governance practices effectively prevent insiders from behaving in such a manner.
Created by Easley, Kiefer, O’Hara and Paperman (1996), the Probability of Information-based Trading (PIN) intends to measure (ex-post) the probability that transactions based on insider information occurred. Cruces and Kawamura (2007) suggest that PIN can be used to proxy for the quality of corporate governance practices at the firm level and analyze ADR trading from seven Latin American stock markets, including Brazil. Barbedo, Camilo-da-Silva and Leal (2009) use PIN as a proxy for corporate governance practices in Brazil. The authors find that, from 2001 to 2006, PIN is lower for firms that adopt higher corporate governance practices, after controlling for liquidity. Easley, O’Hara and Paperman (1998) and Easley, O’Hara and Saar (2001) are examples of other applications of PIN.
Is this work, we seize the opportunity to measure the PIN in this unique institutional feature presented by the choice of listing Bovespa offers to all firms, listed or not to-be-listed,

Consejo latinoamericano de escuelas de administración, cladea 5
barbedo, da silva y leal
to join one of its four listing requirement sets: no requirement (traditional listing); mostly disclosure requirements (L1); L1 plus better corporate governance practices requirements (L2); and L2 with the banning of non-voting shares (Nm). We follow the Cruces and Kawamura (2007) in analyzing whether PIN is related to corporate governance practices.
We have used PIN to compare stocks in each one of the four lists. We suppose that lists with more demanding corporate governance and disclosure requirements will show lower PINs than inferior demand lists. Our results, within similar liquidity levels, confirm this hypothesis. Comparing traditional to L1 stocks, two lists with similar liquidity levels, L1 stocks show a smaller PIN. Between L2 and Nm stocks, which have similar liquidity levels between themselves, Nm stocks present the smaller PIN. moreover, the more liquid stock lists (traditional and L1) boast lower PINs than the less liquid lists (L2 and Nm) because these count on less non-informed traders. If L2 and Nm liquidity rises by about 25%, their PIN would decrease to the level of the more liquid stock lists. We also show that as the liquidity in the Brazilian market increases, the PIN decreases in the four listing segments.
This paper is organized as follows. We show the PIN model used in this study in Section 2. Section 3 describes the sample and presents the results and Section 4 concludes the paper.
2. ProbAbILIty of Informed trAdIng (PIn)
Easley et al. (1996) model the probability of informed trading (PIN) based on sequential market trading. Buy and sell trades originate from potentially informed or uninformed traders. Prices are provided by a risk neutral market maker. An information based trade, in this case, is defined as a signal that can be translated into some degree of private knowledge about the true value of the asset. The model assumes that this signal results from insider information.
Using Easley et al. (1996) notation, suppose that at the beginning of a trading day private information reaches the market (an information event) with probability α. In this case, the information signal can be low (bad news) with probability δ or high (good news) with probability (1 - δ). The asset is then traded between informed and uninformed traders and at the end of the day its full information value is realized. The advent of an information event and its good or bad nature occurs only once per day. Uninformed traders arrive to the market according to independent Poisson processes. Uninformed traders do not monitor information signals and trade independently of any information event, so they can participate on the buy side or on the sell side of the market with an arrival rate of ε. The model assumes equal proportions of uninformed buyers and sellers. Easley et al. (1996) tested for different proportions and found no significant impact on their model. On the other hand, informed traders orders are based on the existence and type of information event they identified. They trade only on the days when an information event occurred and only on one side of the market. If the information sign is low, they sell, otherwise they buy. The arrival rate of informed traders is denoted by m. Figure 1 provides a graphical illustration of this trading process and is reproduced from Easley et al. (1996, p. 1409).

6 Academia, Revista latinoamericana de administración, 45, 2010
Premium listing segments and information based trading in brazil
figure 1the easley et al. (1996) model of private information trading.
The model assumes that more buy orders are expected on good event days, more sell orders are expected on bad event days, and fewer trades are expected on no information event days as there are no informed traders in the market. The imbalance in the buy and sell orders arise from the arrival of informed traders who participate only on one side of the market. This indicates information based trading. The parameters θ = (α, δ, ε, µ) are obviously not directly observable, however, as the order arrival processes of buys and sells are, the authors propose, a likelihood function of θ based on the daily number of buys (B) and sells (S). Buy and sell orders follow one of three independent Poisson processes, depending on whether there is a good, a bad, or no event day. As we do not know which process is operating on any given day, the likelihood is computed as a weighted average of the probability of observing a particular number of buy and sell orders on a bad, good, and no event day. These weights are probabilities given by (1 - α) for no event days, αδ for bad event days, and α(1 - δ) for good event days. The likelihood function for a specified stock is given by:
Consejo latinoamericano de escuelas de administración, cladea 7
barbedo, da silva y leal
l B s
e tB
e ts
tB
i
ts
i
i i
( , , , , )
( )!
( )!
m
=
-( )é
ëêê
ù
ûúú
+
- -1
ee tB
et
s
e
tB
i
ts
i
i i
- - +
- +
+[ ]é
ë
êêê
ù
û
úúú
+ -( )
m
m
m
( )!
( )!
( )
(1 )) ( )!
( )!
tB
i
ts
i
tB
e ts
i im +[ ]é
ë
êêê
ù
û
úúú
ì
í
ïïïïïïïïïïï
î
ïïïïï-
ïïïïïïï
ü
ý
ïïïïïïïïïïï
þ
ïïïïïïïïïïï
=Õi
i
1
(1)
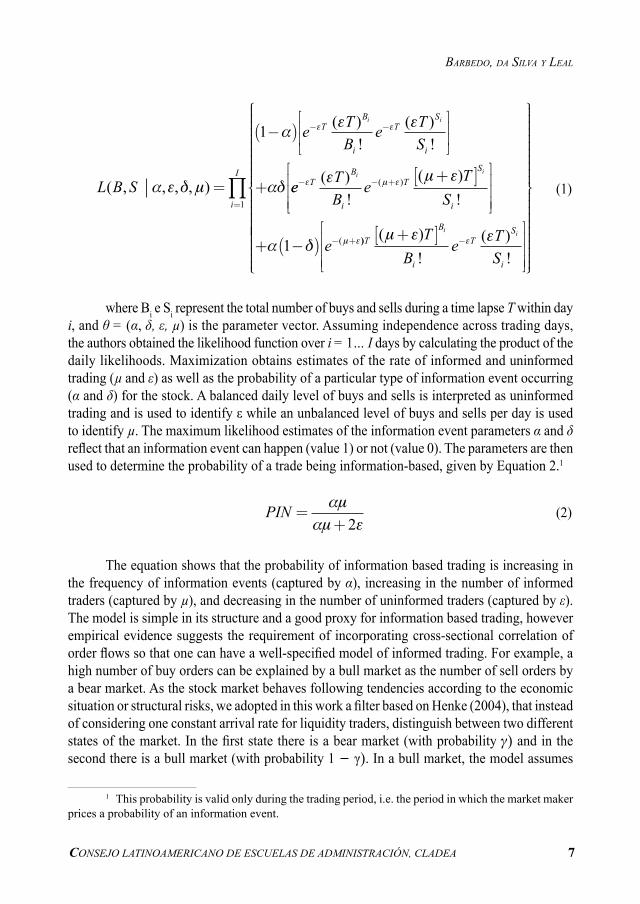
where Bi e Si represent the total number of buys and sells during a time lapse t within day i, and θ = (α, δ, ε, µ) is the parameter vector. Assuming independence across trading days, the authors obtained the likelihood function over i = 1… i days by calculating the product of the daily likelihoods. maximization obtains estimates of the rate of informed and uninformed trading (µ and ε) as well as the probability of a particular type of information event occurring (α and δ) for the stock. A balanced daily level of buys and sells is interpreted as uninformed trading and is used to identify ε while an unbalanced level of buys and sells per day is used to identify µ. The maximum likelihood estimates of the information event parameters α and δ reflect that an information event can happen (value 1) or not (value 0). The parameters are then used to determine the probability of a trade being information-based, given by Equation 2.1
Pin =
+m
m 2 (2)
The equation shows that the probability of information based trading is increasing in the frequency of information events (captured by α), increasing in the number of informed traders (captured by µ), and decreasing in the number of uninformed traders (captured by ε). The model is simple in its structure and a good proxy for information based trading, however empirical evidence suggests the requirement of incorporating cross-sectional correlation of order flows so that one can have a well-specified model of informed trading. For example, a high number of buy orders can be explained by a bull market as the number of sell orders by a bear market. As the stock market behaves following tendencies according to the economic situation or structural risks, we adopted in this work a filter based on Henke (2004), that instead of considering one constant arrival rate for liquidity traders, distinguish between two different states of the market. In the first state there is a bear market (with probability g) and in the second there is a bull market (with probability 1 - γ). In a bull market, the model assumes
1 This probability is valid only during the trading period, i.e. the period in which the market maker prices a probability of an information event.

8 Academia, Revista latinoamericana de administración, 45, 2010
Premium listing segments and information based trading in brazil
additional buy and sell orders and liquidity traders arrive with rate j. We use the daily number of buys and sells of that stock as the input variables to estimate the parameters for the stock. To obtain estimates of g and j, we aggregate the daily number of buy and sell orders of in the stock market index. The new likelihood function is given by Equation 3:
l B s
e tB
t
i i
tB
i
si i
( , )
( )
[ ( )]!
[ ( )]( ( ))
, g
g
=
-
-( ) + +- +
1
1 2
ss
e tB
ts
i
tB
i
s
i
i i
!
( ( ))!
( )!
( ( ) )
é
ëêê
ù
ûúú +
+ + +[ ]é
ë
- + + m m2êê
êê
ù
û
úúú+
-( )+ +[ ] +é
- + + m m1 2e
tB
ts
tB
i
s
i
i i( ( ) ) ( )
![( ) ]
!ëë
êêê
ù
û
úúú
ì
í
ïïïïïïïïïïï
î
ïïïïïïïïïïï
ü
ý
ïïïïïïïïïïï
þ
ïïïïïïïïïïïï+
-( )é
ëêê
ù
ûúú +
- - -g
1 e t
Be t
se t
Bt
B
i
ts
i
tBi i i( )
!( )
!( )
ii
ts
i
t
et
s
e
i
!( )
!( )
( )
- +
- +
+[ ]é
ë
êêê
ù
û
úúú
ìíïïï
îïïï
+ -( )
m
m
m
1(( )
!( )
!m +[ ]é
ë
êêê
ù
û
úúú
üýïïï
þïïï
ì
í
ïïïïïïïïïï
-tB
e ts
B
i
ts
i
i i
ïïïïïïïïïïïïï
î
ïïïïïïïïïïïïïïïïïïïïïï
ü
ý
ïïïïïïïïïïïïïïïïïïïïïïï
þ
ïïïïïïïïïïïïïïïïïïïïïï
=Õi
i
1
(3)
The new probability of a trade being information-based decreases in j and is given by:
))1((2
−++=PI
(4)
3. sAmPLe And resuLts
Buy and sell orders were obtained from Bovespa’s intraday database, which includes the time stamp (hour, minute and second) of each trade up to the millionth of a second and an individual code for each order. We also had a list of actual transactions containing the code for the buy and sell offers involved. As a result, we have 100% certainty that we correctly identified transactions as either buy or sell. Based on the trade time, we also identified each particular trade as arising from a buyer or a seller. Thus, we created a database of the number of buyer-initiated and seller-initiated trades during each day between January 2, 2001 and April 1, 2009. The data are 100% reliable and not artificially estimated with standard tick tests. Previous works in the US have used the Lee and Ready (1991) technique of identifying trades as a buy or a sell based on the price being above or below the bid-ask spread midpoint and cannot provide 100% certainty about the correct trade classification.

Consejo latinoamericano de escuelas de administración, cladea 9
barbedo, da silva y leal
We selected a sample of 48 stocks from those listed in each one of Bovespa’s listing segments (L1, L2, NM, and Traditional), 12 per segment. Within each 12-stock group, there are six very liquid and six less liquid stocks. The aim was to build one portfolio for each listing segment with differentiated liquidity levels and, because of the huge size of the intraday dataset, we had to limit the number of stocks.2
Table 2 presents the sampled firms and their liquidity index computed by Bovespa. A liquidity index of 0.10 means that the company corresponded, at best, to 0.10% of the market’s total trading volume in the case that it traded on every trading day. The average liquidity index of the most liquid stocks in all market segments (2.1851) is substantially greater than the average of the less liquid ones (0.0369) considering all listing segments. The average liquidity index of the 12 stocks sampled from the traditional listing segment (2.0922) is not significantly different (p-value of 0.6111 in a two-sided t-test) from those of the 12 L1 stocks (1.6313). The average liquidity index of the 12 stocks sampled from L2 (0.4033) is not significantly different (p-value of 0.5617 in a two-sided t-test) from those of the 12 NM stocks (0.3172). The average liquidity index of the 12 stocks for all remaining pairs of listing segments are statistically different. Thus, in the analysis which follows we only compare PIN of listing segments of similar liquidity levels because liquidity is a strong determinant of PIN. We will compare the PIN of the traditional listings only with that of L1 listings and we will compare the PIN of the L2 listings only with that of Nm listings.
Table 2 deserves some additional comments before we proceed. From previous research we should expect that liquidity levels are greater as we move from the least demanding listing level (traditional) to the most demanding listing level (NM). The average liquidity of the least liquid stocks in Table 2 behaves as expected. It goes from 0.0743 in NM, to 0.0541 in L2, to 0.0118 in L1, and to 0.0073 in the traditional listing segment. The anomaly in Table 2 is the greater liquidity levels of the most liquid stocks in the traditional and the L1 listings. The average liquidity for the most liquid stocks in L1 and in the traditional listings are greater than those in the L2 and Nm listings.
table 2 Sampled firms and their listing segment: Traditional, New Market, Level 1 and Level2
with the corresponding liquidity index.firm class Liquidity firm class Liquidity
Traditional listing 6 most liquid stocks Level 1 6 most liquid stocksPetrobras PN 9.6071 Vale Rio Doce PNA 6.7681Telemar Par PN 4.6248 Bradesco PN 3.6033Usiminas PNA 3.8601 Itaú Hold. PN 2.6651Sid Nacional ON 2.6765 Gerdau PN 2.4872Caemi PN 2.4517 Braskem PNA 2.1819Eletrobras PNB 1.8425 Cemig PN 1.7788Average 4,177 Average 3,251
2 For each month, we had about 1.000.000 records of buy and sell orders.

10 Academia, Revista latinoamericana de administración, 45, 2010
Premium listing segments and information based trading in brazil
table 2 (continued)Sampled firms and their listing segment: Traditional, New Market, Level 1 and
level2 with the corresponding liquidity index.Traditional listing 6 least liquid stocks Level 1 6 least liquid stocks
Telefônica Hold. PN 0.0078 Unibanco ON 0.0190Petroq. União PN 0.0076 Itausa ON 0.0160Tele Norte Cel. ON 0.0073 Unibanco PN 0.0133F Cataguazes PNA 0.0072 mangels PN 0.0081m&G Poliest ON 0.0071 Aracruz ON 0.0075Tele Sudeste Cel. ON 0.0067 Braskem ON 0.0071Average 0,007 Average 0,012
New Market 6 most liquid stocks Level 2 6 most liquid stocksCCR Rodovias ON 0.7965 Net PN 1.8680Sabesp ON 0.6432 Celesc PNB 0.6010Natura ON 0.5891 TAM PN 0.5502Light ON 0.5242 ALL A. Latina UNT 0.5145Perdigão PN 0.4963 Gol PN 0.4661Cosan ON 0.4322 Eletropaulo PN 0.3936Average 0,580 Average 0,732
New Market 6 least liquid stocks Level 2 6 least liquid stocksPorto Seguro ON 0.1372 UOL PN 0.1545Gafisa ON 0.0822 marcopolo PN 0.1049Copasa mG ON 0.0504 Eternit ON 0.0813Company ON 0.0238 Saraiva Livr PN 0.0507Totvs ON 0.0217 Vivax UNT 0.0426American Banknote ON 0.0095 Equatorial UNT 0.0116Average 0,054 Average 0,074note: (1) stock classes are either voting common shares (ON), non voting shares (PN, PNA or PNB), or units (UNT) which are a certificate that may be a combination of voting and non voting shares. (2) the liquidity index is computed for the January 2, 2001 through April 30, 2006 period as: 100 x p/P x (n/N x v/V)1/2 where p is the number of days in which there was at least one trade on the stock in the period; P is the total number of days in the period; n is the number of trades on the stock in the period; n is the total number of trades in the market in the period; v is the volume traded on the stock in the period; and v is the total market trading volume in the period.
Liquidity is obviously and by construction a major determinant of PIN. That is why our research design was based on a sample of the six most and the six least liquid stocks in each segment. The determinants of PIN are the arrival ratios of informed versus uninformed traders and the probability of an information event. These variables are clearly related to liquidity. Besides what is expected from the findings in previous research, a priori, one could expect liquidity to be lower in the traditional listing than in all premium listings because all premium listings require a minimum of 25% of free floating shares of their listed companies. One could also expect that greater share dispersion and better corporate governance practices could have a positive effect over liquidity as more uninformed investors would feel confident to trade in stocks with supposedly better corporate governance practices. However, premium listings are recent, with trading picking up from 2002 and IPO listings beginning only in 2004. Thus, many very large companies remained in the traditional listing or migrated to L1 only, especially those that list ADRs in the US. many of these companies, some of them among

Consejo latinoamericano de escuelas de administración, cladea 11
barbedo, da silva y leal
the largest companies in the world, such as Petrobras and CVRD (Vale), and the two largest private banks in Brazil (Bradesco and Itaú Holding) saw no advantage to migrate beyond L1 until June 2006. Besides being subjected to the US laws through their ADR listings, some of them are already heavily regulated, such as the banks, and all of them have a very large number of non-voting stocks outstanding, in fact, in 11 out of the 12 most liquid stocks in the traditional and the L1 listing segments are non-voting. The problem of controlling shareholder dilution in the conversion of all non-voting shares to voting shares will prevent migration to Nm for a long time. Regarding migration to L2, these companies certainly already meet many of the demands of this listing level, such as the use of international accounting standards, but other demands, such as submission to an arbitration court and the mandatory bidding rules for minority voting and the non-voting shareholders, may not be in the best interest of the controlling shareholders of those companies yet. Because these companies are very large and have no external financing difficulties, we believe that this anomaly will remain for a while. L2 and NM companies are mostly news listings while most L1 and Traditional listings have been around for a long time. The market is at a transition phase and this is the most likely explanation for what is seen in Table 2.
The PIN parameters are estimated by maximization of the likelihood function in Equations 1 and 2. The parameters α and δ are restricted to [0,1] and μ and ε are restricted to [0,∞]. The likelihood function was maximized in a program procedure of S-Plus. The results are presented in Table 3.
Our hypothesis is that PIN will be greater in the least demanding listing segment, controlling for liquidity. Thus, we must only compare listing segments of similar liquidity levels. The less demanding traditional listing segment will be compared only to the more demanding L1 listing segment. In their turn, the less demanding L2 will be compared only to the more demanding NM. Traditional listing stocks present the lowest average probability of informed trading (0.0803), followed by L1 (0.0844), NM (0.1167), and L2 (0.1317). We confirm our hypothesis for the L2/NM pair. PIN in the more demanding NM listing segment is lower than PIN in the less demanding, but as liquid, L2 listing segment. In contrast, our hypothesis is not confirmed for the traditional/L1 pair. PIN in the less demanding traditional listing segment is slightly lower than PIN in the more demanding, but as liquid, L1 listing segment. It could be that this result is time-dependent. Figure 2 shows the time-varying behavior of PIN for successive periods of 60 days using the Easley et al. (1996) method. The traditional listing PIN may be higher or lower than the PIN of the L1 listing segment PIN depending on the period. Likewise, the L2 listing PIN may be higher or lower than the PIN of the Nm listing segment PIN depending on the period. These results suggest that firms in the traditional listing segments, particularly the very large ones, may show a probability of an information event and uninformed traders rate that influence with their lower PIN. Overall, these results do not lend strong support to our hypothesis that PIN is lower in listing segments that demand better corporate governance and disclosure practices, although we observe that PIN decreases as liquidity in Brazilian stock exchange increases. It is also possible that our PIN calculation needs to be adjusted for the simultaneous overall market movements. Before we proceed to do that we must note some additional findings in Table 3.

12 Academia, Revista latinoamericana de administración, 45, 2010
Premium listing segments and information based trading in brazil
table 3 Probability of Informed Trading Statistics (computed as Easley et al) of 12-stock
portfolios in the Level 1 (L1), Level 2 (L2), New Market (NM) and Traditional (Trad) lists. P-Values reports Kruskal-Wallis test results to verify the null hypothesis
of simultaneously similar distribution functions for the parameters in each listing segment.
α (Probability of an information event)
statistic trad L1 L2 nmAverage 0,376 0,305 0,463 0,428median 0,270 0,294 0,422 0,379maximum 0,716 0,552 0,779 0,920minimum 0,073 0,077 0,220 0,148St. Dev. 0,352 0,140 0,210 0,2171st Quart. 0,272 0,275 0,403 0,3643rd Quart. 0,423 0,448 0,630 0,490
Kruskal-Wallis test p-value 0.0000
δ (probability of a bad new information)
Average 0,374 0,300 0,349 0,432median 0,356 0,290 0,368 0,415maximum 0,703 0,648 0,612 0,692minimum 0,135 0,084 0,197 0,189St. Dev. 0,165 0,197 0,155 0,1471st Quart. 0,270 0,192 0,283 0,3943rd Quart. 0,511 0,447 0,499 0,576
Kruskal-Wallis test p-value 0.1134
µ (Informed traders rate)
Average 32,907 31,038 36,067 31,882median 36,256 31,835 35,684 36,365maximum 91,233 43,881 48,202 84,789minimum 22,505 20,145 14,637 23,862St. Dev. 23,607 6,497 7,639 18,4391st Quart. 32,611 28,296 33,210 40,8293rd Quart. 47,734 34,260 35,205 54,256
Kruskal-Wallis test p-value 0.2315
ε (Uninformed traders rate)
Average 50,345 48,391 39,481 41,239median 46,639 41,343 35,866 41,865maximum 78,007 49,964 46,834 54,071minimum 36,511 36,477 12,200 24,648St. Dev. 14,400 4,183 7,577 9,0611st Quart. 44,742 40,168 33,921 41,4633rd Quart. 51,920 43,814 39,864 48,585
Kruskal-Wallis test p-value 0.0000
PIN
Average 0,080 0,084 0,132 0,117median 0,075 0,080 0,135 0,103maximum 0,173 0,135 0,189 0,231minimum 0,033 0,030 0,066 0,054St. Dev. 0,041 0,031 0,033 0,0511st Quart. 0,062 0,076 0,121 0,0963rd Quart. 0,093 0,102 0,161 0,150
Kruskal-Wallis test p-value 0.0000

Consejo latinoamericano de escuelas de administración, cladea 13
barbedo, da silva y leal
figure 2Average Probability of Information-Based Trading (PIN) for selected stocks in Level 1 (L1), Level 2 (L2), New Market (NM) and Traditional (Trad) lists in successive 60 day windows in the january 2, 2001 through april 01, 2009 period. Pin computed
according to the easley et al. (1996) method.
30%PIN
10%
20%
-20%
-10%
0%
0
200
400
Financial volume in millions
03/200112/200109/2002
06/2003
03/2004
12/2004
09/2008
03/2007
09/200506/2005
12/2007
Trad L1L2NM
We used the Kruskal-Wallis non-parametric test to verify the null hypothesis of simultaneously similar distribution functions of the parameters in each listing segment due to non-normality of parameter distributions. The Kruskal-Wallis non-parametric test rejects the similar distribution function hypothesis for the PIN and two of its four parameters.
Traditional listing and L1 stocks have a lower frequency of private information events (α) while Nm and L2 stocks show a higher frequency of private information events although this parameter distribution function is not the same across the four listings. The probability of an information event being bad news (δ) and the arrival rate of informed investors (μ) have a similar distribution across all listing segments while the arrival rates of uninformed traders (ε) has not. The medians for the traditional and L1 listings are greater than those for the NM and L2 listings. Thus, the higher PIN in the L2 and NM segments may be explained not only by the greater probability of an informed event but by the absence of sufficient uninformed traders. It seems that L2 and Nm listings are less liquid than the traditional and L1 listings in part because of these two parameters, as anticipated.
We performed simulations that show that a rise in the arrival rates of uninformed traders from 2001 to 2009 of about 15% would be enough for L2 and Nm to match traditional and L1 PIN levels. A higher PIN as a result of the relative scarcity of uninformed traders is consistent with prior research of Easley et al. (1996) and Brockman and Chung (2000).
To take into account the potential bull and bear market bias in the number of buy and sell orders, we estimated filtered PIN according to Equation 3, using the stocks included in

14 Academia, Revista latinoamericana de administración, 45, 2010
Premium listing segments and information based trading in brazil
the Bovespa index. The aim is to verify if the PIN of the traditional and L1 portfolio remain the lowest. Figure 3 presents the result individually, identifying each stock. A higher value in the vertical axis means that the stock has a higher probability that buy and sell orders in the last five years were encouraged by private information. According to Figure 3, the scatter of the adjusted PIN of L1 stocks is located somewhat below the scatter for the adjusted PIN of the traditional listing stocks. The scatter of the adjusted PIN of NM stocks is located somewhat below the scatter for the adjusted PIN of the L2 listing stocks. These initial graphic results for the adjusted PIN lend support to our hypothesis.
figure 3 Average Probability of Information-based Trading (PIN) of 48 individual stocks listed in Level 1 (L1), Level 2 (L2), New Market (NM) and Traditional (Trad) listings, 12 in each listing. Pin computed according to the easley et al. (1996) method and using the Henke (2004) adjustment, filtered by the stocks included in Bovespa Index portfolio.
T d
Trad
TradTrad Trad
20%
25%
30%PIN
N1
N1N1
N1N1 N1
N1
N1
N1
N1
N1
N1
N2
N2
N2
N2
N2 N2N2
N2N2
N2
N2N2
NM
NMNM
NM
NMNM
NM
NM
NM
NM
NM
NMTrad
TradTrad
Tra
Trad
Trad
Trad
Trad
Trad
0%
5%
10%
15%
Number of stocks0 5 10 15 20 25 30 35 40 45 50
Table 4 presents the adjusted PIN statistics for each list segment. Looking at the adjusted PIN for the 12 stocks in each listing segment, we find our hypothesis confirmed. Our hypothesis is that PIN will be greater in the least demanding listing segment, controlling for liquidity. Thus, we must only compare listing segments of similar liquidity levels. The less demanding traditional listing segment will be compared only to the more demanding L1 listing segment. In their turn, the less demanding L2 will be compared only to the more demanding NM. As anticipated by Figure 3, we confirm our hypothesis for the L2/NM pair. PIN in the more demanding Nm listing segment is lower than PIN in the less demanding, but as liquid, L2 listing segment. In contrast to the results in Table 3, our hypothesis is now confirmed for the traditional/L1 pair. PIN in the less demanding traditional listing segment is greater than PIN in the more demanding, but as liquid, L1 listing segment. The adjusted PIN considering the contemporaneous overall market behavior is consistent with our hypothesis while the non-

Consejo latinoamericano de escuelas de administración, cladea 15
barbedo, da silva y leal
adjusted PIN is not. The results are statistically significant at 95% level for the six most and six least liquid traditional/L1 pair and L2/NM pair.3
table 4 Probability of Informed Trading computed using the Henke (2004) adjustment. PIN of stock portfolios in the Level 1 (L1), Level 2 (L2), New Market (NM) and Traditional
(Trad) lists, filtered by the stocks included in Bovespa Index portfolio.trad L1 L2 nm
6 most liquid stocks in each listingAverage 0,110 0,101 0,139 0,108median 0,097 0,096 0,144 0,112St. Dev. 0,044 0,026 0,049 0,047
6 less liquid stocks in each listingAverage 0,168 0,116 0,131 0,122median 0,168 0,112 0,132 0,111St. Dev. 0,065 0,042 0,038 0,043
12-stock portfolio (most and least liquid)Average 0,133 0,107 0,143 0,122median 0,109 0,093 0,136 0,112maximum 0,513 0,427 0,427 0,238minimum 0,030 0,001 0,029 0,053St. Dev. 0,086 0,063 0,059 0,0461st Quart. 0,079 0,083 0,107 0,1023rd Quart. 0,158 0,125 0,180 0,154
There is an obvious relationship between market liquidity and PIN. Based on Figure 2, the correlation between our proxy for liquidity in the Brazilian stock exchange and PIN is strongly negative. For instance, it is -0,89 for the L2 and -0,71 for the Nm. When the market liquidity increases, there are lower PINs and greater arrival rates of uninformed traders. It seems that listing level requirements have an influence after controlling for market liquidity. According to Table 4, the adjusted PIN is greater when listing requirements are less demanding. Thus, given liquidity, better corporate governance practices may lead to a lower probability of information based trading.
To investigate if PIN is influenced by other firm characteristics, we run a basic panel regression model for our sample of firms with PIN as the dependent variable and tangibility of assets (the ratio of fixed to total assets), size (natural logarithm of revenues), growth (measured by the Tobin’s Q), beta (systematic risk measure), and other traditional financial ratios such as leverage, efficiency, profitability and market-to-book-value ratios, and the firm level corporate governance practices score for Brazilian companies computed by Leal and Carvalhal-da-Silva (2007) as potential determinants of PIN. We cannot use industry dummies because we have only 48 stocks in our sample. The analysis follows in spirit the one performed by Aslan, Easley, Hvidkjaer, and O’Hara (2007) for all US-listed common stocks between 1983 and 1999. We do not report the analysis on a table to save space but the results are available upon request.
3 The L2/NM pair is statistically significant only at 90% level.

16 Academia, Revista latinoamericana de administración, 45, 2010
Premium listing segments and information based trading in brazil
First, we run a panel regression with common coefficients and fixed effects and a panel regression with common coefficients and only one intercept from 2003 to 2008. Our results show that asset tangibility is positively related to PIN. Firms with greater asset tangibility are able to borrow more using their tangible assets as collateral and may be less dependent on the stock market and on their corporate governance practices toward minority (uninformed) shareholders. Thus, PIN could be related to less need for better corporate governance practices.
Beta is negatively related to PIN at the 1% level, suggesting that firms with greater systematic risk present less profit opportunities for informed traders. Beta and systematic risk are related to liquidity. In our cross-sectional in 2006 sample, for example, the average beta for the greater liquidity quartile is 0.98 while the average beta for the least liquid quartile is 0.60.
4. dIscussIon
This paper estimated the probability of information-based trading (PIN) for stocks listed at the São Paulo stock exchange (BOVESPA) in its four listing segments, differentiated according to adherence to disclosure and corporate governance practices. We analyzed the Traditional, Level 1 (L1), Level 2 (L2) and New market (Nm) lists, with the most rigorous requirements being those of Nm, followed by L2, L1, and the traditional listing, that has no listing requirements. Our hypothesis was that the PIN would be smaller for Nm and greater in the traditional listing.
We used the model developed by Easley et al. (1996) to estimate, ex post, the probability of transactions based on insider information occurrence. We also used a modified version of this model with a trend adjustment in the number of purchases or sales, to filter transactions according to contemporaneous market movements. The filter was a portfolio of stocks in the IBOVESPA index.
Our results indicate that liquidity is very important and seems to dominate listing requirements. Traditional and L1 listing stocks present similar liquidity levels. L2 and NM stocks present similar liquidity levels, that are lower than those in the traditional and L1 listings. When liquidity is considered, our initial hypothesis holds. Within similar liquidity level listings, the traditional listing adjusted PIN is greater than the L1 adjusted PIN, and the L2 adjusted PIN is greater than the Nm adjusted PIN. PIN seems to increase with the probability of an information event and to decrease with the rate of uninformed traders arriving to the market. These factors are associated to liquidity. The correlation between our proxy for liquidity in the Brazilian stock exchange and PIN is strongly negative during the period studied.
Other determinants of PIN, besides liquidity and the listing requirement demands were asset tangibility and the return on assets with a positive impact and beta, that is also related to liquidity, with a negative impact. Thus, under similar liquidity levels, listings requiring better corporate governance practices show a lower probability of information-based transactions.
Analyzing the rate of uninformed traders arriving, we noticed that an increase of 25% in this rate at the Nm and L2 segments would be enough to equalize their PIN with those of the more liquid segments. At this time, the higher rate of uninformed traders is in the most

Consejo latinoamericano de escuelas de administración, cladea 17
barbedo, da silva y leal
liquid and less demanding listings. The reversion of that trend may be happening as the trading volume is increasing much more in the L2 and NM listings. The PIN in these listings may be reduced soon.
One of the limitations of our research may be its period dependence. As noted elsewhere in the text, the Brazilian stock market is in a transition phase, with companies migrating from the traditional listing level to the new more demanding levels. There were no IPOs for listing in the traditional listing level since 2004. Thus, it is quite possible that in a few years even the larger companies in Brazil, some still listed in the traditional levels, may have migrated to gradually more demanding listing levels, particularly after they overcome their controlling shareholders dilution problem of converting non-voting shares into voting shares. Thus, the lower liquidity in the newer and more demanding listing levels may match and overtake the liquidity in the traditional listing segment. In fact, the traditional listing segment, as it exists today, may disappear. Thus, some of the evidence presented may be characteristic of this transitional phase. We also used only 48 stocks, although we were careful to select the most and least liquid in each listing segment. Empirical results may improve if all or most listed companies are sampled in future research about Brazil. Researchers may also wish to examine institutional features in other countries, such as those explored by Brockman and Chung (2003), for an analysis of the impact of listing demands on PIN, particularly those related to corporate governance.
Our main conclusion brings about implications to other emerging markets. In fact, officials at Bovespa state and the increasing interest of officials from other emerging market exchanges, which we have witnessed, in the successful Bovespa listing segments differentiated according to investor protection demands. It seems that there is a lot to gain from the adoption of such listing requirements in terms of better confidence on the part of investors in general to trade at an exchange. The policy implication here is that securities regulators and stock exchange officials, in emerging markets and in many developed markets as well, could explore the feasibility of the Bovespa private contracting arrangement under their own country’s legal environment. Bovespa’s liquidity was very low in the end of the 1990’s as it lost trading to the US exchanges and Bovespa’s officials tried to influence legislators to pass stricter requirements for public companies with no success. The solution was to create the differentiated listing levels that companies would join voluntarily by means of a private contract with Bovespa. Their solution, more practical and easier, was very successful, and was a means of circumventing the political difficulties that slow the legislative process. Their success can be measured in many different ways: record number of IPOs and trading volume and an increasing number of individuals trading in the market. It is quite possible that legislators and regulators in Brazil gradually incorporate some of Bovespa’s requirements into the law, improving the level of the legal protection of investors. This trajectory, from private contracting investor protection to legal reform is not new and may be a feasible solution for exchange officials in many different emerging markets. Needless to say, the credibility of the exchange in enforcing these contracts with listed firms is the key to success.

18 Academia, Revista latinoamericana de administración, 45, 2010
Premium listing segments and information based trading in brazil
Claudio Henrique Barbedo es profesor de finanzas de las Facultades Ibmec en Río de Janeiro (Brasil) y analista del Banco central de Brasil. obtuvo su doctorado en el instituto coppead de Administración de la Universidad Federal de Río de Janeiro. Sus intereses de investigación se relacionan con la gestión de riesgo y los instrumentos derivados.
Eduardo Camilo da Silva es profesor de finanzas del Departamento de Administración la Universidad Federal Fluminense (Río de Janeiro, Brasil) y obtuvo su doctorado en el Instituto Coppead de Administración de la Universidad Federal de Río de Janeiro. Sus intereses de investigación se relacionan con la microestructura de mercado y las finanzas comportamentales.
ricardo Pereira câmara leal es profesor investigador del instituto coppead de administra-ción de la Universidad Federal de Río de Janeiro (Brasil) y obtuvo su doctorado en la misma universidad. Fue profesor en Georgetown university y en la university of nevada en los Estados Unidos. Sus intereses de investigación se relacionan con las finanzas corporativas, el gobierno corporativo y con la gestión de portafolios.
References
Aslan, H., Easley, D., Hvidkjaer, S., & O’Hara, M. (2007). Firm characteristics and informed trading: Implications for asset pricing. Working Paper, Babson College, Cornell University and University of maryland.
Barbedo, C., Camilo-da-Silva, E., & Leal, R. (2009). Probabilidade de informação privilegiada no mercado de ações, liquidez intra-diária e níveis de governança corporativa. revista Brasileira de economia, 63(1), 102-156
Bhattacharya, U., & Daouk, H. (2002). The world price of insider trading. journal of Finance, 57, 75-108.
Brockman, P., & Chung, D. Y. (2000). Informed and uninformed trading in an electronic, order-driven environment. Financial review, 35, 125-146.
Brockman, P., & Chung, D. (2003). Investor protection and firm liquidity. journal of Finance, 58, 921-937.
Carvalhal-da-Silva, A. L., & Subrahmanyam, A. (2007). Dual-Class premium, corporate governance, and the mandatory Bid rule: Evidence from the Brazilian stock market. journal of corporate Finance, 13, 1-24.
Cruces, J., & Kawamura, E. (2007). Insider trading and corporate governance in Latin America. In F. Lopez-de-Silanes & A. Chong (Eds.), investor protection and corporate governance – Firm level evidence across latin america (pp. 53-64). Palo Alto, California: Stanford University Press.
De Carvalho, A. G., & Pennacchi, G. (2007). Can a stock exchange improve corporate behavior? Evidence from firm’s migration to premium listings in Brazil. Working Paper available at http://ssrn.com/abstract=678282.
Easley, D., Kiefer, N., O’Hara, M., & Paperman, J. (1996). Liquidity, information and infrequently traded stocks. journal of Finance, 51, 1405–36.

Consejo latinoamericano de escuelas de administración, cladea 19
barbedo, da silva y leal
Easley, D., O’Hara, M., & Paperman, J. (1998). Financial analysts and information-based trade. journal of Financial Markets, 1, 175–201.
Easley, D., O’Hara, M., & Saar, G. (2001). How stock splits affect trading: A microstructure approach. journal of Financial and Quantitative analysis, 36, 25–51.
Henke, H. (2004). Correlation of order flow and the probability of informed trading. Working Paper, European University Viadrina.
Klapper, L., & Love, I. (2004). Corporate governance, investor protection and performance in emerging markets. journal of corporate Finance, 10, 703-728.
Kraakman, R., Davies, P., Hansmann, H., Hertig, G., Hopt, K., Hideki, K., & Rock, E., (2004). the anatomy of corporate law: a comparative and functional approach. Oxford: Oxford University Press.
La Porta, R., Lopez-de-Silanes, F., Shleifer, A., & Vishny, R. (2002). Investor Protection and Corporate Valuation. journal of Finance, 57, 1147-1170.
Leal, R. P. C., & Carvalhal-da-Silva, A. L. (2007). Corporate governance and value in Brazil (and Chile). In A. Chong & F. Lopez-de-Silanes (Eds.), investor protection and corporate governance – Firm level evidence across latin america (pp. 213-287). Palo Alto, California: Stanford University Pres.
Lee, C., & Ready, m. (1991). Inferring trade direction from intraday data. journal of Finance, 46, 733-746.
Lins, K. V. (2003). Equity ownership and firm value in emerging markets. journal of Financial and Quantitative analysis, 38, 159-184.
Recepción del artículo: 01/04/2010Envío evaluación a autores: 28/06/2010Recepción correcciones: 12/07/2010Aceptación artículo: 26/07/2010