preparatory survey for metropolitan arterial road...
TRANSCRIPT

E I DJ R(先)
12-068
Preparatory Survey for
Metropolitan Arterial Road Improvement Project
Final Report ( Vol. 1 Main Report )
March 2012
JAPAN INTERNATIONAL COOPERATION AGENCY
ORIENTAL CONSULTANTS CO., LTD.
The Republic of Indonesia Ministry of Public Works Directorate General of Highways

Preparatory Survey for
Metropolitan Arterial Road Improvement Project
Final Report ( Vol. 1 Main Report )
March 2012
JAPAN INTERNATIONAL COOPERATION AGENCY
ORIENTAL CONSULTANTS CO., LTD.
The Republic of Indonesia Ministry of Public Works Directorate General of Highways

The following foreign exchange rate is applied in the study
1 US dollar = 8,600 Rp, and 1 JP Yen = 104 Rp (May 2011)
No.
Pro
ject
Loca
tion
1.Se
man
ggi
DKI
JKT
2.M
argo
nda
Cine
reD
epok
City
3.Ci
lilita
nD
KI J
KT4.
RE. M
arta
dina
taD
KI J
KT5.
Sula
wes
iD
KI J
KT6.
Latu
men
ten
DKI
JKT
7.Su
dirm
an D
aan
Mog
otTa
nger
ang
City
8.Ku
ning
anD
KI J
KT9.
Panc
oran
DKI
JKT
10.
Cila
ndak
DKI
JKT
11.
Fatm
awat
iD
KI J
KT12
.Ci
awai
-Bog
orBo
gor
City
16.
Sudi
rman
-2Ta
nger
ang
City
17.
Cika
rang
Beka
si R
egen
cy18
.Se
naya
nD
KI J
KT
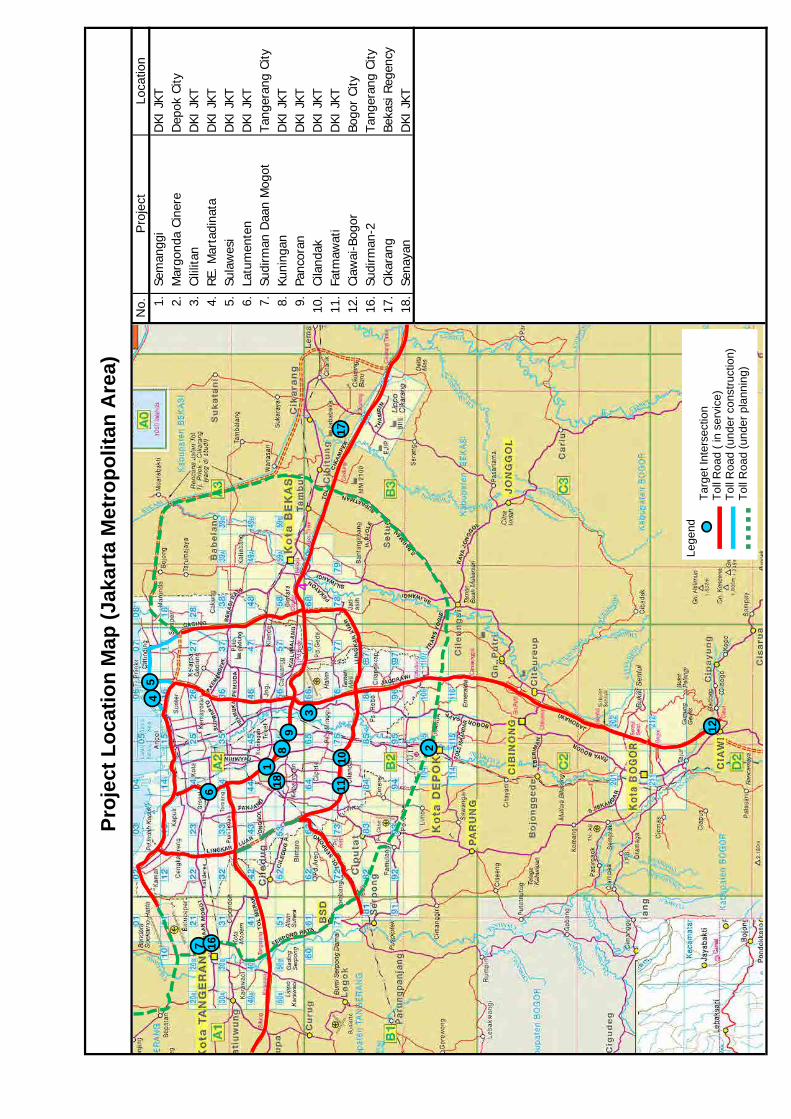
Proj
ect L
ocat
ion
Map
(Jak
arta
Met
ropo
litan
Are
a)
4
12
2
1110
76
18
9
45
3
16
17
Lege
ndTa
rget
Inte
rsec
tion
Toll
Roa
d ( i
n se
rvic
e)To
ll R
oad
(und
er c
onst
ruct
ion)
Toll
Roa
d (u
nder
pla
nnin
g)
18

No.
Pro
ject
13.
Pina
ng B
aris
14.
Asra
ma
- G
atot
Sub
roto
15.
Kata
mso
Pro
ject
Location M
ap (
Medan)
Targ
et I
nter
sect
ion
1314
15

Preparatory Survey for Metropolitan Arterial Road Improvement Project Final Report
i
Abbreviation AADT Annual Average Daily Traffic
AASHTO American Association of State Highway and Transport Officials
ADB Asian Development Bank
ADT Average Daily Traffic
AMDAL Analisis Mengenai DAmpak Lingkungan (Environmental Impact Assessment)
ANDAL ANalisis DAmpak Lingkungan (Environmental and Social Impacts Assessment Report)
B/C Benefit-Cost ratio
B/D Basic Design
BOO Build Own Operate
BOT Build Operate Transfer
BOOT Build Own Operate and Transfer
BPN Badan Pertanahan Nasional (the National Land Board Agency)
CBR California Bearing Ratio
DCP Dynamic Cone Penetration
D/D Detail Design
DGH Directorate General of Highways
DGLT Directorate General of Land Transportation
DGST Directorate General of Sea Transportation
DGR Directorate General of Railway
DKI Daerah Khusus Igukota (Special Capital District)
EIA Environmental Impact Assessment
EIRR Economic Internal Rate of Return
FC Foreign Currency
FLARAP the Framework of Land Acquisition and Resettlement Acton Plan
FO FlyOver
F/S Feasibility Study
GDP Gross Domestic Product
GNI Gross National Income
GOI Government Of Indonesia
GOJ Government Of Japan
GPRS General Packet Radio Service
GPS Global Positioning System
H.W.L High Water Level
IC Interchange
ICB International Competitive Bidding
IRI International Roughness Index
IRR Internal Rate of Return
JABODETABEK JAkarta, BOgor, DEpok, TAngerang BEKasi

Preparatory Survey for Metropolitan Arterial Road Improvement Project Final Report
ii
JBIC Japan Bank for International Cooperation
JICA Japan International Cooperation Agency
JIUT Jakarta Inner Urban Toll road
JORR Jakarta Outer Ring Road
JORR2 2nd Jakarta Outer Ring Road
JST JICA Survey Team
JUTPI Jabodetabek Urban Transportation Policy Integration
LARAP Land Acquisition and Resettlement Acton Plan
LC Local Currency
LPC Land Procurement Committee
LRP Livelihood Restoration Program
MARIP Metropolitan Arterial Road Improvement Project
M/D Minutes of Discussion
MOF Ministry of Finance
MOU Minutes of Understanding
MPW Ministry of Public Works
MRT Mass Rapid Transit
NGO Non-Governmental Organization
NPV Net Present Value
NSPM Norma Standr Pedoman Manual (Design Standards for Structures)
OD Origin and Destination
ODA Official Development Assistance
OM Operation and Maintenance
PC Prestressed Concrete
PCU Passenger Car Unit
PELINDO PELabuhan INDOnesia (Indonesian Port)
PPP Public-Private Partnership
PU Ministry of Public Works (Pekerjaan Umum)
LARAP Land Acquisition and Resettlement Action Plan
RC Reinforced Concrete
RENSTRA RENcana STRAtegis (Strategic Plan)
RKL Rencana Pengelolaan Lingkungan hidup (Environmental Management Plan)
ROW Right of Way
RPJM Rencana Pembangunan Jangka Menengah (GOI’s Midterm Development Plan)
RPL Rencana Pemantauan Lingkungan hidup (Environmental Monitoring Plan)
SITRAMP Study on Integrated Transportation Master Plan for Jabodetabek
SPT Standard Penetration Test
TgPA TanjunG Priok Access road
TgPP TanjunG Priok international Port
TOR Terms of Reference
TTC Travel Time Cost

Preparatory Survey for Metropolitan Arterial Road Improvement Project Final Report
iii
UARI Urban Arterial Roads Improvement in metropolitan and large cites project
UKL Upaya Pengelolaan Lingkungan hidup (Environmental Management)
UP UnderPass
UPL Upaya Pemantauan Lingkungan hidup (Environmental Monitoring )
VOC Vehicle Operation Cost

Preparatory Survey for Metropolitan Arterial Road Improvement Project Final Report
P-1
TABLE OF CONTENTS (Vol. 1 Main Report)
Project Location Map
Abbreviation
Page
Chapter 1. Introduction
1.1 Background ..................................................................................................................................1-1
1.1.1 Status of Study Area.................................................................................................................1-1
1.1.2 Economic Activities .................................................................................................................1-1
1.1.3 Road Sector Budget..................................................................................................................1-2
1.2 Objective ......................................................................................................................................1-3
1.2.1 The Past Projects ......................................................................................................................1-3
1.2.2 Objective of the Study..............................................................................................................1-4
1.3 Methodology ................................................................................................................................1-5
1.3.1 Study Flow ...............................................................................................................................1-5
1.3.2 Study Members and Flow Chart...............................................................................................1-6
1.3.3 Selection of Sub-projects in the 1st Stage .................................................................................1-8
1.3.4 Evaluation of Sub-projects in the 2nd Stage ..............................................................................1-9
Chapter 2. Selection of Sub-projects
2.1 Nomination of Potential Projects .................................................................................................2-1
2.2 Site Conditions of Potential Projects............................................................................................2-2
2.3 Selection of Sub-projects............................................................................................................2-34
2.3.1 Selection Criteria....................................................................................................................2-34
2.3.2 Selection of Sub-projects........................................................................................................2-34
Chapter 3. Traffic Analysis
3.1 Traffic Survey Result ...................................................................................................................3-1
3.1.1 Directional Traffic Count Survey.............................................................................................3-1
3.1.2 Signal Phasing Survey..............................................................................................................3-2
3.1.3 Travel Speed Survey ................................................................................................................3-3
3.1.4 Traffic Queue Length Survey...................................................................................................3-3
3.2 Updates of Existing Plans of Flyovers/Underpasses ....................................................................3-5
3.3 Travel Demand Forecast ..............................................................................................................3-8
3.4 Traffic Analysis of Sub-Projects ................................................................................................3-14
3.4.1 Semanggi Junction .................................................................................................................3-14
3.4.2 Kuningan Intersection ............................................................................................................3-25
3.4.3 Cikarang Area ........................................................................................................................3-27

Preparatory Survey for Metropolitan Arterial Road Improvement Project Final Report
P-2
3.4.4 Senayan Roundabout..............................................................................................................3-31
3.4.5 Other Intersections .................................................................................................................3-34
Chapter 4. Road and Structure Design
4.1 Road and Intersection Design.......................................................................................................4-1
4.1.1 Design Criteria .........................................................................................................................4-1
4.1.2 Preliminary Design of Roads and Intersections .......................................................................4-4
4.1.3 Summary of Preliminary Design............................................................................................4-26
4.1.4 Basic Design of Roads and Intersections ...............................................................................4-27
4.1.5 Summary of Basic Design......................................................................................................4-69
4.2 Structure Design.........................................................................................................................4-70
4.2.1 Design Standards for Structures .............................................................................................4-70
4.2.2 Flyover (Bridge) Planning......................................................................................................4-74
4.2.3 Underpass Planning................................................................................................................4-80
4.2.4 Structure Design for Each Subproject ....................................................................................4-84
4.2.5 Construction Planning for Structures ...................................................................................4-111
4.2.6 External Conditions..............................................................................................................4-116
Chapter 5. Implementation, Construction and Maintenance Plans
5.1 Institutional Arrangements for Implementation ...........................................................................5-1
5.1.1 Related Institutions...................................................................................................................5-1
5.1.2 DGH (Bina Marga): Executing agency ....................................................................................5-1
5.2 Implementation Schedule .............................................................................................................5-3
5.3 Procurement of Contractors..........................................................................................................5-4
5.4 Construction Plan .........................................................................................................................5-5
5.5 Operation and Maintenance System.............................................................................................5-7
5.5.1 Organization for Construction and Maintenance......................................................................5-7
5.5.2 Budget for Construction and Maintenance...............................................................................5-8
5.5.3 Existing National Roads and Bridge Conditions......................................................................5-9
5.5.4 Maintenance Cost for this Project ..........................................................................................5-11
5.6 Technical Assistance and Transfer.............................................................................................5-11
Chapter 6. Project Cost Estimate (Confidential)
6.1 Composition of Project Cost ........................................................................................................6-1
6.2 Estimate of Project Cost ...............................................................................................................6-1
6.3 Japanese ODA Loan Criteria and the Non-Eligible Items............................................................6-4
6.4 Financing Plan..............................................................................................................................6-4
6.5 Price Escalation ............................................................................................................................6-5
Chapter 7. Economic Analysis (Confidential)
7.1 Overview ......................................................................................................................................7-1

Preparatory Survey for Metropolitan Arterial Road Improvement Project Final Report
P-3
7.2 Comparison of Benefits and Costs ...............................................................................................7-1
7.3 Assumptions of Economic Evaluation .........................................................................................7-1
7.3.1 General Assumptions of Economic Evaluation........................................................................7-1
7.3.2 Basic Calculation of Unit Value for Benefit Estimate .............................................................7-2
7.4 Result of Economic Analysis .......................................................................................................7-4
7.4.1 Semanggi Junction ...................................................................................................................7-4
7.4.2 R.E. Martadinata Intersection.................................................................................................7-11
7.4.3 Sulawesi - Tg.PA Intersection................................................................................................7-13
7.4.4 Kuningan Intersection ............................................................................................................7-15
7.4.5 Pancoran Intersection .............................................................................................................7-18
7.4.6 Pinang Baris Intersection........................................................................................................7-20
7.4.7 Katamso Intersection..............................................................................................................7-22
7.4.8 Sudirman II Intersection.........................................................................................................7-24
7.4.9 Cikarang Area ........................................................................................................................7-26
7.4.10 Senayan Roundabout..............................................................................................................7-30
Chapter 8. Environmental and Social considerations
8.1 Environmental Impact Assessment Law and relevant guidelines in Indonesia............................8-1
8.1.1 EIA Legislation ........................................................................................................................8-1
8.1.2 Governmental Environmental Authority ..................................................................................8-4
8.2 Initial Environmental Evaluation for Screening of 10 Projects....................................................8-6
8.2.1 Expected Facility and Screening based on the Law .................................................................8-6
8.2.2 Major Environmental and Social Issues at each Candidate Site...............................................8-6
8.3 Screening and Scoping for Environmental and Social Considerations ........................................8-9
8.3.1 Project Outline and Screening based on the Law.....................................................................8-9
8.3.2 Analysis of Alternatives ...........................................................................................................8-9
8.3.3 Scoping for full scale EIA based on JICA Guidelines ...........................................................8-10
8.4 Current Progress and Schedule of Environmental Approval......................................................8-37
Chapter 9. Involuntary Resettlement
9.1 General .........................................................................................................................................9-1
9.2 Legal Framework for Involuntary Resettlement in Indonesia......................................................9-1
9.2.1 Related Regulations..................................................................................................................9-1
9.2.2 Responsible Agency.................................................................................................................9-2
9.3 Comparative Analysis with International Practices on Involuntary Resettlement .......................9-3
9.3.1 JICA guidelines on Involuntary Resettlement..........................................................................9-3
9.3.2 Comparative Analysis with International Practices on Involuntary Resettlement ...................9-4
9.4 Summary of the Framework of LARAP(FLARAP).....................................................................9-6
9.4.1 Discussion and Proposals on the FLARAP ..............................................................................9-6
9.4.2 Objectives and Principles of the FLARP..................................................................................9-7
9.4.3 Entitlement Matrix ...................................................................................................................9-8
9.5 LARAP Preparation ...................................................................................................................9-14

Preparatory Survey for Metropolitan Arterial Road Improvement Project Final Report
P-4
9.5.1 General ...................................................................................................................................9-14
9.5.2 Project Description for Selected Sub-Projects........................................................................9-15
9.5.3 Field Survey ...........................................................................................................................9-15
9.5.4 Replacement Cost Survey ......................................................................................................9-16
9.5.5 Decision on a Full or an Abbreviated LARAP.......................................................................9-21
9.5.6 Summary of LARAP for Sub-projects of MARIP .................................................................9-22
9.6 Implementation Arrangement.....................................................................................................9-22
9.7 Tentative Implementing Schedule for Land Acquisition ...........................................................9-24
9.8 Recommendations and Proposal ................................................................................................9-25
Chapter 10. EVALUATION OF SUB-PROJECTS (Confidential)
10.1 Evaluation Method .....................................................................................................................10-1 10.2 Multi Criteria Analysis...............................................................................................................10-1 10.3 Evaluation Result .......................................................................................................................10-1 10.4 Project Evaluation ......................................................................................................................10-5
Chapter 11. Implementation PROGRAM (Confidential)
11.1 Possible Loan Scheme................................................................................................................11-1
11.2 Alternatives for the Implementation Program............................................................................11-2
11.3 Implementation Schedule ...........................................................................................................11-2
11.4 Implementation Program............................................................................................................11-6
11.5 Consulting Works.....................................................................................................................11-10
Chapter 12. CONCLUSIONS AND RECOMMENDATIONS (Confidential)
12.1 Conclusions ................................................................................................................................12-1
12.2 Recommendations ......................................................................................................................12-1

Preparatory Survey for Metropolitan Arterial Road Improvement Project Final Report
P-5
LIST OF TABLES Page
Table 1.1.1 Component of Road Sector Budget (RENSTRA: 2010-2014) ..............................................1-3
Table 1.2.1 Objective of the Study ...........................................................................................................1-4
Table 1.3.1 Members of the Study Team..................................................................................................1-6
Table 2.1.1 Interview List.........................................................................................................................2-1
Table 2.1.2 List of Potential Projects........................................................................................................2-2
Table 2.3.1 Selection Criteria in the 1st Stage........................................................................................2-34
Table 2.3.2 Selection of sub-project .......................................................................................................2-35
Table 3.1.1 Traffic Volume at 10 Sub-Project Locations .........................................................................3-2
Table 3.1.2 Average Cycle Times at Signalized Sub-Project Locations ..................................................3-2
Table 3.1.3 Average Travel Speed at 10 Sub-Project Locations ..............................................................3-3
Table 3.1.4 Average Queue Length at 10 Sub-Project Locations.............................................................3-4
Table 3.2.1 Intersections for Future Improvement in DKI Proposed in SITRAMP .................................3-6
Table 3.3.1 Major Road Development Plans in Assignment Network of 2020 and 2030 ......................3-11
Table 3.3.2 Traffic Demand Forecast at Eight Sub-Project Locations in JABODETABEK..................3-13
Table 3.3.3 Traffic Demand Forecast at Two Sub-Project Locations in Medan ....................................3-13
Table 3.4.1 Comparison of Semanggi Improvement Alternatives..........................................................3-25
Table 3.4.2 Average Queue Length around Kuningan and Mampang Intersections ..............................3-26
Table 3.4.3 Evaluation of Intersection Improvement at Kuningan in 2017............................................3-27
Table 3.4.4 Average Queue Length on Arterial Roads in Cikarang Area ..............................................3-28
Table 3.4.5 Average Queue Length at Toll Gates in Cikarang Area ......................................................3-29
Table 3.4.6 Comparison of Daily Traffic Volume-Capacity Ratios on N-S Roads in 2020...................3-31
Table 3.4.7 Comparison of Daily Traffic Volume-Capacity Ratios on ICs in 2020...............................3-31
Table 3.4.8 Traffic Demand Forecast in Each Senayan Improvement Alternative in 2018 ...................3-34
Table 3.4.9 Evaluation of Intersection Improvement in Other Sub-Project Locations...........................3-39
Table 4.1.1 Design Classes of Type II......................................................................................................4-1
Table 4.1.2 Geometric Design Criteria (Main road).................................................................................4-2
Table 4.1.3 Geometric Design Criteria for At-grade Intersection ............................................................4-2
Table 4.1.4 Geometric Design Criteria for Interchange............................................................................4-3
Table 4.1.5 Relevant Roads of Semanggi Intersection .............................................................................4-4
Table 4.1.6 Alternatives for the Improvement Plan of Semanggi Intersection.........................................4-5
Table 4.1.7 Relevant Roads of Margonda Cinere.....................................................................................4-7
Table 4.1.8 Project Condition of Margonda Cinere..................................................................................4-7
Table 4.1.9 Relevant Roads of Cililitan....................................................................................................4-8
Table 4.1.10 Project Condition of Cililitan.................................................................................................4-8
Table 4.1.11 Relevant Roads of R.E. Martadinata .....................................................................................4-9
Table 4.1.12 Project Condition of R.E. Martadinata ..................................................................................4-9
Preparatory Survey for Metropolitan Arterial Road Improvement Project Final Report
P-6
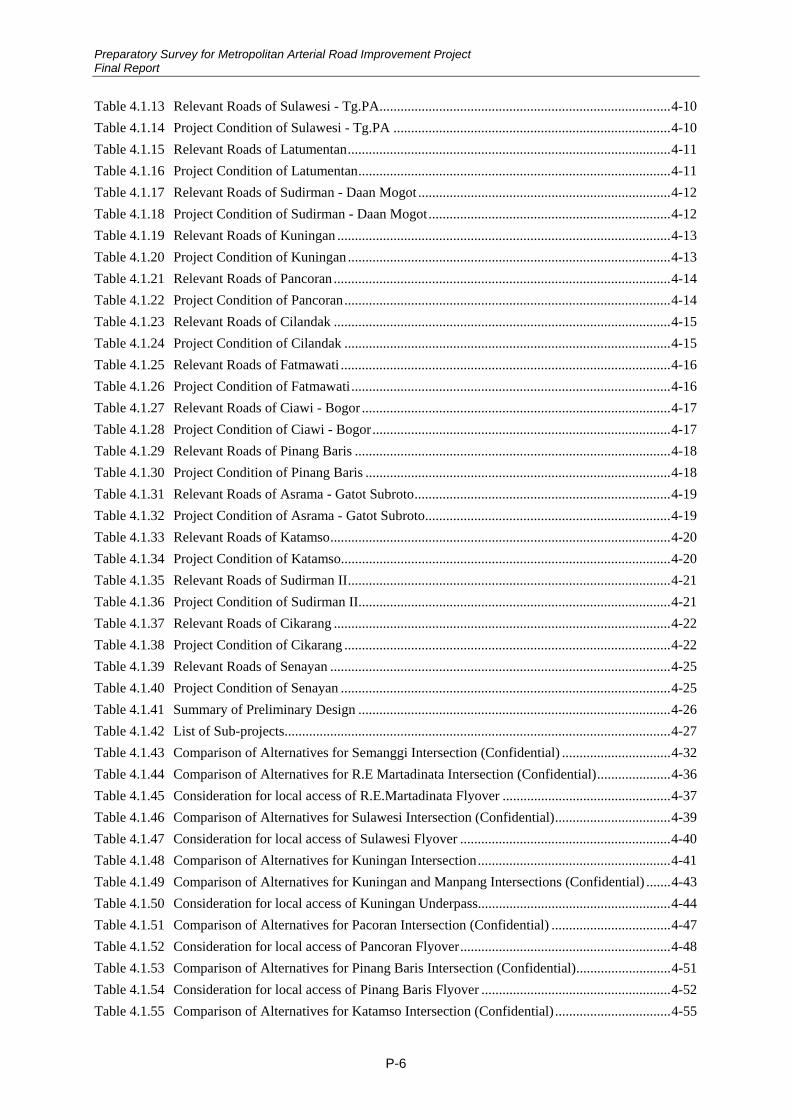
Table 4.1.13 Relevant Roads of Sulawesi - Tg.PA...................................................................................4-10
Table 4.1.14 Project Condition of Sulawesi - Tg.PA ...............................................................................4-10
Table 4.1.15 Relevant Roads of Latumentan............................................................................................4-11
Table 4.1.16 Project Condition of Latumentan.........................................................................................4-11
Table 4.1.17 Relevant Roads of Sudirman - Daan Mogot ........................................................................4-12
Table 4.1.18 Project Condition of Sudirman - Daan Mogot.....................................................................4-12
Table 4.1.19 Relevant Roads of Kuningan ...............................................................................................4-13
Table 4.1.20 Project Condition of Kuningan ............................................................................................4-13
Table 4.1.21 Relevant Roads of Pancoran ................................................................................................4-14
Table 4.1.22 Project Condition of Pancoran.............................................................................................4-14
Table 4.1.23 Relevant Roads of Cilandak ................................................................................................4-15
Table 4.1.24 Project Condition of Cilandak .............................................................................................4-15
Table 4.1.25 Relevant Roads of Fatmawati ..............................................................................................4-16
Table 4.1.26 Project Condition of Fatmawati...........................................................................................4-16
Table 4.1.27 Relevant Roads of Ciawi - Bogor ........................................................................................4-17
Table 4.1.28 Project Condition of Ciawi - Bogor.....................................................................................4-17
Table 4.1.29 Relevant Roads of Pinang Baris ..........................................................................................4-18
Table 4.1.30 Project Condition of Pinang Baris .......................................................................................4-18
Table 4.1.31 Relevant Roads of Asrama - Gatot Subroto.........................................................................4-19
Table 4.1.32 Project Condition of Asrama - Gatot Subroto......................................................................4-19
Table 4.1.33 Relevant Roads of Katamso.................................................................................................4-20
Table 4.1.34 Project Condition of Katamso..............................................................................................4-20
Table 4.1.35 Relevant Roads of Sudirman II............................................................................................4-21
Table 4.1.36 Project Condition of Sudirman II.........................................................................................4-21
Table 4.1.37 Relevant Roads of Cikarang ................................................................................................4-22
Table 4.1.38 Project Condition of Cikarang .............................................................................................4-22
Table 4.1.39 Relevant Roads of Senayan .................................................................................................4-25
Table 4.1.40 Project Condition of Senayan ..............................................................................................4-25
Table 4.1.41 Summary of Preliminary Design .........................................................................................4-26
Table 4.1.42 List of Sub-projects..............................................................................................................4-27
Table 4.1.43 Comparison of Alternatives for Semanggi Intersection (Confidential) ...............................4-32
Table 4.1.44 Comparison of Alternatives for R.E Martadinata Intersection (Confidential).....................4-36
Table 4.1.45 Consideration for local access of R.E.Martadinata Flyover ................................................4-37
Table 4.1.46 Comparison of Alternatives for Sulawesi Intersection (Confidential).................................4-39
Table 4.1.47 Consideration for local access of Sulawesi Flyover ............................................................4-40
Table 4.1.48 Comparison of Alternatives for Kuningan Intersection.......................................................4-41
Table 4.1.49 Comparison of Alternatives for Kuningan and Manpang Intersections (Confidential) .......4-43
Table 4.1.50 Consideration for local access of Kuningan Underpass.......................................................4-44
Table 4.1.51 Comparison of Alternatives for Pacoran Intersection (Confidential) ..................................4-47
Table 4.1.52 Consideration for local access of Pancoran Flyover............................................................4-48
Table 4.1.53 Comparison of Alternatives for Pinang Baris Intersection (Confidential)...........................4-51
Table 4.1.54 Consideration for local access of Pinang Baris Flyover ......................................................4-52
Table 4.1.55 Comparison of Alternatives for Katamso Intersection (Confidential) .................................4-55

Preparatory Survey for Metropolitan Arterial Road Improvement Project Final Report
P-7
Table 4.1.56 Consideration for local access of Katamso Underpass ........................................................4-56
Table 4.1.57 Comparison of Alternatives for SudirmanII Intersection (Confidential) .............................4-58
Table 4.1.58 Consideration for local access of SudrimanII Flyover.........................................................4-59
Table 4.1.59 Comparison of Alternatives for Senayan Intersection .........................................................4-68
Table 4.1.60 Summary of Basic Design ...................................................................................................4-69
Table 4.2.1 Length of Bridge Requiring Formation Width Deck...........................................................4-70
Table 4.2.2 Vertical Clearance of Bridge by Road Class .......................................................................4-71
Table 4.2.3 Bridge Type with Applicable Span Length for Flyover ......................................................4-76
Table 4.2.4 Comparison of Typical Precast Girders in Indonesia ..........................................................4-77
Table 4.2.5 Comparison of Foundation Types........................................................................................4-78
Table 4.2.6 Comparison of Pile Types ...................................................................................................4-78
Table 4.2.7 Comparison of Abutment Types..........................................................................................4-79
Table 4.2.8 Comparison of Pier Types ...................................................................................................4-79
Table 4.2.9 Selection of Preferable Underpass Structure at Tunnel Section (at Intersection) ................4-81
Table 4.2.10 Selection of Preferable Underpass Structure at Approach Sections ....................................4-82
Table 4.2.11 Comparison of Structure Type at Approach Section ...........................................................4-83
Table 4.2.12 Comparison of Bridge Structure for Main Span of Flyover (Span length > 50m)
(Confidential).......................................................................................................................4-85
Table 4.2.13 Comparison of Bridge Structure for Side Span of Flyover (Confidential) ..........................4-86
Table 4.2.14 Construction planning for RE. Martadinata Flyover ...........................................................4-88
Table 4.2.15 Construction planning for Sulawesi Flyover .......................................................................4-90
Table 4.2.16 Construction planning for Pancoran Flyover.......................................................................4-92
Table 4.2.17 Construction planning for Pinang Baris Flyover .................................................................4-94
Table 4.2.18 Construction planning for Sudirman II Flyover...................................................................4-96
Table 4.2.19 Construction planning for Tegal Gede Flyover ...................................................................4-98
Table 4.2.20 Construction planning for Jalan Bali Overpass Bridge......................................................4-100
Table 4.2.21 Construction planning for Jalan Imam Bonjol Bridge .......................................................4-102
Table 4.2.22 Comparison of Underpass Structure under Intersection
(Semanggi, Kuningan and Katamso ) ................................................................................4-104
Table 4.2.23 Construction planning for Sumanggi Junction ..................................................................4-106
Table 4.2.24 Construction planning for Kuningan Underpass................................................................4-108
Table 4.2.25 Construction planning for Katamso Underpass .................................................................4-110
Table 4.2.26 Preferable Pilling Method..................................................................................................4-112
Table 4.2.27 Result of study on obstructive materials............................................................................4-116
Table 5.1.1 Recent DGH’s Large Road Projects (with Japanese ODA Loans) ........................................5-3
Table 5.4.1 Base Reference Performance for Construction Period Calculation .......................................5-7
Table 5.5.1 Responsibility for Each SNVT under Balai...........................................................................5-8
Table 5.5.2 Budget for Maintenance and Construction ............................................................................5-9
Table 5.5.3 Road Conditions in National Roads (2009) .........................................................................5-10
Table 5.5.4 Bridge Conditions in National Roads (as of 5 January 2010)..............................................5-10
Table 5.5.5 Maintenance Cost Estimate .................................................................................................5-11
Preparatory Survey for Metropolitan Arterial Road Improvement Project Final Report
P-8
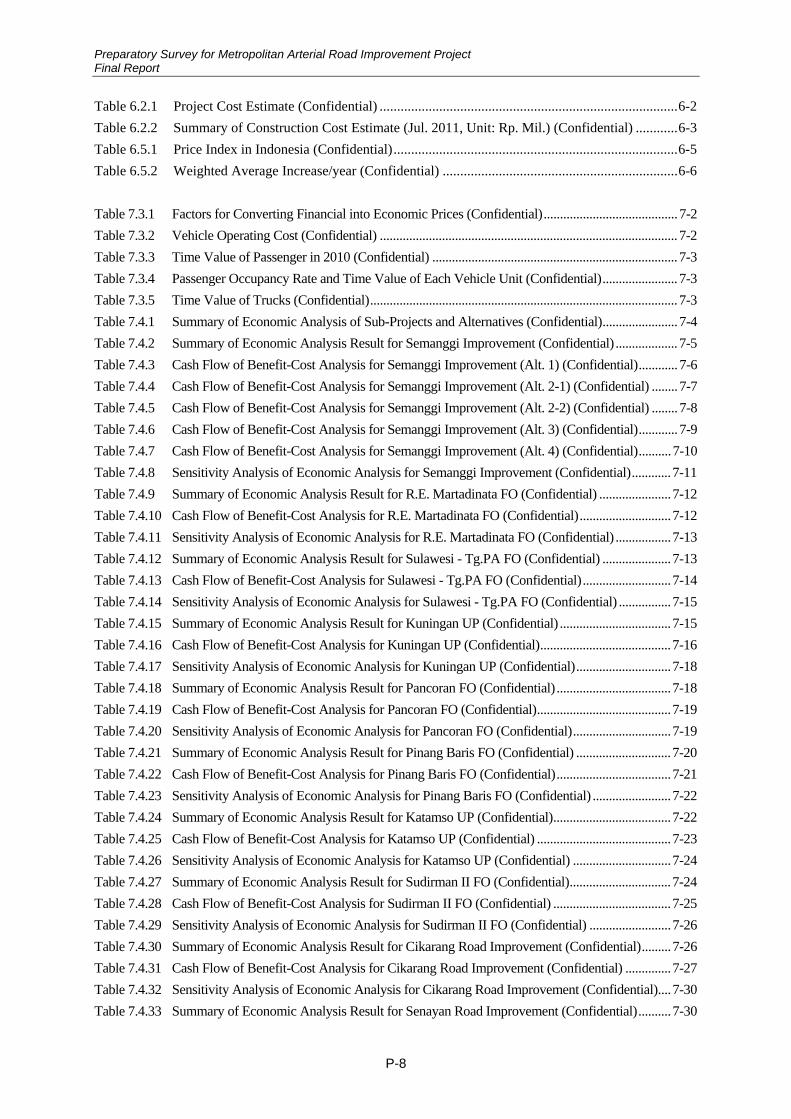
Table 6.2.1 Project Cost Estimate (Confidential) .....................................................................................6-2
Table 6.2.2 Summary of Construction Cost Estimate (Jul. 2011, Unit: Rp. Mil.) (Confidential) ............6-3
Table 6.5.1 Price Index in Indonesia (Confidential).................................................................................6-5
Table 6.5.2 Weighted Average Increase/year (Confidential) ...................................................................6-6
Table 7.3.1 Factors for Converting Financial into Economic Prices (Confidential)......................................... 7-2
Table 7.3.2 Vehicle Operating Cost (Confidential) ........................................................................................... 7-2
Table 7.3.3 Time Value of Passenger in 2010 (Confidential) ........................................................................... 7-3
Table 7.3.4 Passenger Occupancy Rate and Time Value of Each Vehicle Unit (Confidential)....................... 7-3
Table 7.3.5 Time Value of Trucks (Confidential).............................................................................................. 7-3
Table 7.4.1 Summary of Economic Analysis of Sub-Projects and Alternatives (Confidential)....................... 7-4
Table 7.4.2 Summary of Economic Analysis Result for Semanggi Improvement (Confidential) ................... 7-5
Table 7.4.3 Cash Flow of Benefit-Cost Analysis for Semanggi Improvement (Alt. 1) (Confidential)............ 7-6
Table 7.4.4 Cash Flow of Benefit-Cost Analysis for Semanggi Improvement (Alt. 2-1) (Confidential) ........ 7-7
Table 7.4.5 Cash Flow of Benefit-Cost Analysis for Semanggi Improvement (Alt. 2-2) (Confidential) ........ 7-8
Table 7.4.6 Cash Flow of Benefit-Cost Analysis for Semanggi Improvement (Alt. 3) (Confidential)............ 7-9
Table 7.4.7 Cash Flow of Benefit-Cost Analysis for Semanggi Improvement (Alt. 4) (Confidential)..........7-10
Table 7.4.8 Sensitivity Analysis of Economic Analysis for Semanggi Improvement (Confidential)............7-11
Table 7.4.9 Summary of Economic Analysis Result for R.E. Martadinata FO (Confidential) ......................7-12
Table 7.4.10 Cash Flow of Benefit-Cost Analysis for R.E. Martadinata FO (Confidential)............................7-12
Table 7.4.11 Sensitivity Analysis of Economic Analysis for R.E. Martadinata FO (Confidential) .................7-13
Table 7.4.12 Summary of Economic Analysis Result for Sulawesi - Tg.PA FO (Confidential) .....................7-13
Table 7.4.13 Cash Flow of Benefit-Cost Analysis for Sulawesi - Tg.PA FO (Confidential)...........................7-14
Table 7.4.14 Sensitivity Analysis of Economic Analysis for Sulawesi - Tg.PA FO (Confidential) ................7-15
Table 7.4.15 Summary of Economic Analysis Result for Kuningan UP (Confidential) ..................................7-15
Table 7.4.16 Cash Flow of Benefit-Cost Analysis for Kuningan UP (Confidential)........................................7-16
Table 7.4.17 Sensitivity Analysis of Economic Analysis for Kuningan UP (Confidential).............................7-18
Table 7.4.18 Summary of Economic Analysis Result for Pancoran FO (Confidential) ...................................7-18
Table 7.4.19 Cash Flow of Benefit-Cost Analysis for Pancoran FO (Confidential).........................................7-19
Table 7.4.20 Sensitivity Analysis of Economic Analysis for Pancoran FO (Confidential)..............................7-19
Table 7.4.21 Summary of Economic Analysis Result for Pinang Baris FO (Confidential) .............................7-20
Table 7.4.22 Cash Flow of Benefit-Cost Analysis for Pinang Baris FO (Confidential)...................................7-21
Table 7.4.23 Sensitivity Analysis of Economic Analysis for Pinang Baris FO (Confidential) ........................7-22
Table 7.4.24 Summary of Economic Analysis Result for Katamso UP (Confidential)....................................7-22
Table 7.4.25 Cash Flow of Benefit-Cost Analysis for Katamso UP (Confidential) .........................................7-23
Table 7.4.26 Sensitivity Analysis of Economic Analysis for Katamso UP (Confidential) ..............................7-24
Table 7.4.27 Summary of Economic Analysis Result for Sudirman II FO (Confidential)...............................7-24
Table 7.4.28 Cash Flow of Benefit-Cost Analysis for Sudirman II FO (Confidential) ....................................7-25
Table 7.4.29 Sensitivity Analysis of Economic Analysis for Sudirman II FO (Confidential) .........................7-26
Table 7.4.30 Summary of Economic Analysis Result for Cikarang Road Improvement (Confidential).........7-26
Table 7.4.31 Cash Flow of Benefit-Cost Analysis for Cikarang Road Improvement (Confidential) ..............7-27
Table 7.4.32 Sensitivity Analysis of Economic Analysis for Cikarang Road Improvement (Confidential)....7-30
Table 7.4.33 Summary of Economic Analysis Result for Senayan Road Improvement (Confidential)..........7-30

Preparatory Survey for Metropolitan Arterial Road Improvement Project Final Report
P-9
Table 7.4.34 Cash Flow of Benefit-Cost Analysis for Senayan Road Improvement (Alt. 1) (Confidential)...7-31
Table 7.4.35 Cash Flow of Benefit-Cost Analysis for Senayan Road Improvement (Alt. 2) (Confidential)...7-32
Table 7.4.36 Cash Flow of Benefit-Cost Analysis for Senayan Road Improvement (Alt. 3) (Confidential)...7-33
Table 7.4.37 Cash Flow of Benefit-Cost Analysis for Senayan Road Improvement (Alt. 4) (Confidential)...7-34
Table 7.4.38 Cash Flow of Benefit-Cost Analysis for Senayan Road Improvement (Alt. 5)...........................7-35
Table 7.4.39 Sensitivity Analysis of Economic Analysis for Senayan Road Improvement (Confidential).....7-36
Table 8.1.1 Major Laws and Regulations regarding AMDAL .................................................................8-1
Table 8.1.2 Mandatory List for AMDAL (Flyover, Underpass and Road improvement) ........................8-2
Table 8.1.3 Indonesia’s and JICA’s Guidelines -A Comparison of Requirements- .................................8-4
Table 8.1.4 Environmental Authorized Government Agency by Project Type ........................................8-4
Table 8.2.1 Project Outline and Draft Screening......................................................................................8-6
Table 8.2.2 Evaluated Index for Project Screening ..................................................................................8-7
Table 8.2.3 Preliminary Environmental and Social Evaluation................................................................8-8
Table 8.3.1 Project Outline and Draft Screening......................................................................................8-9
Table 8.3.2 Project Outline and Draft Screening....................................................................................8-10
Table 8.3.3 Scoping Matrix (No1 Semanggi: FO)..................................................................................8-11
Table 8.3.4 Rating Reasons (No1 Semanggi: FO)..................................................................................8-12
Table 8.3.5 Scoping Matrix (No2 R.E.Martadinata: FO) .......................................................................8-13
Table 8.3.6 Rating Reasons (No2 R.E.Martadinata: FO) .......................................................................8-14
Table 8.3.7 Scoping Matrix (No3 Sulawesi- Tg.PA: FO) ......................................................................8-15
Table 8.3.8 Rating Reasons (No3 Sulawesi- Tg.PA: FO) ......................................................................8-16
Table 8.3.9 Scoping Matrix (No4 Kuningan: UP)..................................................................................8-17
Table 8.3.10 Rating Reasons (No4 Kuningan: UP)..................................................................................8-18
Table 8.3.11 Scoping Matrix (No5 Pancoran: FO)...................................................................................8-19
Table 8.3.12 Rating Reason (No5 Pancoran: FO) ....................................................................................8-20
Table 8.3.13 Scoping Matrix (No6 Pinang Baris : FO) ............................................................................8-21
Table 8.3.14 Rating Reasons (No6 Pinang Baris: FO) .............................................................................8-22
Table 8.3.15 Scoping Matrix (No7 Katamso: UP) ...................................................................................8-23
Table 8.3.16 Rating Reasons (No7 Katamso : UP) ..................................................................................8-24
Table 8.3.17 Scoping Matrix (No8 Sudirman II: FO) ..............................................................................8-25
Table 8.3.18 Rating Reasons (No8 Sudirman II : FO) .............................................................................8-26
Table 8.3.19 Scoping Matrix (No9 Cikarang: FO) ...................................................................................8-27
Table 8.3.20 Rating Reason (No9 Cikarang : FO)....................................................................................8-28
Table 8.3.21 Scoping Matrix (No10 Senayan: FO) ..................................................................................8-29
Table 8.3.22 Rating Reason (No10 Senayan: FO)....................................................................................8-30
Table 8.3.23 Recommended Survey Methodology...................................................................................8-31
Table 8.3.24 Recommended Mitigation Measures and Monitoring Plans................................................8-33
Table 8.3.25 Recommended Methodology for Stakeholder Meetings .....................................................8-35
Table 8.3.26 Schedule of Stakeholder Meeting ........................................................................................8-36
Table 8.4.1 Current Progress and Expected EIA Schedule (December, 2011).......................................8-37
Preparatory Survey for Metropolitan Arterial Road Improvement Project Final Report
P-10
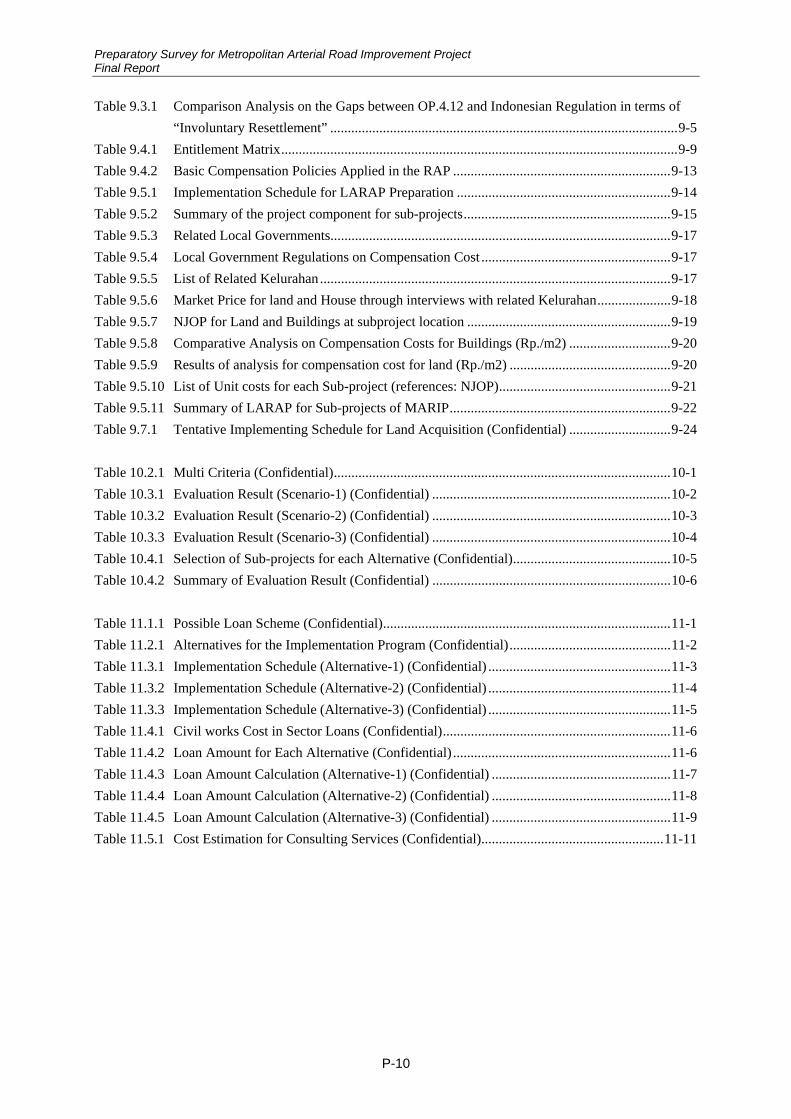
Table 9.3.1 Comparison Analysis on the Gaps between OP.4.12 and Indonesian Regulation in terms of
“Involuntary Resettlement” ...................................................................................................9-5
Table 9.4.1 Entitlement Matrix.................................................................................................................9-9
Table 9.4.2 Basic Compensation Policies Applied in the RAP ..............................................................9-13
Table 9.5.1 Implementation Schedule for LARAP Preparation .............................................................9-14
Table 9.5.2 Summary of the project component for sub-projects...........................................................9-15
Table 9.5.3 Related Local Governments.................................................................................................9-17
Table 9.5.4 Local Government Regulations on Compensation Cost ......................................................9-17
Table 9.5.5 List of Related Kelurahan....................................................................................................9-17
Table 9.5.6 Market Price for land and House through interviews with related Kelurahan.....................9-18
Table 9.5.7 NJOP for Land and Buildings at subproject location ..........................................................9-19
Table 9.5.8 Comparative Analysis on Compensation Costs for Buildings (Rp./m2) .............................9-20
Table 9.5.9 Results of analysis for compensation cost for land (Rp./m2) ..............................................9-20
Table 9.5.10 List of Unit costs for each Sub-project (references: NJOP).................................................9-21
Table 9.5.11 Summary of LARAP for Sub-projects of MARIP...............................................................9-22
Table 9.7.1 Tentative Implementing Schedule for Land Acquisition (Confidential) .............................9-24
Table 10.2.1 Multi Criteria (Confidential)................................................................................................10-1
Table 10.3.1 Evaluation Result (Scenario-1) (Confidential) ....................................................................10-2
Table 10.3.2 Evaluation Result (Scenario-2) (Confidential) ....................................................................10-3
Table 10.3.3 Evaluation Result (Scenario-3) (Confidential) ....................................................................10-4
Table 10.4.1 Selection of Sub-projects for each Alternative (Confidential).............................................10-5
Table 10.4.2 Summary of Evaluation Result (Confidential) ....................................................................10-6
Table 11.1.1 Possible Loan Scheme (Confidential)..................................................................................11-1
Table 11.2.1 Alternatives for the Implementation Program (Confidential)..............................................11-2
Table 11.3.1 Implementation Schedule (Alternative-1) (Confidential) ....................................................11-3
Table 11.3.2 Implementation Schedule (Alternative-2) (Confidential) ....................................................11-4
Table 11.3.3 Implementation Schedule (Alternative-3) (Confidential) ....................................................11-5
Table 11.4.1 Civil works Cost in Sector Loans (Confidential).................................................................11-6
Table 11.4.2 Loan Amount for Each Alternative (Confidential) ..............................................................11-6
Table 11.4.3 Loan Amount Calculation (Alternative-1) (Confidential) ...................................................11-7
Table 11.4.4 Loan Amount Calculation (Alternative-2) (Confidential) ...................................................11-8
Table 11.4.5 Loan Amount Calculation (Alternative-3) (Confidential) ...................................................11-9
Table 11.5.1 Cost Estimation for Consulting Services (Confidential)....................................................11-11

Preparatory Survey for Metropolitan Arterial Road Improvement Project Final Report
P-11
LIST OF FIGURES Page
Figure 1.1.1 Major Industrial Parks in JABODETABEK ........................................................................1-2
Figure 1.1.2 Annual Road Sector Budget.................................................................................................1-2
Figure 1.2.1 Flyover and Underpass in UARI Project..............................................................................1-3
Figure 1.3.1 General Study Flow .............................................................................................................1-5
Figure 1.3.2 General Study Flow ............................................................................................................1-7
Figure 1.3.3 Selection Flow in the 1st Stage ............................................................................................1-8
Figure 1.3.4 Evaluation Flow in the 2nd Stage ........................................................................................1-9
Figure 2.2.1 Location Map of Semanggi Intersection ..............................................................................2-3
Figure 2.2.2 Photos of Semanggi Intersection..........................................................................................2-4
Figure 2.2.3 Location Map of Margonda Cinere Intersection ..................................................................2-5
Figure 2.2.4 Photos of Margonda-Cinere Intersection .............................................................................2-6
Figure 2.2.5 Location Map of Cililitan Intersection .................................................................................2-7
Figure 2.2.6 Photos of Cililitan Intersection.............................................................................................2-8
Figure 2.2.7 Location Map of R.E. Martadinata Intersection...................................................................2-9
Figure 2.2.8 Photos of R.E Martadinata Intersection .............................................................................2-10
Figure 2.2.9 Location Map of Sulawesi - Tg.PA Intersection................................................................2-11
Figure 2.2.10 Photos of Sulawesi – Tg. Priok Access Intersection ..........................................................2-11
Figure 2.2.11 Location Map of Latumentan Intersection .........................................................................2-12
Figure 2.2.12 Photos of Latumenten Intersection.....................................................................................2-13
Figure 2.2.13 Location Map of Sudirman - Daan Mogot Intersection .....................................................2-14
Figure 2.2.14 Photos of Sudirman – Daan Mogot Intersection ................................................................2-15
Figure 2.2.15 Location Map of Kuningan Intersection ............................................................................2-16
Figure 2.2.16 Photos of Kuningan Intersection........................................................................................2-17
Figure 2.2.17 Location Map of Pancoran Intersection .............................................................................2-18
Figure 2.2.18 Photos of Pancoran Intersection.........................................................................................2-19
Figure 2.2.19 Location Map of Cilandak Intersection..............................................................................2-20
Figure 2.2.20 Photos of Cilandak Intersection .........................................................................................2-21
Figure 2.2.21 Location Map of Fatmawati Intersection ...........................................................................2-22
Figure 2.2.22 Photos of Fatmawati Intersection.......................................................................................2-22
Figure 2.2.23 Photos of Location Map of Ciawi - Bogor Intersection .....................................................2-23
Figure 2.2.24 Photos of Ciawi –Bogor Intersection .................................................................................2-24
Figure 2.2.25 Location Map of Pinang Baris Intersection........................................................................2-25
Figure 2.2.26 Photos of Pinang Baris Intersection ...................................................................................2-25
Figure 2.2.27 Location Map of Asrama - Gatot Subroto Intersection......................................................2-26
Figure 2.2.28 Photos of Asrama-Gatot Subroto Intersection ...................................................................2-27
Figure 2.2.29 Location Map of Katamso Intersection..............................................................................2-27
Figure 2.2.30 Photos of Katamso Intersection .........................................................................................2-28
Figure 2.2.31 Location Map of Sudirman II Intersection.........................................................................2-29

Preparatory Survey for Metropolitan Arterial Road Improvement Project Final Report
P-12
Figure 2.2.32 Photos of Sudirman II Intersection ....................................................................................2-29
Figure 2.2.33 Location Map of Cikarang Area ........................................................................................2-30
Figure 2.2.34 Photos of Cikarang Area ....................................................................................................2-31
Figure 2.2.35 Location Map of Senayan Intersection...............................................................................2-32
Figure 2.2.36 Photos of Senayan Intersection ..........................................................................................2-33
Figure 3.3.1 SITRAMP Demand Forecast Flow ......................................................................................3-8
Figure 3.3.2 Traffic Analysis Zone System..............................................................................................3-9
Figure 3.3.3 Computerized Transportation Network (Example of Central Jakarta).................................3-9
Figure 3.3.4 Number of Regitered Vehicles in Jakarta, Depok, Tangerang and Bekasi ........................3-10
Figure 3.3.5 Road Network for Traffic Assignment (2030 Case2) ........................................................3-11
Figure 3.3.6 Road Network Assignment Result (2010 Case 0)..............................................................3-12
Figure 3.3.7 Road Network Assignment Result (2030 Case2)...............................................................3-12
Figure 3.4.1 Hourly Traffic Volume at Semanggi..................................................................................3-14
Figure 3.4.2 Hourly Turning Movements at Semanggi..........................................................................3-15
Figure 3.4.3 Comparison of Survey and Simulation Results..................................................................3-16
Figure 3.4.4 Alternative 1: Flyover on Jl. Gatot Subroto .......................................................................3-17
Figure 3.4.5 Screenshots of Dynamic Simulation: Alternative 1 ...........................................................3-17
Figure 3.4.6 Alternative 2-1: New Exclusive Lane on Jl. Sudirman ......................................................3-18
Figure 3.4.7 Screenshots of Dynamic Simulation: Alternative 2-1........................................................3-19
Figure 3.4.8 Alternative 2-2: New Exclusive Lane on Jl. Sudirman ......................................................3-20
Figure 3.4.9 Screenshots of Dynamic Simulation: Alternative 2-2........................................................3-21
Figure 3.4.10 Alternative 3: New Slow Lane on Jl. Sudirman.................................................................3-22
Figure 3.4.11 Screenshots of Dynamic Simulation: Alternative 3 ...........................................................3-23
Figure 3.4.12 Alternative 4: New Flyover Ramps....................................................................................3-23
Figure 3.4.13 Screenshots of Dynamic Simulation: Alternative 4 ...........................................................3-24
Figure 3.4.14 Traffic Flow and Daily Volume at Two Continuous Intersections in Kuningan ...............3-26
Figure 3.4.15 Traffic Survey Location and Daily Major Traffic Flow in Cikarang Area ........................3-28
Figure 3.4.16 Major Potential Traffic to be Diverted to Sub-Project Roads in Cikarang ........................3-30
Figure 3.4.17 Alternatives 1 & 2: FO/UP Connecting Jl. Pattimura and Jl. Sudirman ............................3-32
Figure 3.4.18 Alternative 3: At-Grade Four-Leg Intersection..................................................................3-32
Figure 3.4.19 Alternative 4: FO and UP around Roundabout ..................................................................3-33
Figure 3.4.20 Alternative 5: UP Bypassing the Roundabout....................................................................3-33
Figure 3.4.21 Traffic Flow and Daily Volume at R.E. Martadinata Intersection .....................................3-34
Figure 3.4.22 Traffic Flow and Daily Volume at Sulawesi - Tg.PA Intersection ....................................3-35
Figure 3.4.23 Traffic Flow and Daily Volume at Pancoran Intersection .................................................3-36
Figure 3.4.24 Traffic Flow and Daily Volume at Pinang Baris Intersection............................................3-37
Figure 3.4.25 Traffic Flow and Daily Volume at Katamso Intersection ..................................................3-38
Figure 3.4.26 Traffic Flow and Daily Volume at Sudirman II Intersection .............................................3-39
Figure 4.1.1 Vertical and Horizontal Clearance for Roads ......................................................................4-3
Figure 4.1.2 Image of Improvement for Semanggi Intersection Alternative 2.........................................4-6
Figure 4.1.3 Image of Improvement for Semanggi Intersection Alternative 3.........................................4-6

Preparatory Survey for Metropolitan Arterial Road Improvement Project Final Report
P-13
Figure 4.1.4 Plan of Improvement for Margonda Cinere .........................................................................4-7
Figure 4.1.5 Plan of Improvement for Cililitan ........................................................................................4-8
Figure 4.1.6 Plan of Improvement for R.E. Martadinata..........................................................................4-9
Figure 4.1.7 Plan of Improvement for Sulawesi - Tg.PA.......................................................................4-10
Figure 4.1.8 Plan of Improvement for Latumentan ................................................................................4-11
Figure 4.1.9 Plan of Improvement for Sudirman - Daan Mogot ............................................................4-12
Figure 4.1.10 Plan of Improvement for Kuningan ...................................................................................4-13
Figure 4.1.11 Plan of Improvement for Pancoran ....................................................................................4-14
Figure 4.1.12 Plan of Improvement for Cilandak.....................................................................................4-15
Figure 4.1.13 Plan of Improvement for Fatmawati ..................................................................................4-16
Figure 4.1.14 Road Development Plan (Ciawi) .......................................................................................4-17
Figure 4.1.15 Plan of Improvement for Ciawi – Bogor............................................................................4-17
Figure 4.1.16 Plan of Improvement for Pinang Baris...............................................................................4-18
Figure 4.1.17 Plan of Improvement for Asrama - Gatot Subroto .............................................................4-19
Figure 4.1.18 Plan of Improvement for Katamso.....................................................................................4-20
Figure 4.1.19 Plan of Improvement for Sudirman II ................................................................................4-21
Figure 4.1.20 Plan of Improvement for Cikarang ....................................................................................4-23
Figure 4.1.21 Plan of Improvement for Jl. Bali-Cibitung.........................................................................4-23
Figure 4.1.22 Plan of Improvement for Jl. Imam Bonjol 4 ......................................................................4-24
Figure 4.1.23 Plan of Improvement Dry Port Access Road .....................................................................4-24
Figure 4.1.24 Plan of Improvement for Senayan......................................................................................4-25
Figure 4.1.25 Plan of Alternative 1 ..........................................................................................................4-28
Figure 4.1.26 Plan of Alternative 2-1 .......................................................................................................4-28
Figure 4.1.27 Plan of Alternative 2-2 .......................................................................................................4-29
Figure 4.1.28 Plan of Alternative 3 ..........................................................................................................4-30
Figure 4.1.29 Plan of Alternative 4 ..........................................................................................................4-30
Figure 4.1.30 Typical Cross Section of New Ramp of Semanggi Intersection ........................................4-33
Figure 4.1.31 Plan of Semanggi Intersection ...........................................................................................4-33
Figure 4.1.32 Typical Cross Section of R.E.Martadinata Flyover ...........................................................4-34
Figure 4.1.33 Plan of R.E.Martadinata Flyover .......................................................................................4-35
Figure 4.1.34 Typical Cross Section of Sulawesi Flyover .......................................................................4-38
Figure 4.1.35 Plan of Sulawesi Flyover ...................................................................................................4-38
Figure 4.1.36 Typical Cross Section of Kuningan ...................................................................................4-41
Figure 4.1.37 Plan of Kuninagan Underpass............................................................................................4-42
Figure 4.1.38 Typical Cross Section of Pancoran Flyover.......................................................................4-45
Figure 4.1.39 Plan of Pancoran Flyover ...................................................................................................4-46
Figure 4.1.40 Typical Cross Section of Pinang Baris Flyover .................................................................4-49
Figure 4.1.41 Plan of Pinang Baris Flyover .............................................................................................4-49
Figure 4.1.42 Typical Cross Section of Katamso Underpass ...................................................................4-53
Figure 4.1.43 Plan of Katamso Underpass ...............................................................................................4-53
Figure 4.1.44 Typical Cross Section of Sudirman II Flyover...................................................................4-57
Figure 4.1.45 Plan of Sudirman II Flyover...............................................................................................4-57
Figure 4.1.46 Plan of Cikarang.................................................................................................................4-60

Preparatory Survey for Metropolitan Arterial Road Improvement Project Final Report
P-14
Figure 4.1.47 Plan of Dry Port Access Road............................................................................................4-61
Figure 4.1.48 Typical Cross Section of Jl. Kalimarang............................................................................4-61
Figure 4.1.49 Typical Cross Section of Tegal Gede Flyover ...................................................................4-62
Figure 4.1.50 Typical Cross Section of Overpass Bridge on Cikampek Toll Road on Jl. Bali ................4-62
Figure 4.1.51 Typical Cross Section of New Bridge on Jl. Iman Bonjol .................................................4-63
Figure 4.1.52 Plan of Alternative 1 and 2.................................................................................................4-64
Figure 4.1.53 Plan of Alternative 3 ..........................................................................................................4-65
Figure 4.1.54 Plan of Alternative 4 ..........................................................................................................4-66
Figure 4.1.55 Plan of Alternative 5 ..........................................................................................................4-66
Figure 4.1.56 Profile of MRT...................................................................................................................4-67
Figure 4.2.1 Determining Vertical Clearance.........................................................................................4-71
Figure 4.2.2 Typical Cross Section of Bridge Structure (PC-U Girder).................................................4-72
Figure 4.2.3 Typical Cross Section of Underpass Structure...................................................................4-73
Figure 4.2.4 Typical Side View of Simple PC Girder Bridge ................................................................4-74
Figure 4.2.5 Flowchart for Planning of Flyover (Bridge) Structure.......................................................4-75
Figure 4.2.6 Flowchart for Selection of Precast Girder Type.................................................................4-77
Figure 4.2.7 Kuningan Intersection ........................................................................................................4-80
Figure 4.2.8 Sheet Piled Cofferdams for Substructure for Overpasses ................................................4-111
Figure 4.2.9 Erection girder for Precast girders ...................................................................................4-113
Figure 4.2.10 Erection of Precast PC girders by Mobile Crane .............................................................4-113
Figure 4.2.11 Picture of Construction for PC Sheet pile and PC-U girder.............................................4-114
Figure 4.2.12 All Staging System for Post-tensioned PC Box Girder....................................................4-115
Figure 5.1.1 Organization of Directorate General of Highways...............................................................5-2
Figure 5.4.1 Required Construction Period ..............................................................................................5-6
Figure 5.5.1 Organization Chart for Balai System ...................................................................................5-7
Figure 5.5.2 Budget for Construction, Maintenance and Others ..............................................................5-9
Figure 5.5.3 Road Conditions of National Roads...................................................................................5-10
Figure 5.5.4 Bridge Conditions of DKI (2010) ......................................................................................5-11
Figure 6.5.1 Various Price Indices in Indonesia (Confidential) ...............................................................6-6
Figure 8.1.1 Law-Based EIA Approval Procedures .................................................................................8-3
Figure 8.1.2 Organization Chart regarding Environmental Activities......................................................8-5

Preparatory Survey for Metropolitan Arterial Road Improvement Project Final Report
1-1
CHAPTER 1. INTRODUCTION
1.1 Background 1.1.1 Status of Study Area
The population of JABODETABEK increased l.4 times over the past 15 years, from approximately 17 million in 1990 to 24 million in 2005 (an average of approx. 2% per year). The population of JABODETABEK and Medan has significantly increased. Along with this increase in population, the volume of traffic from the areas around JABODETABEK has been growing steadily, and a further increase in the volume of traffic is being predicted. The volume of movement in JABODETABEK is already significant, and it is highly dependent on road transportation (98%). The number of registered motor vehicles in JABODETABEK increased approx. 2.4 times from approx. 3.26 million in 2000 to 7.97 million in 2006, which raised concerns about further traffic congestion.
Recently, countermeasures for traffic congestion have been conducted such as Jakarta Outer Ring Road, enhancement of road capacity, and a traffic demand management policy, but traffic congestion in this area is still a serious issue and causes significant economic and natural/social environmental losses through the deterioration of the investment environment or the delay of access to the port, airport and railway. To improve the above issues at candidate subprojects described detail in chapter-2, the improvement of bottleneck is required.
On the other hand, Medan is the fourth largest city in Indonesia with a population of approximately 2.1 million in 2009, and it is the largest in Sumatra Island. It is highly dependent on road transportation, and the number of registered motor vehicles in Medan is about 2.7 million in 2009, of which 85% is motorcycle. Thus, the number of registered motor vehicles is larger than the population, and it is further increasing at a rate of 11% per year. In major intersections such as Katamso, Pinang Baris, Pos, Sisingamangaraja, Amplas, Juanda, Aksara, and Setiabudi, the average volume-to-capacity (V/C) ratio reaches 0.8 on weekdays. Traffic congestion is unavoidable in Medan, and it has become a serious issue on the arterial roads in the city.
According to the GOI’s Midterm Development Plan PPJM (2010-2014), the increase of transportation capacity is required and this project, for improving the road capacity in JABODETABEK and Medan is highly prioritized.
1.1.2 Economic Activities
There are many bottlenecks in JABODETABEK because serious traffic congestion occurs at large-scale intersections and expressway ramps due to booming economic activities. Also major logistics in JABODETABEK occur from/to industrial zones which are located at Jakarta port and the along the toll road from Jakarta to the suburban areas, therefore, congestion tends to take place at major intersections on the logistic route. Major industrial parks in JABODETABEK are shown in Figure 1.1.1.
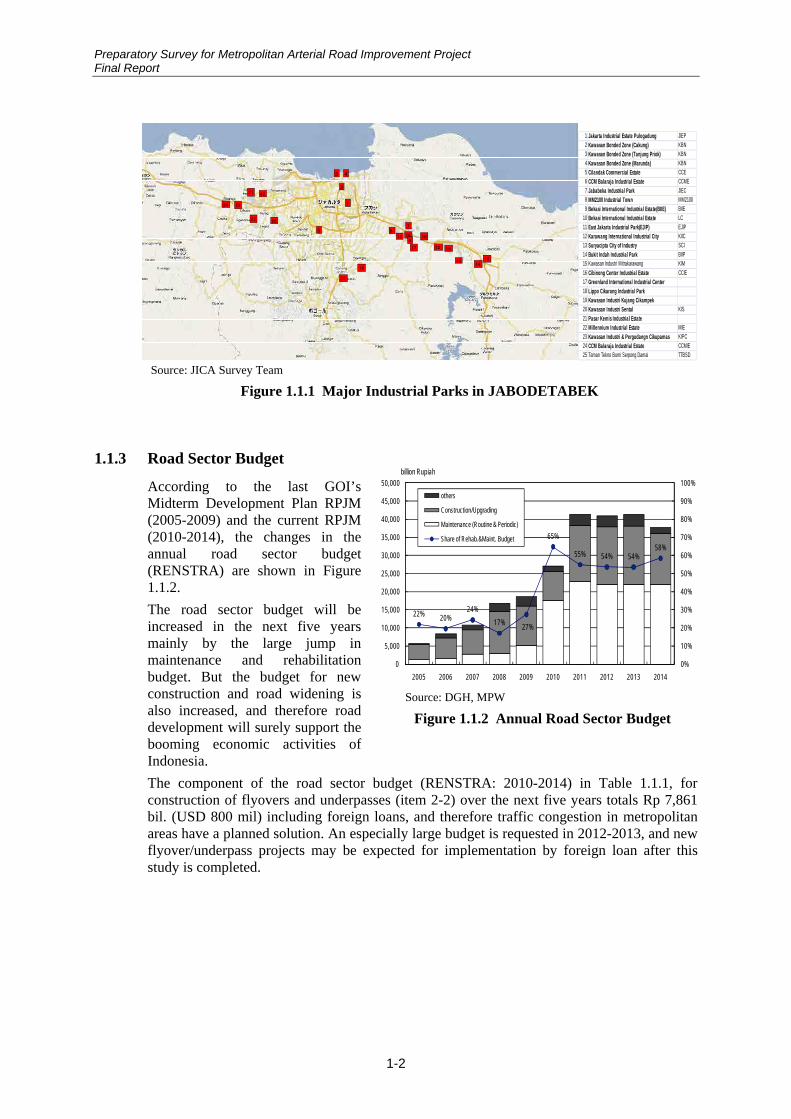
Preparatory Survey for Metropolitan Arterial Road Improvement Project Final Report
1-2
1
2
5
3 4
21
78
1011
12
1314
16
17
18
18
20
22
24 23
25
9
15
42
1 Jakarta Industrial Estate Pulogadung JIEP2 Kawasan Bonded Zone (Cakung) KBN3 Kawasan Bonded Zone (Tanjung Priok) KBN4 Kawasan Bonded Zone (Marunda) KBN5 Cilandak Commercial Estate CCE6 CCM Balaraja Industrial Estate CCME7 Jababeka Industrial Park JIEC8 MM2100 Industrial Town MM21009 Bekasi International Industrial Estate(BIIE) BIIE
10 Bekasi International Industrial Estate LC11 East Jakarta Industrial Park(EJIP) EJIP12 Karawang International Industrial City KIIC13 Suryacipta City of Industry SCI14 Bukit Indah Industrial Park BIIP15 Kawasan Industri Mitrakarawang KIM16 Cibinong Center Industrial Estate CCIE17 Greenland International Industrial Center18 Lippo Cikarang Industrial Park19 Kawasan Industri Kujang Cikampek20 Kawasan Industri Sentul KIS21 Pasar Kemis Industrial Estate22 Millennium Industrial Estate MIE23 Kawasan Industri & Pergudangn Cikupamas KIPC24 CCM Balaraja Industrial Estate CCMIE25 Taman Tekno Bumi Serpong Damai TTBSD
Source: JICA Survey Team
Figure 1.1.1 Major Industrial Parks in JABODETABEK
1.1.3 Road Sector Budget
According to the last GOI’s Midterm Development Plan RPJM (2005-2009) and the current RPJM (2010-2014), the changes in the annual road sector budget (RENSTRA) are shown in Figure 1.1.2.
The road sector budget will be increased in the next five years mainly by the large jump in maintenance and rehabilitation budget. But the budget for new construction and road widening is also increased, and therefore road development will surely support the booming economic activities of Indonesia.
The component of the road sector budget (RENSTRA: 2010-2014) in Table 1.1.1, for construction of flyovers and underpasses (item 2-2) over the next five years totals Rp 7,861 bil. (USD 800 mil) including foreign loans, and therefore traffic congestion in metropolitan areas have a planned solution. An especially large budget is requested in 2012-2013, and new flyover/underpass projects may be expected for implementation by foreign loan after this study is completed.
22% 20%24%
17% 27%
65%
55% 54% 54%58%
0%
10%
20%
30%
40%
50%
60%
70%
80%
90%
100%
0
5,000
10,000
15,000
20,000
25,000
30,000
35,000
40,000
45,000
50,000
2005 2006 2007 2008 2009 2010 2011 2012 2013 2014
billion Rupiah
others
Construction/Upgrading
Maintenance (Routine & Periodic)
Share of Rehab.&Maint. Budget
Source: DGH, MPW
Figure 1.1.2 Annual Road Sector Budget

Preparatory Survey for Metropolitan Arterial Road Improvement Project Final Report
1-3
Table 1.1.1 Component of Road Sector Budget (RENSTRA: 2010-2014) Budget (Billion IDR)
Program Total 2010-2014
2010 2011 2012 2013 2014
Total (A+B+C) (Preservation + Construction) 188,339.37 27,097.35 41,384.45 39,210.15 41,210.84 37,787.25A. Kegiatan Preservasi/ Preservation 106,292.72 17,541.34 22,692.93 21,919.36 22,051.16 22,087.93
1 Presevasi Jalan/ Road Preservation 78,393.47 12,567.54 16,961.57 16,188.00 16,319.79 16,356.571-1 Pemeliharaan Jalan
Maintenance1 6,920.75 1,336.14 1,398.89 1,392.74 1,391.97 1,401.02
1-2 Rehabilitasi/ Berkala Jalan Rehabilitation/ Periodic
36,756.28 6,146.58 7,589.07 7,673.54 7,673.54 7,673.54
1-3 Rekonstruksi/ Peningkatan Struktur Jalan Reconstruction/ Improvement (incl. loan)
32,716.44 4,784.82 7,623.61 6,721.72 6,804.28 6,782.01
1-4 Pananganan Tanggap Darurat Emergency Response
2,000.00 300.00 350.00 400.00 450.00 500.00
2 Preservasi Jembatan/ Bridge Preservation 27,899.25 4,973.80 5,731.36 5,731.36 5,731.36 5,731.36
2-1 Pemeliharaan Jembatan Maintenance
6,687.82 1,222.91 1,366.23 1,366.23 1,366.23 1,366.23
2-2 Rehabilitasi/ Berkala Jembatan Rehabilitation/ Periodic
9,091.37 1,572.58 1,879.70 1,879.70 1,879.70 1,879.70
2-3 Penggantian Jembatan Replacement
12,120.06 2,178.32 2,485.44 2,485.44 2,485.44 2,485.44
B. Pembangunan/ Construction 74,178.94 8,285.60 17,042.20 17,290.78 17,510.36 14,050.001 Pembangunan Jalan/ Road Development 48,827.66 5,147.74 11,252.01 11,342.67 11,168.37 9,916.87
1-1 Pelebaran Jalan Widening (incl. Loan)
43,159.47 3,354.61 9,498.19 10,184.56 10,526.03 9,596.07
1-2 Jalan Lingkar/ Bypass Ring Road/ Bypass
1,107.00 32.00 135.00 324.40 378.80 236.80
1-3 Pembangunan Jalan Construction (incl. Loan)
4,561.19 1,761.13. 1,618.81 833.71 263.54 84.00
2 Pembangunan Jembatan/ Bridge Construction 11,208.28 1,442.368 2,335.33 2,594.79 2,800.47 2,035.00
2-1 Pembangunan Jembatan Construction (incl. Loan)
3,147.25 467.25 675.23 676.29 671.47 657.00
2-2 Pembangunan Flyover/ Underpass Flyover/ Underpass (incl. Loan)
7,861.03 875.43 1,560.10 1,918.50 2,129.00 1,378.00
2-3 Pembangunan Terowongan Tunnel 200.00 100.00 100.00 - - -2 Jalan/ Jembatan Strategis/ Road/ Bridge Strategic 9,813.50 1,421.00 2,098.13 2,098.13 2,098.13 2,098.13
3 Non Fisik (Konsultan, Alat, Training DLL) / Consultant, Equipment, Training
4,329.51 274.18 1,356.73 1,255.20 1,443.40 -
C. Pembinaan/ Administration 7,867.70 1,270.41 1,649.32 1,649.32 1,649.32 1,649.32 Source: RENSTRA: 2010-2014
1.2 Objective 1.2.1 The Past Projects
As mentioned in the section on the background, road traffic congestion in JABODETABEK has continued for more than a decade. Therefore the Urban Arterial Road Improvement Project (UARI, 1998-2008) was implemented under JBIC Loan to construct flyovers and underpasses at 12 intersections and railway crossings in this area.
Source: JICA Survey Team
Figure 1.2.1 Flyover and Underpass in UARI Project

Preparatory Survey for Metropolitan Arterial Road Improvement Project Final Report
1-4
1.2.2 Objective of the Study
The objective and outcome of this study are summarized in Table 1.2.1 and new projects which are similar to the past projects are expected for implementation after this study is completed.
Table 1.2.1 Objective of the Study
Overall Goal
Sustainable growth through private sector initiative can be realized by the expansion
of investment opportunities, and economic growth can be generated from the
improvement of road traffic infrastructure.
Project Goal
Alleviation of the traffic congestion at heavily congested intersections and railway
crossings on major road networks in JABODETABEK and Medan can be realized by
construction of grade separated intersections and other countermeasures.
Project Area
Original potential projects : JABODETABEK 12 places
Medan (North Sumatra) 2 places
Additional potential projects:will be added based on the interviews with related
entities
Counterpart
Agency Directorate General of Highway, Ministry of Public Works : DGH, MPW
Study
Objective
To conduct Feasibility Studies on grade separation and other countermeasures at
congested intersections and railway crossings on major road networks in
JABODETABEK and Medan
To confirm the necessity and reasonability of loan projects and to prepare several
project implementations from the technical, economic/financial, environmental/social
view points
Expected
Outcome
Based on the implementation program prepared in this study, new projects similar to
the past projects will be realized and bottlenecks of major road networks in
JABODETABEK and Medan will be alleviated.
Source: JICA Survey Team

Preparatory Survey for Metropolitan Arterial Road Improvement Project Final Report
1-5
1.3 Methodology 1.3.1 Study Flow
This study generally consists of two stages as shown in Figure 1.3.1., and the detail of each stage is summarized in Figure 1.3.3-Figure 1.3.4.
The 1st stage: Selection of Sub-projects
From all potential projects, 14 original potential projects in MD and additional potential projects based on interviews with the private sector, the study team will select a maximum of 10 potential projects as Sub-projects which go into the 2nd stage.
The 2nd stage: Evaluation of Sub-projects
With the result of surveys (topo-, geo-, traffic) for selected Sub-projects, the study team conducts basic design, cost estimation and EIRR for each sub-project. Then all sub-projects are evaluated and ranked by using multi criteria analysis which was set in the 1st stage.
Source: JICA Survey Team
Figure 1.3.1 General Study Flow
14 original potential projects + additional potential projects = potential projects
Selection of max.10 potential projects as Sub-projects for the 2nd stage
Evaluation of all sub projects for loan preparation
The 1st stage
The 2nd stage
14 original potential projects in MD by (MPW & JICA)
Interview with private sector

Preparatory Survey for Metropolitan Arterial Road Improvement Project Final Report
1-6
1.3.2 Study Members and Flow Chart
The study members and assignments are listed in Table 1.3.1, and the study flow chart is summarized in Figure 1.3.2.
Table 1.3.1 Members of the Study Team Name Assignment
Mr. Yuichi WAKITA Team Leader Dr. Sadayuki YAGI Transportation Planner (1) Mr. Takayoshi ITO Transportation Planner (2) Mr. Tsuyoshi NAKAJIMA Highways and Intersections Mr. Masataka FUJIKUMA Bridges and Structures (1) Mr. Yusuke SUZUKI Bridges and Structures (2) Mr. Haruo TAKEDA Project Cost Estimation Mr. Hironori KUROKI Natural Environment Mr. Shigeru SAI Social Environment Source: JICA Survey Team
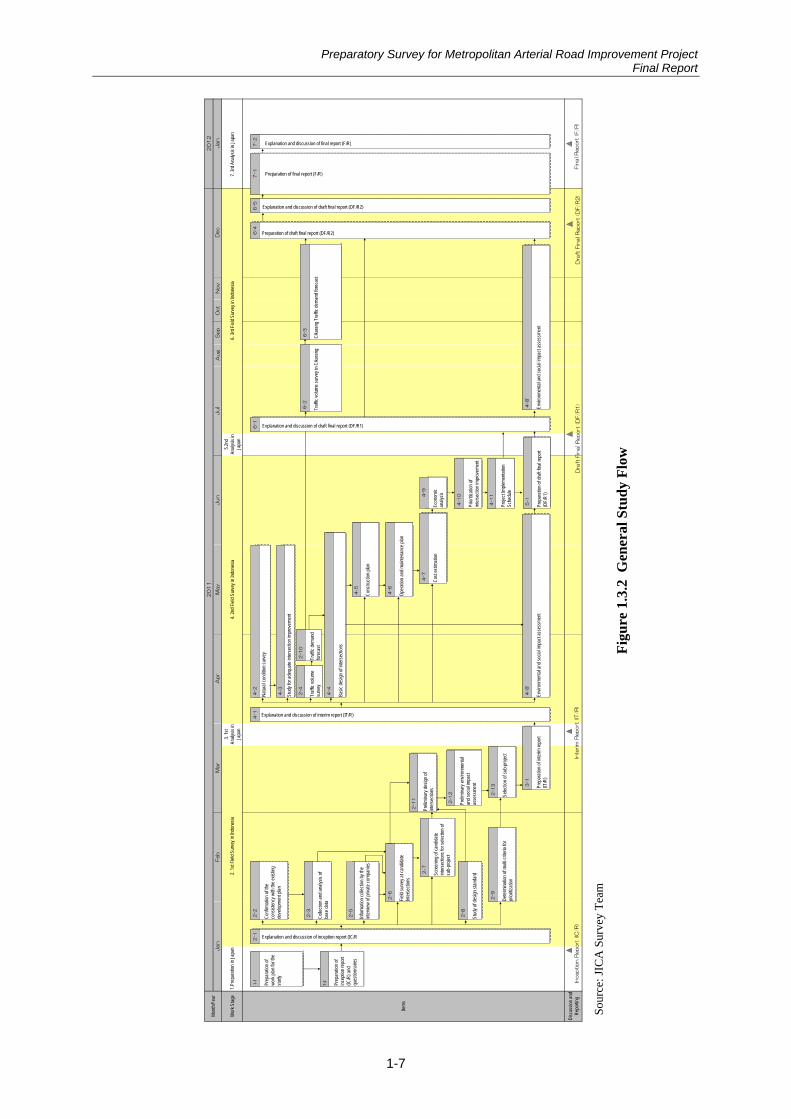
Preparatory Survey for Metropolitan Arterial Road Improvement Project Final Report
1-7
20
11
20
12
Au
gS
ep
Oct
Nov
Wor
k St
age
3. 1
stAn
alys
is in
Japa
n4.
2nd
Fie
ld S
urve
y in
Indo
nesia
5.2n
dAn
alys
is in
Japa
n6.
3rd
Fie
ld S
urve
y in
Indo
nesia
7. 3
rd A
nalys
is in
Jap
an
Disc
ussio
n an
dRe
porti
ng
Jan
Dec
May
Ju
lJu
nJan
Mar
Ap
r
Item
s
Feb
2. 1
st F
ield
Sur
vey
in In
done
sia
Mon
th/Y
ear
1.Pr
epar
atio
n in
Jap
an
Incep
tion
Report
(IC
/R
)
Prep
arat
ion
ofwo
rk p
lan
for t
hest
udy
1-1 Prep
arat
ion
ofin
cept
ion
repo
rt(IC
/R) a
ndqu
estio
nnai
res
1-2
Explanation and discussion of inception report (IC/R2-1
Conf
irmat
ion
of th
eco
nsist
ency
with
the
exist
ing
deve
lopm
ent p
lan
2-2
Traf
fic v
olum
esu
rvey
2-4
Info
rmat
ion
colle
ctio
n by
the
inte
rvie
w of
priv
ate
com
pani
es
2-5
Fiel
d su
rvey
at c
andi
date
Inte
rsec
tions
2-6
Stud
y of
des
ign
stan
dard
2-8
Scre
enin
g of
can
dida
tein
ters
ectio
ns fo
r sel
ectio
n of
sub-
proj
ect
2-7
Dete
rmin
atio
n of
mul
ti cr
iteria
for
prio
ritiza
tion
2-9
Traf
fic d
eman
dfo
reca
st
2-1
0
Prel
imin
ary
desig
n of
inte
rsec
tions
2-1
1
Sele
ctio
n of
sub
-pro
ject
2-1
3
Explanation and discussion of interim report (IT/R)4-1
Natu
ral c
ondi
tion
surv
ey
4-2
Stud
y fo
r ade
quat
e in
ters
ectio
n im
prov
emen
t
4-3
Basic
des
ign
of in
ters
ectio
ns
4-4
Cons
truct
ion
plan
4-5
Ope
ratio
n an
d m
aint
enan
ce p
lan
4-6
Cost
est
imat
ion
4-7
Envir
onm
enta
l and
soc
ial im
pact
ass
essm
ent
4-8
'
Econ
omic
anal
ysis4-9
Proj
ect I
mpl
emen
tatio
nSc
hedu
le
4-1
1
Explanation and discussion of draft final report (DF/R2)6-5
Explanation and discussion of final report (F/R)7-2
Preparation of final report (F/R)
7-1
Inte
rim
Report
(IT
/R
)
Prep
arat
ion
of in
terim
repo
rt(IT
/R)
3-1
Prio
ritiza
tion
ofin
ters
ectio
n im
prov
emen
t
4-1
0
Dra
ft F
inal R
eport
(D
F/R
1)
Prel
imin
ary
envir
onm
enta
lan
d so
cial im
pact
asse
ssm
ent
2-1
2
Colle
ctio
n an
d an
alys
is of
base
dat
a
2-3
Fin
al R
ep
ort
(F/R
)
Preparation of draft final report (DF/R2)6-4
Traf
fic v
olum
e su
rvey
in C
ikara
ng
6-2
Dra
ft F
inal R
eport
(D
F/R
2)
Prep
arat
ion
of d
raft
final
repo
rt(D
F/R1
)
5-1
Explanation and discussion of draft final report (DF/R1)6-1
Envir
onm
enta
l and
soc
ial im
pact
ass
essm
ent
4-8
'
Cika
rang
Tra
ffic
dem
and
fore
cast
6-3
Figu
re 1
.3.2
Gen
eral
Stu
dy F
low
So
urce
: JIC
A S
urve
y T
eam

Preparatory Survey for Metropolitan Arterial Road Improvement Project Final Report
1-8
1.3.3 Selection of Sub-projects in the 1st Stage
In the 1st stage, the Study Team will carry out interviews with representatives of the private sectors, DKI and other related entities, and conduct a field survey and utilization of existing traffic data of JUTPI in order to add potential projects to the original 14 potential projects by MD (MPW and JICA).
Next the Study Team will establish Multi Criteria which will be used for the evaluation of sub-projects in the 2nd stage, and the Multi Criteria will be adopted as much as possible in the selection of sub-projects in the 1st stage.
Finally, potential projects will be selected as Sub-projects mainly from the following viewpoints utilizing the Multi Criteria.
- Necessity : Necessity of intersection improvement using JUTPI traffic data
- Economy: Economic efficiency based on preliminary design and rough cost estimates
- Feasibility: Project feasibility based on preliminary environmental and social considerations
Selection flow and selection criteria in the 1st stage are shown in Figure 1.3.3.
Source: JICA Survey Team
Figure 1.3.3 Selection Flow in the 1st Stage
[Selection flow] [Selection criteria]
Original potential projects by MD (MPW and JICA)
・ JABODETABEK:12 locations ・ Medan : 2 locations ・ Total :14 locations
Potential projects
Original 14 +Additional locations
Selection of Sub-project
Max.10 locations
Interviews with private sector, DKI
・ Extraction of potential projects which contribute to economic activities of the private sector
Site Investigation
・ ROW, Condition of traffic congestion, Land acquisition/Resettlement, Natural environment, Difficulty of construction work, etc.
Use of JUTPI traffic data ・ Study the necessity of intersection improvement
by checking degree of congestion at each intersection
Preliminary design for each intersection ・ Study the economic efficiency based on the
preliminary design and rough cost estimation.
Preliminary Environmental & Social Considerations ・ Land acquisition, Judgment of necessity of
resettlement, Study the project feasibility by confirming the site situation
Establishment of Multi Criteria for Evaluation
・Feasibility ・Continuity ・Project effect ・Natural environment ・Social environment ・Consistency with existing
Development plans
The 2nd Stage
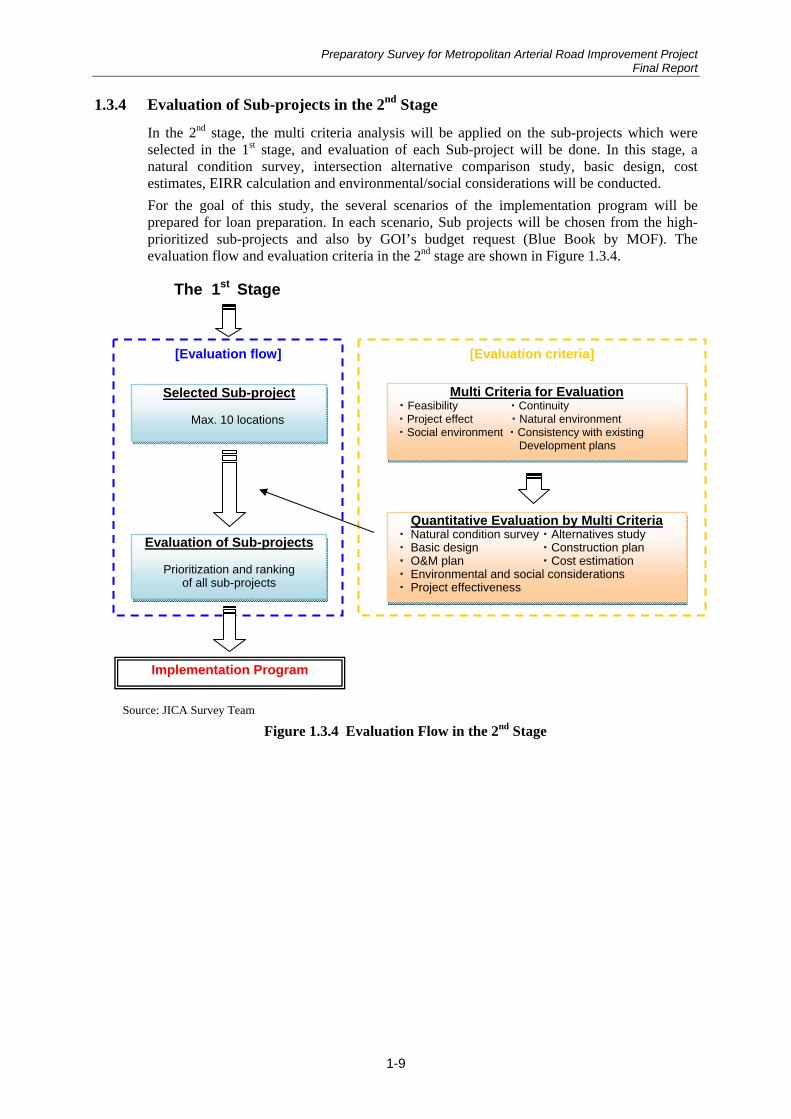
Preparatory Survey for Metropolitan Arterial Road Improvement Project Final Report
1-9
1.3.4 Evaluation of Sub-projects in the 2nd Stage
In the 2nd stage, the multi criteria analysis will be applied on the sub-projects which were selected in the 1st stage, and evaluation of each Sub-project will be done. In this stage, a natural condition survey, intersection alternative comparison study, basic design, cost estimates, EIRR calculation and environmental/social considerations will be conducted.
For the goal of this study, the several scenarios of the implementation program will be prepared for loan preparation. In each scenario, Sub projects will be chosen from the high-prioritized sub-projects and also by GOI’s budget request (Blue Book by MOF). The evaluation flow and evaluation criteria in the 2nd stage are shown in Figure 1.3.4.
The 1st Stage
Source: JICA Survey Team
Figure 1.3.4 Evaluation Flow in the 2nd Stage
[Evaluation flow] [Evaluation criteria]
Selected Sub-project
Max. 10 locations
Quantitative Evaluation by Multi Criteria ・ Natural condition survey ・Alternatives study ・ Basic design ・Construction plan ・ O&M plan ・Cost estimation ・ Environmental and social considerations ・ Project effectiveness
Multi Criteria for Evaluation ・Feasibility ・Continuity ・Project effect ・Natural environment ・Social environment ・Consistency with existing
Development plans
Implementation Program
Evaluation of Sub-projects
Prioritization and ranking of all sub-projects

Preparatory Survey for Metropolitan Arterial Road Improvement Project Final Report
2-1
CHAPTER 2. SELECTION OF SUB-PROJECTS
2.1 Nomination of Potential Projects According to the Minutes of Discussion (M/D) between JICA and MPW, 14 original potential projects were nominated in JABODETABEK and Medan in Sumatra.
In addition, the JICA Survey Team has conducted interviews with the related entities to correct the specific needs for road improvement by the grade separation. The interviewed entities are as follows.
Table 2.1.1 Interview List Interviewee Purpose of interview
Directorate General of Railway (DGR)
The grade separation for the railway crossings with the roads is currently one of the highest priorities in terms of the infrastructural development in Indonesia.
The interview was conducted to confirm the necessity of grade separation, the location of prioritized railway crossing points and the future development plan of the railway.
DKI The traffic congestion occurs not only on the national road but also on the provincial roads administrated by DKI in JABODETABEK .
The interview was conducted to confirm the location of congested intersections and road development plans.
Cikarang Industrial Park The development and expansion of Cikarang industrial area in Bekasi Regency is rapidly progressing by Indonesian, Japanese and Korean investments in these days. Consequently, the traffic congestion at the interchange, arterial road and even minor local roads has been one of the significant issues which has become an obstacle to economic activities.
The interview was conducted with the directors of the industrial park to confirm the further bottleneck points or sections on the road network. Therefore, the road development plan and contents of MOU regarding the road improvement concluded with MPW in 2006.
Source: JICA Survey Team
Based on the above interviews, the following 4 additional potential projects are nominated.
Katamso (Medan City)
According to the meeting with the chief of MPW in Medan, Katamso intersection has the highest priority within Medan City. As the necessity based on the development plan and the site investigation is confirmed, this project is nominated as one of the potential projects.
Sudirman II (Tangerang City)
Sudirman II is located on the trunk road to access to the international airport. MPW explains that this road needs to be upgraded to improve the accessibility for the airport and remove the railway crossing. Two nearby intersections on the same road are already grade-separated by flyovers in UARI project under JBIC fund in 2007.

Preparatory Survey for Metropolitan Arterial Road Improvement Project Final Report
2-2
Cikarang (Bekasi Regency)
The traffic congestion in Cikarang Industrial Area is severe due to the booming industrial activities. The mitigation of congestion is strongly requested from both the Indonesian and Japanese governments. In the site investigation, the huge traffic volume beyond the road capacity and the deterioration of road pavement by heavy trucks were confirmed. Uncompleted section by MOU (2006) is selected as the potential project.
Senayan (DKI)
The project for flyover and underpass construction on Blok M and Antasari road by DKI started at the end of 2010. When the new flyover is constructed, it is expected that traffic congestion will occur at the end point of the new underpass on Jl. Patimura near Senayan intersection which is already congested.
Table 2.1.2 shows the list of 18 potential projects.
Table 2.1.2 List of Potential Projects Project Location Remarks
1. Semanggi DKI M/D 2. Margonda Cinere Depok City M/D 3. Cililitan DKI M/D 4. R.E.Martadinata DKI M/D 5. Sulawesi - Tg.PA DKI M/D 6. Latumenten DKI M/D 7. Sudirman-Daan Mogot Tangerang City M/D 8. Kuningan DKI M/D 9. Pancoran DKI M/D 10. Cilandak DKI M/D 11. Fatmawati DKI M/D 12. Ciawi-Bogor Bogor Regency M/D 13. Pinang Baris Medan City M/D 14. Asrama-Gatot Subroto Medan City M/D 15. Katamso Medan City Request from DGH and Medan 16. Sudirman II Tangerang City Request from DGH 17. Cikarang Bekasi Regency Request from DGH and Cikarang Industrial Estates18. Senayan DKI Request from DGH and DKI Source: JICA Survey Team
2.2 Site Conditions of Potential Projects The JICA Survey Team conducted the site investigations for all potential project sites in January and February, 2011. The investigation viewpoints and the site condition of each potential project are described as follows. The site descriptions of each potential project with photos are attached in Appendix 2. Investigation viewpoints
Configuration of road and intersection
Type of existing structures
Control points (Houses, shops, public facilities, religious facilities, Bus ways shelters, railways, utilities, rivers, etc.)
Traffic flow
Condition of traffic congestion

Preparatory Survey for Metropolitan Arterial Road Improvement Project Final Report
2-3
(1) Semanggi
Semanggi junction is formed by the main trunk road, Jl. Sudirman, and Jl. Gatot Subroto parallel to Jakarta Inner Urban Toll Road (JIUT) which crosses perpendicularly above Jl. Sudirman. It is the clover leaf type junction and a symbolic landmark in JABODETABEK.
Jl. Sudirman, a provincial road, has an 8-lane carriageway with the frontage road on both sides isolated by the buffer and the center lane is used exclusively as a bus way, Trans Jakarta. JIUT is a 6-lane toll road and Jl. Gatot Subroto, a national road, has 3-lanes on each side. On and off ramps are placed at both ends of the junction and the bus way was opened on Jl. Gatot Subroto at the end of 2010. The junction is composed of the arterial roads and ramps while the diverted roads pass through the side and under the ramp.
The junction is located in an urban area and surrounded by high-rise buildings, such as Seltan Hotel on the west side and Semanggi Plaza on the east side. MRT is planned to open underneath Jl. Sudirman.
Source: Google Map
Figure 2.2.1 Location Map of Semanggi Intersection
It is a clover-leaf type intersection (see photo (d)). Intervals between the loop ramps are short, and weaving of traffic to/from the loop ramps causes traffic congestion on both Jl. Sudirman and Jl. Gatot Subroto (see photo (b)).
Capacity of Jl. Sudirman is short since the centermost traffic lanes have been used as dedicated bus lanes (two ways). However, these bus lanes will be available again after the current MRT project is completed in November, 2016.
Traffic flow may change and traffic congestion may be alleviated after the currently ongoing elevated non-toll road project has been completed on Jl. Casablanca.
Even if the traffic congestion in Semanggi is alleviated, another bottleneck may occur around Senayan roundabout. Additional traffic may be generated after the currently ongoing elevated non-toll road project has been completed on Jl. Antasari.

Preparatory Survey for Metropolitan Arterial Road Improvement Project Final Report
2-4
Source: JICA Survey Team
Figure 2.2.2 Photos of Semanggi Intersection
(2) Margonda Cinere
The project site of Margonda Cinere is located in the south of DKI. Jl. Margonda with 6-lanes is connected with the 6-lanes of Jl. Ir. H. Juanda by a T-shape intersection and both roads are designated as National roads. Bogor railway line passes through about 250m to the west. There is only an unpaved alley between the intersection and the railway crossing but the road on the east side of the railway line is not available for vehicles. A gas pipeline is laid along the railway line.
The intersection is located in the commercial and residential area and Indonesia University is next to the railway line. As Jl. Margonda is used as the main commuter road from Bogor, the intersection is congested in peak hours.
MPW has a plan for JORR2 and the interchange for an underpass adjacent to the intersection. The land use and traffic flow is expected to change after JORR2 opens.

Preparatory Survey for Metropolitan Arterial Road Improvement Project Final Report
2-5
Source: Google Map
Figure 2.2.3 Location Map of Margonda Cinere Intersection
There is lack of access road in the west side of the T-intersection (see photo (c)), that is, the missing link, which currently is an unpaved local road. If this road is to be developed, an east-west corridor underpass should be necessary to avoid the railway crossing.
Traffic jam is currently generated on the T-intersection (Jl. Margonda Raya - Jl. Juanda) (see photos (a), (b), and (d)). Right-turn movement from east to north (photo (b)) and straight movement from south to north (photo (d)) are dominant in the morning peak hours.
Flyover or Underpass along either north-south or east-west corridor has not been decided yet. Since Jl. Margonda Raya is a national road, demand on the north-south traffic should also be examined.
The plan needs the coordination with the JORR (Jakarta Outer Ring Road) II (Cinere – Depok section) project (east-west) that is currently under construction. Traffic condition after this project has been completed is not clear yet.
There is a small north-south river (width: 4 m) 80 m away from the intersection that needs attention at the time of planning of the underpass.
Since the frontage road will be widened, large-scale land acquisition will be required on both north and south sides.

Preparatory Survey for Metropolitan Arterial Road Improvement Project Final Report
2-6
Source: JICA Survey Team
Figure 2.2.4 Photos of Margonda-Cinere Intersection
(3) Cililitan
The intersection is the crossing point of national roads with 6-lanes in the north-south direction, Jl. Jend Sutoyo and Jl. Raya Bogor, and provincial roads in the east-west direction, Jl Cililitan Besar and Jl. Dewi Sartika. The height around the intersection is a little higher comparing to the surrounding area.
Many houses and public facilities are settled beside the roads such as a Transformer substation at the northeast, a shopping mall at the northwest and the market and mosque at the southeast. In addition, a canal flows along the Jl. Raya Bogor and Jl. Dewi Sartika.

Preparatory Survey for Metropolitan Arterial Road Improvement Project Final Report
2-7
Source: Google Map
Figure 2.2.5 Location Map of Cililitan Intersection
Cars, buses, and trucks are mixed, and traffic jams occur.
The number of the lanes is decreased for the N-S dedicated bus lanes, and the capacity is short (see photo (a)).
Along with newly opened busway Corridor 10, there is an intermodal transfer station in the mall (PGC: Pusat Grosir Cililitan), located in the north-west corner of the intersection.
The problem of small buses waiting for passengers are observed on all the streets around the intersection (see photo (b)) hampering traffic, through it seemed not so serious at the time of the site survey.
Since Jl. Cililitan Besar is rather narrow with only 2 lanes, it may become another bottleneck even if the underpass is constructed (see photo (b)) unless the road is widened.
The travel speed survey in this location indicates that east-west corridor travel speed is lower than the north-south corridor, whereas the traffic volume from site visit is higher along north-south corridor (compare photos (c) and (b) to photo (a)).
Without considering constraint of other factors such as Transjakarta busway and environment, north-south corridor might be the best location to implement flyover/underpass based on the traffic count survey result.

Preparatory Survey for Metropolitan Arterial Road Improvement Project Final Report
2-8
Source: JICA Survey Team
Figure 2.2.6 Photos of Cililitan Intersection
(4) R.E. Martadinata
R.E. Martadinata is located on Jl. Enggano and Jl. Martadinata in front of Tanjung Priok Port north of Jakarta. Both roads have 4-lanes but the width of Jl. Martadinata is narrower. The bus terminal for long distance transportation and the Tanjung Priok railway station are placed at this point. The east and west bound road is split by the bus terminal and the alignment of the west bound road curves between the bus terminal and railway station. As ground subsidence has occurred around this area, the road surface is undulated and inundation appears everywhere. The single track of the railway diverges toward Pasoso station and 3 or 4 cargo trains are randomly operated per day.
The area on the north side of the road is the property of the port authority. The land on the south side is occupied by the container depot, bus terminal and railway station. The bank and mosque are located on the east side. Many small shops, some of which are illegal occupants are in business around the bus terminal.

Preparatory Survey for Metropolitan Arterial Road Improvement Project Final Report
2-9
Source: Google Map
Figure 2.2.7 Location Map of R.E. Martadinata Intersection
The eastbound and westbound roads are separated by Tg. Priok Bus Terminal and the Transjakarta bus shelter.
The railway station (Tg. Priok) has been recently renovated and is expected to become an intermodal transfer point with the bus terminal and the port (photo (c)). It should properly be arranged if the flyover is to be constructed.
The road is badly damaged especially around the railway crossing (photo (d)), and it is the main bottleneck of traffic in this area.
Westbound vehicles may not be able to turn directly right to enter the port (photo (a)), if the flyover is constructed.

Preparatory Survey for Metropolitan Arterial Road Improvement Project Final Report
2-10
Source: JICA Survey Team
Figure 2.2.8 Photos of R.E Martadinata Intersection
(5) Sulawesi - Tg.PA
Sulawesi - Tg.PA intersection is approximately 1.2 km from the intersection of R.E. Martadinata. Jl. Yosudarso in the north-south direction and it has 8-lanes with a slow lane on both sides and is to be realigned when the Tanjung Priok Access Road (TgPA) is constructed above the existing road. Jl. Enggano has 6-lanes and the center lane is mainly used as a bus way. A bus way shelter is placed near the intersection. The road surface is damaged by the heavy weight vehicles. The single railway track which is currently covered by pavement and not in operation is laid about 50m to north. The canal passes across about 150m south from the intersection.
The intersection is surrounded by many small houses, shops and a container depot. As there are many heavy trucks running, the air is polluted by the dust.

Preparatory Survey for Metropolitan Arterial Road Improvement Project Final Report
2-11
Source: Google Map
Figure 2.2.9 Location Map of Sulawesi - Tg.PA Intersection
A flyover is planned along Tg. Priok access road north-south section (elevated structure) which is under preparation for construction. Since the frontage road will be widened, land acquisition will be required on both east and west sides.
The main problem/bottleneck is the right turn traffic of many heavy vehicles from north to west followed by the straight traffic from north to south. However, benefit of this straight flyover is still unclear because the traffic condition may change and the traffic congestion may be solved after Tg. Priok access road north-south section (elevated structure) has been constructed.
If the existing at-grade discontinued railway (photo (d)) is to be rehabilitated, the flyover may become necessary. From the previous traffic count survey conducted in January 2010, the traffic volume along the corridor north-south is considerably high, that is (in total) 55,000 PCU per 16 hours.
Source: JICA Survey Team
Figure 2.2.10 Photos of Sulawesi – Tg. Priok Access Intersection

Preparatory Survey for Metropolitan Arterial Road Improvement Project Final Report
2-12
(6) Latumentan
Latumenten is the railway crossing point beside JIUT in the east of Jakarta. JIUT and a canal cross above and under the railway line respectively. Two 3-lane roads, Jl Satria and Jl. Makaliwe pass through parallel to the canal on both sides and cross the single track of the Tangerang line at-grade. The center lane of both roads is exclusively used for the bus way and a bus way shelter with a pedestrian access bridge is placed on the north of the railway line. Jl. Makaliwe crosses under JIUT supported by rigid-frame piers from inside to outside of JIUT before the railway crossing point. The interchange for JIUT is placed both north and south near this point. A U-turn way is also provided at both the north and south sides. There is a bridge section 400m to the north on the pond. The Tangerang line railway is operated on average every half hour.
Many houses are settled along the road and the public hospital is located beside Jl. Satria.
Source: Google Map
Figure 2.2.11 Location Map of Latumentan Intersection
The frontage road of the toll road is congested by the at-grade railway crossing (photos (d) and (e)). While the frequency of the railway is currently low, there is a plan to improve the train service with a higher frequency and the flyover will become necessary.
It is also a cause of the traffic congestion that the on-off ramps of the toll road and the U-turn lanes are located near the intersection (photo (f)). (There is no off-ramp from the north to the south.)
There is a busway shelter near the railway crossing (to the north), and it needs to be relocated along with the construction or the flyover (see photo (b)).
There is another bottleneck of traffic at the north adjacent intersection, and it also needs to be improved if the flyover is to be constructed.

Preparatory Survey for Metropolitan Arterial Road Improvement Project Final Report
2-13
Source: JICA Survey Team
Figure 2.2.12 Photos of Latumenten Intersection
(7) Sudirman - Daan Mogot
The intersection of Sudirman - Daan Mogot is located in Kota Tangerang. A 4-lane bridge connecting two roads, Jl. Daan Mogot with 4-lanes and Jl. Bouraq with 2-lanes, crosses the river. Jl. Sudriman on the south side has enough width with 7-lanes plus 1-lane for a slow lane while there is only a narrow 2-lane on Jl. Pembangunan3 on Jl. Pembangunan3.
This is a high class residence area on the south side and the factories and small houses are settled along the road on the north side. The primary school and junior high school are located at the corner of the intersection.

Preparatory Survey for Metropolitan Arterial Road Improvement Project Final Report
2-14
Source: Google Map
Figure 2.2.13 Location Map of Sudirman - Daan Mogot Intersection
Traffic jams occur at the narrow river bridge and the intersection, especially from the south to the north on Jl. Jendral Sudirman (see photos (f) and (g)). Another adjacent intersection with Jl. Bouraq (Lio Baru), which runs on the north of the river, is making the traffic flow more complicated though the traffic signals at these two intersections are coordinated (photos (b) and (c)).
A long queue of traffic, especially heavy vehicles, is observed on Jl. Pembangunan 3, which is currently narrow with only two lanes (photo (a)). This traffic volume has grown since it serves as the road connecting with the airport. While land acquisition will be required for the widening of this road, benefit of the flyover will be great if it is widened.
Kota Tangerang also regards this improvement as urgent. Though, it is planned to implement north-south flyover along this location, from the previous traffic count (January 2010), the number of traffic volume along east-west corridor is considerably higher (45,000 PCU/16 hrs) compared to traffic along north-south corridor (17,000 PCU/16 hrs). Without any other constraints, these preliminary findings might affect the flyover direction from north-south to east-west.

Preparatory Survey for Metropolitan Arterial Road Improvement Project Final Report
2-15
Source: JICA Survey Team
Figure 2.2.14 Photos of Sudirman – Daan Mogot Intersection
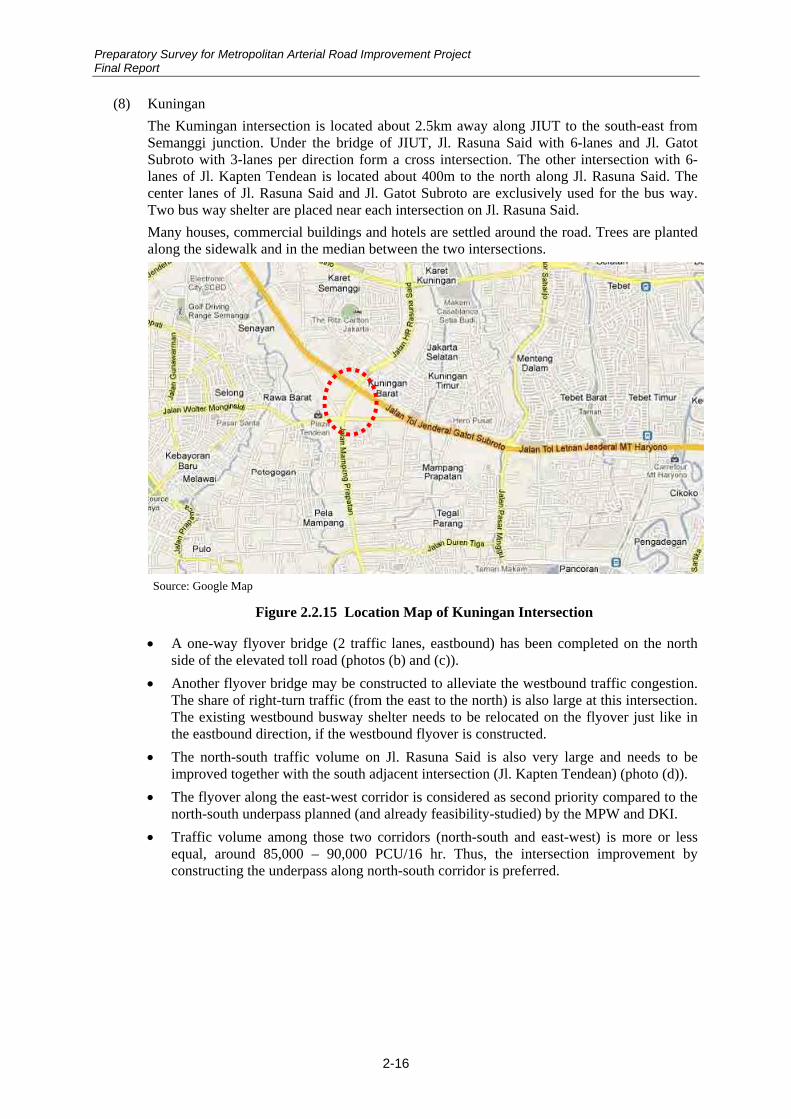
Preparatory Survey for Metropolitan Arterial Road Improvement Project Final Report
2-16
(8) Kuningan
The Kumingan intersection is located about 2.5km away along JIUT to the south-east from Semanggi junction. Under the bridge of JIUT, Jl. Rasuna Said with 6-lanes and Jl. Gatot Subroto with 3-lanes per direction form a cross intersection. The other intersection with 6-lanes of Jl. Kapten Tendean is located about 400m to the north along Jl. Rasuna Said. The center lanes of Jl. Rasuna Said and Jl. Gatot Subroto are exclusively used for the bus way. Two bus way shelter are placed near each intersection on Jl. Rasuna Said.
Many houses, commercial buildings and hotels are settled around the road. Trees are planted along the sidewalk and in the median between the two intersections.
Source: Google Map
Figure 2.2.15 Location Map of Kuningan Intersection
A one-way flyover bridge (2 traffic lanes, eastbound) has been completed on the north side of the elevated toll road (photos (b) and (c)).
Another flyover bridge may be constructed to alleviate the westbound traffic congestion. The share of right-turn traffic (from the east to the north) is also large at this intersection. The existing westbound busway shelter needs to be relocated on the flyover just like in the eastbound direction, if the westbound flyover is constructed.
The north-south traffic volume on Jl. Rasuna Said is also very large and needs to be improved together with the south adjacent intersection (Jl. Kapten Tendean) (photo (d)).
The flyover along the east-west corridor is considered as second priority compared to the north-south underpass planned (and already feasibility-studied) by the MPW and DKI.
Traffic volume among those two corridors (north-south and east-west) is more or less equal, around 85,000 – 90,000 PCU/16 hr. Thus, the intersection improvement by constructing the underpass along north-south corridor is preferred.

Preparatory Survey for Metropolitan Arterial Road Improvement Project Final Report
2-17
Source: JICA Survey Team
Figure 2.2.16 Photos of Kuningan Intersection
(9) Pancoran
The Pancoran intersection is located about 2.0km away to the east along JIUT from Kuningan junction. Jl. Rasuna Said with 6-lanes and Jl. Raya Pasar Minngu with 4-lanes form the intersection. The 2-lane flyover for east bound is already constructed 20m from JIUT to keep out the statue. The center lane of Jl. Gatot Subroto is exclusively used for the bus way. A bus way shelter is placed at the same level as the flyover on the east bound side and under the bridge of JIUT on the west bound.
Many houses and commercial buildings are settled around the road. A commercial building is situated close to Jl. Gatot Subroto on the south side.

Preparatory Survey for Metropolitan Arterial Road Improvement Project Final Report
2-18
Source: Google Map
Figure 2.2.17 Location Map of Pancoran Intersection
A one-way flyover bridge (2 traffic lanes, eastbound) has been completed on the north side of the elevated toll road (photo (a)).
Another flyover bridge will be constructed to alleviate the westbound traffic congestion. At this intersection, straight movement of traffic (from the east to the west) takes the majority (photo (e)), causing the congestion. Hence, construction of the flyover is expected to bring about a great benefit. The existing westbound busway shelter needs to be relocated on the flyover just like in the eastbound direction (photo (b)), if the westbound is constructed.

Preparatory Survey for Metropolitan Arterial Road Improvement Project Final Report
2-19
Source: JICA Survey Team
Figure 2.2.18 Photos of Pancoran Intersection
(10) Cilandak
Cilandak intersection is formed by Jl. Simatupang along with JORR, Jl. Antasari and Jl. Cilandak in the south of Jakarta. As the terrain around the intersection is higher than the neighbouring land, JORR passes under Jl. Antasari with 6-lanes and Jl. Simatupang is split by the retaining wall from JORR. Jl. TB Simtupang has 4-lanes per direction at the intersection and a U-turn lane is also provided at both sides of the intersection. On and Off ramps are placed about 300m from the intersection to the east and west.
The intersection is surrounded by a residential area to the north-west and industrial areas at the corners. Large buildings are concentrated in Cilandak industrial area to the south-west.

Preparatory Survey for Metropolitan Arterial Road Improvement Project Final Report
2-20
Source: Google Map
Figure 2.2.19 Location Map of Cilandak Intersection
An underpass is planned on both north and south sides.
Due to the upslope topography, flyover construction is difficult to be implemented, and an underpass is left as the only option while large-scale land acquisition for UP may cost much.
Traffic jams are caused by the (on and) off ramps of the toll road around the intersection.
Frontage roads are relatively wider than the adjacent flyover Fatmawati, so flyover Fatmawati may have higher priority for improvement.

Preparatory Survey for Metropolitan Arterial Road Improvement Project Final Report
2-21
Source: JICA Survey Team
Figure 2.2.20 Photos of Cilandak Intersection
(11) Fatmawati
Fatmawati intersection is 2.4km to the west of Cilandak intersection. JORR passes over Jl. Fatmawati with 4-lanes which is connected with Jl. Simatupang at both sides of the JORR at-grade. U-turn lanes are also provided at both sides of the intersection. On and Off ramps are placed about 300m from the intersection to the east and west. The intersection is surrounded by a residential area to the north-west and some commercial buildings. A gas station is located to the south-west.

Preparatory Survey for Metropolitan Arterial Road Improvement Project Final Report
2-22
Source: Google Map
Figure 2.2.21 Location Map of Fatmawati Intersection
There are (on and) off ramps of the toll road on the east and west sides of the intersection, causing traffic jams in the morning and evening (see photos (d) and (f)).
A flyover is planned in parallel with the highway on both north and south sides.
Near the eastbound off-ramp, the frontage road is relatively narrow with only one lane, causing traffic congestion (photos (a) and (b)).
Source: JICA Survey Team
Figure 2.2.22 Photos of Fatmawati Intersection

Preparatory Survey for Metropolitan Arterial Road Improvement Project Final Report
2-23
(12) Ciawi - Bogor
The intersection of Ciawi - Bogor is located at the end point of Jagorawi Toll Road in Ciawi. The road to Jl. Raya sukabumi and Jl. Raya Ciawi crosses at a skew angle and forms the intersection. There are 4 lanes on the road toward the Toll Road while Jl. Raya Sukabumi has only 2-lanes. Jl. Raya Ciawi with 4-lanes has a gradient as the east side is higher than the west side. A lane of Jl. Raya Ciawi on the east bound near the intersection is split by a movable barrier and is used for a local bus stop.
The intersection is surrounding by residential and commercial areas. At the corner on the south-east corner of the intersection, a 4-story shopping mall is located.
Source: Google Map
Figure 2.2.23 Photos of Location Map of Ciawi - Bogor Intersection
Heavy traffic jams occur all the time, mainly caused by minibus waiting for passengers and street vendors decreasing the capacity of the intersection (photos (a) and (d)). In particular, the traffic from the toll road exit to the east mountain area and the south shore area makes the situation worse on the weekend.
Since the southbound road (Jl. Raya Sukabumi) narrows after the intersection (photo (c)), the southbound traffic is also congested. Spillback of the queue also blocks the traffic flow around the intersection.
It is an intersection of the two national roads. Straight movement from the west (Jl. Raya Tajur) is currently blocked. For planning the flyover, it is necessary to consider the future toll road extension and Bogor ring road as well as the direction of the flyover.

Preparatory Survey for Metropolitan Arterial Road Improvement Project Final Report
2-24
Source: JICA Survey Team
Figure 2.2.24 Photos of Ciawi –Bogor Intersection
(13) Pinang Baris
Pinang Baris intersection is located to the west of Medan city and is composed of Jl. Gatot Subroto, Jl. Pinang Baris and J. Klambir5. 6-lanes plus 1 slow lane of Jl. Gatot Subroto, which is split by a concrete median, is the trunk road to Ache while the crossing roads have 4 lanes. As two roads cross at a skew angle, the area of the intersection is comparatively large.
The area around the intersection has high density occupancy. Many houses and shops are settled along the road side and the vendors open the market within the road property especially to the north-west of the intersection. A river flows near the intersection and crosses about 380m to the west. A clock tower is built next to the river bridge.

Preparatory Survey for Metropolitan Arterial Road Improvement Project Final Report
2-25
Source: Google Map
Figure 2.2.25 Location Map of Pinang Baris Intersection
Near this intersection, there is a Pinang Baris bus terminal to/from the west region. Traffic jams occur especially because of minibuses and other vehicles waiting and stopping around the intersection (photo (e)). Traffic congestion becomes worse on weekends, especially from the west (Binjai) to the east and from the west to the south (photo (a)).
The road in the north of the intersection is small, and only small traffic volume is observed (photo (b)).
Improvement of the traffic management may be a solution. It is also necessary to consider the plan of Binjai toll road, which is soon to be constructed (currently at the tendering stage).
Source: JICA Survey Team
Figure 2.2.26 Photos of Pinang Baris Intersection

Preparatory Survey for Metropolitan Arterial Road Improvement Project Final Report
2-26
(14) Asrama - Gatot Subroto
Asrama - Gatot Subroto is a simple cross intersection and is located to the west of Medan city on Medan ring road. Both Jl. Gatot Subroto and Jl. Gagak Hitam, national roads, have 6-lanes split by a median. An exclusive left-turn lane is provided for all directions. Paved sidewalks are provided for both roads. There is a railway crossing about 1.2km north of the intersection.
Houses and commercial buildings are settled along both roads. Jl. Gatot Subroto is planted with vegetation along the sidewalk.
Source: Google Map
Figure 2.2.27 Location Map of Asrama - Gatot Subroto Intersection
Traffic jams occur at the intersection on two national roads, namely, Jl. Bypass (ring road, 6 lanes – photos (b) and (c)) and Jl. Gatot Subroto (4 lanes – photo (d)).
In order to serve the freight traffic on the ring road along with several other flyovers, a north-south flyover is planned. Composition of heavy vehicles is relatively high.
Although there is already a 2-3m setback, land acquisition will be required on both sides. Right-of-way (ROW) is 33m in north-south, and 26m in east-west.
The east-west traffic may be reduced after the completion of Binjai toll road.

Preparatory Survey for Metropolitan Arterial Road Improvement Project Final Report
2-27
Source: JICA Survey Team
Figure 2.2.28 Photos of Asrama-Gatot Subroto Intersection
(15) Katamso
Katamso intersection is a part of the Medan ring road and is located south of Medan city. The two lane roads, Jl. AH Nasution, Jl Katamso and Jl. Biru Biru form the intersection. Jl. AH Nasution is split by a median with plants and drops lower to the west with a gentle slope. The river flows 150m to the west. The single railway line which is currently not in operation is 350m to east. An exclusive lane is provided between Jl. AH Nasution and Jl. Katamso.
Many houses are concentrated along the intersection. The hospital is located about 500m to east of the intersection.
Source: Google Map
Figure 2.2.29 Location Map of Katamso Intersection

Preparatory Survey for Metropolitan Arterial Road Improvement Project Final Report
2-28
This intersection is congested not only because of the large traffic volume that is observed throughout the day, but also because of the land use and activities around the intersection.
Crossing of pedestrians and drivers’ bad driving manners (ignoring the red light) are making the situation even worse.
In order to serve the traffic on the ring road (Jl. A.H. Nasution) with several other flyovers planned along the ring road, an east-west underpass is planned. Due to the upslope, underpass is designed at the intersection of Jl. Brigjend. Katamso – A.H. Nasution.
Source: JICA Survey Team
Figure 2.2.30 Photos of Katamso Intersection
(16) Sudirman II
The intersection of Sudirman II is located 1.0km to the south of Daan Mogot along the Jl. Sudirman with 8-lanes. There is a railway crossing with a single track on Tangerang line at the intersection. The railway station is near the intersection and a bus shelter is on the opposite side on Jl. Benteng Betawi.
There is a residential area south-east of Jl. Sudirman and a paddy field on the opposite side. A rice mill factory and fruit market are located west and east of Jl. Sudiriman respectively.
Trains pass on the railway every half hour.

Preparatory Survey for Metropolitan Arterial Road Improvement Project Final Report
2-29
Source: Google Map
Figure 2.2.31 Location Map of Sudirman II Intersection Traffic jams occur at the at-grade railway crossing as well as at the T-intersection (Jl.
Benteng Betawi) that is located just south beside the railway crossing (see photos (b) and (d)). Though the railway crossing is closed not so frequently, many heavy vehicles pass the crossing at very low speed.
As for the traffic to/from Tanah Tinggi Bus Terminal, it is not a major problem since it is located away from the location.
Combined with the adjacent flyover (No. 7: Sudirman – Daan Mogot) which is located 1km north, multiplier effect may be expected.
Source: JICA Survey Team
Figure 2.2.32 Photos of Sudirman II Intersection

Preparatory Survey for Metropolitan Arterial Road Improvement Project Final Report
2-30
(17) Cikarang
Cikarang project is located in an industrial area in Bekasi Regency and is composed of a 7.3km length of Jl. Raya Karimalang and 3 of local roads crossing Cikampek Toll Road in the north-south direction. The unpaved surface of Jl. Raya Karimalang with 2-lanes which passes parallel to Karimalang River is significantly damaged by heavy trucks. As the river height is controlled for irrigation, the road has never been flooded. There are 2 bridges on the river at middle of the section. The bridge for the Dry Port Access Road is already constructed above the Jl. Raya kalimalang.
Jl. Bali-Cibitung is 2-lane with concrete pavement. The bridge on Cikampek Toll Road has 1.5-lanes so two large vehicles can not pass each other at the same time. The road surface on Jl. Imam Bonjol 4 is damaged near the river. The bridge on the Toll Road has 2-lanes. The construction of the Dry Port Access Road is now under construction.
Factories and some houses are settled along the road on the north side. In some sections, private land has been acquired to widen the right of way.
The intersections at both the beginning and end points are congested with traffic on the cross road. The distance between the interchange gate and intersection is about 250m.
Source: Google Map
Figure 2.2.33 Location Map of Cikarang Area
Cibitung IC
Cikarang Barat IC
25km
29km
31km
34km
37km
JABABEKA2
MM2100
Bekasi Fajar
Toll gate & IC (New)
EJIP
LIPPO
IC (New)
DELTA MAS
Cikarang Timur IC
HYUNDAI(BIIE)
JABABEKA1
Dry Port
Dry Port Access Road

Preparatory Survey for Metropolitan Arterial Road Improvement Project Final Report
2-31
Cikarang industrial area is the largest industrial estate in Jabodetabek, and around 450 Japanese manufacturing companies concentrate in this area consisting of MM2100, Delta Mas, and so on. Those are located on both north and south sides of Jakarta – Cikampek Toll Road (between 25km – 37km posts). Most employees of the industrial estates live in the existing villages on the north side and commute to the factories. Furthermore, since there are many factories that are closely related to each other for supplying parts, a considerable volume of traffic is occurring within the industrial estates, causing traffic congestion in this area, especially on the limited number of north-south access roads such as Jl. Cibarusah (photo (c)) and Jl. Jarakosta.
A new IC is planned at 29.2km post on Jakarta – Cikampek Toll Road, and the construction work is currently in progress. The new IC will be connected by a new access road that consists of a new overpass over the toll road, a new bridge over the river (Kalimalang River), and a new dry port access road through Jababeka I. This access road will be designed as a north-south through access road by Jababeka and so on.
There is a large volume of traffic to and from Cibitung IC on the access road, which cannot be utilized as a north-south through access road, either.
Although there is a large volume of traffic traveling north-south in Cikarang industrial area, the number of overpasses over the toll road is limited, and all the north-south roads are congested.
Development of an east-west trunk road is necessary on the existing road along the Kalimalang River in order to divert the traffic in Cikarang industrial area. It should also support the north-south traffic flow by reinforcing the connection with the existing north-south access roads such as Jl. Bali and Jl. Jarakosta.
Source: JICA Survey Team
Figure 2.2.34 Photos of Cikarang Area
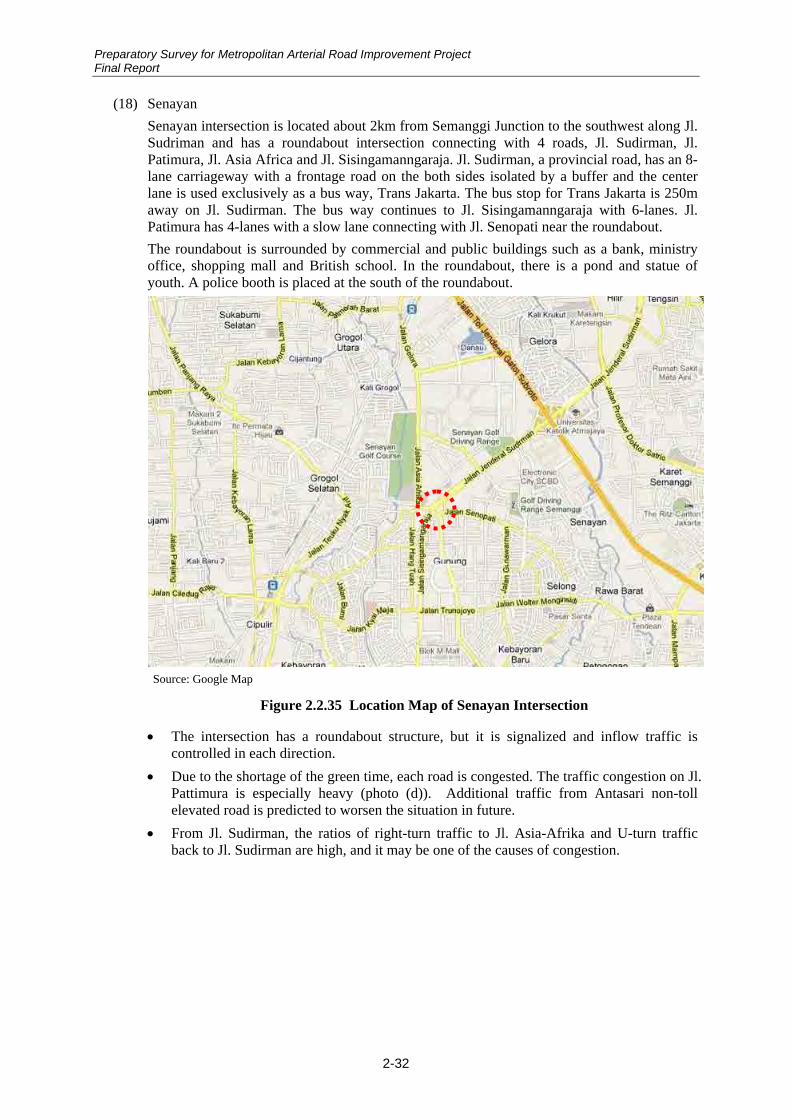
Preparatory Survey for Metropolitan Arterial Road Improvement Project Final Report
2-32
(18) Senayan
Senayan intersection is located about 2km from Semanggi Junction to the southwest along Jl. Sudriman and has a roundabout intersection connecting with 4 roads, Jl. Sudirman, Jl. Patimura, Jl. Asia Africa and Jl. Sisingamanngaraja. Jl. Sudirman, a provincial road, has an 8-lane carriageway with a frontage road on the both sides isolated by a buffer and the center lane is used exclusively as a bus way, Trans Jakarta. The bus stop for Trans Jakarta is 250m away on Jl. Sudirman. The bus way continues to Jl. Sisingamanngaraja with 6-lanes. Jl. Patimura has 4-lanes with a slow lane connecting with Jl. Senopati near the roundabout.
The roundabout is surrounded by commercial and public buildings such as a bank, ministry office, shopping mall and British school. In the roundabout, there is a pond and statue of youth. A police booth is placed at the south of the roundabout.
Source: Google Map
Figure 2.2.35 Location Map of Senayan Intersection
The intersection has a roundabout structure, but it is signalized and inflow traffic is controlled in each direction.
Due to the shortage of the green time, each road is congested. The traffic congestion on Jl. Pattimura is especially heavy (photo (d)). Additional traffic from Antasari non-toll elevated road is predicted to worsen the situation in future.
From Jl. Sudirman, the ratios of right-turn traffic to Jl. Asia-Afrika and U-turn traffic back to Jl. Sudirman are high, and it may be one of the causes of congestion.

Preparatory Survey for Metropolitan Arterial Road Improvement Project Final Report
2-33
Source: JICA Survey Team
Figure 2.2.36 Photos of Senayan Intersection

Preparatory Survey for Metropolitan Arterial Road Improvement Project Final Report
2-34
2.3 Selection of Sub-projects
2.3.1 Selection Criteria
The procedures for selection of sub-projects in the 1st stage and evaluation of sub-projects in the 2nd stage are explained in “1.3 Methodology”. And the Multi Criteria, which is used in the 2nd stage, is set as a draft in “10.1.2 Multi Criteria”.
The selection of sub-projects will be done by non-quantitative measures, and the evaluation of sub-projects will be done by quantitative measures by multi criteria analysis.
The selection criteria in the 1st stage shall be related to the multi criteria to maintain similar judgement in both stages. Therefore the selection criteria are set forth in Table 2.3.1.
Table 2.3.1 Selection Criteria in the 1st Stage
Selection Criteria Note
Planned in Any Master Plan
If the project is stipulated in any master plan or equivalent plan, it is prioritized
Existing Study If a study (F/S, B/D or D/D) for the project has been conducted, it is prioritized
Railway Crossing The grade separation at railway crossings is the highest priority for the safety and ease of congestion, therefore it is prioritized
Traffic Volume If the current traffic volume exceeds 100,000 (PCU/16hrs, 4-direction total), it is prioritized.
Resettlement UKL/UPL
If the number of resettlement household exceeds 50, it is not prioritized. If UKL/UPL or AMDAL is approved or documented, it is prioritized.
Conflict with Other Projects
If there is another project (MRT, Toll Road, etc.) on going around the
project site, it may affect traffic flow, design, and construction of the
project implementation. Therefore it shall not be selected. But for
Senayan as strategic candidate, it is not eliminated. Source: JICA Survey Team
2.3.2 Selection of Sub-projects
The selection of sub-projects from all 18 potential projects is done with the selection criteria in Table 2.3.1, and the selection result is summarized in Table 2.3.2. Those selected sub- projects will go into the 2nd stage, on which survey and basic design will be conducted.

Preparatory Survey for Metropolitan Arterial Road Improvement Project Final Report
2-35
Cand
idat
e
Loca
tion
Auth
ority
FO, U
P, e
tc.
Plan
ned
in a
ny M
aste
r Pla
nEx
istin
g st
udy
(F/S
, D/D
)Ra
ilway
cro
ssin
g
1. S
eman
ggi
DKI J
akar
taTo
be
stud
ied
in2n
d-st
age
2●
+SI
TRAM
P+
265,
000
0Th
e m
ost s
trikin
gly
cong
este
d sit
e in
Jak
arta
2. M
argo
nda
Cine
reKo
ta D
epok
UP-
+Ko
ta D
epok
Reg
iona
lSp
atia
l Pla
n+
Bogo
r+
125,
000
-10
0-
JORR
2 (P
U)Tr
affic
flow
will
be d
rast
ically
cha
nged
whe
n on
-goi
ng J
ORR
2 co
nstru
ctio
n is
com
plet
ed a
t thi
slo
catio
n, a
nd n
ow th
ere
is no
exis
ting
road
wes
t of t
his
loca
tion.
3. C
ililita
nDK
I Jak
arta
UP1
+D/
D72
,000
50Th
e N-
S tra
ffic
volu
me
is co
nsid
erab
ly hi
gher
(54,
000
PCU/
16 h
rs) c
ompa
red
to E
-W (1
8,00
0PC
U/16
hrs
), an
d th
e FO
dire
ctio
n sh
ould
be
stud
ied
agai
n.
4. R
.E.M
arta
dina
taDK
I Jak
arta
FO3
●+
D/D
+Ta
Prio
kex
tens
ion
37,0
00+
10approved
5. S
ulaw
esi -
Tg.
PADK
I Jak
arta
FO4
●+
SITR
AMP
+D/
D+
Ta P
riok
exte
nsio
n77
,000
+50
approved
6. L
atum
ente
nDK
I Jak
arta
FO-
+SI
TRAM
P+
Tang
eran
g78
,000
30-
MRT
(DG
R)Be
tter t
o wa
it fo
r the
impr
ovem
ent o
f Tan
gera
ng ra
ilway
, whi
ch m
ay b
e im
prov
ed a
s th
eun
derp
ass
at th
is lo
catio
n wh
en M
RT E
-W lin
e pr
ojec
t sta
rts
7. S
udirm
an-D
aan
Mog
otKo
ta T
ange
rang
FO1
+Ko
ta T
ang.
Reg
iona
lSp
atia
l Pla
n+
F/S
59,0
00-
70Th
e E-
W tr
affic
vol
ume
is co
nsid
erab
ly hi
gher
(45,
000
PCU/
16 h
rs) c
ompa
red
to N
-S (1
7,00
0PC
U/16
hrs
), an
d th
e FO
dire
ctio
n sh
ould
be
stud
ied
agai
n.
8. K
unin
gan
DKI J
akar
taUP
3●
+SI
TRAM
P pr
iorit
yim
prov
emen
t+
F/S
+18
0,00
010
9. P
anco
ran
DKI J
akar
taFO
2●
+SI
TRAM
P pr
iorit
yim
prov
emen
t+
200,
000
0
10. C
iland
akDK
I Jak
arta
UP1
+10
7,00
010
Traf
fic fl
ow w
ill be
dra
stica
lly c
hang
ed w
hen
on-g
oing
Ant
asar
i - B
lock
M e
leva
ted
non-
toll p
roje
ctis
com
plet
ed n
ear t
his
loca
tion.
11. F
atm
awat
iDK
I Jak
arta
FO-
+10
3,00
010
-M
RT (D
GR)
MRT
proj
ect c
an c
onflic
t with
the
flyov
er d
esig
n an
d co
nstru
ctio
n
12. C
iawi
-Bog
orKa
b. B
ogor
FO-
72,0
00-
70-
Toll e
xten
sion,
Bogo
r RR
(PU)
Traf
fic fl
ow w
ill be
dra
stica
lly c
hang
ed a
fter b
oth
Jago
rawi
toll r
oad
exte
nsio
n an
d Bo
gor r
ing
road
proj
ects
are
com
plet
ed.
13. P
inan
g Ba
risKo
ta M
edan
FO2
●+
Prov
incia
l Stra
tegi
cPl
an 2
014
+DD
/EIA
94,0
00+ -
80document
ed
The
mos
t con
gest
ed s
ite o
f the
thre
e lo
catio
ns in
Med
an a
ccor
ding
to P
U M
edan
(Bal
ai B
esar
)
14. A
sram
a-G
atot
Sub
roto
Kota
Med
anFO
0+
134,
000
-80
Decis
ion
as to
whe
ther
E-W
(by
cent
ral g
ovn't
) or N
-S (b
y lo
cal g
ovn't
) flyo
ver i
s no
t cle
ar y
et.
15. K
atam
soKo
ta M
edan
UP2
●+
F/S
+No
rthSu
mat
era
76,0
0050
16. S
udirm
an II
Kota
Tan
gera
ngFO
2●
+F/
S+
Tang
eran
g47
,000
10Ta
nger
ang
railw
ay lin
e im
prov
emen
t with
hig
her-f
requ
ency
com
mut
er tr
ain
serv
ice is
pla
nned
.
17. C
ikara
ngKa
b. B
ekas
i1
E-W
road
3 N
-S ro
ad2
●+
MO
U (6
Dec
. 200
6)+
F/S
61,0
0020
18. S
enay
anDK
I Jak
arta
FO
2●
+SI
TRAM
P+
127,
000
10Co
nsen
sus
is ne
cess
ary
with
the
loca
l gov
't on
FO. I
f FO
is n
ot a
gree
d, a
t-gra
de in
ters
ectio
nim
prov
emen
t (no
n-st
ruct
ure
type
) to
be s
tudi
ed a
nd p
ropo
sed
(UP
conf
licts
with
MRT
)
I f in
clud
e "-
", d
educ
t fro
m n
umbe
r of "
+"
get "
+" if
traf
fic v
olum
e >
100,
000
Can
dida
te w
ith c
onfli
ct s
hall
not b
e se
lect
ed
if #
of re
settl
emen
t hou
seho
ld >
50,
then
get
"-"
AN
D, i
f UK
L/U
PL o
r AM
DAL
app
rove
d or
doc
umen
ted,
then
get
"+"
Conf
lict w
ithot
her p
roje
ct
Note
Orig
inal
Can
dida
te in
MD
by
(PU
& J
ICA)
Traf
fic V
olum
e[p
cu/1
6 hr
s]
Crite
ria fo
r sel
ectio
n in
1st
-sta
ge
Rese
ttlem
ent h
ouse
hol
d, a
ndUK
L/UP
L st
atus
Sele
ctio
n in
1st-s
tage
Tot
al'+
'sc
ore
Tab
le 2
.3.2
Sel
ectio
n of
sub-
proj
ect
Sour
ce: J
ICA
Sur
vey
Tea
m

Preparatory Survey for Metropolitan Arterial Road Improvement Project Final Report
3-1
CHAPTER 3. TRAFFIC ANALYSIS
3.1 Traffic Survey Result For this project, traffic survey was conducted at the 10 sub-project locations for arterial road improvement in the metropolitan regions of Jakarta and Medan in order to obtain information on the characteristics of the traffic flow. This traffic survey includes four surveys: (1) directional traffic count survey, (2) traffic signal phasing survey, (3) travel speed survey, and (4) traffic queue length survey.
The main objective of the survey is to obtain information on the characteristics of traffic flow on major roads around the sub-project locations as base data to quantitatively evaluate the benefits of road improvement such as savings in travel time and vehicle operation cost (VOC) as well as to perform the economic analysis. The data is also used to develop dynamic traffic simulation especially for analysis of some sub-project locations with complicated road structure, that is, Semanggi junction.
3.1.1 Directional Traffic Count Survey
(1) Survey Period
Directional traffic count survey was carried out for each turning direction (including U-turns) for 16 hours from 6:00 to 22:00 on one weekday excluding Monday and Friday.
(2) Type of Vehicles
The types of vehicles for this survey are classified into the following 10 categories:
Motorcycle, bajaj, becak motor
Private cars (sedan, jeep, kijang, etc.), taxi,
Small bus (bemo, mikrolet, angkutan kota),
Medium bus (Metromini, Kopaja),
Large bus (including city bus, school bus, tourist bus),
Pickup, small truck (2 axis)
Truck 2 axis 3/4 ton (Colt, Diesel), large truck (2 axis),
Truck 3 axis,
Truck 4 axis, and
Truck 5 axis or more.
(3) Number Plate Survey for Semanggi
For Semanggi junction, a number plate survey was conducted in order to more accurately estimate the volume of directional traffic flow which passes the intersection including U-turn traffic and to evaluate several improvement plans by dynamic traffic simulation. In the number plate survey, local OD pattern data to/from the four directions was determined by manually recording the number plates of all vehicles passing the survey points in the above survey period. The analysis result is presented later in the Semanggi section.
(4) Survey Result
By making use of the counting survey data, traffic volumes for 16 hours are summarized in Table 3.1.1. Among the 10 sub-projects, locations of (1) Semanggi, (8) Kuningan, (9) Pancoran, and (18) Senayan are relatively large-scale intersections with daily (16-hour)

Preparatory Survey for Metropolitan Arterial Road Improvement Project Final Report
3-2
traffic volume of over 100,000 pcu. In terms of scale of traffic volume, major traffic flow matches with the flyover/underpass direction to be improved at all the locations.
Table 3.1.1 Traffic Volume at 10 Sub-Project Locations
No. LocationFO/UP
DirectionFromNorth
FromSouth
From EastFromWest
Total
1 Semanggi*1 108,994 71,949 62,987 65,505 309,435
4 R.E. Martadinata E-W 3,786 - 16,375 13,509 33,670
5 Sulawesi- Tg. PA N-S 23,504 16,723 - 18,207 58,435
8 Kuningan N-S 37,545 57,873 53,700 32,331 181,448
9 Pancoran E-W 38,789 49,003 48,509 38,670 174,972
13 Pinang Baris E-W 4,235 15,806 29,338 37,774 87,154
15 Katamso E-W 18,035 14,149 22,415 30,345 84,944
16 Sudirman II N-S 27,106 33,724 16,495 - 77,325
17 Cikarang*2 28,155 35,622 8,203 12,737 84,716
18 Senayan 53,747 32,902 22,065 5,568 114,282
Traffic Volume [pcu/16 hrs]
Note: *1North-south direction is Jl. Sudirman while east-west direction is Jl. Gatot Subroto. *2North-south direction is Jl. Cibarusah while east-west direction is Jl. Kalimalang. Yellow cells show main directions for flyovers/underpasses. Source: Traffic Survey, JICA Survey Team
3.1.2 Signal Phasing Survey
Traffic signal phasing patterns and times were recorded to obtain the basic data for analysis of the intersections. The survey was performed on the same day as the directional traffic count survey. Signal phasing was recorded for two hours of morning peak period (7:00-9:00), midday period (12:00-14:00), and evening peak period (16:00-18:00), respectively.
As a result of the signal phasing survey, cycle times at the seven sub-projects with traffic signals are summarized in Table 3.1.2. Overall, average cycle times are over three minutes or even longer, causing tremendous travel time delay. In developed countries, however, cycle times generally should be around 60 to 90 seconds even at large-scale intersections. Such too long cycle times of intersections will not only increase the travel time delay and irritate the drivers but also tend to cause dangerous driving behaviors such as rushing into the intersections. Along with the intersection improvement in this project, cycle times will be limited to 120 seconds at the maximum.
Table 3.1.2 Average Cycle Times at Signalized Sub-Project Locations
No. IntersectionFO/UP
DirectionMorning
(7:00-9:00)Midday
(12:00-14:00)Evening
(16:00-18:00)5 Sulawesi- Tg. PA N-S 138 136 138
8 Kuningan N-S 254 204 219
Mampang N-S 271 273 278
9 Pancoran E-W 228 185 225
13 Pinang Baris E-W 303 343 368
15 Katamso E-W 205 191 186
16 Sudirman II N-S 113 189 184
Sudirman - Daan Mogot 165 184 246
18 Senayan 225 303 382
Cycle Time [sec.]
Source: Traffic Survey, JICA Survey Team
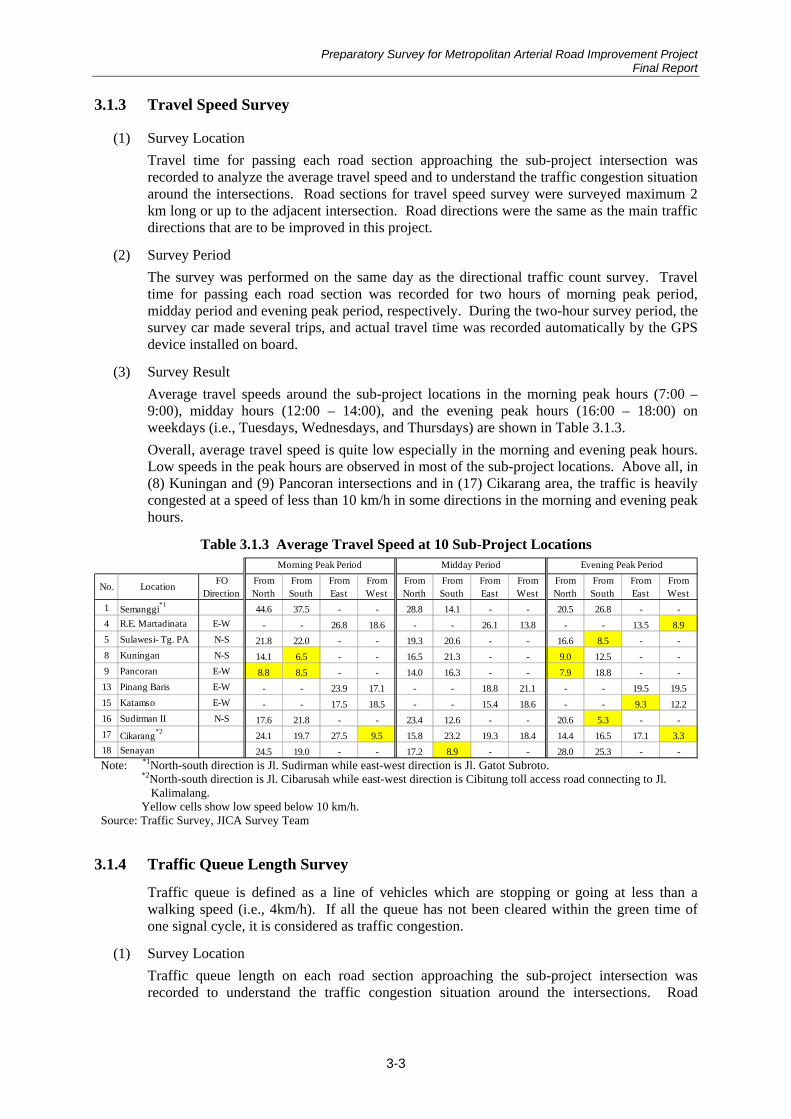
Preparatory Survey for Metropolitan Arterial Road Improvement Project Final Report
3-3
3.1.3 Travel Speed Survey
(1) Survey Location
Travel time for passing each road section approaching the sub-project intersection was recorded to analyze the average travel speed and to understand the traffic congestion situation around the intersections. Road sections for travel speed survey were surveyed maximum 2 km long or up to the adjacent intersection. Road directions were the same as the main traffic directions that are to be improved in this project.
(2) Survey Period
The survey was performed on the same day as the directional traffic count survey. Travel time for passing each road section was recorded for two hours of morning peak period, midday period and evening peak period, respectively. During the two-hour survey period, the survey car made several trips, and actual travel time was recorded automatically by the GPS device installed on board.
(3) Survey Result
Average travel speeds around the sub-project locations in the morning peak hours (7:00 – 9:00), midday hours (12:00 – 14:00), and the evening peak hours (16:00 – 18:00) on weekdays (i.e., Tuesdays, Wednesdays, and Thursdays) are shown in Table 3.1.3.
Overall, average travel speed is quite low especially in the morning and evening peak hours. Low speeds in the peak hours are observed in most of the sub-project locations. Above all, in (8) Kuningan and (9) Pancoran intersections and in (17) Cikarang area, the traffic is heavily congested at a speed of less than 10 km/h in some directions in the morning and evening peak hours.
Table 3.1.3 Average Travel Speed at 10 Sub-Project Locations
No. LocationFO
DirectionFromNorth
FromSouth
FromEast
FromWest
FromNorth
FromSouth
FromEast
FromWest
FromNorth
FromSouth
FromEast
FromWest
1 Semanggi*1
44.6 37.5 - - 28.8 14.1 - - 20.5 26.8 - -
4 R.E. Martadinata E-W - - 26.8 18.6 - - 26.1 13.8 - - 13.5 8.9
5 Sulawesi- Tg. PA N-S 21.8 22.0 - - 19.3 20.6 - - 16.6 8.5 - -
8 Kuningan N-S 14.1 6.5 - - 16.5 21.3 - - 9.0 12.5 - -
9 Pancoran E-W 8.8 8.5 - - 14.0 16.3 - - 7.9 18.8 - -
13 Pinang Baris E-W - - 23.9 17.1 - - 18.8 21.1 - - 19.5 19.5
15 Katamso E-W - - 17.5 18.5 - - 15.4 18.6 - - 9.3 12.2
16 Sudirman II N-S 17.6 21.8 - - 23.4 12.6 - - 20.6 5.3 - -
17 Cikarang*2
24.1 19.7 27.5 9.5 15.8 23.2 19.3 18.4 14.4 16.5 17.1 3.3
18 Senayan 24.5 19.0 - - 17.2 8.9 - - 28.0 25.3 - -
Morning Peak Period Midday Period Evening Peak Period
Note: *1North-south direction is Jl. Sudirman while east-west direction is Jl. Gatot Subroto.
*2North-south direction is Jl. Cibarusah while east-west direction is Cibitung toll access road connecting to Jl. Kalimalang.
Yellow cells show low speed below 10 km/h. Source: Traffic Survey, JICA Survey Team
3.1.4 Traffic Queue Length Survey
Traffic queue is defined as a line of vehicles which are stopping or going at less than a walking speed (i.e., 4km/h). If all the queue has not been cleared within the green time of one signal cycle, it is considered as traffic congestion.
(1) Survey Location
Traffic queue length on each road section approaching the sub-project intersection was recorded to understand the traffic congestion situation around the intersections. Road

Preparatory Survey for Metropolitan Arterial Road Improvement Project Final Report
3-4
sections for queue length survey were surveyed maximum 2 km long or up to the adjacent intersection.
(2) Survey Period
The survey was performed on the same day as the directional traffic count survey. Traffic queue length was recorded by observing the start and end points of the queue at every 5 minutes for two hours of morning peak period, evening peak period and daytime off-peak period, respectively.
(3) Survey Result
Average queue lengths around the sub-project locations in the morning peak hours (7:00 – 9:00), midday hours (12:00 – 14:00), and the evening peak hours (16:00 – 18:00) on weekdays (i.e., Tuesdays, Wednesdays, and Thursdays) are shown in Table 3.1.4. Long queues over 500 meters are observed in many sub-project locations. Among others, in (1) Semanggi, (9) Pancoran, and (17) Cikarang, long traffic queues are observed for most of the day.
Table 3.1.4 Average Queue Length at 10 Sub-Project Locations
No. LocationFO
DirectionFromNorth
FromSouth
FromEast
FromWest
FromNorth
FromSouth
FromEast
FromWest
FromNorth
FromSouth
FromEast
FromWest
1 Semanggi*1 0 60 0 0 30 280 460 760 40 140 610 680
5 Sulawesi- Tg. PA N-S 60 60 - 30 40 120 - 40 190 250 - 220
8 Kuningan N-S 70 330 230 340 100 110 360 460 380 240 190 260
Mampang 160 1,420 40 210 220 290 50 40 320 390 40 710
9 Pancoran E-W 770 590 1,000 40 210 220 1,080 30 640 200 920 50
13 Pinang Baris E-W 30 60 50 260 40 90 140 180 40 100 110 100
15 Katamso E-W 80 70 60 70 90 50 110 50 100 50 370 190
16 Sudirman II N-S 70 60 40 - 110 50 30 - 200 70 30 -
Sudirman - Daan Mogot 140 140 50 90 370 150 40 170 1,190 170 120 220
17 Jl. Cibarusah (Toll Entrance) 1,070 20 - 140 510 50 - 60 960 70 - 300
Jl. Cibarusah & Jl. Kalimalang 20 20 - - 70 0 - - 340 10 - -
Jl. Cibarusah & Jl. Jababeka Raya 20 100 - 30 20 50 - 50 50 10 - 10
Cibitung Toll Access 540 110 - - 70 20 - - 690 130 - -
18 Senayan*2 110 310 50 0 230 430 80 0 750 150 30 10
Morning Peak Period(7:00-9:00)[m]
Midday Period(12:00-14:00)[m]
Evening Peak Period(16:00-18:00)[m]
Note: *1North-south direction is Jl. Sudirman while east-west direction is Jl. Gatot Subroto.
*2Direction from east is Jl. Pattimura. Yellow cells show long queues over 500 m.
Source: Traffic Survey, JICA Survey Team

Preparatory Survey for Metropolitan Arterial Road Improvement Project Final Report
3-5
3.2 Updates of Existing Plans of Flyovers/Underpasses
(1) Progress of Following Up on SITRAMP
Since 2003, in which a JICA study called SITRAMP (“The Study on Integrated Transportation Master Plan for JABODETABEK (Phase II)”) (2001 – 2004) was in progress, DKI has had a plan of totally designated 53 intersections for future development including construction of flyovers/underpasses. Some were under construction at that time, and some are expected to be improved in near future based on a five year development program.
Those planned intersections in DKI are listed in Table 3.2.1 and plotted in Figure 3.2.1. In SITRAMP, some of those intersections were prioritized as “Single Improvement of Intersections” and as “Route Improvement”. As of 2011, out of those 53 planned intersections, there are 21 intersections where flyovers/underpasses have already been constructed with a national, local government, or private fund. There are also some other intersection improvements that have been added and planned/implemented by local government including DKI.
The 15 potential project and 8 sub-project locations in JABODETABEK are also plotted in Figure 3.2.1. There are five sub-projects that match with the improvement plans proposed in SITRAMP; namely, (1) Semanggi, (5) Sulawesi – Tg. Priok Access, (8) Kuningan, and (9) Pancoran. Among others, (8) Kuningan and (9) Pancoran have been proposed as intersections for route improvement, that is, for Mampang – Kuningan corridor and Jl. Pasar Minggu – Tg. Barat corridor, respectively. For currently ongoing JABODETABEK Urban Transportation Policy Integration (JUTPI) Project, those 15 potential projects as well as the selected 8 sub-projects will be incorporated into the revised transportation master plan.
(2) Projects for Railway Development
On the other hand, it should be noted that, since urban railway development is planned in JABODETABEK including double tracking and increase of train services, improvements involving grade separation at railway crossings are given priority for safety and ease of congestion of the roads. Such railway developments that are related to the above-mentioned flyover/underpass plans in DKI are presented in Figure 3.2.1. Of the eight potential project locations in JABODETABEK:
(4) R.E. Martadinata and (5) Sulawesi – Tg. Priok Access are located on Tg. Priok railway line, which is to be double-tracked (at grade) and partially to be reactivated (for (5));
(16) Sudirman II is located on Tangerang railway line, which is to be double-tracked (at grade); and
As for (1) Semanggi and (18) Senayan, they are located on the planned MRT (mass rapid transit) line, which is to be developed underground (for (1) and (18)) while the section south of Blok M is to be elevated. Though the MRT line is not planned to be developed at grade, the structure must be considered when designing flyovers/ underpasses in these locations.

Preparatory Survey for Metropolitan Arterial Road Improvement Project Final Report
3-6
Table 3.2.1 Intersections for Future Improvement in DKI Proposed in SITRAMP No. Location Remarks Type Status
1 T.B Simatupang / Tanjung Barat JORR / Pasar Minggu Raya Flyover Completed
2 T.B Simatupang / Jl. Raya Bogor JORR / Raya Bogor Flyover Completed
3 Ps. Minggu / Volvo Flyover
4 A. Yani / Pemuda Cawang-Tanjung Priok Flyover Completed
5 P. Kemerdekaan / P. Gadung Flyover
6 Akses Utara Kemayoran Flyover
7 S. Parman / Grogol (Citra Land) North - South Flyover
8 D. Mogot / Rute D / Angke / Rel KA Flyover Completed
9 A.Yani / Suparto / P. Kemerdekaan Cawang -Tanjung Priok Flyover Completed
10 Latumentten (Rel KA) Tangerang Line (Railway) Flyover
11 Bekasi - Dr. Rajiman Flyover
12 Ps. Minggu / Kalibata Flyover
13 Extension Pasar Pagi Flyover Completed
14 Cideng / Moh. Zainul Arifin Flyover
15 Cideng / Hasyim Ashari Flyover
16 Cideng / Caringgin Flyover
17 Penggilingan / Ngurah Rai Close to JORR Pd. Pinang Flyover Completed
18 Pramuka / Rel KA Eastern Line Underpass Completed
19 Sultan Agung / Minangkabau Manggarai Flyover
20 Penyempurnaan Jbt. Latuharhary / Rasuna Said Dukuh Atas Line Widening Completed
21 Administrasi / Pejompongan Flyover
22 Suproto / Galur Flyover Completed
23 Suproto / Rel KA Eastern Line Underpass Completed
24 Patung Tani Kebon Sirih Flyover
25 Kebon Sirih / Thamrin Underpass
26 Kebon Sirih / Abdul Muis Flyover
27 Martadinata / Gunung Sahari Near harbor toll road Flyover Completed
28 Gunung Sahari / Industri / P. Jayakarta Flyover
29 Gunung Sahari / Samanhudi / Angkasa Flyover Completed
30 Sudirman / Sisingamangaraja Underpass
31 Sisingamanganraja / Trunojoyo (cws) Flyover
32 Hasyim Ashari / Rel KA ITC Roxy Mas Flyover Completed
33 Kalibata / Rel KA Bogor Line Flyover Completed
34 Santa / Wijaya II Underpass
35 Suharso / Kebayoran Lama Flyover
36 Pondok Indah Metro Pondok Indah Underpass Completed
37 Enggano / Yos Sudarso Tanjung Priok Flyover
38 Utan Panjang / Kemayoran Gempol Kemayoran Flyover
39 Gatot Subroto / Kuningan Flyover
40 Gatot Subroto / Pancoran Flyover
41 Sudirman CBD Underpass
42 CBD - Gatot Subroto Flyover
43 Mampang - Kuningan North - South Underpass
44 S. Parman Tomang (Grogol) - Slipi Underpass Completed
45 Kelapa Gading - Printis Kemerdekaan Flyover
46 Pelebaran Jbt, Perjuangan (Tol) Widening
47 Daan Mogot / Outer Ring Road
48 Outer Ring Road / Rail Crossing
49 Stasiun Cakung
50 Juanda Underpass Completed
51 Sultan Iskandar Muda Underpass Completed
52 Pasar Minggu Underpass Completed
53 Cawang Underpass Completed
Source: SITRAMP, 2004

3-7
Preparatory Survey for Metropolitan Arterial Road Improvement ProjectFinal Report
Fi
gure
3.2
.1 U
pdat
es o
f Pla
nned
Fly
over
s and
Und
erpa
sses
Sou
rce:
JIC
A S
urve
y T
eam
bas
ed o
n SI
TR
AM
Pan
d D
KI
Jaka
rta

Preparatory Survey for Metropolitan Arterial Road Improvement Project Final Report
3-8
3.3 Travel Demand Forecast For the ten sub-project locations, traffic demand forecast at each intersection is conducted based on the results of the above-mentioned traffic survey and the existing traffic demand forecast model available in SITRAMP and JUTPI.
SITRAMP developed the transportation demand forecast model based on four step method as outlined below. Since reliability of this methodology has been empirically proven and has been applied to demand forecast of many road and public transportation projects including JUTPI, this methodology is also applied to project.
Source: SITRAMP, 2004
Figure 3.3.1 SITRAMP Demand Forecast Flow
Although the basic flow of demand forecast procedure is the same as SITRAMP shown above, in JUTPI, each demand forecast model of the process such as production/attraction, distribution and modal choice has been revised and updated considering current transition in travel behavior.
(1) Zone system
The traffic analysis for demand forecast is based on the SITRAMP 336 zone system and the transportation network that has been recently updated in JUTPI.

Preparatory Survey for Metropolitan Arterial Road Improvement Project Final Report
3-9
Source: SITRAMP, 2004
Figure 3.3.2 Traffic Analysis Zone System
Source: JUTPI, 2011
Figure 3.3.3 Computerized Transportation Network (Example of Central Jakarta)
(2) Production/Attraction
SITRAMP has developed production/attraction model by trip purpose, by area type (urban/rural) by income level for JABODETABEK region and this model was employed for

Preparatory Survey for Metropolitan Arterial Road Improvement Project Final Report
3-10
this project as well. Explaining variables of these models are socio-economic indices such as population by income level, the number of students by school type, the number of workers by industry, and so forth. For each explanatory variable, the aggregation data from the JUTPI commuter survey was utilized.
(3) Distribution
Taking the above-mentioned production/attraction volume as input, Fratar method was utilized to estimate distribution of trips by purpose in 2020 and 2030 cases. The urban development scenario recommended in JUTPI is the case with urban sub-center development and moderate development along railway and busway corridor development with traffic demand management (TDM) policy. For the existing case, person trip distribution pattern based on the commuter survey and the person tracking survey in JUTPI was utilized for development of the distribution model.
(4) Modal Choice
There has been a significant change in modal share since SITRAMP was formulated in 2004. According to the vehicle registration statistics, the number of motorcycles almost doubled in the five years while the increase in the number of registered passenger cars and trucks was relatively moderate. With development of financial load for comparatively lower income people as well as the worsening traffic congestion, motorcycles have increased popularity.
0
1,000,000
2,000,000
3,000,000
4,000,000
5,000,000
6,000,000
7,000,000
8,000,000
1975
1976
1977
1978
1979
1980
1981
1982
1983
1984
1985
1986
1987
1988
1989
1990
1991
1992
1993
1994
1995
1996
1997
1998
1999
2000
2001
2002
2003
2004
2005
2006
2007
2008
g
MotorcyclesCarsTrucksBuses
Source: Polda Metro Jaya
Figure 3.3.4 Number of Regitered Vehicles in Jakarta, Depok, Tangerang and Bekasi
Based on the aforementioned commuter survey and the person tracking survey in JUTPI, a modal choice model for motorized transportation was developed which can take current mode choice behavior into account. A disaggregate behavioral model (or individual choice model) was employed for JUTPI while SITRAMP employed diversion curve model. It is a relatively stable modeling method in terms of space and time difference. Even though spatial location or time is not equal, individual choice of a certain group of people in specific condition such as travel time and fare is empirically stable.
With regard to mathematical structure, a prevalent “multi-nominal logit model”, which can represent unique characteristics of each choice such as transportation mode, was employed for JUTPI as well as for this project.
(5) Traffic Assignment
Transit and road traffic assignment was conducted by an incremental assignment method. There were a total of 40 stages of assignment by income level and transportation mode.
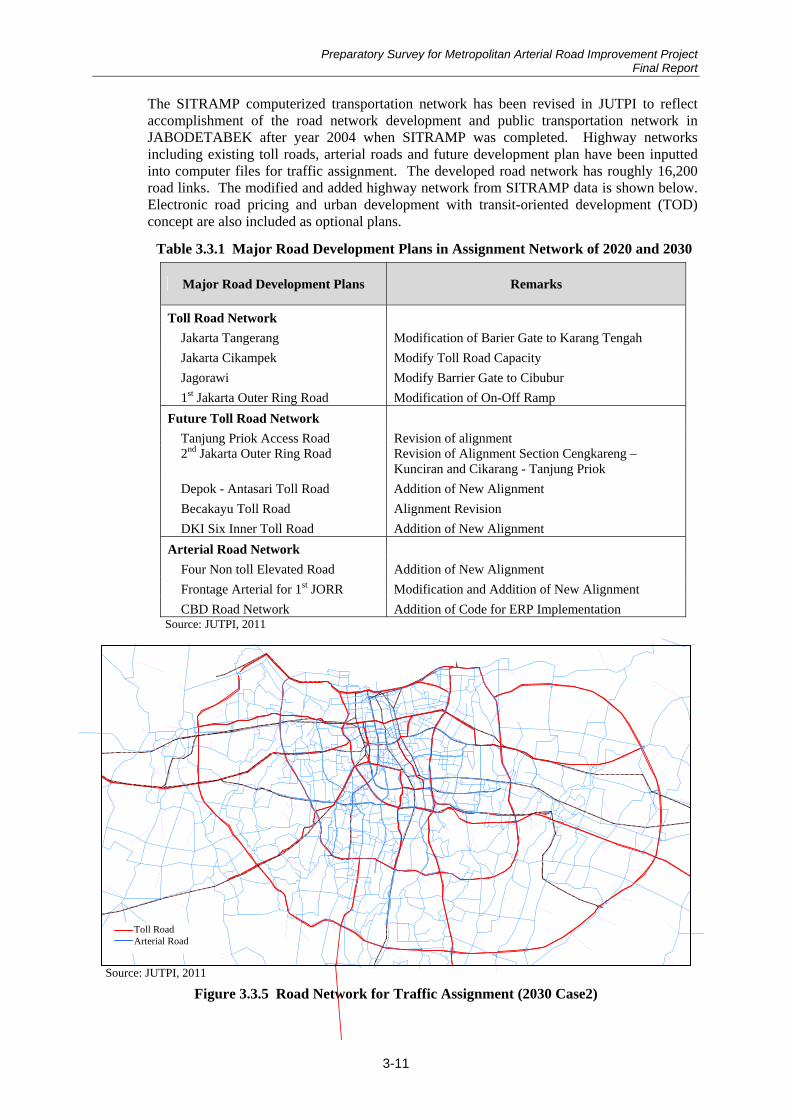
Preparatory Survey for Metropolitan Arterial Road Improvement Project Final Report
3-11
The SITRAMP computerized transportation network has been revised in JUTPI to reflect accomplishment of the road network development and public transportation network in JABODETABEK after year 2004 when SITRAMP was completed. Highway networks including existing toll roads, arterial roads and future development plan have been inputted into computer files for traffic assignment. The developed road network has roughly 16,200 road links. The modified and added highway network from SITRAMP data is shown below. Electronic road pricing and urban development with transit-oriented development (TOD) concept are also included as optional plans.
Table 3.3.1 Major Road Development Plans in Assignment Network of 2020 and 2030
Major Road Development Plans Remarks
Toll Road Network
Jakarta Tangerang Modification of Barier Gate to Karang Tengah
Jakarta Cikampek Modify Toll Road Capacity
Jagorawi Modify Barrier Gate to Cibubur
1st Jakarta Outer Ring Road Modification of On-Off Ramp
Future Toll Road Network
Tanjung Priok Access Road Revision of alignment 2nd Jakarta Outer Ring Road Revision of Alignment Section Cengkareng –
Kunciran and Cikarang - Tanjung Priok
Depok - Antasari Toll Road Addition of New Alignment
Becakayu Toll Road Alignment Revision
DKI Six Inner Toll Road Addition of New Alignment
Arterial Road Network
Four Non toll Elevated Road Addition of New Alignment
Frontage Arterial for 1st JORR Modification and Addition of New Alignment
CBD Road Network Addition of Code for ERP Implementation Source: JUTPI, 2011
Source: JUTPI, 2011
Figure 3.3.5 Road Network for Traffic Assignment (2030 Case2)
Toll Road Arterial Road

Preparatory Survey for Metropolitan Arterial Road Improvement Project Final Report
3-12
As the road network assignment result from JUTPI, 2010 Case 0, which is a base case, and 2030 Case 2, which is a road moderate and public transport intensive case recommended by JUTPI, are presented in Figure 3.3.6 and Figure 3.3.7, respectively. For forecast of the future traffic at the eight sub-projects in JABODETABEK, traffic volumes are looked up in the network assignment result, and the annual growth is calculated as shown in Table 3.3.2.
Source: JUTPI, 2011
Figure 3.3.6 Road Network Assignment Result (2010 Case 0)
Source: JUTPI, 2011
Figure 3.3.7 Road Network Assignment Result (2030 Case2)

Preparatory Survey for Metropolitan Arterial Road Improvement Project Final Report
3-13
Table 3.3.2 Traffic Demand Forecast at Eight Sub-Project Locations in JABODETABEK Daily Traffic Volume [PCU]
No. Location FO/UP
Direction 2010 Existing 2030 Forecast
Growth from 2010
to 2030
Annual Growth
1 Semanggi 285,838 464,407 1.62 2.5%
4 R.E. Martadinata
E-W 38,912 45,754 1.18 0.8%
5 Sulawesi- Tg. PA
N-S 75,770 127,716 1.69 2.6%
8 Kuningan N-S 230,903 271,695 1.18 0.8%
9 Pancoran E-W 199,126 264,916 1.33 1.4%
16 Sudirman II N-S 72,116 105,881 1.47 1.9%
17 Cikarang 57,488 77,175 1.34 1.5%
18 Senayan 233,976 371,811 1.59 2.3%
Source: JICA Survey Team’s estimate based on JUTPI, 2011
For forecast of the future traffic at the two sub-projects in Medan, traffic volumes are taken from the recent studies in which the demand was forecasted based on a similar four step method, and the annual growth is calculated as shown in Table 3.3.3.
Table 3.3.3 Traffic Demand Forecast at Two Sub-Project Locations in Medan
No. Location FO/UP
DirectionYears for
ComparisonGrowth Annual Growth
13 Pinang Baris E-W 2011-2026 1.22 1.3%
15 Katamso E-W 2015-2040 1.69 2.1%
Source: JICA Survey Team’s estimate based on “FS Grade Separated Intersection Pinang Baris Medan” (2006) and “Studi Kelayakan Simpang Tak Sebidang Brigjend. Katamso – AH Nasution Medan” (2010)

Preparatory Survey for Metropolitan Arterial Road Improvement Project Final Report
3-14
3.4 Traffic Analysis of Sub-Projects
3.4.1 Semanggi Junction
Regarding Semanggi junction, it has a complicated structure with many inflows and outflows and it is difficult to evaluate the project benefit by forecasting the travel speed and travel time delay. As shown in Table 3.4.1, which is made based on the traffic count survey conducted for this project, inflow volumes from the four directions vary and fluctuate depending on the hours of the day. While the inflow traffic volumes are about the same in all the four directions in the morning hours (7:00 – 10:00), the largest inflow volume is observed in the direction from Kota in the midday and evening hours.
Source: JICA Survey Team
Figure 3.4.1 Hourly Traffic Volume at Semanggi
Therefore, a dynamic simulation analysis was carried out to evaluate several improvement plans by dynamically simulating the traffic. For this, the above-mentioned number plate survey was conducted at the inflow and outflow survey points in order to more accurately estimate the volume of directional traffic flow which passes the intersection including U-turn traffic. In the number plate survey, local OD pattern data to/from the four directions was determined by manually recording the number plates of all vehicles passing the survey points.
Hourly turning movement (i.e., left, straight, right, and U-turns) compositions from the four directions are presented in Figure 3.4.2. Overall, larger compositions of left, right, and U-turns are observed on Jl. Gatot Subroto, while majority of straight traffic is observed on Jl. Sudirman for most of the day. Relatively high U-turn ratios are also observed on Jl. Gatot Subroto. From Kuningan, among others, there are more U-turns than right turns from midday to evening hours, implying that U-turns are so important in this intersection.

Preparatory Survey for Metropolitan Arterial Road Improvement Project Final Report
3-15
[From Slipi] [From Kota]
0%
10%
20%
30%
40%
50%
60%
70%
80%
6:00 7:00 8:00 9:00 10:00 11:00 12:00 13:00 14:00 15:00 16:00 17:00
Hour Starting at
Left Straight Right U-turn
0%
10%
20%
30%
40%
50%
60%
70%
80%
6:00 7:00 8:00 9:00 10:00 11:00 12:00 13:00 14:00 15:00 16:00 17:00
Hour Starting at
Left Straight Right U-turn
[From Blok M] [From Kuningan]
0%
10%
20%
30%
40%
50%
60%
70%
80%
6:00 7:00 8:00 9:00 10:00 11:00 12:00 13:00 14:00 15:00 16:00 17:00
Hour Starting at
Left Straight Right U-turn
0%
10%
20%
30%
40%
50%
60%
70%
80%
6:00 7:00 8:00 9:00 10:00 11:00 12:00 13:00 14:00 15:00 16:00 17:00
Hour Starting at
Left Straight Right U-turn
Source: JICA Survey Team
Figure 3.4.2 Hourly Turning Movements at Semanggi
(1) Simulation of Present Condition
Travel speeds (on Jl. Sudirman only) and traffic congestion queue lengths from the traffic survey and from the dynamic simulation result are compared for morning peak, midday, and evening peak hours, as shown in Figure 3.4.3. From the viewpoint of the scale of the queue lengths and average speeds as well as their daily variations, it may be concluded that the dynamic simulation can regenerate the traffic situation in Semanggi well. Though differences from the survey result may exist in some directions, result of the dynamic simulation of the existing situation can be utilized as a base case to evaluate the benefit of each improvement alternative by forecasting the travel speed and travel time delay.

Preparatory Survey for Metropolitan Arterial Road Improvement Project Final Report
3-16
Morning: [Survey] [Simulation]
Midday: [Survey] [Simulation]
Evening: [Survey] [Simulation]
Source: JICA Survey Team
Figure 3.4.3 Comparison of Survey and Simulation Results
(2) Simulation of Alternative 1: Flyover on Jl. Gatot Subroto
Alternative 1 to be evaluated involves new construction of a flyover with two lanes/directions on Jl. Gatot Subroto to provide additional space for merging to/from Jl. Sudirman as presented in Figure 3.4.4.

Preparatory Survey for Metropolitan Arterial Road Improvement Project Final Report
3-17
Taper and new slow lane for the access to loop ramp is constructed.
The loop ramp and the new slow lane are connected by the slight modification of vertical and horizontal alignment.
New slow lane is merged with the L-turn ramp.
Main lane is isolated from the new slow lane.
L-turn ramp
L-turn ramp
Jl. Sudirman
Jl. Gatot Subroto
Loop Ramp
Existing slow lane
From Jl. Sudirmanto Jl. Gatot Subroto
From Jl. Gatot Subrototo Jl. Sudirman
Weaving Section
Source: JICA Survey Team
Figure 3.4.4 Alternative 1: Flyover on Jl. Gatot Subroto
In Alternative 1, while the inflow traffic volume Jl. Gatot Subroto is as large as in the present case, congestion on the straight through lane will be eased because of an additional merging lane on Jl. Gatot Subroto (Figure 3.4.5b). However, except for the above improvement, other problems will remain the same such as merging from the slow lane to the fast lane on Jl. Sudirman (Figure 3.4.5a) and weaving from/to the on-/off-loop ramps.
[a] [b]
Source: JICA Survey Team
Figure 3.4.5 Screenshots of Dynamic Simulation: Alternative 1
(3) Simulation of Alternative 2-1: New Exclusive Lane on Jl. Sudirman
Alternative 2-1 to be evaluated involves new construction of a new exclusive lane on the slow lane of Jl. Sudirman, connecting from the left turn (slow) lane to the on-loop ramp to Jl. Gatot Subroto, as presented in Figure 3.4.6.
To Slipi To Kota
Merging from slow to fast lanes Additional merging
lane

Preparatory Survey for Metropolitan Arterial Road Improvement Project Final Report
3-18
L-turn rampSlow lane
L-turn ramp
Jl. Sudirman
Jl. Gatot Subroto
Loop Ramp
Existing slow lane
From Jl. Sudirmanto Jl. Gatot Subroto
From Jl. Gatot Subrototo Jl. Sudirman
The box culvert and slow lane are expanded to secure the enough two lanes
Main lane is isolated from existing diverted ramp.(Only U-turn traffic from Jl.Gatot Subroto can be merged)
New exclusive lane is merged with the loop ramp
The slow lane is separated to the existing slow lane and loop ramp.
The existing ramp should be same level as the slow lane.
Weaving SectionThe median between the fast and slow lanes are closed.
Source: JICA Survey Team
Figure 3.4.6 Alternative 2-1: New Exclusive Lane on Jl. Sudirman
Congestion on the fast lane on Jl. Sudirman will be alleviated because the merging will not occur except for the U-turn traffic coming from the off-loop ramp and going into the on-loop ramp. However, merging on Jl. Gatot Subroto may become a bottleneck (Figure 3.4.7a) and the slow traffic may spill back on the loop ramp and the new exclusive lane, and further back to the slow lane of Jl. Sudirman (Figure 3.4.7b). Another potential problem is the left, right, and U-turn traffic from the fast lane of Jl. Sudirman trying to go into the slow lane, causing bottleneck upstream on Jl. Sudirman (Figure 3.4.7c).
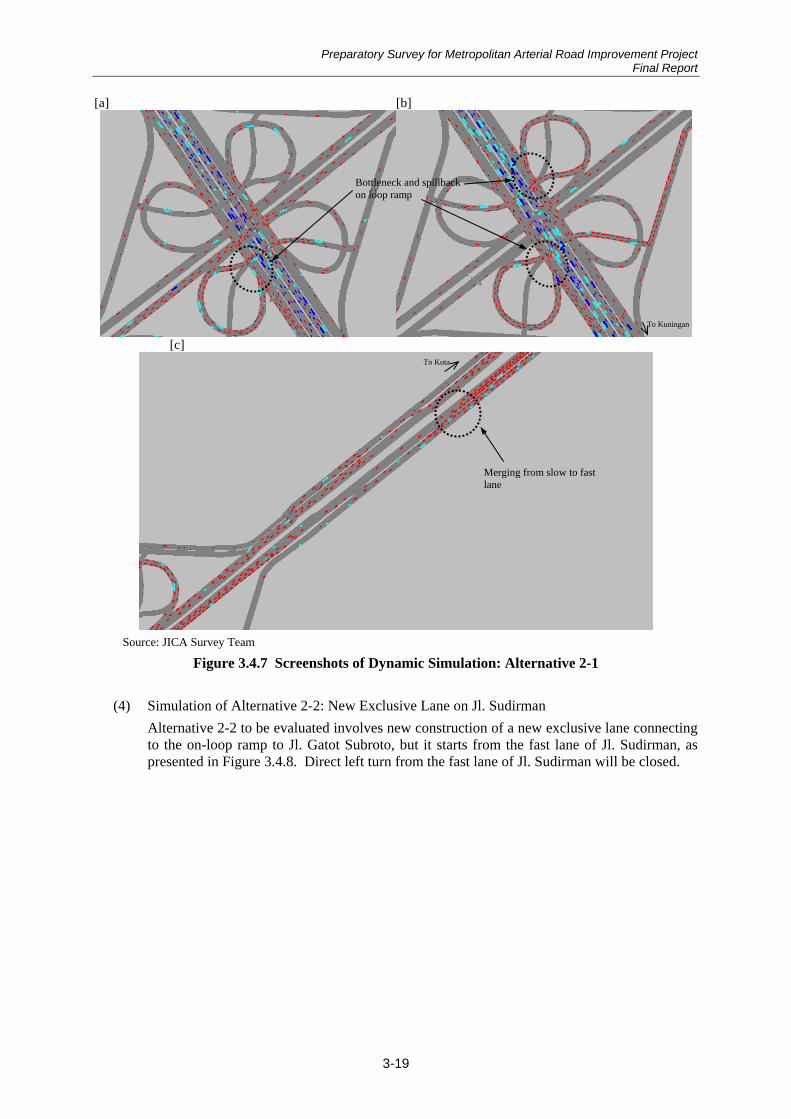
Preparatory Survey for Metropolitan Arterial Road Improvement Project Final Report
3-19
[a] [b]
[c]
Source: JICA Survey Team
Figure 3.4.7 Screenshots of Dynamic Simulation: Alternative 2-1
(4) Simulation of Alternative 2-2: New Exclusive Lane on Jl. Sudirman
Alternative 2-2 to be evaluated involves new construction of a new exclusive lane connecting to the on-loop ramp to Jl. Gatot Subroto, but it starts from the fast lane of Jl. Sudirman, as presented in Figure 3.4.8. Direct left turn from the fast lane of Jl. Sudirman will be closed.
To Kuningan
To Kota
Bottleneck and spillback on loop ramp
Merging from slow to fast lane

Preparatory Survey for Metropolitan Arterial Road Improvement Project Final Report
3-20
New ramp Slow lane
L-turn ramp
Jl. Sudirman
Jl. Gatot Subroto
New loop RampExisting slow lane
From Jl. Sudirmanto Jl. Gatot Subroto
From Jl. Gatot Subrototo Jl. Sudirman
Control the traffic from mainline. (Eg. Only allow U-turn traffic from Jl.Gatot Subroto to enter the ramp)
New exclusive lane is to be connected with the exisitng loop ramp using R≒30m Close the left –turn ramp
Keep the existing slow lane separted from the new exclusive ramp
Gradient of existing slow lanes is 8-9%.
Keep the exisiting box culvert for exclusive for slow lane traffic
Close the opening between the fast and slow lanes.
Weaving Section
Close the opening between the fast and slow lanes.
Source: JICA Survey Team
Figure 3.4.8 Alternative 2-2: New Exclusive Lane on Jl. Sudirman
In Alternative 2-2, congestion on the fast lane on Jl. Sudirman will also be alleviated because the merging will not occur except for the U-turn traffic coming from the off-loop ramp and going into the on-loop ramp. However, merging on Jl. Gatot Subroto may become a bottleneck (Figure 3.4.9a) and the slow traffic may spill back on the loop ramp and the new exclusive lane, and further back to the fast lane of Jl. Sudirman (Figure 3.4.9b). Another potential problem is the left-turn traffic from the fast lane of Jl. Sudirman trying to go into the slow lane due to the left-turn lane closure, causing bottleneck upstream on Jl. Sudirman (Figure 3.4.9c), though the problem is not so critical as in Alternative 2-1, which involves all turning traffic.

Preparatory Survey for Metropolitan Arterial Road Improvement Project Final Report
3-21
[a] [b]
[c]
Source: JICA Survey Team
Figure 3.4.9 Screenshots of Dynamic Simulation: Alternative 2-2
(5) Simulation of Alternative 3: New Slow Lane on Jl. Sudirman
Alternative 3 to be evaluated involves new construction of an additional slow lane on Jl. Sudirman, which is shifted beside the fast lane but physically separated, serving only the traffic merging to/from the on-/off-loop ramps, as presented in Figure 3.4.10.
To Blok M
To Kota
Bottleneck and spillback on loop ramp
Merging from slow to fast lanes
To Kota

Preparatory Survey for Metropolitan Arterial Road Improvement Project Final Report
3-22
Taper and new slow lane for the access to loop ramp is constructed.
The loop ramp and the new slow lane are connected by the slight modification of vertical and horizontal alignment.
New slow lane is merged with the L-turn lamp.
The existing slow lane is shifted next to the new slow lane.
Main lane is isolated from the new slow lane.
L-turn ramp
New slow lane
L-turn ramp
Jl. Sudirman
Jl. Gatot Subroto
Loop Ramp
Existing slow lane
From Jl. Sudirmanto Jl. Gatot Subroto
From Jl. Gatot Subrototo Jl. Sudirman
Weaving Section
Source: JICA Survey Team
Figure 3.4.10 Alternative 3: New Slow Lane on Jl. Sudirman
In Alternative 3, merging from the off-loop ramp with the new slow lane on Jl. Sudirman may become a bottleneck causing congestion on the loop ramp (Figure 3.4.11a). Meanwhile, merging on Jl. Gatot Subroto may become a bottleneck and the slow traffic may spill back on the loop ramp and the new slow lane (Figure 3.4.11b), blocking the traffic on the fast lane of Jl. Sudirman (Figure 3.4.11d).
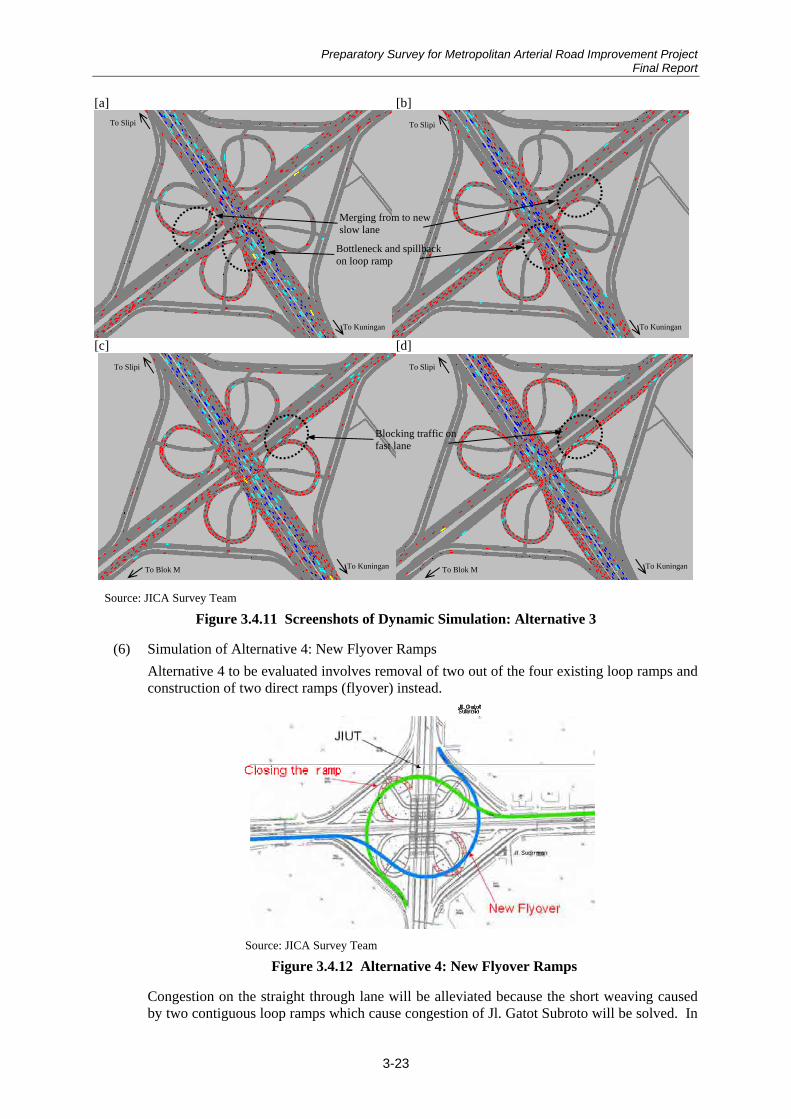
Preparatory Survey for Metropolitan Arterial Road Improvement Project Final Report
3-23
[a] [b]
[c] [d]
Source: JICA Survey Team
Figure 3.4.11 Screenshots of Dynamic Simulation: Alternative 3
(6) Simulation of Alternative 4: New Flyover Ramps
Alternative 4 to be evaluated involves removal of two out of the four existing loop ramps and construction of two direct ramps (flyover) instead.
Source: JICA Survey Team
Figure 3.4.12 Alternative 4: New Flyover Ramps
Congestion on the straight through lane will be alleviated because the short weaving caused by two contiguous loop ramps which cause congestion of Jl. Gatot Subroto will be solved. In
To Kuningan
To Slipi
To Kuningan To Kuningan
To Kuningan
To Slipi
To Slipi To Slipi
Merging from to new slow lane
Bottleneck and spillback on loop ramp
Blocking traffic on fast lane
To Blok M To Blok M

Preparatory Survey for Metropolitan Arterial Road Improvement Project Final Report
3-24
Alternative 4, a bottleneck may occur at the merging point of the large loop ramp into the slow lane of Jl. Sudirman (Figure 3.4.13a). Merging traffic from the left-turn ramp from Jl. Gatot Subroto to Jl. Sudirman (fast lane) may also cause congestion (Figure 3.4.13b), because U-turn is impossible in Alternative 4 and the detouring U-turn traffic has been added to Jl. Sudirman and Jl. Gatot Subroto.
[a]
[b]
Source: JICA Survey Team
Figure 3.4.13 Screenshots of Dynamic Simulation: Alternative 4
(7) Overall Comparison
As a summary, five alternative improvement plans for Semanggi junction are compared in terms of the average travel speed and the hourly intersection capacity estimated based on the dynamic simulation, as shown in Table 3.4.1.
Average of the speed of all the directions and sections are compared. For average speed, tendencies may vary by the period, and the best and the “worst” (i.e., improvement is the least expected compared to the existing case) cases for each period are marked in colors. In addition, hourly capacity of the intersection is compared across the alternatives. It is noted that the degree of the benefit is different across the alternative depending on the direction and time of the day. Excluding the “worst” alternatives which may have a negative impact in some period of the day, Alternative 4 followed by Alternative 2-2 may be the best alternative that is expected to bring certain benefit for all periods of the day and hence is recommended from the traffic improvement point of view.
To Kota
To Blok M
Merging from large loop ramp
Merging from left-turn ramp

Preparatory Survey for Metropolitan Arterial Road Improvement Project Final Report
3-25
Table 3.4.1 Comparison of Semanggi Improvement Alternatives
Existing Direction
Morning Blok M - Kota (fast lane) 36.4 35.7 22.1 20.7 38.3 40.6
(7-10) Kota - Blok M (fast lane) 33.6 31.7 28.1 30.7 37.6 28.8
Blok M - Kota (slow lane) 12.4 12.6 13.6 10.3 13.1 15.0
Kota - Blok M (slow lane) 10.2 9.1 20.1 22.7 11.1 12.0
Kuningan - Slipi 25.7 28.9 18.4 11.2 31.3 16.7
Slipi - Kuningan 23.5 26.6 16.1 23.1 28.2 21.4
Average 23.6 24.1 19.7 19.8 26.6 22.4
Midday Blok M - Kota (fast lane) 7.2 32.6 14.0 14.9 30.4 42.5
(10-13) Kota - Blok M (fast lane) 9.4 25.8 15.1 15.5 15.5 16.0
Blok M - Kota (slow lane) 3.3 15.6 11.2 15.1 15.9 14.9
Kota - Blok M (slow lane) 4.1 23.2 10.3 17.9 7.4 6.3
Kuningan - Slipi 3.4 7.2 14.7 23.8 6.8 27.0
Slipi - Kuningan 7.1 27.4 11.5 15.3 10.7 22.3
Average 5.8 22.0 12.8 17.1 14.5 21.5
Evening Blok M - Kota (fast lane) 18.8 29.3 19.5 12.4 38.5 43.1
(16-19) Kota - Blok M (fast lane) 9.6 15.2 18.7 19.0 17.8 34.6
Blok M - Kota (slow lane) 5.0 12.5 15.7 14.7 13.1 15.8
Kota - Blok M (slow lane) 4.3 6.1 20.3 22.3 12.3 11.3
Kuningan - Slipi 5.0 5.6 18.8 19.0 5.7 33.8
Slipi - Kuningan 21.1 27.1 20.4 30.5 13.4 22.1
Average 10.6 16.0 18.9 19.7 16.8 26.8
9,900 11,500 13,600 14,700 10,100 15,800
Note: Best Case Best Case for Each Direction
Least Improved Case
Alt 4
Travel Speed (km/h)
Hourly Capacity [PCU/hour]
Present Alt 1 Alt 2-1 Alt 2-2 Alt 3
Source: JICA Survey Team
3.4.2 Kuningan Intersection
Directional traffic flows and the daily volumes at the two continuous intersections that have been proposed for route improvement in SITRAMP, i.e., Kuningan and south adjacent Mampang, are presented in Figure 3.4.14. In terms of the magnitude of traffic, Kuningan (181,000 PCU/day) is a larger intersection than Mampang (118,000 PCU/day). Though it has a large volume of traffic in both north-south and east-west directions, straight traffic from south to north (direction B) is observed as the largest of the four directions. While right-turns in the north-south directions are prohibited due to the traffic management, right-turn traffic from west to south (direction J) is also large, and it needs to remain at grade if a continuous grade separation has been constructed. It will also conflict with the straight traffic from east to west (direction D), of which flyover plan has not been realized yet and hence is worth studying.
At south adjacent Mampang intersection, straight and right-turn movements from east and a straight movement from west have already been prohibited due for the traffic management purpose. The largest traffic is observed from north. Among others, right-turn traffic (direction H) accounts for about 30%, which also needs to remain at grade along with left turn traffic from west to north in the case of a continuous grade separation.

Preparatory Survey for Metropolitan Arterial Road Improvement Project Final Report
3-26
[Kuningan] [Mampang] (south adjacent intersection) (unit: veh.)
Source: Traffic Survey, JICA Survey Team
Figure 3.4.14 Traffic Flow and Daily Volume at Two Continuous Intersections in Kuningan
Average queue lengths observed around the two continuous intersections are presented for each period of the day in Table 3.4.2. It is noted that the area around those two intersections are congested all day. Above all, taking it into account that those two intersections are only about 400 meters apart, the northbound traffic queue at Kuningan intersection in the morning peak extends over Mampang intersection and far upstream (approx. 1,400 m). A similar phenomenon can also be observed for the southbound traffic at Mampang intersection in the evening peak where the section between the two intersections is totally filled with congested traffic. Both intersections are bottlenecks, and traffic management measures such as turn prohibitions have already been applied to those intersections. Therefore, it is necessary to improve the intersections simultaneously with a continuous grade separation.
Table 3.4.2 Average Queue Length around Kuningan and Mampang Intersections Average Queue Length [m]
Period Intersection From North From South From East From West Total
Morning Kuningan 70 330 230 340 970
(7:00-9:00) Mampang 160 1,420 40 210 1,830
Midday Kuningan 100 110 360 460 1,030
(12:00-14:00) Mampang 220 290 50 40 600
Evening Kuningan 380 240 190 260 1,070
(16:00-18:00) Mampang 320 390 40 710 1,450
Source: Traffic Survey, JICA Survey Team For evaluation of improvement measures for Kuningan, the following two alternatives have been considered:

Preparatory Survey for Metropolitan Arterial Road Improvement Project Final Report
3-27
Construction of a continuous north-south underpass for Kuningan and Mampang intersections, and
Construction of a continuous north-south underpass for Kuningan and Mampang intersections and an east-west one-way flyover for Kuningan intersection.
As indicators to evaluate the improvement, a degree of saturation and a cycle time of intersection are forecasted for 2017 (i.e., project completion year), as shown in Table 3.4.3. Note that the degree of saturation of Mampang intersection is below 1.0 even under the existing (Do-Nothing) case due to the traffic management measures that have already been adopted. In 2017, with the north-south continuous underpass, degrees of saturation are expected to decrease at both intersections. Though the value will be still over 1.0 at Kuningan intersection, a great reduction of traffic congestion can be expected. Moreover, the cycle times that are extremely long can be reduced to 120 seconds though part of the north-south straight traffic (approx. 30%) will remain at grade. In addition, if construction of an east-west one-way flyover has been implemented for Kuningan intersection, further reduction of the degree of saturation is expected as well as a shorter cycle time of 90 seconds with rationalized (i.e., reduced) signal phases.
Table 3.4.3 Evaluation of Intersection Improvement at Kuningan in 2017
Intersection Indicator Existing with N-S UP with N-S UP & E-W FO
Kuningan Degree of Saturation 1.66 1.35 1.20
Cycle Time [sec.] 220 120 90
Mampang Degree of Saturation 0.93 0.73 0.73
Cycle Time [sec.] 278 120 120
Source: JICA Survey Team
3.4.3 Cikarang Area
Since the sub-project for Cikarang involves improvement of existing Kalimalang road and its connecting roads that are relatively long (5 – 10 km), traffic survey was conducted at several locations in Cikarang industrial area. The traffic survey locations and the current major traffic flow bandwidths are presented in Figure 3.4.15.
The largest volume of traffic is found on Jl. Cibarusah, namely nearly 100,000 PCU per day in the most congested section. It runs north-south, connecting the major industrial estates such as Jababeka, EJIP, and Lippo Cikarang with the toll road interchange (Cikarang Barat) for traffic of about 50,000 PCU per day. It also connects the north side (i.e., Jababeka) and the south side (i.e., EJIP, Lippo Cikarang, etc.) of Cikarang industrial area.
As for MM2100 and Bekasi Fajar, which are located in the west side of Cikarang, Jl. Bali is the only road available to go to the other industrial estates. Under the currently poor road conditions, most of the traffic headed for other part of Cikarang, detouring via Jl. Bali, Cibitung Toll Access, and Jl. Imam Bonjol may be the actual transport route, as shown in Figure 3.4.16. In addition, Jakarta – Cikampek toll road could be an alternative route to travel between MM2100/Bekasi Fajar and the other industrial estates, especially Delta Mas, though this section of the toll road is often congested with traffic including the on- and off-ramps.
Meanwhile, average traffic queue length was also surveyed and the result is shown in Table 3.4.8 (for non-toll arterial rods) and Table 3.4.5 (for toll gates). On non-toll arterial roads, traffic congestion occurs at the toll road entrance of Cibitung and Cikarang Barat. Above all, on Jl. Cibarusah, southbound traffic congestion queues are observed for over 1km, that is, from the toll entrance (IS-1) to Jl. Kalimalang (IS-2) and further up to Jababeka (IS-3), for most of the day, partly because the southbound flyover over has not been constructed yet. On the toll road, traffic congestion queues are also observed, particularly at the toll gates of

Preparatory Survey for Metropolitan Arterial Road Improvement Project Final Report
3-28
Cibitung IC and Cikarang Barat IC. Furthermore, traffic congestion queues are observed at the toll plaza on the main toll road (Cikarang Utama) as well.
Note: IS - directional traffic count survey at intersections, CS - cross sectional traffic count survey Source: JICA Survey Team
Figure 3.4.15 Traffic Survey Location and Daily Major Traffic Flow in Cikarang Area
Table 3.4.4 Average Queue Length on Arterial Roads in Cikarang Area Average Queue Length [m]
Period No. Location From North
From South
From East
From West
Total
Morning IS-1 Jl. Cibarusah (Toll Entrance) 1,070 20 - 140 1,230(7:00-9:00) IS-2 Jl. Cibarusah & Jl. Kalimalang 20 20 - - 40
IS-3 Jl. Cibarusah & Jl. Jababeka Raya 20 100 - 30 150
IS-4 Jl. Cibarusah & Jl. Industri Pasir Gombong 10 0 - 20 30
IS-5 Jl. Cibarusah (Dry Port Entrance) 10 0 - - 10
IS-6 Cibitung Toll Access (Toll Entrance) 540 110 - - 650Midday IS-1 Jl. Cibarusah (Toll Entrance) 510 50 - 60 620(12:00- IS-2 Jl. Cibarusah & Jl. Kalimalang 70 0 - - 70
14:00) IS-3 Jl. Cibarusah & Jl. Jababeka Raya 20 50 - 50 120
IS-4 Jl. Cibarusah & Jl. Industri Pasir Gombong 10 0 - 20 30
IS-5 Jl. Cibarusah (Dry Port Entrance) 0 0 - - 0
IS-6 Cibitung Toll Access (Toll Entrance) 70 20 - - 90Evening IS-1 Jl. Cibarusah (Toll Entrance) 960 70 - 300 1,330
(16:00- IS-2 Jl. Cibarusah & Jl. Kalimalang 340 10 - - 350
18:00) IS-3 Jl. Cibarusah & Jl. Jababeka Raya 50 10 - 10 70
IS-4 Jl. Cibarusah & Jl. Industri Pasir Gombong 20 10 - 30 60
IS-5 Jl. Cibarusah (Dry Port Entrance) 10 0 - - 10
IS-6 Cibitung Toll Access (Toll Entrance) 690 130 - - 820Source: Traffic Survey, JICA Survey Team

Preparatory Survey for Metropolitan Arterial Road Improvement Project Final Report
3-29
Table 3.4.5 Average Queue Length at Toll Gates in Cikarang Area Average Queue Length [m]
Period Toll Gate From Jakarta
To Jakarta
From Cikampek
To Cikampek
Cibitung IC (North) 20 10 10 0
Cibitung IC (South) 230 0 0 20
Cikarang Main Gate - 10 - 40
Cikarang Main (Satellite) - 30 - -
Cikarang Barat IC 150 20 20 10
Cikarang Barat IC (South) - 20 - -
Morning (7:00-9:00)
Cikarang Timur IC 50 10 40 10
Cibitung IC (North) 20 30 0 0
Cibitung IC (South) 20 0 0 10
Cikarang Main Gate - 30 - 80
Cikarang Main (Satellite) - 40 - -
Cikarang Barat IC 70 20 30 40
Cikarang Barat IC (South) - 20 - -
Midday (12:00-14:00)
Cikarang Timur IC 10 20 10 10
Cibitung IC (North) 10 60 0 0
Cibitung IC (South) 20 0 0 410
Cikarang Main Gate - 70 - 160
Cikarang Main (Satellite) - 60 - -
Cikarang Barat IC 1,210 70 20 20
Cikarang Barat IC (South) - 50 - -
Evening (16:00-18:00)
Cikarang Timur IC 10 10 10 10 Source: JICA Survey Team
The following three alternatives have been assumed for demand forecast and evaluation:
[1 E-W & 2 N-S Roads Only]: One east-west road (i.e., Jl. Kalimalang) and the connecting two north-south roads (i.e., Jl. Bali and Jl. Jarakosta) are improved;
[With Dry Port Access]: In addition to the above, a new full IC at KM29 (with on/off ramps in both directions) and the N-S through dry port access road which will connect with Jl. Kalimalang are developed; and
[With Dry Port Access & Thamrin UP]: In addition to the above, an underpass at the intersection of Jl. Cibarusah and Jl. Thamrin is developed.
With completion of the above road projects, major potential traffic between the industrial areas in Cikarang that is to be diverted via the project roads for shorter and faster routes is depicted in Figure 3.4.16.
Based on the OD matrices obtained from the roadside OD interview survey as well as from JUTPI, road transportation network assignment is conducted for each of the above alternatives. In order to confirm whether the capacities of the N-S access roads and the connecting ICs in Cikarang area will be enough in future, volume-capacity (V/C) ratios are calculated for each alternative, and comparisons of traffic V/C ratios on the N-S roads and the connecting ICs among the alternatives are summarized in Table 3.4.6 and Table 3.4.7, respectively.
If no JICA sub-projects are implemented, the V/C ratios of all the N-S roads (except for Jl. Sukamantri) are over 1.0. Above all, Jl. Cibarusah will be so heavily congested with a V/C ratio of 1.92, and the V/C ratio of the total traffic on all the N-S roads is forecasted as 1.36, implying serious traffic congestion.
Improvement of one east-west road (i.e., Jl. Kalimalang) and the connecting two north-south roads (i.e., Jl. Bali and Jl. Jarakosta) is expected to greatly reduce this traffic congestion

Preparatory Survey for Metropolitan Arterial Road Improvement Project Final Report
3-30
especially on Jl. Bali and Jl. Jarakosta, of which V/C ratios will become below 0.9. However, the total traffic on all the N-S roads will still be over the capacity.
As for development of the dry port access road connecting with the new IC at KM29, remarkable improvement on the V/C ratios could be expected in the case with construction of the through dry port access road. Also, the V/C ratio of the total traffic on all the N-S roads is expected to become below 1.0.
As for a case in which an underpass at the intersection of Jl. Cibarusah and Jl. Thamrin is developed in addition to the above, the V/C ratio of the total traffic on all the N-S roads is eventually forecasted as 0.9, and that on Jl. Cibarusah is forecasted as 1.2, which may be considered as tolerable though it is over the capacity. While a great reduction of the V/C ratio is expected on Jl. Cibarusah, it should be noted that the traffic on the N-S through dry port access road may also exceed the capacity though the chance of traffic congestion may be small.
As for comparison of traffic volume-capacity ratios on ICs, a drastic reduction is expected with construction of a new IC at KM29 and the connection dry port access road, because the total capacity of ICs will be increased leading to the overall V/C ratio below 1.0. However, it should be noted that capacity of Cibitung IC needs to be expanded about 1.5 times in all the alternatives.
Source: JICA Survey Team
Figure 3.4.16 Major Potential Traffic to be Diverted to Sub-Project Roads in Cikarang
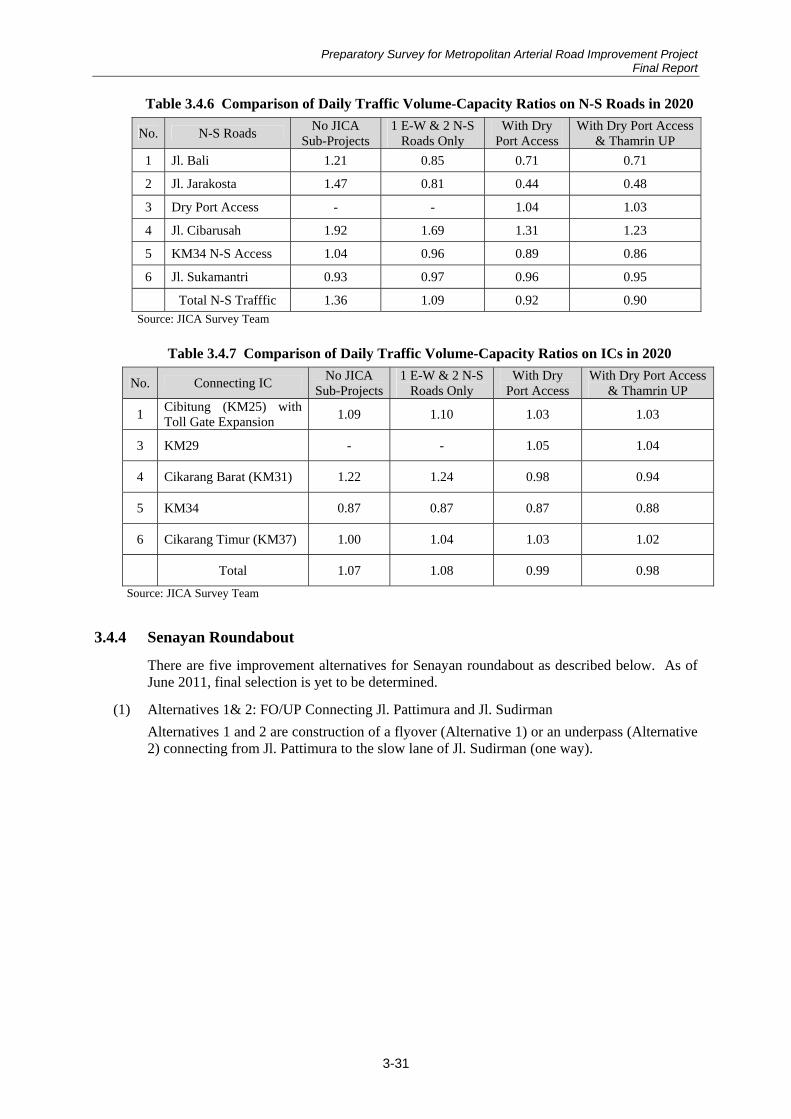
Preparatory Survey for Metropolitan Arterial Road Improvement Project Final Report
3-31
Table 3.4.6 Comparison of Daily Traffic Volume-Capacity Ratios on N-S Roads in 2020
No. N-S Roads No JICA
Sub-Projects1 E-W & 2 N-S
Roads Only With Dry
Port AccessWith Dry Port Access
& Thamrin UP
1 Jl. Bali 1.21 0.85 0.71 0.71
2 Jl. Jarakosta 1.47 0.81 0.44 0.48
3 Dry Port Access - - 1.04 1.03
4 Jl. Cibarusah 1.92 1.69 1.31 1.23
5 KM34 N-S Access 1.04 0.96 0.89 0.86
6 Jl. Sukamantri 0.93 0.97 0.96 0.95
Total N-S Trafffic 1.36 1.09 0.92 0.90 Source: JICA Survey Team
Table 3.4.7 Comparison of Daily Traffic Volume-Capacity Ratios on ICs in 2020
No. Connecting IC No JICA
Sub-Projects1 E-W & 2 N-S
Roads Only With Dry
Port Access With Dry Port Access
& Thamrin UP
1 Cibitung (KM25) with Toll Gate Expansion
1.09 1.10 1.03 1.03
3 KM29 - - 1.05 1.04
4 Cikarang Barat (KM31) 1.22 1.24 0.98 0.94
5 KM34 0.87 0.87 0.87 0.88
6 Cikarang Timur (KM37) 1.00 1.04 1.03 1.02
Total 1.07 1.08 0.99 0.98
Source: JICA Survey Team
3.4.4 Senayan Roundabout
There are five improvement alternatives for Senayan roundabout as described below. As of June 2011, final selection is yet to be determined.
(1) Alternatives 1& 2: FO/UP Connecting Jl. Pattimura and Jl. Sudirman
Alternatives 1 and 2 are construction of a flyover (Alternative 1) or an underpass (Alternative 2) connecting from Jl. Pattimura to the slow lane of Jl. Sudirman (one way).
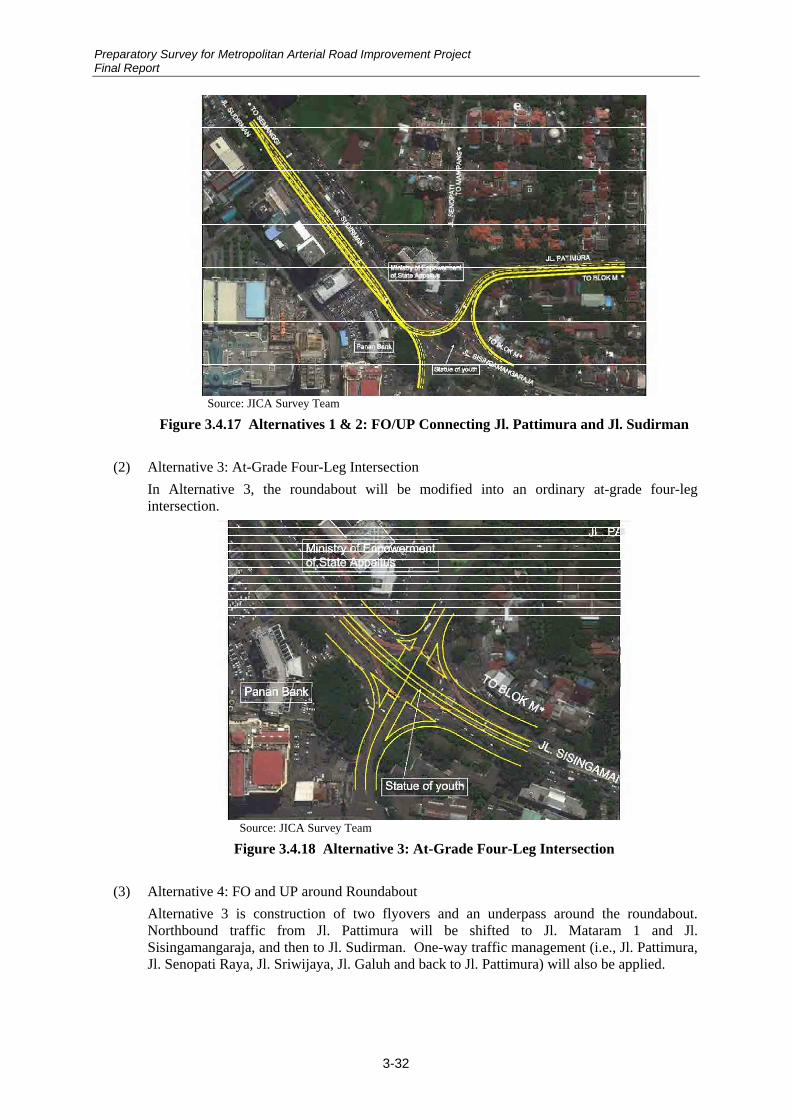
Preparatory Survey for Metropolitan Arterial Road Improvement Project Final Report
3-32
Source: JICA Survey Team
Figure 3.4.17 Alternatives 1 & 2: FO/UP Connecting Jl. Pattimura and Jl. Sudirman
(2) Alternative 3: At-Grade Four-Leg Intersection
In Alternative 3, the roundabout will be modified into an ordinary at-grade four-leg intersection.
Source: JICA Survey Team
Figure 3.4.18 Alternative 3: At-Grade Four-Leg Intersection
(3) Alternative 4: FO and UP around Roundabout
Alternative 3 is construction of two flyovers and an underpass around the roundabout. Northbound traffic from Jl. Pattimura will be shifted to Jl. Mataram 1 and Jl. Sisingamangaraja, and then to Jl. Sudirman. One-way traffic management (i.e., Jl. Pattimura, Jl. Senopati Raya, Jl. Sriwijaya, Jl. Galuh and back to Jl. Pattimura) will also be applied.

Preparatory Survey for Metropolitan Arterial Road Improvement Project Final Report
3-33
Source: JICA Survey Team
Figure 3.4.19 Alternative 4: FO and UP around Roundabout
(4) Alternative 5: UP Bypassing the Roundabout
Alternative 5 is construction of an underpass (Alternative 2) connecting from Jl. Pattimura to the slow lane of Jl. Sudirman (one way), but bypassing the roundabout.
Source: JICA Survey Team
Figure 3.4.20 Alternative 5: UP Bypassing the Roundabout
While the target area for traffic improvement around the Senayan roundabout is relatively large and the benefit is not limited to around the roundabout, traffic volume by direction is forecasted for each of the above alternatives in 2018 (i.e., project completion year) and presented in Table 3.4.8. EIRR, which is limited to this roundabout, is calculated based on these forecasts.

Preparatory Survey for Metropolitan Arterial Road Improvement Project Final Report
3-34
Table 3.4.8 Traffic Demand Forecast in Each Senayan Improvement Alternative in 2018 Traffic Volume [pcu/16 hrs]
Alternative From North
From South
From East
From West
Total Remarks
Existing 66,700 37,500 23,700 6,500 134,500 Do-Nothing case
Alt. 1 66,700 37,500 2,400 6,500 113,200 Traffic from Jl. Pattimura will be diverted to FO.
Alt. 2 66,700 37,500 2,400 6,500 113,200 Traffic from Jl. Pattimura will be diverted to UP.
Alt. 3 66,700 37,500 23,700 6,500 134,500 Traffic signal cycle time will be shortened.
Alt. 4 55,500 57,700 14,700 6,500 134,500 Traffic from Jl. Pattimura will be diverted to Jl. Sisingamangaraja via FO.
Alt. 5 66,700 37,500 9,500 6,500 120,300 Traffic from Jl. Pattimura will be diverted to UP.
Source: JICA Survey Team
3.4.5 Other Intersections
(1) R.E. Martadinata Intersection
Directional traffic flows and the daily volumes at Martadinata intersection is presented in Figure 3.4.21. Though the intersection is not signalized and it is smaller in terms of the traffic volume compared to other sub-projects, it is located just beside the Tg. Priok port entrance and hence the ratio of heavy vehicles is as large as over 30%. In 2015 (i.e., project completion year), the traffic volume on Jl. Martadinata is expected to grow from current 30,000 PCUs to over 40,000 PCUs per day, most of which are expected to go through the at-grade railway crossing. It is a freight railway track, and thus it is difficult to be elevated. Furthermore, the railway station (Tg. Priok) has been recently renovated and is expected to become an intermodal transfer point with the bus terminal and the port. Therefore, it is desirable to construct a flyover in this location to avoid the at-grade railway crossing and to separate the freight traffic from other traffic including public transport.
(unit: veh.)
Source: Traffic Survey, JICA Survey Team
Figure 3.4.21 Traffic Flow and Daily Volume at R.E. Martadinata Intersection

Preparatory Survey for Metropolitan Arterial Road Improvement Project Final Report
3-35
(2) Sulawesi - Tg.PA Intersection
Sulawesi - Tg. Priok Access (Tg.PA) intersection is approximately 1.2 km from R.E. Martadinata intersection. Directional traffic flows and the daily volumes at Sulawesi - Tg.PA intersection is presented in Figure 3.4.22. Current volume of the north-south traffic is already about 40,000 PCUs per day (Table 3.1.1), and, as is the case with R.E. Martadinata intersection, the ratio of heavy vehicles is as large as over 30%. According to JUTPI, annual traffic growth is forecasted as 2.6%, which is the highest of all the 10 sub-project locations (Table 3.3.2) in spite of planned construction of Tg. Priok access road north-south section (elevated structure) which is currently under preparation for construction. If the existing at-grade discontinued railway to the port is to be rehabilitated, the flyover will become necessary to avoid the at-grade railway crossing, which will greatly reduce the road capacity as well as the level of safety.
(unit: veh.)
Source: Traffic Survey, JICA Survey Team
Figure 3.4.22 Traffic Flow and Daily Volume at Sulawesi - Tg.PA Intersection
(3) Pancoran Intersection
Pancoran intersection is located about 2 km away to the east along Jl. Gatot Subroto from Kuningan intersection. Directional traffic flows and the daily volumes at Pancoran intersection is presented in Figure 3.4.23. Pancoran intersection is very large in scale and has a complicated structure, serving as much traffic as Kuningan intersection, that is, nearly 180,000 PCUs per day. At this intersection, straight movement of traffic (from east to west) takes the majority as shown in the figure (direction D), and, consequently about 1 km of traffic congestion is observed throughout the day (Table 3.1.4). Hence, construction of another flyover on the south side in addition to the existing one on the north side of the elevated toll road is expected to bring about a great benefit.
Meanwhile, large volume of north-south straight traffic is also observed at this intersection (directions B and G). Due to this enormous volume of traffic, the degree of saturation after construction of this additional flyover is forecasted to be still over 1.0. However, part of this traffic will be diverted to the planned DKI toll road (Tg. Barat – Pasar Minggu – Manggarai) which will run north-south through this intersection.

Preparatory Survey for Metropolitan Arterial Road Improvement Project Final Report
3-36
(unit: veh.)
Source: Traffic Survey, JICA Survey Team
Figure 3.4.23 Traffic Flow and Daily Volume at Pancoran Intersection
(4) Pinang Baris Intersection
Pinang Baris intersection is one of the most congested intersections in Medan. Directional traffic flows and the daily volumes at Pinang Baris intersection is presented in Figure 3.4.24. The majority of traffic volume is observed in the east-west straight direction (directions E and K), which matches with the planned flyover direction. Toward the south of this intersection, there is a Pinang Baris bus terminal which serves long-distance buses going to/from the west region, and minibuses and other vehicles are waiting and stopping around the south side of this intersection. Combined with considerable volume of right-turn traffic (from west to south, direction D), traffic congestion queues are observed especially from west. In 2017 (i.e., project completion year), the traffic volume of the four directions of Pinang Baris intersection is expected to grow from current 87,000 PCUs to over 94,000 PCUs per day. Traffic signal cycle time at this intersection is around 300 to 380 seconds, which is tremendously long. Shorter cycle time can also be realized after construction of the flyover.

Preparatory Survey for Metropolitan Arterial Road Improvement Project Final Report
3-37
(unit: veh.)
Source: Traffic Survey, JICA Survey Team
Figure 3.4.24 Traffic Flow and Daily Volume at Pinang Baris Intersection
(5) Katamso Intersection
Directional traffic flows and the daily volumes at Katamso intersection is presented in Figure 3.4.25. Katamso intersection is a part of the Medan ring road and is located in the south of Medan city. Thus, the major traffic is north-south traffic on radial Jl. Katamso going to/from the center of Medan (directions B and H). Meanwhile, on the ring road (Jl. A.H. Nasution), the volume of turning traffic to/from the center of Medan (directions F and J) is as much as the volume of the through traffic (directions E and K). Traffic congestion queues are observed especially from east. In order to serve the traffic on the ring road with several other flyovers planned along the ring road, an east-west underpass (due to the upslope) is planned. Since the survey result shows that there is more east-west traffic than the north-south traffic, it matches with the planned underpass direction. In 2017 (i.e., project completion year), with an annual traffic growth of 2.1%, the traffic volume of the four directions of Katamso intersection is expected to grow from current 85,000 PCUs to over 96,000 PCUs per day.

Preparatory Survey for Metropolitan Arterial Road Improvement Project Final Report
3-38
(unit: veh.)
Source: Traffic Survey, JICA Survey Team
Figure 3.4.25 Traffic Flow and Daily Volume at Katamso Intersection
(6) Sudirman II Intersection
Sudirman II intersection is located 1 km to the south of Daan Mogot along Jl. Sudirman. There is a railway crossing with a single track on Tangerang line at the intersection. Directional traffic flows and the daily volumes at Sudirman II intersection as well as north adjacent Sudirman – Daan Mogot intersection is presented in Figure 3.4.26. Sudirman II intersection is a part of the Tangerang ring road (i.e., Jl. Sudirman) which is expected to serve the freight traffic between the airport and the industrial area. it is located just beside the Tg. Priok port entrance and hence the ratio of heavy vehicles is as large as over 30%.In order to serve the traffic on the ring road with several other existing and planned flyovers along the ring road as well as to avoid the at-grade railway crossing, a north-south flyover is planned. Kota Tangerang also regards this improvement as urgent.
In Sudirman II intersection, traffic jams occur at the at-grade railway crossing as well as at the T-intersection (Jl. Benteng Betawi) that is located just south beside the railway crossing. Though the railway crossing is closed not so frequently, many heavy vehicles pass the crossing at very low speed. In 2017 (i.e., project completion year), the traffic volume of the four directions of Sudirman II intersection is expected to grow from current 77,000 PCUs to around 87,000 PCUs per day.
For Sudirman – Daan Mogot intersection, though it is planned to implement north-south flyover along this location, the number of daily traffic volume along east-west corridor is nearly the same (46,000 PCU) compared to traffic along north-south corridor (44,000 PCU). Without any other constraints, these survey findings might affect the flyover direction from north-south to east-west.

Preparatory Survey for Metropolitan Arterial Road Improvement Project Final Report
3-39
[Sudirman – Daan Mogot] (north adjacent intersection) [Sudirman II – Jl. Benteng Betawi] (unit: veh.)
Source: Traffic Survey, JICA Survey Team
Figure 3.4.26 Traffic Flow and Daily Volume at Sudirman II Intersection
(7) Evaluation of Other Sub-Projects
As indicators to evaluate other sub-projects, a degree of saturation and a cycle time of intersection are forecasted for each year of project completion, as presented in Table 3.4.9. It is expected that not only the degree of saturation but also the cycle time of each sub-project intersection will be greatly reduced with a grade separation, which will also contribute to savings in travel time and vehicle operating cost.
Table 3.4.9 Evaluation of Intersection Improvement in Other Sub-Project Locations
No. Location FO/UP
DirectionYear of
CompletionIndicator Before Project After Project
Degree of Saturation 1.05 0.73 4 R.E. Martadinata E-W 2016
Cycle Time [sec.] - -
Degree of Saturation 1.65 0.41 5 Sulawesi- Tg. PA N-S 2016
Cycle Time [sec.] 137 60
Degree of Saturation 1.78 1.18 9 Pancoran E-W 2016
Cycle Time [sec.] 228 120
Degree of Saturation 1.74 0.94 13 Pinang Baris E-W 2017
Cycle Time [sec.] 302 120
Degree of Saturation 1.29 0.97 15 Katamso E-W 2017
Cycle Time [sec.] 204 120
Degree of Saturation 1.83 0.87 16 Sudirman II N-S 2017
Cycle Time [sec.] 112 60
Source: JICA Survey Team