preparing for bundled care: what our future report cards will look · pdf file ·...
TRANSCRIPT
4/28/2016
1
Preparing for Bundled Care: What Our Future Report Cards Will Look Like
Michael Suk, MD JD MPH FACSAtlanta Trauma SymposiumAtlanta, GAApril 23, 2016
ECONOMICS AND VARIATION ARE DRIVING HEALTHCARE REFORM
To understand the drivers of change
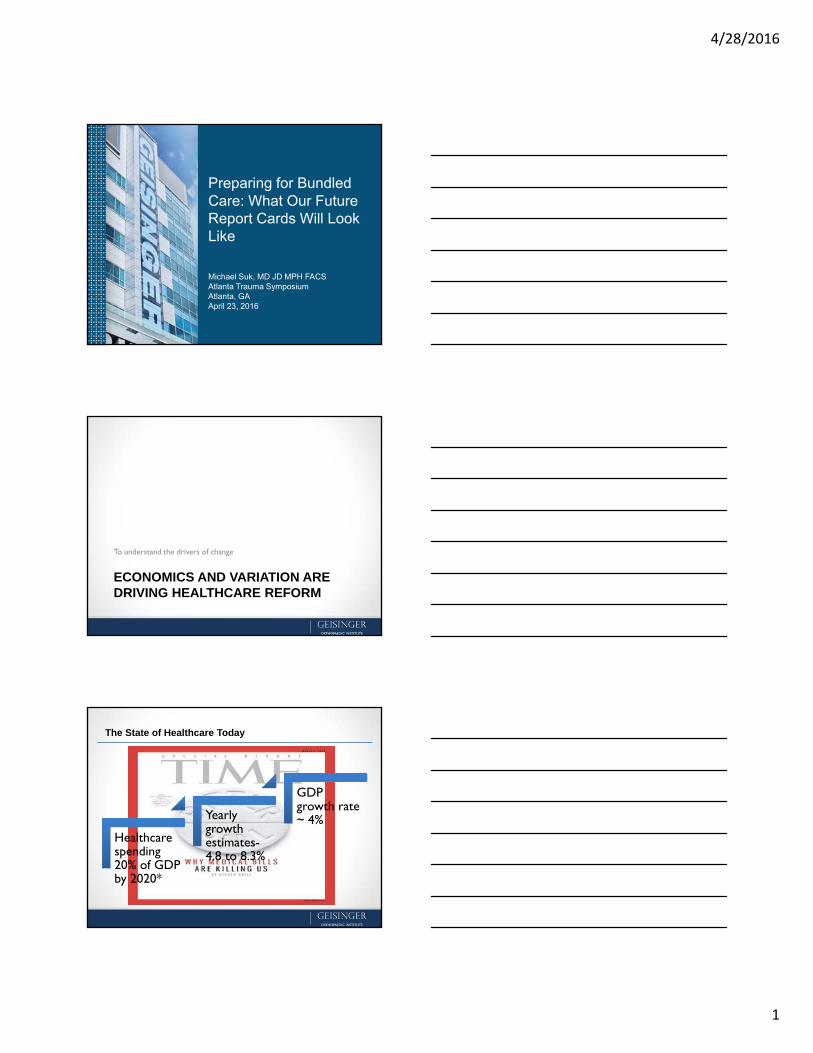
The State of Healthcare Today
Healthcare spending 20% of GDP by 2020*
Yearly growth estimates-4.8 to 8.3%
GDP growth rate ~ 4%

4/28/2016
2
Adults in the US received 54.9% of recommended careAdults in the US received 54.9% of recommended care
Acute care – 53.5%Acute care – 53.5%
Care for chronic conditions – 56.1%Care for chronic conditions – 56.1%
Preventive care – 54.9%Preventive care – 54.9%
N Engl J Med 2003; 348:2635-45
Inconsistency In Healthcare DeliveryInconsistency In Healthcare Delivery
Adapted from Regence Blue Shield; Arnie Milstein, MD - Mercer
MD Longitudinal Cost Efficiency Index(total cost per case mix-adjusted treatment episode)
Low EfficiencyLow Quality(Nightmare Suppliers)
MD
Qua
lity
Inde
x(o
utc
om
es
or
% a
dh
ere
nce
to E
BM
) High EfficiencyHigh Quality(Dream Suppliers)
High EfficiencyLow Quality
Low EfficiencyHigh Quality
L
ow
er
Hig
he
r
50th %ile
50th %ile
Lower Efficiency/ Higher Cost
Higher Efficiency/ Lower Cost
No Correlation Between How Much we Spend and Quality/Outcomes
Cost Inefficiency In Healthcare
PriceWaterhouseCoopers $1.2T *
Institute of Medicine $765B**
**IOM (Institute of Medicine). 2012. Best care at lower cost: The path to continuouslylearning health care in America. Washington, DC: The National Academies Press.
*Premier’s Waste Dashboard, 1/22/12 *Premier’s Waste Dashboard, 1/22/12

4/28/2016
3
Accountable Care
Key IssuesWhile We Operate in a
Financially Challenging Environment
Where We Are Now
Unjustified variationUnjustified variation
Fragmentation of care-givingFragmentation of care-giving
Adversarial payor-provider relationshipsAdversarial payor-provider relationships
Perverse payment incentivesPerverse payment incentives
Patients as passive recipients of carePatients as passive recipients of care
Where We Want To Be
Payment for valuePayment for value
Coordinated careCoordinated care
Continuous improvement/innovationContinuous improvement/innovation
Patient activationPatient activation
National health goals, accountabilityNational health goals, accountability
Population Health
Experience of Care
Per Capita Cost
Better CareBetter Health
Lower Cost
IHI Assumptions
Focus changes from paying for units of service to rewarding
quality and outcomes.
NATIONAL LANDSCAPE IS SHIFTING FROM VOLUME TO VALUE
To understand the market environment

4/28/2016
4
Why Governmental Attention
Total joint replacements
Total joint replacements
Fractures, all sites
Fractures, all sites
Hip Fractures
Hip FracturesSpineSpine
How Did We Get Here?
Medicare Modernization Act of 2003• first time linked
Medicare payments to the reporting by hospitals of the quality of their services.
The Tax Relief and Health Care Act of 2006• physician self-
reporting by providing a 1.5 percent Medicare incentive.
2019 - 2024: 5% participation bonus
SGR Repeal Creates Two Tracks for Providers
Providers Must Choose Enhanced FFS1 or Accountable Care Options
1. Fee for service. 2. Positive adjustments for professionals with scores above the benchmark may be scaled by a factor of up to 3 times the negative adjustment
limit to ensure budget neutrality. In addition, top performers may earn additional adjustments of up to 10 percent. 3. APM participants who are close to but fall short of APM bonus requirements will not qualify for bonus but can report MIPS measures and
receive incentives or can decline to participate in MIPS.
Merit-Based Incentive Payment System
Advanced Alternative Payment Models2
2020: -5% to +15%1 at risk
2019: Combine PQRS, MU, & VBM programs: -4% to +12%1 at risk
2022 and on: -9% to +27%1 at risk
2021: -7% to +21%1 at risk
2018: Last year of separate MU, PQRS, and VBM penalties
2019 - 2020: 25% Medicare revenue requirement
2021 and on: Ramped up Medicare or all-payer revenue requirements
2015:H2 – 2019: 0.5% annual update 2026 and on: 0.25% annual update
2026 and on: 0.75% annual update
2020 – 2025: Frozen payment rates
2015:H2 – 2019: 0.5% annual update 2020 – 2025: Frozen payment rates
12

4/28/2016
5
New Law Strengthens Move To P4P Incentives
Merit-Based Incentive Payment System (MIPS) Summary
30%
30%
15%
25%
EHR Use Quality
Clinical Improvement
MIPS Performance Category Weights
Resource Use1
PQRS measures
Meaningful Use measures
Cost measures
Care coordination, patient satisfaction, access measures
• Sunsets current Meaningful Use, Value-Based Modifier, and Physician Quality Reporting System (PQRS) penalties at the end of 2018, rolling requirements into a single program
• Adjusts Medicare payments based on performance on a single budget-neutral payment beginning in 2019
• Applies to physicians, NPs, clinical nurse specialists, physician assistants, and certified RN anesthetists
• Includes improvement incentives for quality and resource use categories
1) Resource Use measures would be weighted less during first two years of MIPS program, reaching 30 percent in the third year of the program. Quality measures would be weighted more than 30 percent during the first two years to make up the difference.
Builds on Trend of Increasing Provider Accountability Even Within FFS
APM Bonus Rewards Participation in New Models
1. Risk-based contracts with Medicare Advantage plans count toward the all-payer requirement category.
2019 –2020
2021–2022
25% N/A
50%
N/A 25%
50%
OROption 1 Option 2
Required for All Providers
2023 and on 75%
N/A 25%
75%
Medicare All-Payer1
Required Percentage of Revenue Under Risk-Based Payment Models
Advanced Alternative Payment Model (APM) Summary
• Requires significant share of provider revenue in APM with two-sided risk, and quality measurement; or in some cases participation in certified patient-centered medical homes (PCMHs)
• Provides financial incentives (5% annual bonus in 2019-2024) and exemption from MIPS requirements
• Includes partial qualifying mechanism that allows providers that fall short of APM requirements to report MIPS measures and receive corresponding incentives or to decline to participate in MIPS
Option Signals Policymakers’ High Expectations for Risk-Based Models
DEFINITIONS
What exactly is a ”bundle?”

4/28/2016
6
Clinical ”Bundles”
Structured way of improving the processes of care and patient outcomes
Evidence, execution and consistency
A package of interventions that people know must be followed for every patient, every single time.
Implementation
All elements are necessary and sufficient, • It’s a cohesive unit of steps that must all be completed to succeed.
Based on the highest level or evidence
Focuses on how to deliver the best care — not what the care should be.
All-or-nothing measurement.• “Yes, I did this step and that one; no, I did not yet do this last one.”• “Yes, I completed the ENTIRE bundle, or no, I did not complete the ENTIRE bundle.”• There is no in between; no partial “credit” for doing some of the steps some of the time.
Specific time and in a specific place, no matter what.
ELEMENTS OF A HIP FRACTURE BUNDLE
Application of clinical bundles…

4/28/2016
7
High Level Elements
Radiology• AP/Lat v. AP/Lat/Pelvis v.
AP/Lat/Pelvis/Traction View
Timing of Surgery• 24h v. 36h v. 48h
Anesthesia• Regional v. General
Intra-capsular Fractures• ORIF v. Hemi v. THA
Extra-capsular Fractures• SHS v. CMN
Co-Management• Hospitalist v. Geriatrics
v. Trauma
High Level Flow
BUNDLED PAYMENTS IN HIP FRACTURE
Linking clinical bundles to payments

4/28/2016
8
Shift from Fee for Service
Risk sharing: Payer → ProvidersRisk sharing: Payer → Providers
Bundled Payment System Bundled Payment System
• Patients in each DRG are clinically similar• Similar use of resources
Same Reimbursement per DRG (90 day postop)Same Reimbursement per DRG (90 day postop)
Leveraging the “Sweet Spot” to Drive Innovation
Health Plan• Population analysis • Align reimbursement • Finance care• Engage member and employer• Report population outcomes• Take to market
Clinical Enterprise• Care delivery• Identify best practice• Design systems of care• Interpret clinical reports• Continually improve• Activate patient & family
Shared Population and EMR/IT Infrastructure
Aligned objectives between the health plan & clinical enterprise
GHS Receives “All In” Global Fee
One fee for the ENTIRE 90-day period including all surgery-related care:One fee for the ENTIRE 90-day period including all surgery-related care:
• ALL surgery-related pre-admission care • ALL inpatient physician and hospital services, including
orthopaedic surgeons, anesthesia, consultants, etc• ALL surgery-related post-operative care• ALL care for any related complications or readmissions
Aligns incentives across provider, patient and payorAligns incentives across provider, patient and payor
24

4/28/2016
9
ProvenCare® Acute Orthopaedic Programs
THA TKA
Hip Fx Spine
The “Warranty”
All inclusive fee• Surgery-related pre-admission care • All inpatient physician and hospital services• Surgery-related post-operative care• Any related complications or readmissions
Shared risk• Across provider, patient and payor
26
Hip Fx Improvements
Decreased LOS• 3.6% reduction
Decreased LOS• 3.6% reduction
Decreased 30 day readmission rate• 58% reduction
Decreased 30 day readmission rate• 58% reduction
Decreased DVT rate• 49% reduction
Decreased DVT rate• 49% reduction
Decreased PE rate• 67% reduction
Decreased PE rate• 67% reduction

4/28/2016
10
Evolution of Bundled Payments on Orthopaedics
ACEACE• 2009-2011 (3 hospital experiment)• All three hospitals reduced the overall cost per episode between 10% and 15%.• Savings from implant cost and LOS reduction
BPCIBPCI• 2013-2016 (Voluntary participation over 48 episode groups)• Retrospective reconciliation of all Medicare Part A and B (-3 to 90 days)• Guaranteed 2% savings to CMS
CJRCJR•April 1, 2016 (Mandatory participation 75 geographically identified MSAs)•Retrospective reconciliation of all Medicare Part A and B (-3 to 90 days)
Hip Fracture Hemiarthroplasty in Total Joint Bundles?
2.5x post acute $$2.5x post acute $$
1.5x total cost $$
1.5x total cost $$
2x readmission
rate
2x readmission
rate
5x SCU/ICU5x SCU/ICU 1.5x LOS1.5x LOS
Bundled Payment versus Population Health
Bundled payment strategies are consistent with growth in clinical programs.
More surgery is still better economically for hospitals in a world of bundles.
Incentives can be aligned improve care coordination across the continuum of care and reduce waste and redundancy.

4/28/2016
11
QUALITY SCORECARDS
How we will get measured…
Quality Measure Domains
Adoption of EMR (e.g., Meaningful Use)Structural
Easy to define Difficult to manipulate
Correlation with quality, outcomes?
SCIP measures (e.g., Abx, DVT prophylaxis)Process
Easy to define Actionable Allow feedback
Clinical relevance Correlation with quality,
outcomes?
Complications (e.g., infection), readmissions, reoperations
Outcome Best measure of quality
Difficult to measure Risk adjustment Limited feedback Lag time
Utilization of services, LOS, marginsEfficiency Easy to measure Correlation with quality?
HCAHPs, Press GaneyPatient Experience
Patient-focused Influenced by patient expectations and engagement
Which Outcomes are Important to Measure?

4/28/2016
12
Conclusion
Value-based payment strategies such as bundled payments offer both risk and opportunity for orthopedic surgeons.
Value-based payment strategies such as bundled payments offer both risk and opportunity for orthopedic surgeons.
It is important to develop an understanding of the historical experience of bundled payments and the current payments models that are being tested.
It is important to develop an understanding of the historical experience of bundled payments and the current payments models that are being tested.
THANK YOU