prescription drug trends – the national … drug trends – the national picture yohan cho...
TRANSCRIPT

Market Access
PRESCRIPTION DRUG TRENDS – THE NATIONAL PICTURE
Yohan Cho Seattle, Washington
Washington Rx Drug Price and Purchasing Summit Series – Part I
Tuesday, June 14th, 2016

© GfK Market Access | Washington Rx Drug Price and Purchasing Summit Series | Seattle, WA | June 14th, 2016 2
Liability and confidentiality disclaimer
• Content of this presentation are my personal observations and should not be attributed to the views of GfK or GfK’s clients
• I am not endorsing manufacturer drug pricing strategies by repeating them • Any use which a third party makes of this document, or any reliance on it, or decisions to
be made based on it, are the absolute responsibility of such third party • GfK accepts no duty of care or liability of any kind whatsoever to any such third party,
and no responsibility for damages, if any, suffered by any third party as a result of decisions made, or not made, or actions taken, or not taken, based on this document

© GfK Market Access | Washington Rx Drug Price and Purchasing Summit Series | Seattle, WA | June 14th, 2016 3
What we saw in 2015…

© GfK Market Access | Washington Rx Drug Price and Purchasing Summit Series | Seattle, WA | June 14th, 2016 4 Source: Express Scripts 2015 Drug Trend Report
Overall, drug spend increased in 2015 across all books of business
2015 Drug Spend
Trends in Drug Spend from 2014 - 2015

© GfK Market Access | Washington Rx Drug Price and Purchasing Summit Series | Seattle, WA | June 14th, 2016 5 Source: Express Scripts 2015 Drug Trend Report
However, increases in drug spend was far more significant in specialty drugs
-0.1
2015 Drug Spend
Trends in Drug Spend from 2014 - 2015
© GfK Market Access | Washington Rx Drug Price and Purchasing Summit Series | Seattle, WA | June 14th, 2016 6 Source: IMS US Medicines Use and Spending in 2015
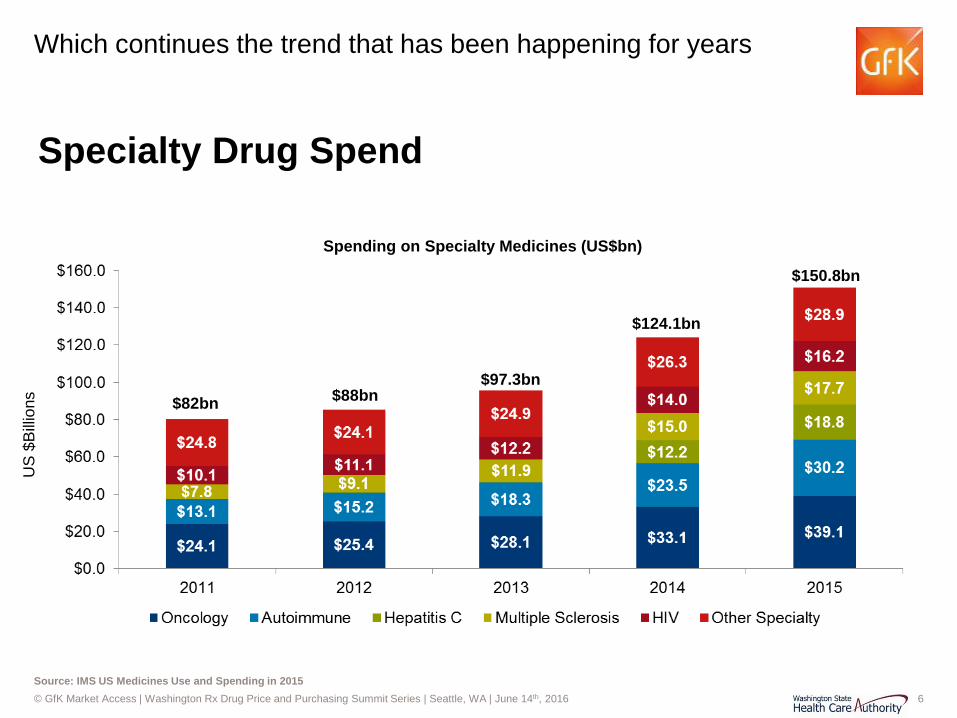
Which continues the trend that has been happening for years
Specialty Drug Spend
Spending on Specialty Medicines (US$bn)
US
$B
illion
s $82bn $88bn $97.3bn
$124.1bn
$150.8bn

© GfK Market Access | Washington Rx Drug Price and Purchasing Summit Series | Seattle, WA | June 14th, 2016 7 Source: Express Scripts 2015 Drug Trend Report
Specialty drug spend will continue to grow ~17% from 2016-2018
Therapy class 2016 2017 2018
Inflammatory conditions 25.5% 25.5% 26.7%
Multiple sclerosis 11.2% 10.2% 7.2%
Oncology 21.1% 20.0% 20.0%
Hepatitis C 10.2% 8.1% 8.0%
HIV 17.7% 17.8% 18.9%
Growth deficiency 9.1% 9.1% 9.0%
Cystic fibrosis 58.2% 36.2% 28.8%
Pulmonary hypertension 16.6% 5.8% 5.9%
Hemophilia 17.3% 18.3% 22.4%
Sleep disorders 22.6% 21.5% 20.5%
Other specialty classes 6.7% 6.4% 6.4%
Total 17.4% 16.8% 17.2%
Trend Forecast for Key Specialty Therapy Classes

© GfK Market Access | Washington Rx Drug Price and Purchasing Summit Series | Seattle, WA | June 14th, 2016 8 Source: Express Scripts 2015 Drug Trend Report
2015 Top 5 Medicaid Specialty Drug Classes
Therapy Class PMPY Utilization Unit Cost Total
HIV $131.80 -5.9% 10.8% 4.9%
Hepatitis C $62.96 -39.9% 30.2% -9.7%
Inflammatory conditions $41.30 24.5% 21.1% 45.6%
Oncology $27.50 12.1% 17.3% 29.4%
Multiple sclerosis $24.36 6.4% 9.7% 16.0%
2015 Medicaid Drug Spend

© GfK Market Access | Washington Rx Drug Price and Purchasing Summit Series | Seattle, WA | June 14th, 2016 9
What to expect in 2016…

© GfK Market Access | Washington Rx Drug Price and Purchasing Summit Series | Seattle, WA | June 14th, 2016 10
Melanoma CML RCC
Therapy Classes Maturing
IPF = Idiopathic Pulmonary Fibrosis; HAE = Hereditary Angioedema; PAH = Pulmonary Arterial Hypertension; CML = Chronic Myeloid Leukemia; RCC = Renal Cell Carcinoma; MS = Multiple Sclerosis, RA = Rheumatoid Arthritis
6 6 6
2016
2006
Year
Therapeutic Crowding… Number (#) of Drugs in 2006 vs. 2016

© GfK Market Access | Washington Rx Drug Price and Purchasing Summit Series | Seattle, WA | June 14th, 2016 11
2016 Novel Drug Approvals
Drug Use Peak Sales (Billions, USD)
Route Approval
Zepatier (elbasvir+grazoprevir) • Merck
Chronic hepatitis C genotypes 1 & 4 $2.0 Oral Jan 28
Briviact (brivaracetam) • UCB
Seizures in patients 16 years or older with epilepsy
$1.38 Oral Feb 18
Taltz (ixekizumab) • Lilly
Moderate-to-severe plaque psoriasis $5.0 SC Mar 22
Cinqair (reslizumab) • TEVA
Severe asthma $0.9 IV Mar 23
Venclexta (venetoclax) • AbbVie / Genentech
Chronic lymphocytic leukemia with specific chromosomal abnormality
$1.7 Oral Apr 11
Nuplazid (pimavanserin) • Acadia
Treat hallucinations and delusions associated w/ psychosis with Parkinson’s disease patients
$2.0 Oral Apr 29
Tecentriq (atezolizumab) • Genentech
Urothelial carcinoma (bladder cancer) $3.0 IV May 18
Zinbryta (daclizumab) • Biogen
Multiple sclerosis $0.5 SC May 27
Ocaliva (obeticholic acid) • Intercept
Certain patients with primary biliary cirrhosis (PBC)
$2.2 Oral May 27

© GfK Market Access | Washington Rx Drug Price and Purchasing Summit Series | Seattle, WA | June 14th, 2016 12
Source: 2016 Drug Pipeline Full of Blockbuster Potential, Aimee Theraldson, Express Script Website, Accessed May 31, 2016 (http://lab.express-scripts.com/lab/insights/drug-options/2016-drug-pipeline-full-of-blockbuster-potential)
$14.3 Billion Generic Opportunity: 5 blockbuster drugs coming off patent
Generics Drug Use Annual Sales
(Billions, USD) Anticipated Generic Launch
Gleevec (imatinib) • Novartis
Multiple hematological indications including Ph+ CML and Ph+ AML
$2.5 Feb 01
Crestor (rosuvastatin) • AstraZeneca
Multiple indications associated with lowering LDL cholesterol levels
$6.4 May 02
Benicar (olmesartan) and Benicar HCT (olmesartan/HCTZ) • Daiichi Sankyo
Hypertension $1.8 Oct 25
Seroquel XR (quetiapine, e.r.) • AstraZeneca
Schizophrenia, bipolar disorder, and major depressive disorder
$1.3 Nov 01
Zetia (ezetimibe) • Merck
Multiple indications associated with lowering LDL cholesterol levels
$2.3 Dec 12

© GfK Market Access | Washington Rx Drug Price and Purchasing Summit Series | Seattle, WA | June 14th, 2016 13
Inflectra, the biosimilar to Remicade, was approved in April 2016
Biosimilars Overall U.S. Market Opportunity (in $ Billions)
Source: U.S. Drug spend estimates are based on IMS Health data for 2015. The availability of biosimilars is highly variable due to litigation, patent challenges, FDA’s establishment of 351(k) pathway, or other factors
Neupogen* Remicade*

© GfK Market Access | Washington Rx Drug Price and Purchasing Summit Series | Seattle, WA | June 14th, 2016 14
With more biosimilars are on the way…
Biosimilars Overall U.S. Market Opportunity (in $ Billions)
Source: U.S. Drug spend estimates are based on IMS Health data for 2015. The availability of biosimilars is highly variable due to litigation, patent challenges, FDA’s establishment of 351(k) pathway, or other factors
Neupogen* Remicade* Enbrel* Humira*
Neulasta*
Lemtrada* Xolair* Erbitux*
Avastin* Herceptin* Orencia* Actemra* Advate*
Lucentis* Tysabri*
Pegasys* Vectibix*
Peg-Inton* Kineret*

© GfK Market Access | Washington Rx Drug Price and Purchasing Summit Series | Seattle, WA | June 14th, 2016 15 Characteristics of Drug Combination Therapy in Oncology by Analyzing Clinical Trial Data on ClinicalTrials.Gov, Menhua Wu, Stanford
Combinations are becoming more commonplace in drug trials
Number of Trials and Combination Trials on ClinicalTrials.gov (2008-2013)
N=170,951 0%
10%
20%
30%
40%
50%
60%
70%
80%
90%
100%
1
Neurological Diseasess
Pathological Conditions
Cardiovascular Diseases
Digestive Diseases
Viral Diseases
Oncology
Combination Trials Across Different Disease Types
Combination 16491 10%
Non-Combination 154460
90%
Nearly half of all combination trials are conducted in oncology and a quarter of oncology trials use combinations therapies
Brand-Brand Combinations

© GfK Market Access | Washington Rx Drug Price and Purchasing Summit Series | Seattle, WA | June 14th, 2016 16
Brand-brand combinations are becoming increasingly prevalent in oncology…
Brand-Brand Combinations

© GfK Market Access | Washington Rx Drug Price and Purchasing Summit Series | Seattle, WA | June 14th, 2016 17 Limits on Medicare's Ability to Control Rising Spending on Cancer Drugs, Peter B. Bach, M.D., N Engl J Med 2009; 360:626-633, February 5, 2009
Due to high priced drugs, the combination of multiple expensive branded drugs will test society’s willingness to pay
Monthly and Median Costs of Cancer Drugs at the Time of Approval by the FDA
Generic Brand
Gen
eric
B
rand
Add
-On
Backbone (SoC)
Ouch!
No problem
No problem
Value Consider
ation
Stack Matrix: Brand and Generic as Backbone or Add-On Positioning
Brand-Brand Combinations

© GfK Market Access | Washington Rx Drug Price and Purchasing Summit Series | Seattle, WA | June 14th, 2016 18
US Payers React

© GfK Market Access | Washington Rx Drug Price and Purchasing Summit Series | Seattle, WA | June 14th, 2016 19 Source: Various as shown above
Drug pricing’s “Big Bang” moment…

© GfK Market Access | Washington Rx Drug Price and Purchasing Summit Series | Seattle, WA | June 14th, 2016 20 Source: The Price of Progress, J.D. Kleinke, Health Affairs, 20, no.5 (2001): 43-60
The “Six Faces” of Pharmacy Economics
•Fast-pays: Expensive
with short-term healthcare cost
•Slow-pays: Expensive but
decrease costs over long term
•Narrow-pays: Expensive but
provide cost savings to a narrow population, not providing diffuse , aggregate benefits
•Diffuse-pays: Expensive and
decrease nonmedical costs •Pay-me-laters: Expensive and
lower short-term costs but increase long-term costs
•No-pays: Do not save anybody
money but they improve people’s lives
Health Economic ROI

© GfK Market Access | Washington Rx Drug Price and Purchasing Summit Series | Seattle, WA | June 14th, 2016 21
What triggers might draw attention for contracting?
Factor Impact on Contracting Sensitivity Competition • High competition creates opportunity for payers to consider contracting in a TA
• Most payers consider a competitive space to have 3 or more comparable products
Utilization • High utilization triggers attention as well as equips payers with an incentive • Magnitude of utilization control directly impacts the attractiveness of the incentive
Cost • High costs triggers attention and creates the need for cost savings
Number of Patients
• Higher patient numbers (coupled with high cost products and high utilization) increases the likelihood of payers to feel pressure to contract
Pharmacy Benefit • Payers have greater ability to manage products that are on the pharmacy benefit
Lack of Clinical Differentiation
• Payers are more comfortable leaving products off formulary in competitive therapy areas that have products are clinically undifferentiated
Physician Acquiescence
• Clinical guidelines or physician consensus for a product being the standard gives the payers confidence to shift patients to a product, increasing utilization and incentive
Political Pressure • Potentially provides support to payers to explore contracting
Triggers for Contracting

© GfK Market Access | Washington Rx Drug Price and Purchasing Summit Series | Seattle, WA | June 14th, 2016 22
What triggers might draw attention for contracting?
Factor HCV ONC MS PAH Hemo-philia
Asth-ma
Gau-cher’s CV
Migr-aine
Competition ✓ ✓ ✓ ✓ ✓ ✓ ✓ ✓ ? Utilization ✓ ✓ ✓ ✗ ✗ ✓ ✗ ✗ ? Cost ✓ ✓ ✓ ✓ ✓ ✓ ✓ ✓ ? Number of Patients ✓ ✓ ✓ ✗ ✗ ✓ ✗ ✓ ? Pharmacy Benefit ✓ ✓ ✓ ✓ ✗ ✓ ✓ ✓ ? Lack of Clinical Differentiation ✓ ✗ ✓ ✓ ✓ ✗ ✗ ✓ ? Physician Acquiescence ✗ ✓ ✗ ✗ ✗ ✗ ✗ ✗ ? Political Pressure ✓ ✗ ✗ ✗ ✗ ✗ ✗ ✓ ?
“At Risk” Therapy Areas
© GfK Market Access | Washington Rx Drug Price and Purchasing Summit Series | Seattle, WA | June 14th, 2016 23
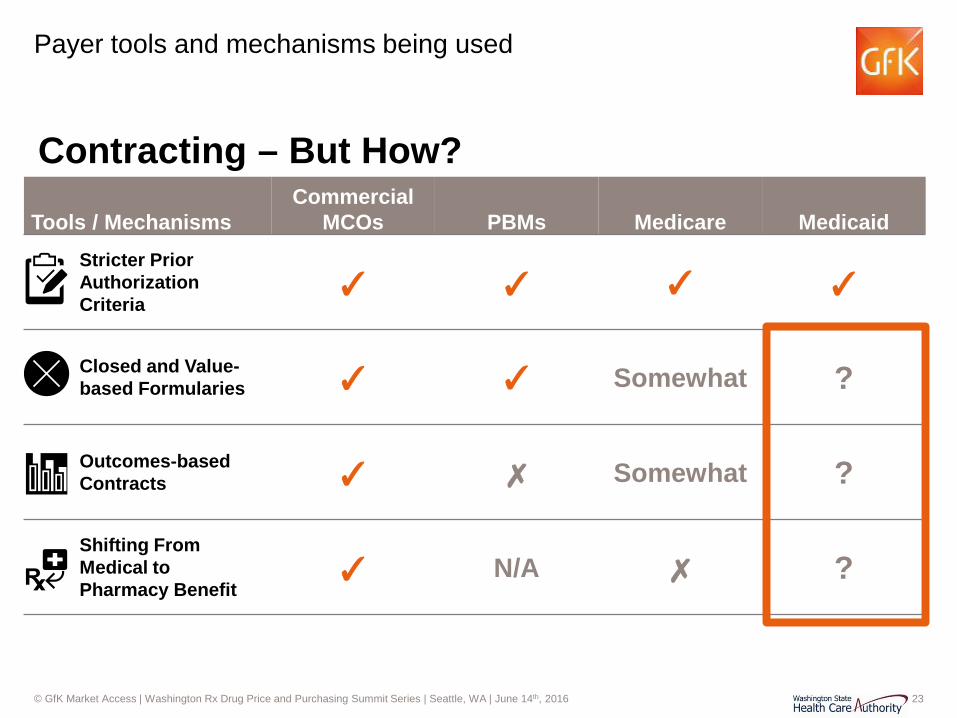
Payer tools and mechanisms being used
Contracting – But How?
Tools / Mechanisms Commercial
MCOs PBMs Medicare Medicaid Stricter Prior Authorization Criteria
✓ ✓ ✓ ✓
Closed and Value-based Formularies ✓ ✓ Somewhat ?
Outcomes-based Contracts ✓ ✗ Somewhat ?
Shifting From Medical to Pharmacy Benefit
✓ N/A ✗ ?

© GfK Market Access | Washington Rx Drug Price and Purchasing Summit Series | Seattle, WA | June 14th, 2016 24 Source: Zitter Group Survey, 2011
Payer tools and mechanisms being used
Contracting – But How?
Tools / Mechanisms Commercial
MCOs PBMs Medicare Medicaid Stricter Prior Authorization Criteria
✓ ✓ ✓ ✓
Closed and Value-based Formularies ✓ ✓ ✓ ?
Outcomes-based Contracts ✓ ✗ ? ?
Shifting From Medical to Pharmacy Benefit
✓ N/A ✗ ?
Reasons for Prior Authorization Denial

© GfK Market Access | Washington Rx Drug Price and Purchasing Summit Series | Seattle, WA | June 14th, 2016 25 Source: Pembroke Consulting research, Published on Drug Channels on August 4, 2015
Payer tools and mechanisms being used
Contracting – But How?
Tools / Mechanisms Commercial
MCOs PBMs Medicare Medicaid Stricter Prior Authorization Criteria
✓ ✓ ✓ ✓
Closed and Value-based Formularies ✓ ✓ ✓ ?
Outcomes-based Contracts ✓ ✗ ? ?
Shifting From Medical to Pharmacy Benefit
✓ N/A ✗ ?
Number of Products on PBM Formulary Exclusion Lists, 2012-2016
Note: Express Scripts did not publish exclusion lists for 2012 and 2013

© GfK Market Access | Washington Rx Drug Price and Purchasing Summit Series | Seattle, WA | June 14th, 2016 26
Payer tools and mechanisms being used
Contracting – But How?
Tools / Mechanisms Commercial
MCOs PBMs Medicare Medicaid Stricter Prior Authorization Criteria
✓ ✓ ✓ ✓
Closed and Value-based Formularies ✓ ✓ ✓ ?
Outcomes-based Contracts ✓ ✗ ? ?
Shifting From Medical to Pharmacy Benefit
✓ N/A ✗ ?

© GfK Market Access | Washington Rx Drug Price and Purchasing Summit Series | Seattle, WA | June 14th, 2016 27
Payer tools and mechanisms being used
Contracting – But How?
Tools / Mechanisms Commercial
MCOs PBMs Medicare Medicaid Stricter Prior Authorization Criteria
✓ ✓ ✓ ✓
Closed and Value-based Formularies ✓ ✓ ✓ ?
Outcomes-based Contracts ✓ ✗ ? ?
Shifting From Medical to Pharmacy Benefit
✓ N/A ✗ ?

© GfK Market Access | Washington Rx Drug Price and Purchasing Summit Series | Seattle, WA | June 14th, 2016 28
Payer tools and mechanisms being used
Contracting – But How?
Tools / Mechanisms Commercial
MCOs PBMs Medicare Medicaid Stricter Prior Authorization Criteria
✓ ✓ ✓ ✓
Closed and Value-based Formularies ✓ ✓ ✓ ?
Outcomes-based Contracts ✓ ✗ ? ?
Shifting From Medical to Pharmacy Benefit
✓ N/A ✗ ?

© GfK Market Access | Washington Rx Drug Price and Purchasing Summit Series | Seattle, WA | June 14th, 2016 29
Payer tools and mechanisms being used
Contracting – But How?
Tools / Mechanisms Commercial
MCOs PBMs Medicare Medicaid Stricter Prior Authorization Criteria
✓ ✓ ✓ ✓
Closed and Value-based Formularies ✓ ✓ ✓ ?
Outcomes-based Contracts ✓ ✗ ? ?
Shifting From Medical to Pharmacy Benefit
✓ N/A ✗ ?

© GfK Market Access | Washington Rx Drug Price and Purchasing Summit Series | Seattle, WA | June 14th, 2016 30 Source: Should Specialty Drug be Shifted From Medical to Pharmacy Benefit?, Managed Care, January 2015
Payer tools and mechanisms being used
Contracting – But How?
Tools / Mechanisms Commercial
MCOs PBMs Medicare Medicaid Stricter Prior Authorization Criteria
✓ ✓ ✓ ✓
Closed and Value-based Formularies ✓ ✓ ✓ ?
Outcomes-based Contracts ✓ ✗ ? ?
Shifting From Medical to Pharmacy Benefit
✓ N/A ✗ ?
Shift from Medical Benefit to Pharmacy Benefit (% of plans with Rx benefit coverage)

© GfK Market Access | Washington Rx Drug Price and Purchasing Summit Series | Seattle, WA | June 14th, 2016 31
What does the future hold?
Today
Value frameworks?
Cure-based pricing
Indication-based pricing
Innovative Management
TODAY FUTURE
© GfK Market Access | Washington Rx Drug Price and Purchasing Summit Series | Seattle, WA | June 14th, 2016 32
APPENDIX

© GfK Market Access | Washington Rx Drug Price and Purchasing Summit Series | Seattle, WA | June 14th, 2016 33 Source; GfK Internal Framework
Perspective makes a world of difference
Payer Archetypes Budget Visibility and Time Horizon
Long-term <1 year 2-3 years
TIME HORIZON
BU
DG
ET V
ISIB
ILIT
Y
No
budg
et
“Tre
nd”
Dire
ct
All (
+Med
ical
)

© GfK Market Access | SMART-D Team Planning Meeting | May 19th, 2016 34
General taxonomy for alternative purchasing models (APMs)
Alternative Purchasing Models
Financial- Based
Health Outcome-
Based
Patient Level
Population Level
Price Volume
Agreements
Utilization Caps
Pattern / Process of Care
Outcomes Guarantee
Coverage w/ Evidence
Development
Conditional Treatment
Continuation
Market Share
MFG Funded
Tx Initiation
Performance Based
Conditional Coverage

© GfK Market Access | SMART-D Team Planning Meeting | May 19th, 2016 35
Source: GfK desk research
23 APMs with private US payer have been publically acknowledged; however, limited details are available for nearly half of the agreements
Distribution of APMs by disease-type in US Products with APMs in the US
1. Oncology • Avastin
• Oncotype Dx
• Vectibix
2. Diabetes • Januvia
• Janumet
3. Heart disease • Entresto
• Repatha
• Praluent
4. Osteoporosis • Actonel
5. Hepatitis C • Sovaldi
• Harvoni
Alternative Purchasing Models
N=23

© GfK Market Access | SMART-D Team Planning Meeting | May 19th, 2016 36
4 key considerations when planning an APM
Levers Goals
Outcomes Alignment
How can this align with addressing our goals and needs?
What already available resources can be leveraged?
Which stakeholders need to be informed and involved?
Which endpoints and / or outcomes are most appropriate?

© GfK Market Access | SMART-D Team Planning Meeting | May 19th, 2016 37
APMs should ideally address priority goals and needs
Considerations
Goals & Needs • APMs have the potential to address both financial and non-financial goals and
needs
• Goal #2
Better outcomes?
Value for money?
Prudent use of public funds?
Budget predictability?

© GfK Market Access | SMART-D Team Planning Meeting | May 19th, 2016 38
Utilizing available levers and resources can lessen initial hurdles during implementation
Considerations
Levers & Resources
• Existing activities and studies can provide a structured base for data tracking and collecting as well as expedite reporting (e.g., Texas)
• Agreements need to accommodate for existing capabilities and resources to avoid potential delays or incomplete data reporting
• Specific drugs or drug classes may be better targets for an APM – considerations should include PDL exclusion status, competition, patient subtypes, etc.

© GfK Market Access | SMART-D Team Planning Meeting | May 19th, 2016 39
Endpoints need to be clearly defined with the ability to be collected and reported
Considerations
Defining Outcomes
• It may be prudent to target endpoints and outcomes already included in provider risk agreements
• Potential legal barriers must be considered, particularly if endpoints or outcomes being considered were not evaluated in clinical trials or are not currently in the FDA label
• Outcomes tracking can be patient-level or population-level – choice of data tracking will be dictated by prevalence of the indication and the endpoints tracked

© GfK Market Access | SMART-D Team Planning Meeting | May 19th, 2016 40
Multiple stakeholders will need to be informed and engaged
Considerations
Aligning Stakeholders
• Any agreement with manufacturers is contingent on CMS approval
• Support from legislators and policy-makers can provide the necessary levers to push an agreement through
• Involvement may be required from other state Medicaid administrators – incentives should be aligned to ensure collaborative efforts
• Alignment with MCOs and multi-state purchasing pools will ensure utilization management efforts do not clash

© GfK Market Access | SMART-D Team Planning Meeting | May 19th, 2016 41
Performance‐based health outcomes schemes: price, level, or nature of reimbursement are tied to future performance measures of clinical or intermediate endpoints that are ultimately related to patient quality or quantity of life
Taxonomy Definitions
41
Performance‐linked reimbursement: reimbursement level for covered products is tied, by formula, to the measure of clinical outcomes in the “real world”; • Outcomes guarantees: manufacturer provides rebates,
refunds, or price adjustments if their product fails to meet the agreed upon outcome targets
• Example: J&J agreed to reimburse the NHS in either cash or product for patients who do not respond (Response measure: 50% decrease in serum M protein) after 4 cycles of treatment with Velcade. Responding patients receive additional 4 cycles.
• Pattern or process of care: reimbursement level is tied to the impact on clinical decision making or practice patterns
• Example: UnitedHealthcare agreed to reimburse OncotypeDx test for 18 months while it and Genomic Health monitor the results.
• If the number of women receiving chemotherapy exceeds an agreed upon threshold, even if the test suggests they do not need it, the insurer will negotiate a lower price
Conditional coverage: coverage is granted conditional on the initiation of a program of data collection • Coverage with evidence development:
coverage is conditioned on collection of additional population level evidence, from pre specified study, to support continued, expanded, or withdrawal of coverage
• Only in research: coverage conditional on individual participation in research (i.e. only patients participating in the scientific study are covered)
• Only with research: coverage conditional on agreement to conduct a study that informs the use of the medical product in the payer patient population