presence-aware optimum resource allocation for virtual collaboration web 3.0 environments
TRANSCRIPT

8/3/2019 Presence-Aware Optimum Resource Allocation For Virtual Collaboration Web 3.0 Environments
http://slidepdf.com/reader/full/presence-aware-optimum-resource-allocation-for-virtual-collaboration-web-30 1/5
Presence-aware Optimum Resource Allocation for
Virtual Collaboration Web 3.0 Environments
Michael G. Kallitsis ∗, Robert D. Callaway †, Michael Devetsikiotis ∗† and George Michailidis §
∗ Department of Electrical and Computer Engineering, NC State University, Raleigh, North Carolina 27695† IBM Datapower SOA Appliances, IBM, Research Triangle Park, North Carolina 27709
§ Department of Statistics, University of Michigan, Ann Arbor, Michigan 48109
[email protected], [email protected], [email protected], [email protected]
Abstract—In this paper, we present a system that optimallyand dynamically allocates the available computing resources tovirtual machines that support virtual collaboration environments.Such environments are emerging fast via on-line social networks,virtual worlds, and the “Web 3.0” or “collaborative Web”paradigm. We use a utility-based framework to differentiate theapplications hosted by the virtual machines based on both theirrelative profitability and their social distance information. Wedefine social distance as the importance of social interaction
between the participants of a virtual environment that utilize aparticular application and this interaction is a function of their
presence status. Presence is affected by the physical distance, theunderlying network and the social or business relationship of the participants. We use graph theory tools to represent users’connectivity and extract the social distance information. Ouroptimization model involves a variation of the 2D Knapsackproblem and a nonlinear programming one.
I. INTRODUCTION
Combined advances in high speed networking, application
sharing, virtual world technologies and large scale event
processing are converging to create a new world of ubiquitous
“presence” of users, which offers tremendous potential for
social interaction. The communication networking and com-puting requirements of this converged human-centric environ-
ment are also increasing at an accelerated pace. In this new
environment, it is imperative that the much-needed networking
and computing resources align closely with the needs and
patterns dictated by the applications, social networks, and
indeed, by the upper-most “human layer”. It is believed that the
success of such socio-technical systems will hinge on the way
they capture and interact with human presence and location,
in all of its physical and virtual aspects.
We anticipate a cloud computing trend of hosting multi-
ple virtual machines responsible for several Online Social
Networks (OSN), as well as virtual worlds for education
or business collaboration purposes. We elaborate more usingthe example of a popular virtual world platform, the Qwaq
Forums. The suggested system architecture presents the Qwaq
server [3] hosted on a virtual machine which can be hosted on
a cloud (e.g., Amazon EC2 [1]). The cloud can support several
virtual machines that correspond to different virtual worlds
(i.e., Qwaq virtual rooms). Figure 1 shows a typical scenario: a
cloud is responsible for three different virtual rooms of NCSU
that serve different purposes and are visited by different groups
of people. Since resources are scarce, we need to answer
Fig. 1. Running multiple virtual worlds in the same cloud.
questions like which virtual machine to place for execution and
how to allocate the excess resources to those virtual machines.Other educational worlds that can share resources of a cloud
include the Second Classroom [4] world in Second Life, and
the Virtual Northstar project [2] based on Sun’s Wonderland.
In order to move towards presence-aware networks and
applications, we formulate and quantify key measures of socio-
technical presence and distance and their necessary interplay
with the control of the computing infrastructure. We introduce
the metric of social distance that represents the social inter-
action between the participants of a virtual environment that
utilize a particular application. We build a utility-based frame-
work that considers the social distance and the price of each
application, and optimally allocates the available computing
resources. Social distance is a function of the presence statusof each user; presence is influenced by the physical distance
(captured as round trip delay in our model), the underlying
network and the business distance of the participants. As an
example, consider the scenario in Figure 2. Assume that A is
the supervisor of B, they are communicating from somewhere
in the same city and they reside on a high-speed optical
network. On the other hand, C is just a regular colleague of D,
they have an interstate communication and D is connected via
a wireless network. Therefore, the business relationship of the
978-1-4244-5626-0/09/$26.00 ©2009 IEEE

8/3/2019 Presence-Aware Optimum Resource Allocation For Virtual Collaboration Web 3.0 Environments
http://slidepdf.com/reader/full/presence-aware-optimum-resource-allocation-for-virtual-collaboration-web-30 2/5
Fig. 2. Allocation of resources based on our social distance awareness model.
first couple is stronger, their round trip delay is smaller and
their network connection faster. Hence, their social interaction
is higher than the one of the other couple and this implies a
smaller social distance (see definition in Section II). Based on
our optimization framework, the application that users A and
B are working with would be assigned more resources than the
one of users C and D because their social distance is smaller.
The aforementioned framework is realized by our measure-
ment based optimal resource allocation (MBORA) system,
which is responsible for utilizing the information collected
from the social environment and allocating the available re-
sources. The employed system is comprised of three com-
ponents: (i) the measurement module, (ii) the optimization
module and (iii) the resource orchestrator module. The mod-ules interact amongst themselves in the following way: the
measurement module gathers information about the social
environment (see Section II). The optimization module re-
ceives this information and calculates the optimal allocation of
resources by solving various optimization problems discussed
in Section III. Finally, the calculated optimal solution is fed
to the resource orchestrator.
The concept of MBORA has been introduced in our ear-
lier work [7], where we studied the optimization issues of
network elements in service oriented networks (SON) and
suggested a distributed algorithm for optimal allocation of
network resources in directed acyclic network topologies.
In the current work, MBORA represents a hypervisor thatmanages the computing resources (CPU, memory) of virtual
machines. Related work on resource management and quality-
of-service (QoS) regarding virtual machines can be found
in [10]. Optimization problems similar to the ones we study in
this work appear in [8], [9]. In [8], the authors study algorithms
for dynamic placement of Web applications that maximize the
satisfied demand by solving a variant of the Class Constrained
Multiple-Knapsack Problem. In [9], another Knapsack-type
problem arises involving services composition under end-to-
end QoS constraints and distributed optimization algorithms
are proposed.
Resource allocation for virtual world environments is con-
sidered in [6], [12]. In [6], the authors propose the introduction
of user’s computers to support the computational demands
as the virtual world’s population rises. In [12], an economic
based resource allocation is approached, in which surplus
resources can be exchanged between collaborative peer-to-
peer environments. Optimization techniques for enhancing the
quality of experience in a virtual environment are addressed
in [5], [11].
The organization of the paper is as follows: in Section II,
we start by describing construction and use of the connectivity
graph that yields the required social distance information. In
Section III, we discuss our optimization problem formulation
and in Section IV we present a case-study and some numerical
results. Finally, we conclude and discuss some future work in
Section V.
I I . SOCIAL DISTANCE AND THE CONNECTIVITY GRAPH
We describe next a framework that extends the moretraditional network utility maximization to include presence
and distance-awareness in virtual collaboration environments
(VCEs) and similar social settings and goes beyond our
previous work on SONs. In this context, the presence aware
connectivity graph from which the users’ social distance
information will be obtained plays a crucial role.
Let G = (V, E ) denote a weighted graph with node and
edge set V and E , respectively, where the nodes correspond
to the users (e.g., users i, j) and the edges to their connec-
tivity in social space (see Figure 3(a)). The edge weights,
wij > 0, are calculated so as to reflect the following factors:
application used, bandwidth capabilities, physical and busi-
ness/interpersonal distance. We elaborate next on these factors:(i) Application factor: vertices of users accessing the same
application (or, more generally, the same virtual space) are
connected; i.e. eij ∈ E . (ii) Bandwidth availability of each
user: the faster the network connection of a participating user,
the larger the allocation they should get. Assuming that user-ihas a connection of C i Mbps and user- j one of C j Mbps,
then the corresponding edge weight should be proportional
to the minimum of those values, i.e.: wij ∝ min−1(C i, C j).
The intuition is that it is pointless to allocate large amounts of
resources to connections with poor bandwidth capabilities. (iii)
Round trip delay (imitates real world distance), i.e.: wij ∝ dij.
The reasoning is that we do not want to allocate more than the
absolutely necessary resources to a session of users that are farapart, since such connections usually experience larger end-
to-end delays (e.g., propagation, queueing delays) and thus
MBORA should prefer to allocate more resources to users that
are closer to each other. (iv) Business/interpersonal distance:
we want the social distance to be smaller when we deal with an
employee-manager communication, rather than an employee-
employee communication, i.e., wij ∝ r−1ij where rij takes
discrete values that represent the relationship between user-
i and user- j. For example, rij ∈ {α, β, γ } with α < β < γ

8/3/2019 Presence-Aware Optimum Resource Allocation For Virtual Collaboration Web 3.0 Environments
http://slidepdf.com/reader/full/presence-aware-optimum-resource-allocation-for-virtual-collaboration-web-30 3/5
i
j
wij
(a) The connectivity graph used torepresent each virtual world. Notethat the graph should be complete;for visual brevity, here it is not.
(b) Passing the presence informa-tion of the graph. The databasepushes information to MBORAonly when social distance changes.
Fig. 3. Connectivity graph and data mining.
should depict someone’s relationship with an unknown person,
a friend and her/his manager correspondingly. Given the above
factors, the proposed edge weights are given by
wij = ξdij + L/ min(C i, C j)
rij(1)
where ξ is a normalization constant and L is the size of a
dummy package. Other parameters (like the in-world popu-
lation or in-world distance) and other formulas for the edge
weights could also be considered and this constitutes ongoing
research.
The social distance between two nodes in the social net-
working environment S is dS(i, j) = wij . This holds only in
the case of two users collaborating in the same application. In a
multi-user, multi-application scenario we can use the diameter
of the graph, defined as the average shortest distance between
two vertices. Alternative metrics (e.g., clustering coefficient or
network flow) could also be used, if appropriate.
Given a database that contains the user connectivity patterns,the MBORA system needs to acquire that information through
a publisher-subscriber model (Figure 3(b)). We propose to use
a push model, so that MBORA will not have to update the
database. Since the distances amongst users would change
fairly frequently, the database needs to monitor them and
push updated information to MBORA only when significant
changes occur, so as to avoid excessive updates. We propose
to use exponential weighted moving average (EWMA) control
charts for this monitoring purpose. Such charts have proved
useful in previous work [7] for monitoring significant changes
in traffic parameters.
Suppose that time is divided into sequential intervals
(tn, tn+1), n = 0, 1, 2, . . . of duration Δ. The samplingmodule has to sample distance information every inter-
val in order to obtain the sequence of distance variations
{ρi(1), ρi(2), . . .}. The EWMA statistic is ρi(n + 1) =θρi(n) + ( 1 − θ)ρi(n), where ρi(n + 1) is the one-step-ahead
predictor of ρi(n + 1) and 0 < θ ≤ 1 represents the weight
that the most recent estimation is assigned. The lower/upper
control limits are given as LCL/UCL = ρi±cσi
θ
2−θ where
parameter c > 0 is a tuning variable that combined also with
parameter θ can set the sensitivity level that the provider needs
to accomplish. An out-of-control signal is generated at time
slot n when ρi(n) > UCL or ρi(n) < LCL. At that moment,
an update of distance information will be pushed to MBORA.
III. OPTIMUM ALLOCATION OF MULTIPLE RESOURCES
In principle, multiple computing and communication re-
sources might have to be allocated, including CPU cyclesand memory to the virtual machines (VM) running the re-
quired applications (or, more generally, the virtual machine
that hosts the virtual environment that users belong to). Our
proposed optimization framework consists of the following
two components: (i) A variation of the 2D Knapsack opti-
mization problem that decides which VMs would be placed
for execution according to the available resources and their
pricing parameters, (ii) a nonlinear programming problem that
allocates the excess resources to the VMs placed for execution.
We discuss next the first problem. We are given a set of
virtual machines, K , with each machine possessing Ψ amount
of memory and Ω amount of CPU power available. With
each virtual machine, we associate its demand values, ψ0k
and ω0k, which correspond to the machine’s memory and CPU
requirements, respectively. With each virtual machine we also
relate its social pricing parameter, pk, which is a function of
the application’s price, χk (either a real price or just a priority
indication), and the social distance, dkS . In summary, we have
pk = pk(χk, dkS) = χk/dkS .
The placement problem is to find a vector I , where I k is 1
if the virtual machine is running on that host and 0 otherwise,
such that (a) allocation requirements are met, (b) capacity
limits are observed and (c) the social profit is maximized. The
problem can be formally stated as follows:
maxk
I k pk subject to (2)
k
I kψ0k ≤ Ψ and
k
I kω0k ≤ Ω, I k binary, ∀k
This is an integer programming problem and the solution
can be found using branch and bound type algorithms. Once
we have placed the subset of virtual machines on the host
system, we can solve a nonlinear optimization problem, so
as to optimally allocate the excess resources of memory and
CPU power to the running virtual machines. Our objective
function is chosen to be a logarithmic one due to (a) the
concavity property of the function, and (b) our intentions for a
proportional fairness allocation scheme [7]. The optimization
problem formulation is:
maxω
k
pklog(ωk) and maxψ
k
pklog(ψk) (3)
subject tok
ωk ≤ Ω andk
ψk ≤ Ψ,
ωk ≥ ω0k, ∀k ∈ K and ψk ≥ ψ0
k, ∀k ∈ K
8/3/2019 Presence-Aware Optimum Resource Allocation For Virtual Collaboration Web 3.0 Environments
http://slidepdf.com/reader/full/presence-aware-optimum-resource-allocation-for-virtual-collaboration-web-30 4/5
IV. PERFORMANCE EVALUATION
In this section, we present the results of a numerical study
for our framework based on a simple case study. The scenario
includes three different sets of users. We assume that each
member of the set is collaborating on the same application
via a virtual world that is hosted by a particular virtual
machine. The goal of MBORA is to optimally allocate the
resources (CPU, memory) to the three aforementioned virtualmachines (K = 3). In our scenario, each set consists of three
collaborators that cooperate from various geographic locations
and may have different bandwidth capabilities and/or business
relationships. We examine MBORA’s behavior under diverse:
(a) resource demands, (b) social graph characteristics and (c)
pricing of the required applications.
Our connectivity graphs consist of three different 3-node,
complete graphs. In the first scenario, we assume that the
connectivity database contains the information depicted in
Table I. These data are needed for calculating the social di-
ameter (named as δkS henceforth) of each graph. For example,
regarding application-α, the graph weights wij of each edge
are equal to wij = ξ 1+1/105 = 2.2 (in this case study we set
ξ = 100, L = 1) and the diameter (defined as the average
shortest path length (SP) between all nodes of our graph) can
be found by δαS = 2
{i,j∈V,i=j,i<j} SP ij
|V |×|V −1| = SP 12+SP 13+SP 233
=2.2+2.2+2.2
3= 2.2.
Table II illustrates the optimal allocation as provided by
MBORA. From the first 5 rows we see that resources are
allocated to all three virtual machines; this is because the
available resources are able to accommodate the minimum
requirements of each machine. However, in the last two rows,
we see that resources are allocated only to VM-α and VM-
β ; MBORA could not place all VMs for execution. Note that
the choice of VM-α and VM-β is arbitrary; VM-γ could havebeen selected as well due to the fact that the social price pkof all applications is identical. Finally, notice that in all cases,
the excess resources are optimally allocated so as to maximize
our objective functions (3).
In the second scenario, we evaluate our model by chang-
ing parameters of the social graph that affect its diameter.
Specifically, we alter the delay between user-1 and user-2 of
application-α. Initially, dkij = 5, ∀i, j ∈ {1, 2, 3}, i = j and
k ∈ {α, β, γ }. The remaining parameters are described in the
second row of Table I and the computing demands are depicted
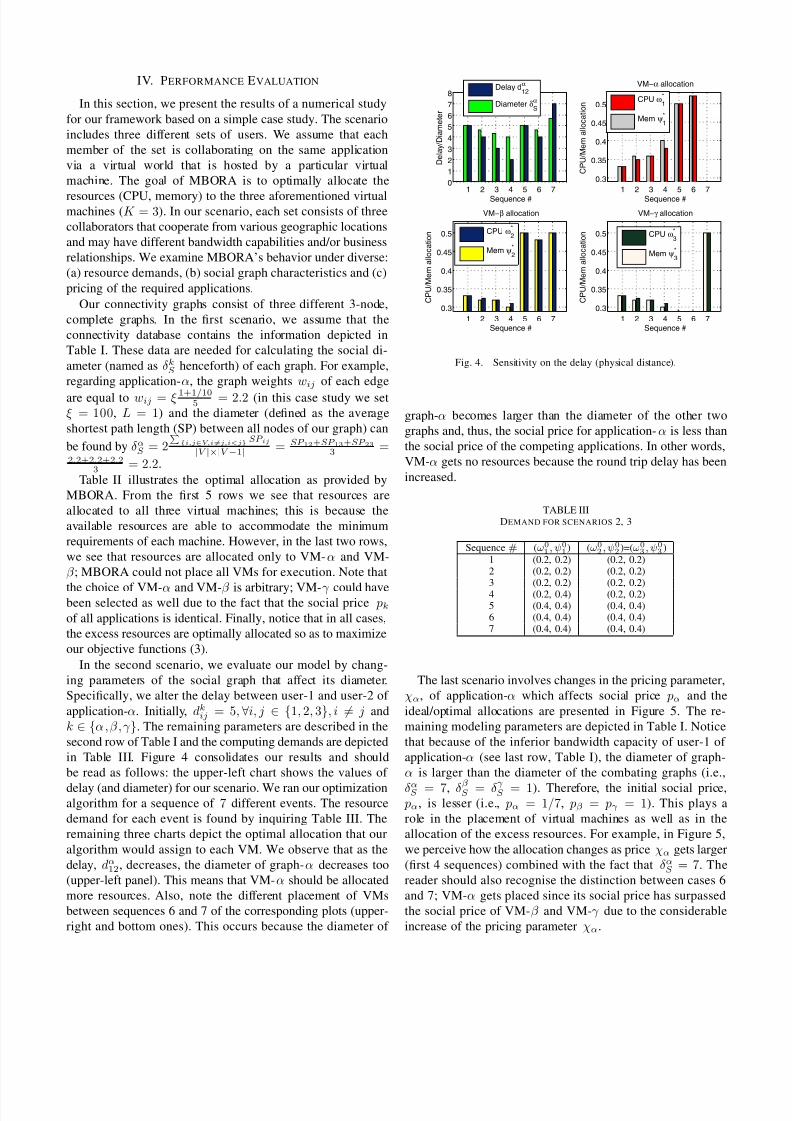
in Table III. Figure 4 consolidates our results and should
be read as follows: the upper-left chart shows the values of
delay (and diameter) for our scenario. We ran our optimizationalgorithm for a sequence of 7 different events. The resource
demand for each event is found by inquiring Table III. The
remaining three charts depict the optimal allocation that our
algorithm would assign to each VM. We observe that as the
delay, dα12, decreases, the diameter of graph-α decreases too
(upper-left panel). This means that VM-α should be allocated
more resources. Also, note the different placement of VMs
between sequences 6 and 7 of the corresponding plots (upper-
right and bottom ones). This occurs because the diameter of
1 2 3 4 5 6 70
1
2
3
4
5
6
7
8
Sequence #
D e l a y / D i a m e t e r
1 2 3 4 5 6 7
0.3
0.35
0.4
0.45
0.5
Sequence #
C P U / M e m a
l l o c a t i o n
VM−α allocation
1 2 3 4 5 6 7
0.3
0.35
0.4
0.45
0.5
Sequence #
C P U / M e m a
l l o c a t i o n
VM−β allocation
1 2 3 4 5 6 7
0.3
0.35
0.4
0.45
0.5
Sequence #
C P U / M e m a
l l o c a t i o n
VM−γ allocation
Delay d12
α
Diameter δS
α CPU ω 1
*
Mem ψ 1
*
CPU ω 2
*
Mem ψ 2
*
CPU ω 3
*
Mem ψ 3
*
Fig. 4. Sensitivity on the delay (physical distance).
graph-α becomes larger than the diameter of the other two
graphs and, thus, the social price for application-α is less than
the social price of the competing applications. In other words,
VM-α gets no resources because the round trip delay has been
increased.
TABLE IIIDEMAND FOR SCENARIOS 2, 3
Sequence # (ω01, ψ0
1) (ω0
2, ψ0
2)=(ω0
3, ψ0
3)
1 (0.2, 0.2) (0.2, 0.2)2 (0.2, 0.2) (0.2, 0.2)3 (0.2, 0.2) (0.2, 0.2)4 (0.2, 0.4) (0.2, 0.2)5 (0.4, 0.4) (0.4, 0.4)6 (0.4, 0.4) (0.4, 0.4)7 (0.4, 0.4) (0.4, 0.4)
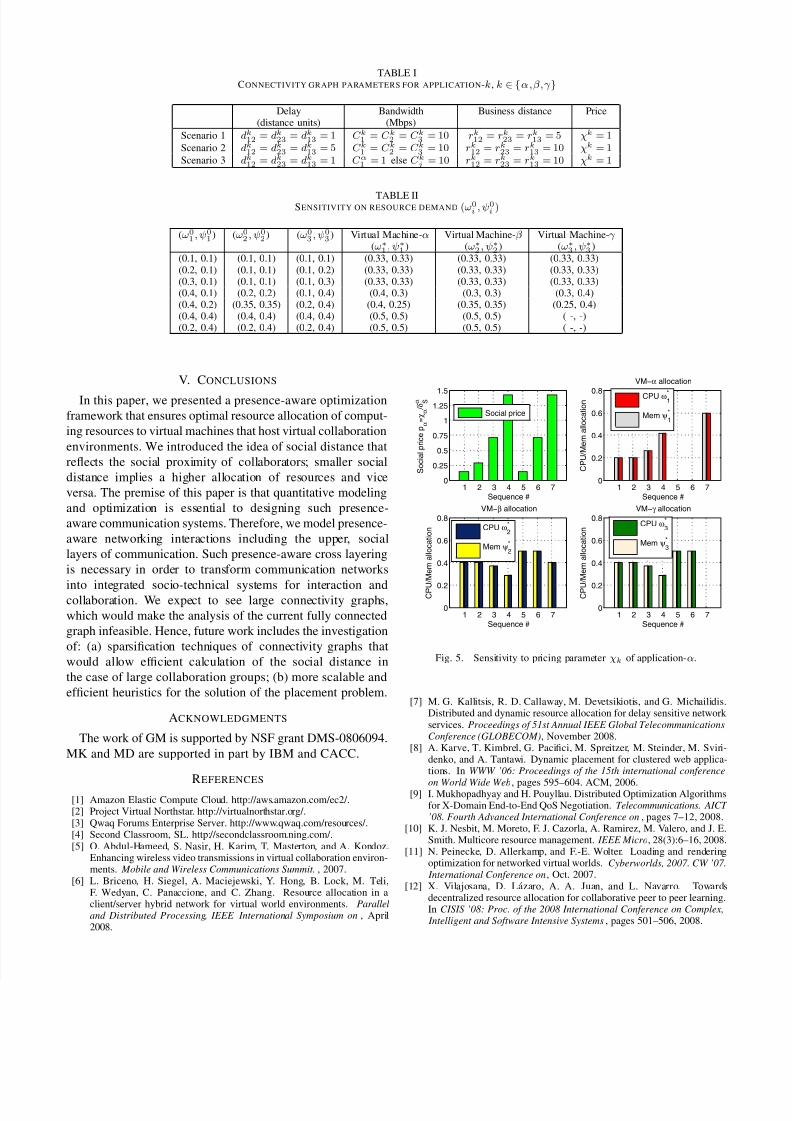
The last scenario involves changes in the pricing parameter,
χα, of application-α which affects social price pα and the
ideal/optimal allocations are presented in Figure 5. The re-
maining modeling parameters are depicted in Table I. Notice
that because of the inferior bandwidth capacity of user-1 of
application-α (see last row, Table I), the diameter of graph-
α is larger than the diameter of the combating graphs (i.e.,
δαS = 7, δβS = δγS = 1). Therefore, the initial social price, pα, is lesser (i.e., pα = 1/7, pβ = pγ = 1). This plays a
role in the placement of virtual machines as well as in the
allocation of the excess resources. For example, in Figure 5,
we perceive how the allocation changes as price χα gets larger
(first 4 sequences) combined with the fact that δαS = 7. The
reader should also recognise the distinction between cases 6
and 7; VM-α gets placed since its social price has surpassed
the social price of VM-β and VM-γ due to the considerable
increase of the pricing parameter χα.
8/3/2019 Presence-Aware Optimum Resource Allocation For Virtual Collaboration Web 3.0 Environments
http://slidepdf.com/reader/full/presence-aware-optimum-resource-allocation-for-virtual-collaboration-web-30 5/5
TABLE ICONNECTIVITY GRAPH PARAMETERS FOR APPLICATION-k, k ∈ {α,β,γ }
Delay Bandwidth Business distance Price(distance units) (Mbps)
Scenario 1 dk12
= dk23
= dk13
= 1 C k1
= C k2
= C k3
= 10 rk12
= rk23
= rk13
= 5 χk = 1Scenario 2 dk
12= dk
23= dk
13= 5 C k
1= C k
2= C k
3= 10 rk
12= rk
23= rk
13= 10 χk = 1
Scenario 3 dk12
= dk23
= dk13
= 1 C α1
= 1 else C kj = 10 rk12
= rk23
= rk13
= 10 χk = 1
TABLE IISENSITIVITY ON RESOURCE DEMAND (ω0i , ψ
0
i )
(ω01, ψ0
1) (ω0
2, ψ0
2) (ω0
3, ψ0
3) Virtual Machine-α Virtual Machine-β Virtual Machine-γ
(ω∗1, ψ∗
1) (ω∗
2, ψ∗
2) (ω∗
3, ψ∗
3)
(0.1, 0.1) (0.1, 0.1) (0.1, 0.1) (0.33, 0.33) (0.33, 0.33) (0.33, 0.33)(0.2, 0.1) (0.1, 0.1) (0.1, 0.2) (0.33, 0.33) (0.33, 0.33) (0.33, 0.33)(0.3, 0.1) (0.1, 0.1) (0.1, 0.3) (0.33, 0.33) (0.33, 0.33) (0.33, 0.33)(0.4, 0.1) (0.2, 0.2) (0.1, 0.4) (0.4, 0.3) (0.3, 0.3) (0.3, 0.4)(0.4, 0.2) (0.35, 0.35) (0.2, 0.4) (0.4, 0.25) (0.35, 0.35) (0.25, 0.4)(0.4, 0.4) (0.4, 0.4) (0.4, 0.4) (0.5, 0.5) (0.5, 0.5) ( -, -)(0.2, 0.4) (0.2, 0.4) (0.2, 0.4) (0.5, 0.5) (0.5, 0.5) ( -, -)
V. CONCLUSIONS
In this paper, we presented a presence-aware optimization
framework that ensures optimal resource allocation of comput-
ing resources to virtual machines that host virtual collaboration
environments. We introduced the idea of social distance that
reflects the social proximity of collaborators; smaller social
distance implies a higher allocation of resources and vice
versa. The premise of this paper is that quantitative modeling
and optimization is essential to designing such presence-
aware communication systems. Therefore, we model presence-
aware networking interactions including the upper, social
layers of communication. Such presence-aware cross layering
is necessary in order to transform communication networks
into integrated socio-technical systems for interaction andcollaboration. We expect to see large connectivity graphs,
which would make the analysis of the current fully connected
graph infeasible. Hence, future work includes the investigation
of: (a) sparsification techniques of connectivity graphs that
would allow efficient calculation of the social distance in
the case of large collaboration groups; (b) more scalable and
efficient heuristics for the solution of the placement problem.
ACKNOWLEDGMENTS
The work of GM is supported by NSF grant DMS-0806094.
MK and MD are supported in part by IBM and CACC.
REFERENCES
[1] Amazon Elastic Compute Cloud. http://aws.amazon.com/ec2/.[2] Project Virtual Northstar. http://virtualnorthstar.org/.[3] Qwaq Forums Enterprise Server. http://www.qwaq.com/resources/.[4] Second Classroom, SL. http://secondclassroom.ning.com/.[5] O. Abdul-Hameed, S. Nasir, H. Karim, T. Masterton, and A. Kondoz.
Enhancing wireless video transmissions in virtual collaboration environ-ments. Mobile and Wireless Communications Summit., 2007.
[6] L. Briceno, H. Siegel, A. Maciejewski, Y. Hong, B. Lock, M. Teli,F. Wedyan, C. Panaccione, and C. Zhang. Resource allocation in aclient/server hybrid network for virtual world environments. Paralleland Distributed Processing, IEEE International Symposium on, April2008.
1 2 3 4 5 6 70
0.25
0.5
0.75
1
1.25
1.5
Sequence #
S o c i a l p r i c e p α = χ α
/ δ S α
1 2 3 4 5 6 70
0.2
0.4
0.6
0.8
Sequence #
C P U / M e m a
l l o c a t i o n
VM−α allocation
1 2 3 4 5 6 70
0.2
0.4
0.6
0.8
Sequence #
C P U / M e m a
l l o c a t i o n
VM−β allocation
1 2 3 4 5 6 7
0
0.2
0.4
0.6
0.8
Sequence #
C P U / M e m a
l l o c a t i o n
VM−γ allocation
Social price
CPU ω 1*
Mem ψ 1
*
CPU ω 2
*
Mem ψ 2
*
CPU ω 3
*
Mem ψ 3
*
Fig. 5. Sensitivity to pricing parameter χk of application-α.
[7] M. G. Kallitsis, R. D. Callaway, M. Devetsikiotis, and G. Michailidis.Distributed and dynamic resource allocation for delay sensitive network services. Proceedings of 51st Annual IEEE Global TelecommunicationsConference (GLOBECOM), November 2008.
[8] A. Karve, T. Kimbrel, G. Pacifici, M. Spreitzer, M. Steinder, M. Sviri-denko, and A. Tantawi. Dynamic placement for clustered web applica-tions. In WWW ’06: Proceedings of the 15th international conference
on World Wide Web, pages 595–604. ACM, 2006.[9] I. Mukhopadhyay and H. Pouyllau. Distributed Optimization Algorithmsfor X-Domain End-to-End QoS Negotiation. Telecommunications. AICT ’08. Fourth Advanced International Conference on, pages 7–12, 2008.
[10] K. J. Nesbit, M. Moreto, F. J. Cazorla, A. Ramirez, M. Valero, and J. E.Smith. Multicore resource management. IEEE Micro, 28(3):6–16, 2008.
[11] N. Peinecke, D. Allerkamp, and F.-E. Wolter. Loading and renderingoptimization for networked virtual worlds. Cyberworlds, 2007. CW ’07.
International Conference on, Oct. 2007.[12] X. Vilajosana, D. Lazaro, A. A. Juan, and L. Navarro. Towards
decentralized resource allocation for collaborative peer to peer learning.In CISIS ’08: Proc. of the 2008 International Conference on Complex,
Intelligent and Software Intensive Systems, pages 501–506, 2008.