presentation on the port of richards bay 07 december … · page 1 presentation on the port of...
TRANSCRIPT

1 PAGE
PRESENTATION ON THE PORT OF RICHARDS BAY Mr Brian Molefe Group Chief Executive 07 December 2011
2 PAGE
OVERVIEW
CAPITAL PROJECTS
PORT DEVELOPMENT FRAMEWORK
FUTURE GROWTH PLANS
LAND USE STRATEGY
TABLE OF CONTENTS
LOTHAIR LINK

3 PAGE
Overview of the Port of Richards Bay developments up to 2011
BREAK BULK – 7.1 mtpa
LIQUIDS – 1.2 mtpa
DRY BULK – 13 mtpa BREAK BULK
COAL – 67.5 mtpa

4 PAGE
Saldanha Bay14%
Richards Bay55%
East London1%
Durban20%
Cape Town5%
Port Elizabeth4%
Mossel Bay1%
% VOLUME OF CARGO PER SA PORT

5 PAGE
TERMINAL OVERVIEW
• Terminal handles mainly export commodities;
• Infrastructure includes a 55 km conveyor belt system;
• Provides both under-cover (shed) and open stack storage;
• Richards Bay is a 93% bulk operation of which 67% is
conveyor belted and 26% shipped via skip – only 7% is
pure Breakbulk;
• Financially & commercially stable with growth potential but
equipment unreliability may be restrictive;
• There are some clear pockets of excellence, but ops
performance is erratic due to equipment breakdowns;
• This has a negative impact on efficiency and terminal
profit margins;
• Some environmental issues exists e.g. soil contamination,
dust emissions, etc.
• Increasing number of safety incidents is a major concern
and initiatives are in place e.g. safety league, PPE, Green
Area meetings, Training etc.
Bulk via conveyors +- 13 mtpa
Breakbulk via skip +- 7 mtpa

6 PAGE
701 702 703 704 705
Dry Bulk Plant
6 Page 7

Slide 7 Presentation to DPE
0.0
2.0
4.0
6.0
8.0
10.0
12.0
2011/12. 2012/13. 2013/14. 2014/15. 2015/16 2016/17. 2017/18 2018/19.
Other Import Coking Coal Alumina & PetcokeSulphur Capacity
0
2
4
6
8
10
12
14
16
18
2011/12. 2012/13. 2013/14. 2014/15. 2015/16. 2016/17. 2017/18. 2018/19.
Other Export Chrome Magnetite
Coal / Anthracite Capacity
0
2
4
6
8
10
12
2011/12. 2012/13. 2013/14. 2014/15. 2015/16. 2016/17. 2017/18. 2018/19.
Ferro Chrome Ferro Manganese Chrome LumpyManganese Containers OtherCapacity
Increased Chrome Stack
ECICS Expansion
ECICS Expansion
Bulk Imports
Bulk Exports
Break Bulk
Woodchip excluded as 1 berth is sufficient for 7-yr demand
CAPACITY VERSUS DEMAND (million ton per annum)
Break-bulk Terminal 8.0 mtpa
Dry Bulk Terminal Imports: 9.6 mtpa Mineral Exports: 11.5 - 14.0 mtpa Woodchip Exports: 2.8 mtpa

8 PAGE
CURRENT PERFORMANCE
Performance Indicators
2011/2012 YTD 2010/11 2009/10 2008/9
Tons per hour (Ship loading)
699
664
592
651
Tons per hour (Ship unloading)
445
427
401
427

9 PAGE
RICHARDS BAY TURNAROUND BUSINESS DRIVERS: Technical, Planning, Ops
Bulk Import
Bulk Export & Storage
Rationalisation due to complexity of the business and similarities in operation, market demand and equipment type
Export + storage
7 series + neo-bulk
Import + 6 series
• Dedicated Ops team 24/7
• Dedicated technical team 24/7
• Berth management 12/7
• Landside planning • Rail • RMT • Yard (rail & stack)
• Resource allocation
• Gangs • Equipment
SAFETY / ENVIRONMENT COMMUNICATION (CULTURE CHANGE)
PROCUREMENT

10 PAGE
Richards Bay Coal Terminal (“RBCT”) @ Glance
• 1976 : 2 Berths constructed for 26 mtpa coal over 10 years
• 2011 : Increased capacity from 76 mtpa to 91 mtpa and 8 million ton stockpile
Terminal Size
• 6 berths of 1934 metres quay wall, 17.5 m draft
COAL TERMINAL

11 PAGE
RAIL VOLUME PERFORMANCE (MT)
RBCT EXPORT COAL (74MT SAFELY) : VOLUME PERFORMANCE
RAMP UP VOLUMES 2011/12 6.77.06.76.5
7.06.76.76.76.5
2.7
5.0
5.96.46.6
6.25.6
2.3
5.35.2
Mar Feb Jan Dec Nov Oct Sep Aug Jul Jun May Apr
1.591.591.571.571.571.571.521.521.52
1.331.361.381.501.49
1.401.43
Apr
1.21
Mar Feb Aug Jul
1.31
Jun
1.16
May Jan Dec Nov Oct Sep
Average weekly performance
20.3220.1719.92
13.63
6.43
18.44
Q3 Q2
Q1
12.83
Q4
Comments:
We are currently achieving on average 28 trains per day
Weekly tempo is 18% better than before the shut in June.
6.430mT was railed against a budget of 6.723, 4% behind October target.
YTD railings shortfall improved by 1% from September to 6% behind target YTD.
YTD Performance as at 25 October 2011
Actual
Target 74Mt
PY
37.70136.17540.276
-6%
11/12 YTD Actual
2010/11 Actual
11/12 YTD Budget (74MT)
+4%

12 PAGE
Interdependent initiatives (levers) across these focus areas must all succeed to achieve planned ramp-up
Operational simplification •Rolling stock utilisation •Improved consistency
Train efficiency •Increase throughput with same resources
Resource co-ordination and availability. •Improved operating consistency
Customer Management •Improved consistency
Wagon standardisation
Lead locomotives/ ECP & slow speed
Available and reliable
infrastructure
26 t/a
Train top ups
Schedule and siding
Co-ordination
Ability to load 100 J at 26t/a in 4 hrs
Count down Yard processes
Crew and loco availability
Standardise to 19E locomotives
SAFETY • Introduction of various technologies that serves as early detection systems and rolling stock condition
monitoring. • Hot Box detectors • In-Motion weigh bridges • Bearing monitoring • Speed profiling • Wheel measurement systems • Rail stress management
RBCT EXPORT COAL (74MT SAFELY): FOUR CRITICAL OPERATIONAL FOCUS AREAS

13 PAGE
RBCT EXPORT COAL (74MT SAFELY): Progress on levers + Light Capital
Wagon standardisation
Lead locomotives/ ECP & slow speed
Available and reliable
infrastructure
26 t/a
Train top ups
Schedule and siding
Co-ordination
Mine readiness
Count down Yard processes
Crew availability
Locomotive reliability
Security
Light Capital initiatives
• Ermelo improved from 1245 to 879 minutes. Total reduction in cycle time from, 65 to 60 hrs. Richards bay achieved it’s target, but increase from 430 to 530 min, mainly due to the extended work by TCP on the departure area.
• The average wagons per set improved from 80 to 98 wagons
• A new scheduling tool was developed to for planning trains to the 42 loading sites.
• The impact of locomotives on train delays improved from 25000 to 13000 minutes per month. • Tolerance level is 7500 per month
• Crew availability improved from 16 slots on the main line and 34 slots to the mines to 19 and 40 respectively.
• The impact of infrastructure on train delays improved to 7900 min in August, but deteriorated to 24000 min in October. Tolerance level is 11500 min per month.
• This lever focus on mines to load 100 ECP wagons with any locomotive type in 4 hrs at 26 t/axle. 60% mines can accommodate ECP, 71% can accommodate 19E locomotives.
• The impact of security related incidents on train delays improved and are sustained to well below tolerance of 4400 min
• 400 new wagons build this year were build with ECP brake systems. 75 % of the wagons we use is now ECP
• 16x Diesels were fitted with slow speed. 40x 10E locomotives were fitted with slow speed. All 7E locomotives are ECP lead capable. 10E locomotives in progress and should be completed by Apr’12
• Trichardt and Wonderfontein lines were upgraded from 20 to 26 t/axle. The impact of this is that the overall average load per train increased from 7700 to 8000 ton per train.

14 PAGE
Bulk Liquid Berth @ Glance
• Capacity 1,1mtpa, with new berth capacity will increase to 2.4 mtpa
Terminal Size
• 2 berths of 600 metres quay wall
• Basin dredged to 14 metres 50 000 tonnes DWT vessels
BULK LIQUID BERTH

15 PAGE

16 PAGE
PROPOSED SOUTH DUNES COAL

17 PAGE
Navitrade
Bayside Aluminium
Berth 606
RBCT
Small Craft Harbour
CTC + Mondi Foscor
DBT + MPT
South Dunes

Current Layout
Navitrade
Kusasa
Foskor
CTC & Mondi Silvercell Wood Chips
Shincel Wood Chips
BHP Hillside Aluminium
Strang Rennies
BHP Bayside Aluminium
Bayview Yard Skoonkaai Yard
Small Craft Harbour
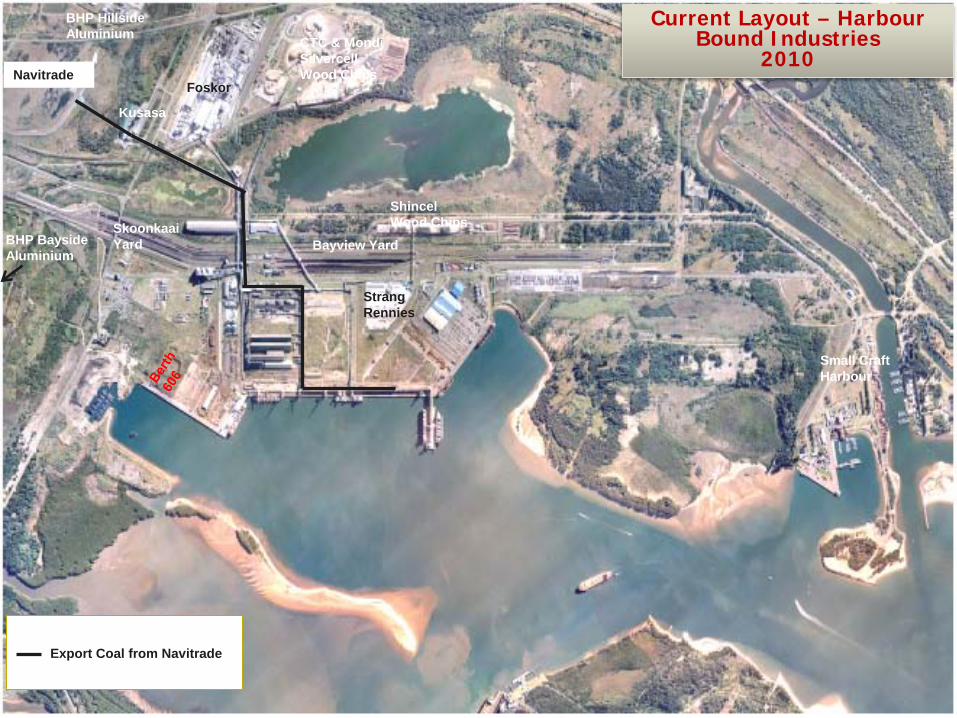
Current Layout – Harbour Bound Industries
2010 Navitrade
Kusasa
Foskor
CTC & Mondi Silvercell Wood Chips
Shincel Wood Chips
BHP Hillside Aluminium
Strang Rennies
BHP Bayside Aluminium
Bayview Yard Skoonkaai Yard
Small Craft Harbour
Export Coal from Navitrade

Navitrade
Kusasa
Foskor
CTC & Mondi Silvercell Wood Chips
Shincel Wood Chips
BHP Hillside Aluminium
Strang Rennies
BHP Bayside Aluminium
Bayview Yard Skoonkaai Yard
Small Craft Harbour
Import Sulphur to Kusasa & Foskor
Current Layout – Harbour Bound Industries
2010

Navitrade
Kusasa
Foskor
CTC & Mondi Silvercell Wood Chips
Shincel Wood Chips
BHP Hillside Aluminium
Strang Rennies
BHP Bayside Aluminium
Bayview Yard Skoonkaai Yard
Small Craft Harbour
Import Alumina to BHP Aluminium
Current Layout – Harbour Bound Industries
2010

Navitrade
Kusasa
Foskor
CTC & Mondi Silvercell Wood Chips
Shincel Wood Chips
BHP Hillside Aluminium
Strang Rennies
BHP Bayside Aluminium
Bayview Yard Skoonkaai Yard
Small Craft Harbour
Export Wood chips from CTC, Mondi Silvercell & Shincel
Current Layout – Harbour Bound Industries
2010

Truck Staging
Short Term – Fencing and Surfacing Plans
Navitrade
Kusasa
Foskor
CTC & Mondi Silvercell Wood Chips
Shincel Wood Chips
BHP Hillside Aluminium
Strang Rennies
BHP Bayside Aluminium
Bayview Yard Skoonkaai Yard
Small Craft Harbour
Bulk Cargo Stacking Areas
New surfaces

Project 0: Bayview Rail Yard Redesign & Construct • Initial rail loop serving Chrome, Ferrochrome, Ferromanganese and other
bulk freight
TNPA portion is R0.5B
Medium Term Plans

Project 1: Magnetite Stream
Medium Term Plans

Project 2: Chrome Stream
Strang Rennies aluminium stockyard be moved from current location
Medium Term Plans
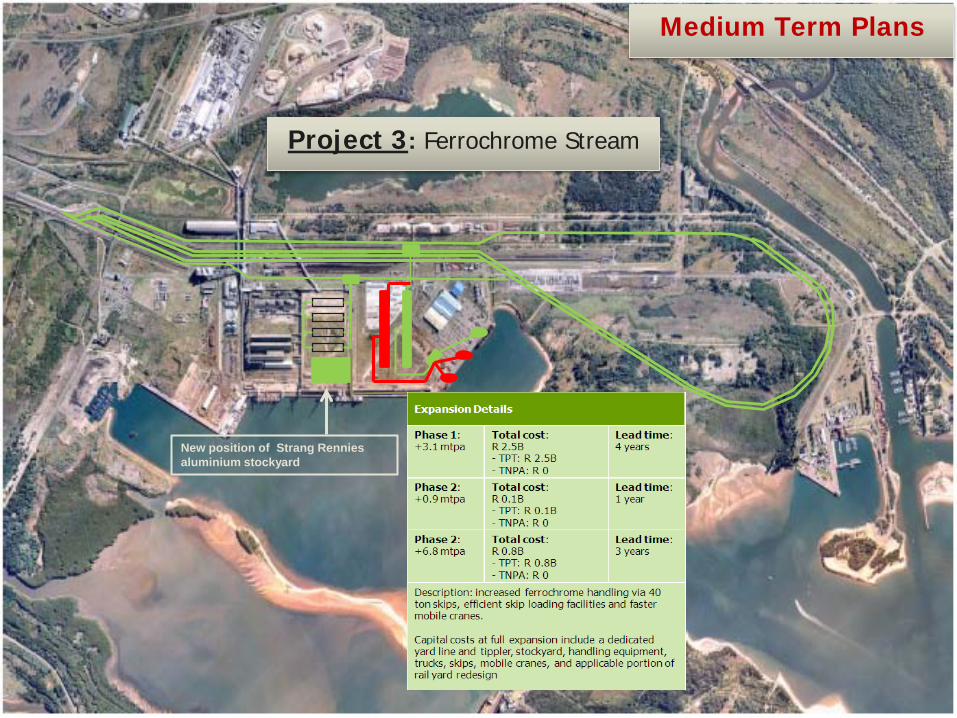
Project 3: Ferrochrome Stream
New position of Strang Rennies aluminium stockyard
Medium Term Plans

Project 4: Ferromanganese Stream
Medium Term Plans

Project 5: Non Priority GFB
Medium Term Plans

2019 Configuration
GFB MAGNETITE CHROME FERRO CHROME
FERRO MANGANESE
RAIL YARD UPGRADE NEW RAIL LOOP

31 PAGE
Navitrade
Bayside Aluminium
Berth 606
South Dunes coal terminal
RBCT
Small Craft Harbour
CTC + Mondi Foscor
Bayview Yard and new rail loop
GFB
Magnetite
Chrome, ferro- chrome, ferro -
manganese
MPT

32 PAGE
NAVITRADE
South Dunes Coal Terminal
Dry Bulk (no coal)
Berth 606 backup area
Proposed berth for additional 12 mtpa coal
Proposed LNG Import berth
Billiton Hillside IDZ
Billiton Bayside Ship Repair
RBCT Terminal 91 mtpa coal capacity
33 PAGE
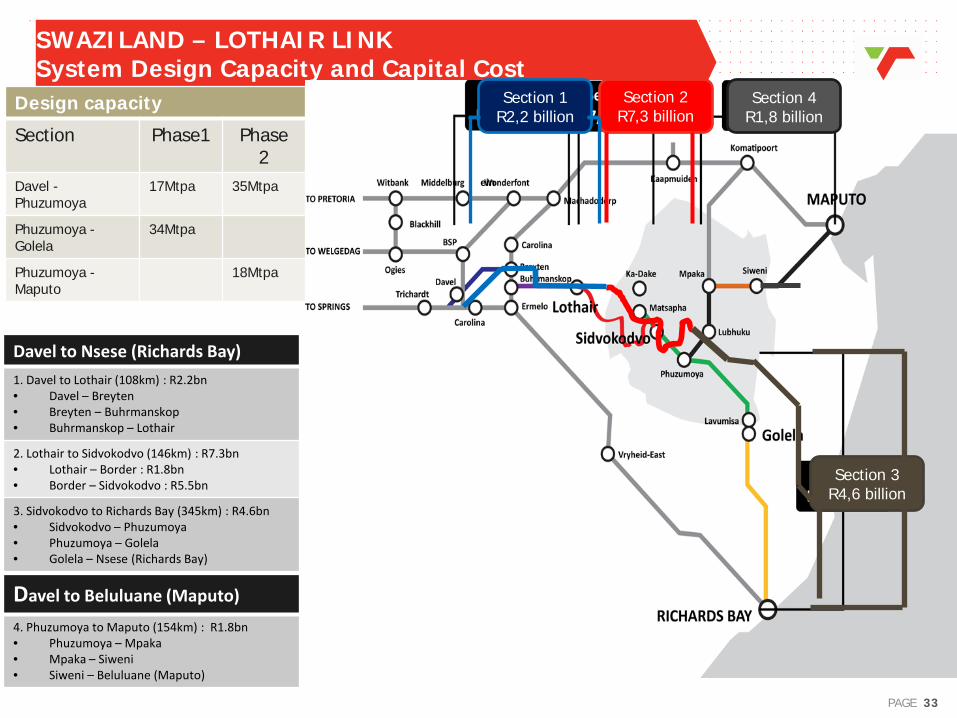
SWAZILAND – LOTHAIR LINK System Design Capacity and Capital Cost
Davel to Nsese (Richards Bay)
1. Davel to Lothair (108km) : R2.2bn • Davel – Breyten • Breyten – Buhrmanskop • Buhrmanskop – Lothair
2. Lothair to Sidvokodvo (146km) : R7.3bn • Lothair – Border : R1.8bn • Border – Sidvokodvo : R5.5bn
3. Sidvokodvo to Richards Bay (345km) : R4.6bn • Sidvokodvo – Phuzumoya • Phuzumoya – Golela • Golela – Nsese (Richards Bay)
Davel to Beluluane (Maputo)
4. Phuzumoya to Maputo (154km) : R1.8bn • Phuzumoya – Mpaka • Mpaka – Siweni • Siweni – Beluluane (Maputo)
ein
Design capacity
Section Phase1 Phase 2
Davel - Phuzumoya
17Mtpa 35Mtpa
Phuzumoya - Golela
34Mtpa
Phuzumoya - Maputo
18Mtpa
Section 1 R2,2 billion
Section 2 R7,3 billion
Section 4 R1,8 billion
Section 3 R4,6 billion

34 PAGE
7 YEAR CAPITAL INVESTMENT PLAN (TNPA)

35 PAGE
7 YEAR CAPITAL INVESTMENT : MAJOR PROJECTS: (TNPA)

36 PAGE
TOP 10 CAPITAL PROJECTS 7-YEAR PLAN: (TPT) Project Rank Termin
al 2012/13 Budget R m
2013/14 Projection R m
2014/15 Projection R m
2015/16 Projection R m
2016/17 Projection R m
2017/18 Projection R m
2018/19 Projection R m
7y Plan Total R m
Richards Bay – ECICS 2020 Expansion
1 RBYDBT 10 20 148 1 000 2 350 2 148 1 913 7 587 Richards Bay - Sustaining Capital
2 RBYDBT, RBYMPT
261 1 593 1 246 465 583 227 137 4 512 Saldanha Iron Ore Terminal Expansion (60 to 80mtpa)
3 SALIOT 20 205 1 200 1 950 900 0 0 4 275
Ngqura Manganese Terminal (2 berths)
4 NGQURA 0 30 500 1 440 1 960 0 0 3 930
Pier 1 Phase 2 Salisbury Island Infill
5 PIER 1 0 0 0 940 1 506 0 0 2 446
Straddle Carrier Fleet Replacement
6 DCT 0 323 234 412 520 0 0 1 489
DCT Cargo Handling Equipment – post berth deepening
7 DCT 0 0 0 419 729 0 0 1 149
Ngqura Container Terminal Phase 2A
8 NGQURA 200 897 0 0 0 0 0 1 097
Ngqura Container Terminal Phase 2B
9 NGQURA 0 0 0 65 485 258 0 808
x7 tandem lift STS Cranes for DCT Pier 2
10 DCT 516 0 0 0 0 0 0 516
Other Projects (#200) Various 1 379 1 022 338 991 514 87 691 5 022
Total 2 387 4 091 3 665 7 683 9 546 2 719 2 741 32 831
R33bn capital spend being planned over the
next 7 years
(Richards Bay: R12.1bn)

37 PAGE
37
Replacement Expansion
3,685
8,742
7 Year Plan (Rm)
45%
Expansion
7%
Refurbishment
Performance Improvement
6%
Replacement
26%
16% Safety Critical
RICHARDS BAY INVESTMENT PLAN: (TPT)
Project Title Total ETC 7 Year Plan
1 ECICS 7 587
2 Sustaining the Assets (Asset Audit outcomes) 993
3 Quayside Equipment Replacement (x3) Unloaders 450
4 Open Storage Area C&D West Development 315
5 Surfacing & Fencing of 606 Backup Area 300
6 Surfacing of Triangle area 300
7 Replace forklifts 229
8 Surfacing of E&F East 200
9 Quayside Equipment Replacement (x2) 200
10 Tippler Replacement 180
11 1 high capacity loader 180
12 Upgrading of Fire Systems Phase 3 137
13 Replace haulers 129
14 GP 1 & 2 Rail Beam Refurbishment 120
15 Others (#49 Projects) 1 108
Total 12 427

38 PAGE
THANK YOU
END!