presentazione green public procurement 2015
TRANSCRIPT

Lo stato dell’arte nella diffusione del Green Public Procurement:
sviluppi, driver e prospettive
Fabio IraldoIstituto di Management, Scuola Sant’Anna
di Pisa e Osservatorio sulla Green Economy dello IEFE - Università Bocconi

Figure 1: Total public expenditures on works, goods and services 2010 (Billion €)
Source: Public procurement indicators 2010, European Commission
Quale mercato potenziale? La dimensione della spesa pubblica

Figure 2- Total public expenditures of works, goods and services as a percentage of GDP (average 2006-1 0)
Source: Public procurement indicators 2010, European Commission
L’Italia non è fra i primi se si utilizza l’indicatore sul PIL

L’attuale diffusione del GPP

Vi sono differenze rilevanti tra «categorie merceologiche»

La «competitività» del GPP per l’acquirente: l’impatto sui costi
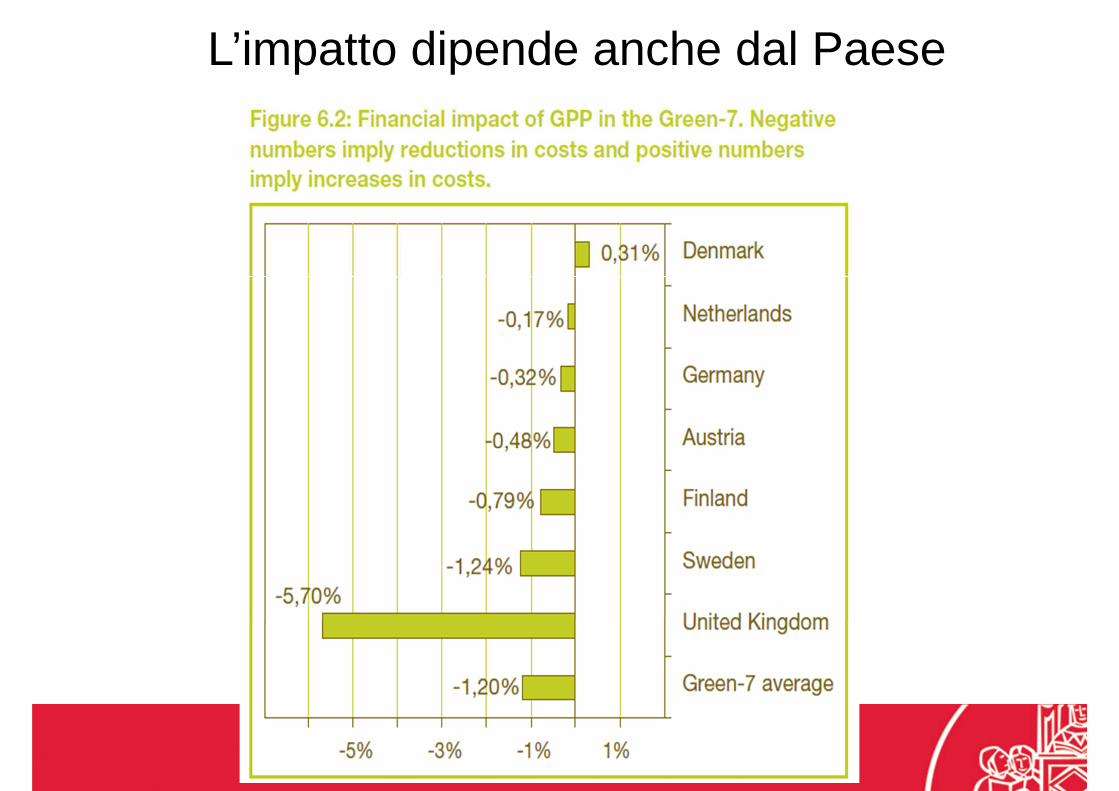
L’impatto dipende anche dal Paese
Per comprendere il mercato, occorre analizzare le caratteristiche della domanda:
• Quanto sono diffusi i bandi «verdi»?
• Cosa chiedono?
• Come è possibile ampliare il mercato?
Parziali risposte in due nostre ricerche:
• Diffusione della «greeness» nei bandi
• Variabili che determinano la scelta di adottare GPP da parte degli enti locali

1) Content Analysis su un campione di bandi del settore costruzioni italiano
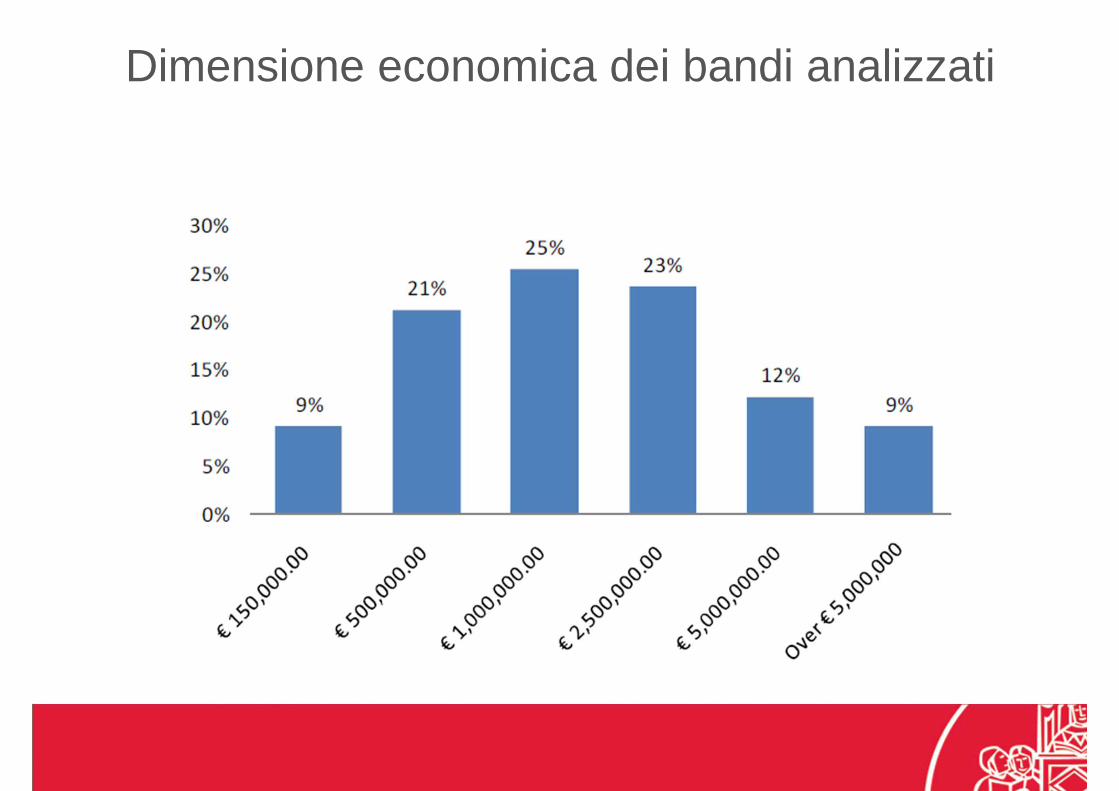
Dimensione economica dei bandi analizzati

Distribuzione per dimensione dell’ente

Guida per l’analisi: i criteri GPP europei su building and construction
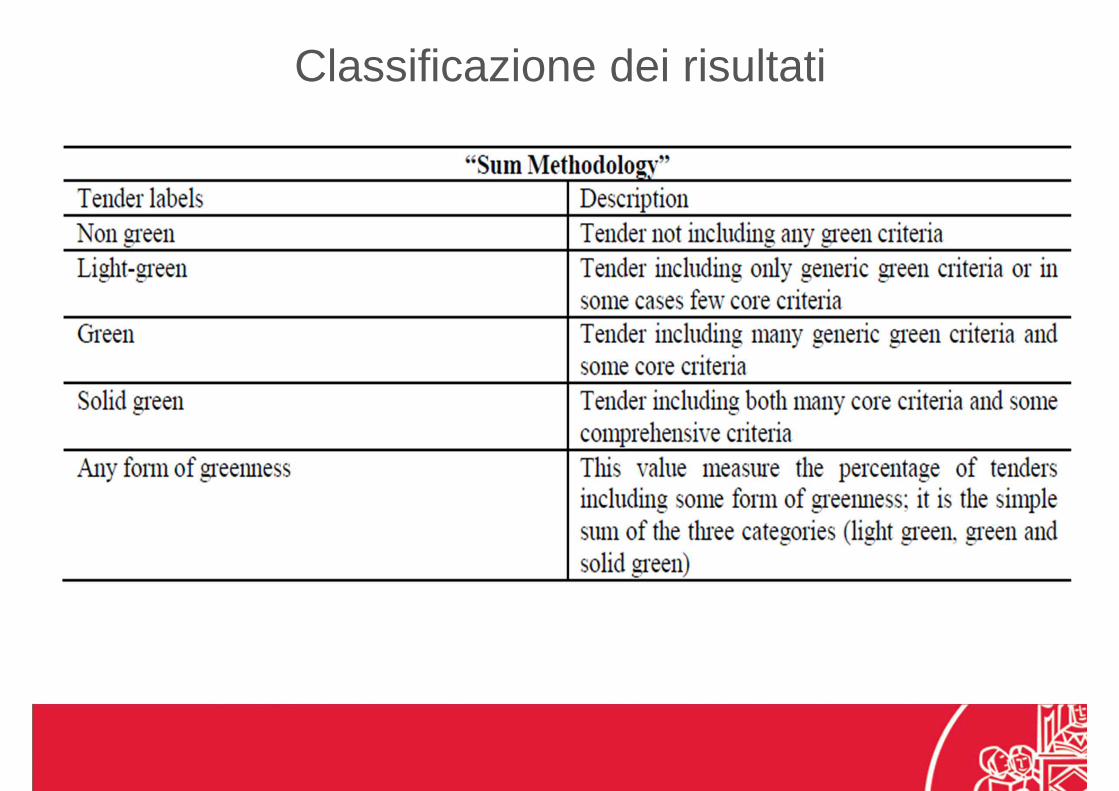
Classificazione dei risultati

Risultato finale in numero e valore dei bandi verdi

2) Survey sui comuni toscani sulle dinamiche di acquisto e di scelta
di adottare GPPPopulation % of
populationNumber ofmunicipalities
% ofmunicipalities
Tuscany 3,749,813 287
Sampledmunicipalities
1,946,028 51.9 81 28.6
Respondentmunicipalities
1,026,114 27.4 62 21.6
L’approccio dello studio• Indagine questionaria diretta presso i Comuni
• Identificazione dalla letteratura delle principali determinanti e delle variabili chepossono influenzare la scelta di adottare GPP
• Lo studio si è concluso con un modello statistico che ha mirato a comprendere qualivariabili sono cruciali nello “spingere” la diffusione del GPP, ovvero nel convincere
ed aiutare un Comune nell’adozione di queste strategie

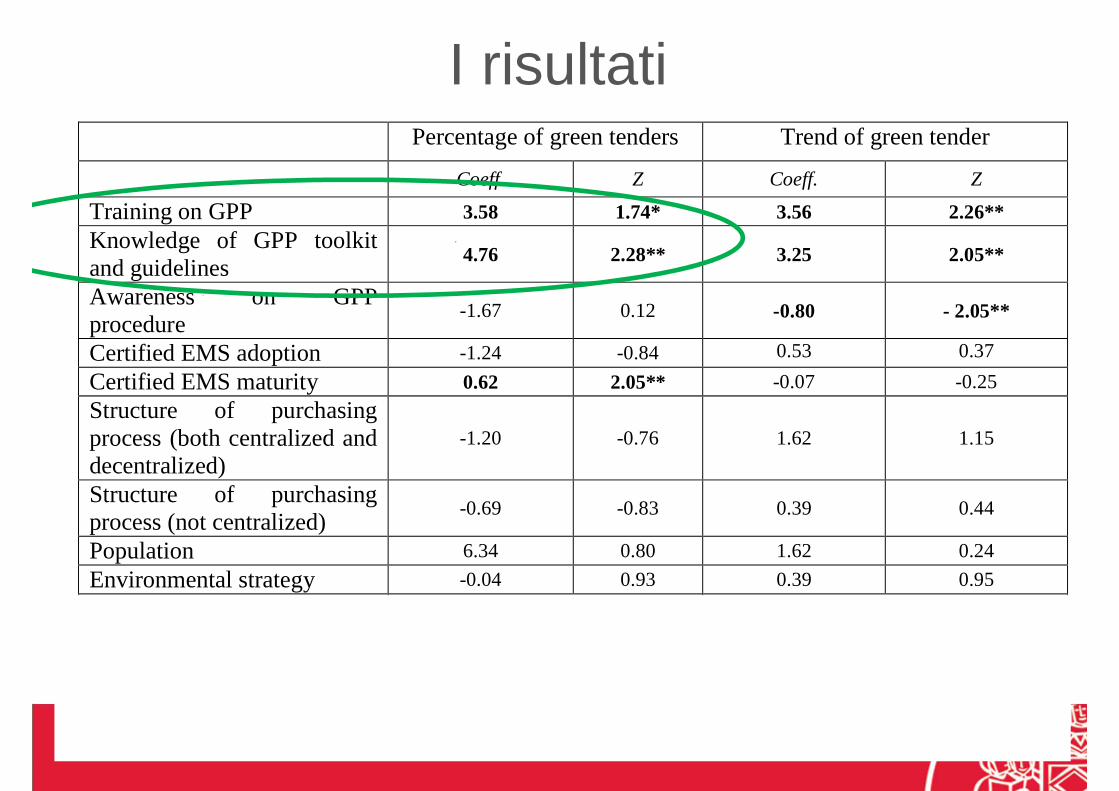
I risultati Percentage of green tenders Trend of green tender
Coeff. Z Coeff. Z
Training on GPP 3.58 1.74* 3.56 2.26**
Knowledge of GPP toolkit and guidelines
4.76 2.28** 3.25 2.05**
Awareness on GPP procedure
-1.67 0.12 -0.80 - 2.05**
Certified EMS adoption -1.24 -0.84 0.53 0.37
Certified EMS maturity 0.62 2.05** -0.07 -0.25
Structure of purchasing process (both centralized and decentralized)
-1.20 -0.76 1.62 1.15
Structure of purchasing process (not centralized)
-0.69 -0.83 0.39 0.44
Population 6.34 0.80 1.62 0.24
Environmental strategy -0.04 0.93 0.39 0.95
N° Observations 44 44
Pseudo R-square 0.361 0.347

3) A study on Life Cycle Costing on behalf of the European Commission DG Environment
Studio Fieschi e Scuola Sant’Anna Istituto di Management
20
The new Directive 2014/24/EU significantly innovates the process oftenders awarding, through assigning a relevant importance to LCC.New contract award criteria have been introduced in Article 67 : “Themost economically advantageous tender from the point of view of thecontracting authority shall be identified on the basis of the price orcost, using a cost-effectiveness approach, such as life cycle costing[…].
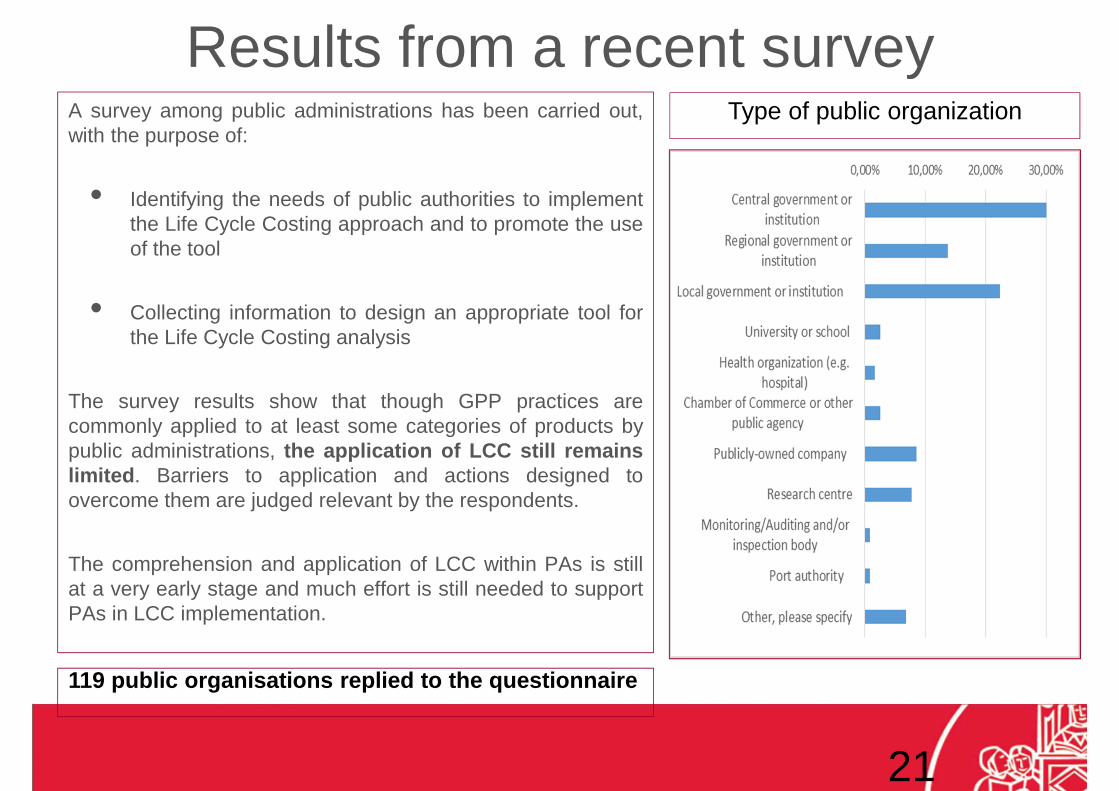
Results from a recent surveyA survey among public administrations has been carried out,with the purpose of:
• Identifying the needs of public authorities to implementthe Life Cycle Costing approach and to promote the useof the tool
• Collecting information to design an appropriate tool forthe Life Cycle Costing analysis
The survey results show that though GPP practices arecommonly applied to at least some categories of products bypublic administrations, the application of LCC still remainslimited. Barriers to application and actions designed toovercome them are judged relevant by the respondents.
The comprehension and application of LCC within PAs is stillat a very early stage and much effort is still needed to supportPAs in LCC implementation.
21
119 public organisations replied to the questionnaire
Type of public organization

Results of LCC survey:Experience of GPP implementation
N. of responses: 118
27,1%
24,6%
33,1%
15,3%
0% 10% 20% 30% 40%
No experience
0-3 years
4-8 years
9 years or more

Results of LCC survey:Level of LCC implementation
43,2%
24,7%
27,2%
4,9%
0% 5% 10% 15% 20% 25% 30% 35% 40% 45% 50%
My PA has never implemented LCC
My PA is planning to implement LCC
My PA has implemented LCC in some classes of products/services
My PA implements LCC regularly
N. of responses: 81
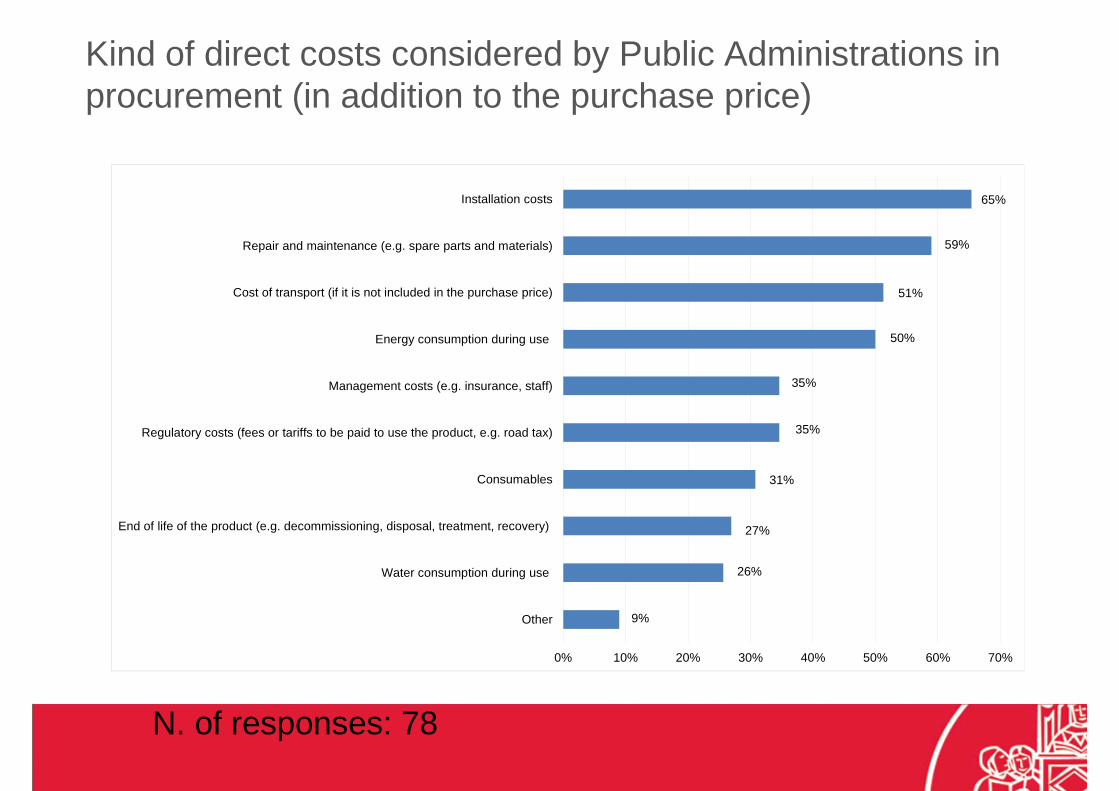
Kind of direct costs considered by Public Administrations in procurement (in addition to the purchase price)
N. of responses: 78
9%
26%
27%
31%
35%
35%
50%
51%
59%
65%
0% 10% 20% 30% 40% 50% 60% 70%
Other
Water consumption during use
End of life of the product (e.g. decommissioning, disposal, treatment, recovery)
Consumables
Regulatory costs (fees or tariffs to be paid to use the product, e.g. road tax)
Management costs (e.g. insurance, staff)
Energy consumption during use
Cost of transport (if it is not included in the purchase price)
Repair and maintenance (e.g. spare parts and materials)
Installation costs

Main barriers to adopting LCC in Public Administrations
31%
18%
22%
38%
34%
30%
18%
23%
29%
45%
38%
37%
35%
24%
39%
29%
33%
41%
13%
19%
31%
17%
20%
14%
27%
25%
20%
6%
14%
8%
9%
14%
15%
19%
13%
5%
5%
10%
3%
1%
8%
3%
6%
6%
5%
0% 10% 20% 30% 40% 50% 60% 70% 80% 90% 100%
Lack of information on costs (internal and external costs)
Lack of financial resources to implement the LCC approach
Lack of support from national and/or EU bodies
Lack or high complexity of tools, guidelines, documents, laws, etc. that supportPA in the implementation of LCC procedures
Lack of human resources in your organization
Lack of competence and knowledge (e.g. to accurately assess and verifyinformation submitted by tenderers in response to criteria; in correctly applying
LCC, etc)
Lack of offers in compliance with cost information requested by the tenders
Lack of reliable data sources for the evaluation of internal costs
Lack of reliable data sources for the evaluation of external costs
5. strongly agree
4. agree
3. undecided
2. disagree
1. strongly disagree

Conclusioni• Mercato in espansione ma è necessario lavorare per incrementare
l’utilizzo di criteri «comprehensive» (in questo senso va il collegato alla legge stabilità, almeno nella versione attuale)
• Il perno su cui si deve fare leva per la diffusione del GPP è senz’altro la formazione del personale delle stazioni appaltanti
• Vi sono variabili che invece hanno poco impatto, da considerare condizioni necessarie ma non sufficienti (es.: consapevolezza, impegno ambientale dell’ente,…)
• La dimensione dell’ente non è importante
• Il tema dei costi sul ciclo di vita e, in particolare, dei costi esterni (i.e. legati alle esternalità ambientali) è senz’altro promettente per il futuro ma oggi molto poco praticato e presenta barriere molto elevate.