presented at duplex 2000, houston, tx, usa, feb 2000 ... · manuscript p2052 presented at duplex...
TRANSCRIPT
Manuscript P2052
Presented at DUPLEX 2000, Houston, TX, USA, Feb 2000
Variation in Mechanical Properties and CorrosionResistance of Different Alloys within the
Generic Designation UNS S32760
G. Byrne, R. Francis & G. Warburton(Weir Materials and Foundries UK)
Abstract
Zeron 100 super duplex stainless steel was first developed in the 1980 s and it wasinvented with a tightly controlled melt chemistry which together with a restricted heattreatment temperature range ensured the optimum combination of mechanicalproperties, corrosion resistance, weldability and hot working characteristics. Whenthe alloy was included in ASTM, ASME, BS, EN, NACE and other standards, Zeron100 data was submitted whilst the alloy was eventually listed under the UNS S32760designation. UNS S32760 however, has a much wider range of chemical compositionthan Zeron 100. During the 1990 s this grade of super duplex stainless steel becamevery popular with the oil and gas industry for both sea water and process systems.This commercial demand has resulted in the S32760 grade being offered by anincreasing number of alloy producers. However, the pressure to minimise productioncosts has resulted in some manufacturers pushing the composition to the limitspermitted by the UNS specification. This can give unusual combinations of analysisand shows a lack of fundamental understanding of the required control in compositionand thermo-mechanical processing.
For example, nickel levels have been reduced and nitrogen contents have beenincreased, together with hot working and final heat treatment disciplines that arevariable. These variables are not directly apparent from material certification. Thereare many examples of the problems that this causes, where commercial heats ofS32760 exhibit worse than expected properties. The paper describes a series oflaboratory tests on several commercial heats of S32760 to illustrate this point.
One effect which can result is the precipitation of nitrides. In an attempt tounderstand the effects of the poor control on precipitation behaviour an arbitrarynitirdes scale was developed which assigned a number from 0 to 3 based on anexamination of a large number of fields on a microsection. Evaluation of impacttoughness showed a sharp reduction in toughness with increasing nitride content.Corrosion tests also showed a substantial reduction in corrosion resistance withincreasing nitride content.
These effects are discussed in the context of industry using material that does notmeet the properties that were submitted originally to enter the grade into internationalstandards.

- 2 -
1. Introduction
The first widely available super duplex stainless steel was developed byGradwell and co workers (ref 1) in the mid 1980 s. This alloy was calledZeron 100 ® and was developed as a casting alloy for pump applications inthe oil and gas industry. The performance of the steel in this applicationgenerated a demand for Zeron 100 in wrought product forms also. Thisdemand was serviced by Weir who, together with other Europeanmanufacturers, developed the manufacturing procedures required to obtain thedesired quality of product.
As demand for the steel grew, clients called for ASTM, NACE, BritishStandards and other codes to include and cover the Zeron range of products.Moreover, with the introduction of the EC Procurement Directive in 1993, itbecame illegal for clients to specify any trade name in requests for quotationand a generic description for Zeron 100 was required for the business tocontinue.
In 1993 - 94 ASTM considered the properties of several heats of Zeron 100 ina range of product forms and on the basis of this designated the code UNSS32760 to the alloy and introduced this number into several standards.
In 1994 UNS S32760 was included in NACE MR0175, again based upon theperformance and properties of Zeron 100. Finally in 1997 UNS S32760 waslisted in ASME complete with applicable design stresses. These were againbased upon the properties of Zeron 100.
Subsequently, other steelmakers began to manufacture UNS S32760 and tooffer this grade to the market. During the period of manufacture anddeployment of these steels it became apparent that the properties andperformance normally expected was not always realised. The propertieswhich began to deteriorate included elevated temperature tensile properties,low temperature toughness properties and, in Norway, performance in ferricchloride (ASTM G48 Method A) at 50°C. Similar behaviour was also beingexperienced by UNS S32750, which is also a super duplex stainless steel. Thevariation in performance seemed intermittent and ad-hoc. This behaviour hasnever, to our knowledge, been systematically researched because it was oftenencountered on a production basis and was accepted or rejected on the strengthof engineering critical assessment and the problem was generally neverrevisited.
This paper details the results of an exercise where UNS S32760 bar product, toASTM A276, was sourced from the market and tested.

- 3 -
Whilst all the material sourced complied with the UNS S32760 specificationrange in all respects, its performance in corrosion tests and also, in Charpyimpact tests, was highly variable.
However, whilst these products generally met normal oil industry specificationrequirements, the margins by which the product exceeded the acceptancerequirements were, in some cases, minimal. Moreover, when properties likeresistance to hydrogen embrittlement was examined (which is not normally aprescribed requirement in specifications, but rather, it is assumed that ifspecification requirements are met then an acceptable resistance to hydrogenembrittlement would be attained) it was found that this did not always give theexpected results.
2. Materials
A range of suppliers were sourced and bar products purchased. The size of thebars and the chemical analysis provided with the material certificates is givenin Table 1.
Further chemical analysis using spectrographic standards calibrated withrespect to 25% chrome super duplex alloys is given in Table 2.
These casts were selected for evaluation because of the range ofmicrostructure that they exhibited in so far as the nitride content wasconcerned. Photomicrographs are shown in Figures 1 to 3 and the results ofquantitative metallography carried out to further characterise the structures aregiven in Table 3.
3. Experimental Method
The following equipment, techniques and standards were employed in theevaluation.
3.1 Metallography
All the samples cut for metallography were large (typically 10-15 cm2)to show as wide a variation in the microstructure as possible.
Transverse samples of each bar were cut, polished to 1 m diamondfinish and double etched electrolytically in oxalic acid followed bypotassium hydroxide. The samples were typically etched at 3.5V, 0.3Afor 5-10 seconds in oxalic acid and 1 to 2 seconds in potassiumhydroxide at the same settings.
The phase balance was measured on 10 fields using an image analysistechnique with a typical error of + 5%.
- 4 -
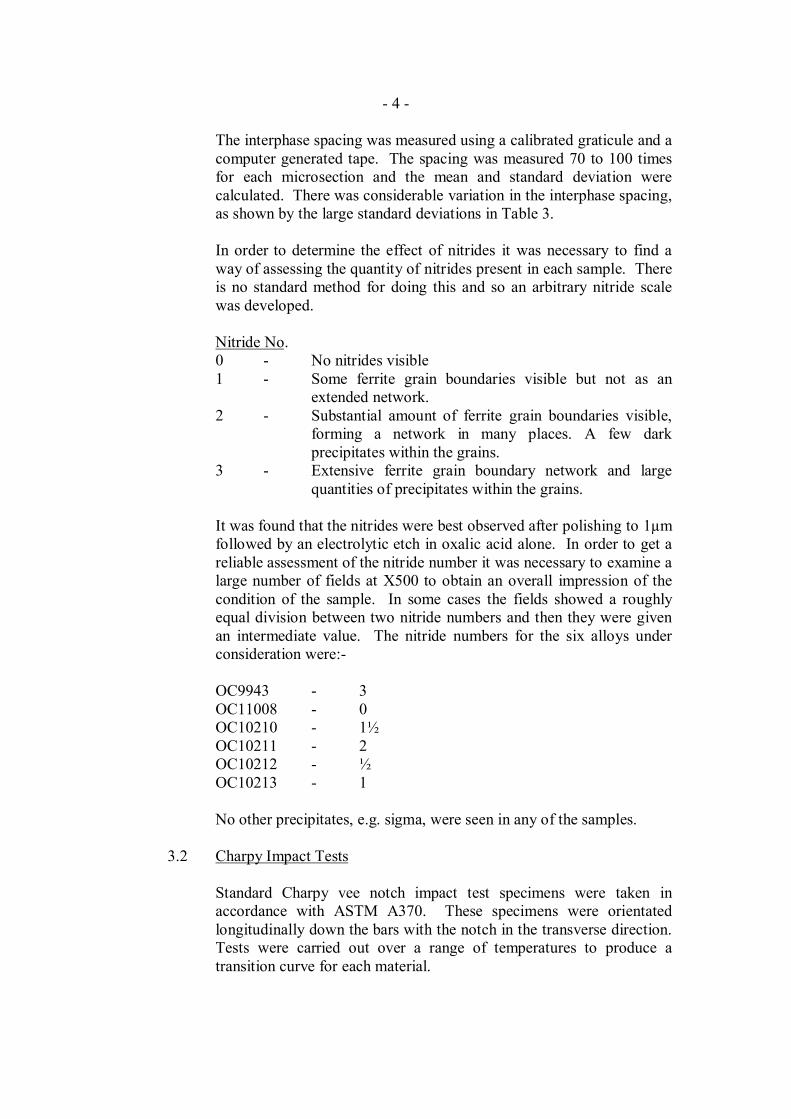
The interphase spacing was measured using a calibrated graticule and acomputer generated tape. The spacing was measured 70 to 100 timesfor each microsection and the mean and standard deviation werecalculated. There was considerable variation in the interphase spacing,as shown by the large standard deviations in Table 3.
In order to determine the effect of nitrides it was necessary to find away of assessing the quantity of nitrides present in each sample. Thereis no standard method for doing this and so an arbitrary nitride scalewas developed.
Nitride No.0 - No nitrides visible1 - Some ferrite grain boundaries visible but not as an
extended network.2 - Substantial amount of ferrite grain boundaries visible,
forming a network in many places. A few darkprecipitates within the grains.
3 - Extensive ferrite grain boundary network and largequantities of precipitates within the grains.
It was found that the nitrides were best observed after polishing to 1µmfollowed by an electrolytic etch in oxalic acid alone. In order to get areliable assessment of the nitride number it was necessary to examine alarge number of fields at X500 to obtain an overall impression of thecondition of the sample. In some cases the fields showed a roughlyequal division between two nitride numbers and then they were givenan intermediate value. The nitride numbers for the six alloys underconsideration were:-
OC9943 - 3OC11008 - 0OC10210 - 1½OC10211 - 2OC10212 - ½OC10213 - 1
No other precipitates, e.g. sigma, were seen in any of the samples.
3.2 Charpy Impact Tests
Standard Charpy vee notch impact test specimens were taken inaccordance with ASTM A370. These specimens were orientatedlongitudinally down the bars with the notch in the transverse direction.Tests were carried out over a range of temperatures to produce atransition curve for each material.

- 5 -
3.3 Corrosion Tests
Two corrosion tests were carried out, the first of which was a criticalpitting temperature (CPT) test in 10% hydrated ferric chloride solution(ASTM G48). The sample faces were prepared to 120 grit and thesharp edges were bevelled. The samples were exposed initially for 24hours at 50°C and then removed, washed, dried and weighed. If nosignificant weight loss was observed the samples were tested for afurther 24 hours at 5°C greater temperature, and so on until pittingoccurred.
Sample OC9943 failed at 50°C and so a further test was conductedwith this material starting at 40°C. All alloys were tested in duplicate.
The critical pitting temperature (CPT) at +600 mV SCE in syntheticsea water was also determined. This potential was chosen because it istypical of that observed for high alloyed stainless steels in chlorinatedsea water.
In this test the sample is polarised to +600 mV SCE over 30 minutes at20°C and the current is allowed to stabilise for one hour. Thetemperature is then increased at 5°C/hour until a large increase in thecurrent density shows that pitting has initiated. The CPT is thattemperature at which the current density reaches 10µA/cm2.
3.4 Hydrogen Embrittlement Tests
Slow strain rate tests were conducted at a strain rate of 1 x 10⁻⁶/sec tocompare the resistance to hydrogen embrittlement. Tensile specimenswere machined in the direction of rolling of the bar i.e. longitudinally,with a gauge length of 30mm and a cross sectional area of 30mm2.
One sample was tested at ambient temperature in air, while a secondwas placed in a cell containing synthetic sea water and polarised to-1.04 V SCE. The sea water was deaerated and 5mg/l sulphide wasadded as sodium sulphide solution, adjusted to pH8, to poison thehydrogen recombination reaction. The loss of ducticity resulting fromhydrogen charging was evaluated using the plastic strain ratio, asdescribed in EFC publication No. 17.
In addition two alloys were tested at a series of constant loads, whilepolarised to 1.04 V SCE in sea water to determine the thresholdstress. This test method is very time consuming and so only testsrepresenting no nitride precipitates and a high level of nitrideprecipitates (level 3) were chosen (OC11008 and OC9943respectively). Samples which had not failed after 14 days wereremoved for examination.

- 6 -
4. Results and Discussion
4.1 Chemical Analysis
Comparison of the chemical analysis given on test certificationcompared with the results from analysis against calibrated standards(Tables 1 and 2) showed, for the alloys supplied, that test certificatesgenerally overestimated the level of nickel in the steel andunderestimated the nitrogen content. This gives a Ni/N ratio which isartificially high, and the smaller the Ni/N ratio, the greater thetendency for nitride precipitation would be expected to be.
4.2 Microstructures
All the samples exhibited a duplex structure with grains elongated inthe rolling direction of the bar. The samples differed in the extent anddegree of nitride precipitate and level of reformed austenite (reformedaustenite can be identified by its Widmanstätten type appearanceand/or because unlike the primary austenite and ferrite, it is notelongated in the rolling direction of the bar. Where the level of nitrideprecipitate is high, this then corresponds to a lack of reformed austeniteand therefore a larger interphase spacing as shown in Table 3 andFigures 1 to 3).
The phase balance of the samples varied between 44 and 57% ferrite(i.e. 50% + 7%). Figure 4 is a graph of phase balance plotted againstnitride number. This graph shows no clear trend between the variablesexcept perhaps that overall ferrite contents increase with increasingnitride number. This behaviour can be reconciled if it is understoodthat nitrogen in solid solution promotes austenite formation.Therefore, when nitrogen is tied up in the form of a nitride its influenceas an austenite forming element is lost. However, the range of ferritecontents measured in these bars is quite narrow and well within normalspecification requirements.
4.3 Charpy Impact Behaviour
Figure 5 shows the Charpy impact energy achieved at 46°C. Sincethese alloys are often used in heavy wall thickness, for componentscarrying fluids at high temperature and pressure, the possibility ofsudden depressurisation and chilling of the component down totemperatures of the order of 40°C and below exists.
Hence, the material must have sufficient toughness to resist fractureand leak before it breaks. For duplex stainless steels, most specificationrequirements call for impact energy requirements in the range 40 to 70joules as an average of three samples.
- 7 -
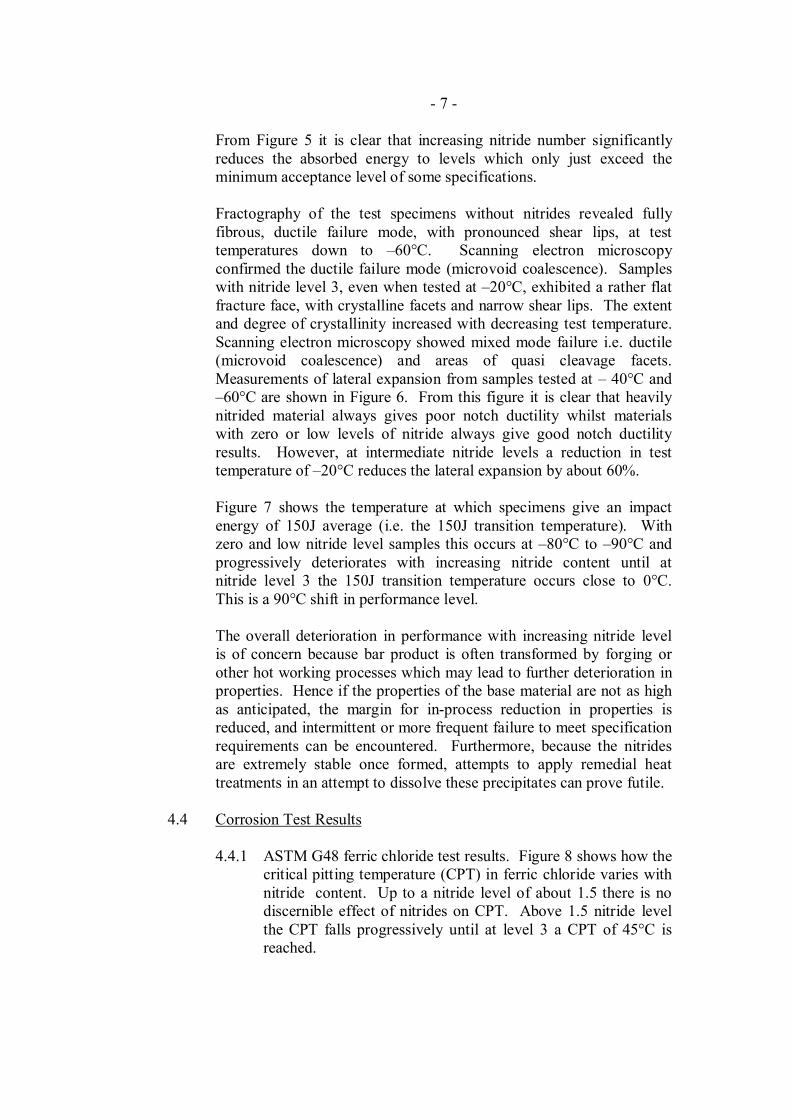
From Figure 5 it is clear that increasing nitride number significantlyreduces the absorbed energy to levels which only just exceed theminimum acceptance level of some specifications.
Fractography of the test specimens without nitrides revealed fullyfibrous, ductile failure mode, with pronounced shear lips, at testtemperatures down to 60°C. Scanning electron microscopyconfirmed the ductile failure mode (microvoid coalescence). Sampleswith nitride level 3, even when tested at 20°C, exhibited a rather flatfracture face, with crystalline facets and narrow shear lips. The extentand degree of crystallinity increased with decreasing test temperature.Scanning electron microscopy showed mixed mode failure i.e. ductile(microvoid coalescence) and areas of quasi cleavage facets.Measurements of lateral expansion from samples tested at 40°C and60°C are shown in Figure 6. From this figure it is clear that heavily
nitrided material always gives poor notch ductility whilst materialswith zero or low levels of nitride always give good notch ductilityresults. However, at intermediate nitride levels a reduction in testtemperature of 20°C reduces the lateral expansion by about 60%.
Figure 7 shows the temperature at which specimens give an impactenergy of 150J average (i.e. the 150J transition temperature). Withzero and low nitride level samples this occurs at 80°C to 90°C andprogressively deteriorates with increasing nitride content until atnitride level 3 the 150J transition temperature occurs close to 0°C.This is a 90°C shift in performance level.
The overall deterioration in performance with increasing nitride levelis of concern because bar product is often transformed by forging orother hot working processes which may lead to further deterioration inproperties. Hence if the properties of the base material are not as highas anticipated, the margin for in-process reduction in properties isreduced, and intermittent or more frequent failure to meet specificationrequirements can be encountered. Furthermore, because the nitridesare extremely stable once formed, attempts to apply remedial heattreatments in an attempt to dissolve these precipitates can prove futile.
4.4 Corrosion Test Results
4.4.1 ASTM G48 ferric chloride test results. Figure 8 shows how thecritical pitting temperature (CPT) in ferric chloride varies withnitride content. Up to a nitride level of about 1.5 there is nodiscernible effect of nitrides on CPT. Above 1.5 nitride levelthe CPT falls progressively until at level 3 a CPT of 45°C isreached.
- 8 -
The significance of the 45°C CPT is that in the UKspecifications call for no pitting at 40°C in ferric chloride,whilst in Norway, Norsok standards require a 50°C CPT. Thismeans that nitride level 3 materials would be accepted for anoffshore development on the UK continental shelf but would beunacceptable in the Norwegian sector.
Figure 9 shows a microsection through a ferric chloride testsample. Corrosion can be seen to initiate at nitride precipitateswithin ferrite grains.
4.4.2 CPT evaluations in synthetic sea water mirror the behaviour inferric chloride as shown in Figure 10. The lowest CPTachieved was 62°C at nitride level 3. This temperature issignificantly higher than that at which most chlorinatedseawater systems operate on offshore platforms. However, it isknown (ref 2) that short and long term temperature transientsexceeding 68°C can occur. In these circumstances it is clearthat nitride level 3 material would probably have sufferedcrevice corrosion where field experience has shown that primequality material is able to tolerate these conditions withoutcorrosion attack (ref 3).
4.5 Resistance to Hydrogen Embrittlement
Previous work in this area by Weir (Ref 4), our competitors (Ref 5)and independent university research (Ref 6) have all shown thatthreshold stresses for the onset of hydrogen embrittlement as aconsequence of cathodic protection of super duplex stainless steels isof the order of the specified minimum UTS of the material (750 MPa).Work on nitride level 3 material has shown that this threshold stress isreduced to the yield strength of the material (580 MPa) as shown inFigure 11. This unexpected reduction in performance is attributed tothe presence of nitrides. Recent experience in the North Sea (ref 7) hashighlighted the unexpected failure of large super duplex stainless steelforgings due to hydrogen embrittlement as a consequence of cathodicprotection. Many factors were implicated, such as poor or noinsulation coating, cathodic overprotection, poor design, machiningacross the grain flow within the forging presenting a longitudinalrather than a transverse grain flow to the environment and also,critically, the presence of high applied and residual stresses within thestructure. However, it is also true that the forgings contained nitridesand that these may have played some role in the problem.
Slow strain rate investigations have shown that the plastic strain ratiofalls from 60% to 20% as nitride contents go from 0 to level 3, asshown in Figure 12 i.e. a 40% loss in performance level.
- 9 -
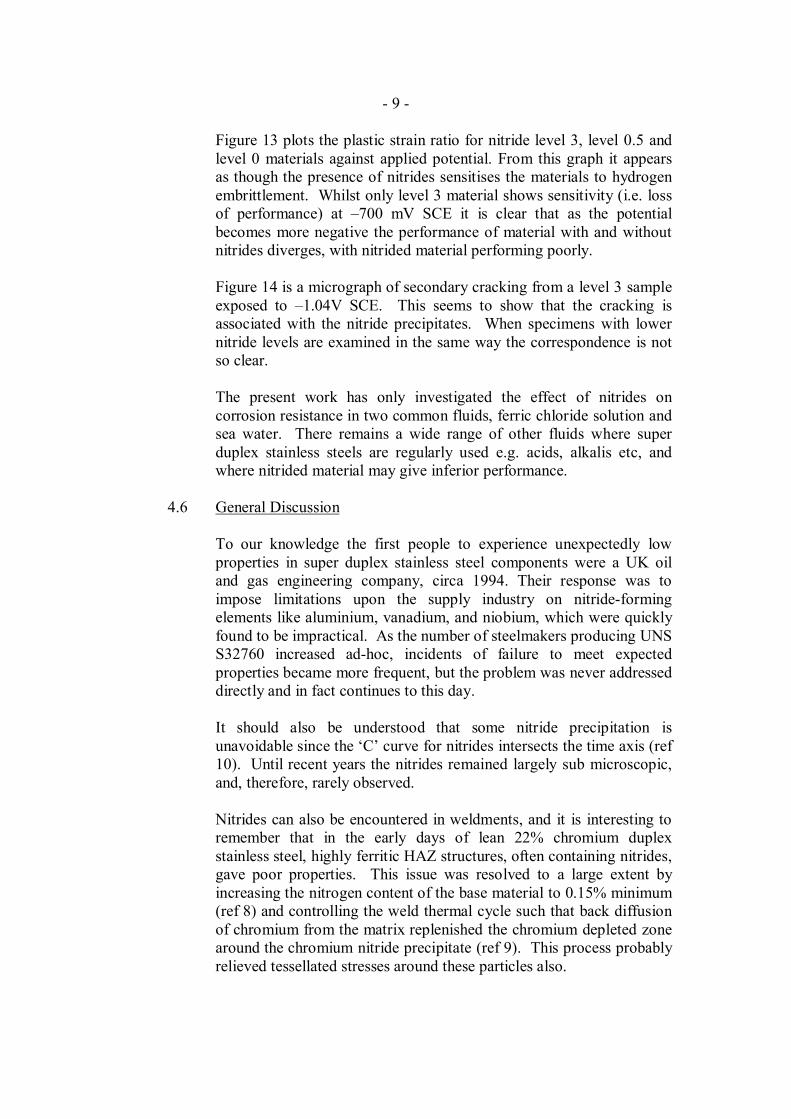
Figure 13 plots the plastic strain ratio for nitride level 3, level 0.5 andlevel 0 materials against applied potential. From this graph it appearsas though the presence of nitrides sensitises the materials to hydrogenembrittlement. Whilst only level 3 material shows sensitivity (i.e. lossof performance) at 700 mV SCE it is clear that as the potentialbecomes more negative the performance of material with and withoutnitrides diverges, with nitrided material performing poorly.
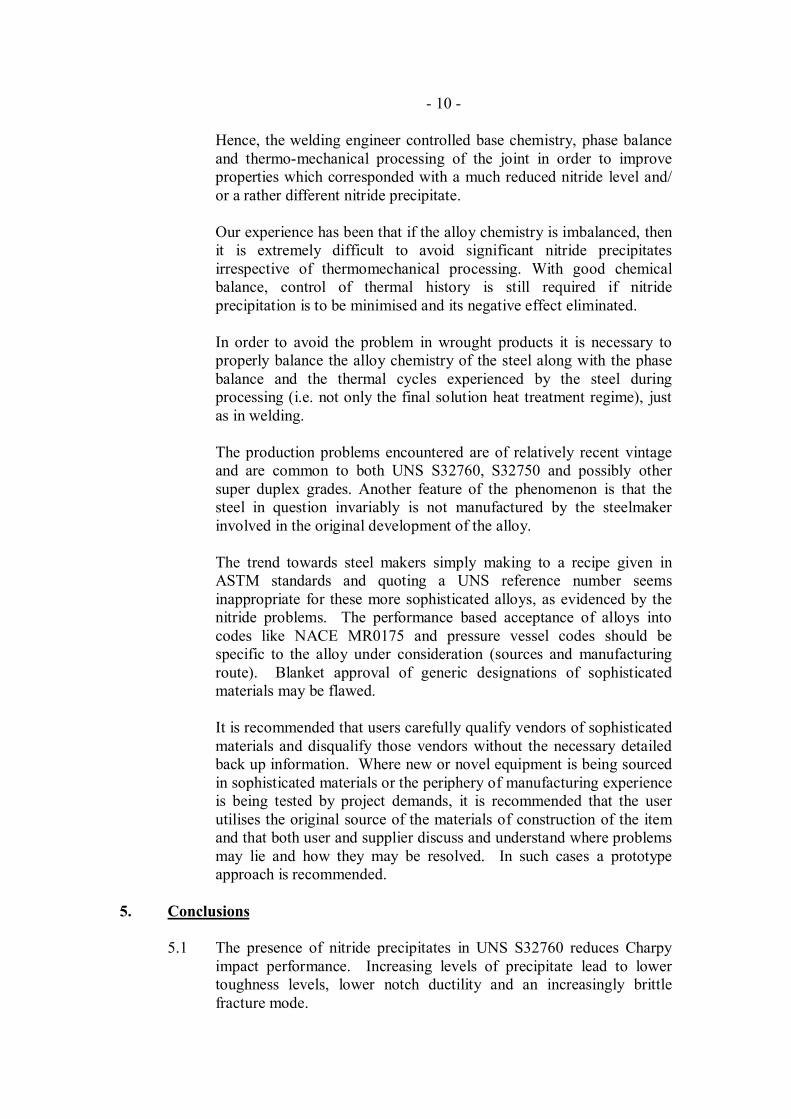
Figure 14 is a micrograph of secondary cracking from a level 3 sampleexposed to 1.04V SCE. This seems to show that the cracking isassociated with the nitride precipitates. When specimens with lowernitride levels are examined in the same way the correspondence is notso clear.
The present work has only investigated the effect of nitrides oncorrosion resistance in two common fluids, ferric chloride solution andsea water. There remains a wide range of other fluids where superduplex stainless steels are regularly used e.g. acids, alkalis etc, andwhere nitrided material may give inferior performance.
4.6 General Discussion
To our knowledge the first people to experience unexpectedly lowproperties in super duplex stainless steel components were a UK oiland gas engineering company, circa 1994. Their response was toimpose limitations upon the supply industry on nitride-formingelements like aluminium, vanadium, and niobium, which were quicklyfound to be impractical. As the number of steelmakers producing UNSS32760 increased ad-hoc, incidents of failure to meet expectedproperties became more frequent, but the problem was never addresseddirectly and in fact continues to this day.
It should also be understood that some nitride precipitation isunavoidable since the C curve for nitrides intersects the time axis (ref10). Until recent years the nitrides remained largely sub microscopic,and, therefore, rarely observed.
Nitrides can also be encountered in weldments, and it is interesting toremember that in the early days of lean 22% chromium duplexstainless steel, highly ferritic HAZ structures, often containing nitrides,gave poor properties. This issue was resolved to a large extent byincreasing the nitrogen content of the base material to 0.15% minimum(ref 8) and controlling the weld thermal cycle such that back diffusionof chromium from the matrix replenished the chromium depleted zonearound the chromium nitride precipitate (ref 9). This process probablyrelieved tessellated stresses around these particles also.
- 10 -
Hence, the welding engineer controlled base chemistry, phase balanceand thermo-mechanical processing of the joint in order to improveproperties which corresponded with a much reduced nitride level and/or a rather different nitride precipitate.
Our experience has been that if the alloy chemistry is imbalanced, thenit is extremely difficult to avoid significant nitride precipitatesirrespective of thermomechanical processing. With good chemicalbalance, control of thermal history is still required if nitrideprecipitation is to be minimised and its negative effect eliminated.
In order to avoid the problem in wrought products it is necessary toproperly balance the alloy chemistry of the steel along with the phasebalance and the thermal cycles experienced by the steel duringprocessing (i.e. not only the final solution heat treatment regime), justas in welding.
The production problems encountered are of relatively recent vintageand are common to both UNS S32760, S32750 and possibly othersuper duplex grades. Another feature of the phenomenon is that thesteel in question invariably is not manufactured by the steelmakerinvolved in the original development of the alloy.
The trend towards steel makers simply making to a recipe given inASTM standards and quoting a UNS reference number seemsinappropriate for these more sophisticated alloys, as evidenced by thenitride problems. The performance based acceptance of alloys intocodes like NACE MR0175 and pressure vessel codes should bespecific to the alloy under consideration (sources and manufacturingroute). Blanket approval of generic designations of sophisticatedmaterials may be flawed.
It is recommended that users carefully qualify vendors of sophisticatedmaterials and disqualify those vendors without the necessary detailedback up information. Where new or novel equipment is being sourcedin sophisticated materials or the periphery of manufacturing experienceis being tested by project demands, it is recommended that the userutilises the original source of the materials of construction of the itemand that both user and supplier discuss and understand where problemsmay lie and how they may be resolved. In such cases a prototypeapproach is recommended.
5. Conclusions
5.1 The presence of nitride precipitates in UNS S32760 reduces Charpyimpact performance. Increasing levels of precipitate lead to lowertoughness levels, lower notch ductility and an increasingly brittlefracture mode.
- 11 -
Differences in performance between material containing nitrideprecipitates and that without nitride precipitates become enhanced atlower test temperatures.
5.2 Corrosion resistance in ferric chloride and also in synthetic sea water,as demonstrated by critical pitting temperature measurements, does notdeteriorate until significant levels of nitride precipitates are present.Both environments showed the same trend in behaviour. Nodeterioration in performance was observed until nitride level 1.5 hadbeen exceeded and then a significant fall in CPT was measured.
5.3 Nitride precipitates reduce the resistance of the material to hydrogenembrittlement. This is demonstrated in the form of reduced thresholdstresses for the onset of cracking from 750 MPa to 580 MPa and alsoin slow strain rate testing by a reduction in the plastic strain ratio. Inthese tests a 40% deterioration in performance was measured at apotential of 1.04V SCE.
5.4 Since normal specification properties were met at all nitride levels, itcannot be assumed that this necessarily implies that other propertiesare as expected. This is evidenced by the lower than expectedresistance to hydrogen embrittlement in these tests.
5.5 This phenomenon is common to UNS S32760 and UNS S32750 (andprobably other super duplex grades).
The problem has gradually become apparent over recent years andrelates to supply from steelmakers not involved in the originaldevelopment of the alloys and who are supplying to the generic UNSdesignation rather than to their own developed and researched analysisand thermal history.
- 12 -
REFENCES.
1. K.J. Gradwell and CV Roscoe. Paper 34Duplex Stainless Steel 86The Hague, Holland. Oct. 1986. Page 126
2. R. Johnsen and S Olsen. Paper 397Corrosion 92. Nashville, TN, USA. March 1992. NACE
3. R. Francis, G Byrne and G WarburtonSea Water Corrosion of Stainless Steels Mechanisms and Experiences.EFC publication No. 19. p133, Publd by IOM
4. R Francis, G Byrne and G.R. Warburton Corrosion 53, 3 (1997) 234.
5. P.Olsson, A. Delblanc Bauer and H ErikssonDuplex Stainless Steels 97Maastricht, Holland. Oct 1997, page 607, publd by KCI.
6. J.R. Valdez Vellejo Ph. D ThesisUniversity of Manchester 1990
7. T.S. Taylor, T Pendlington and R BirdPaper 10965, Offshore Technology Conference, Houston, TX USA. May1999, OTC.
8. E Alfonsson and R QvarfortDuplex Stainless Steels 91, Beaune, France. Oct 1991. Page 839. Les ditionsde physique.
9. B. Lundqvist, P Norberg and K OlssonPaper 10, Duplex Stainless Steels 86.The Hague, Holland, Oct 1986, page 16
10. H.D. Solomon and T DevineDuplex Stainless Steels 82. St Louis, USA.Oct. 1982. Page 693.

TABLE 1. Composition of samples taken from mill certificates.
COMPOSITION (Wt%)OCNO.
BARDIA.
C Cr Ni Mo Cu W N Si Mn P S
PREN*
9943 160mm 0.023 25.6 6.95 3.57 0.59 0.67 0.23 0.38 0.67 0.028 0.000 41.0
11008 0.5 0.017 25.34 7.02 3.56 0.66 0.53 0.23 0.16 0.48 0.030 0.001 40.8
10210 4.5 0.019 25.20 6.73 3.38 0.60 0.60 0.25 0.44 0.59 0.025 0.001 40.4
10211 160mm 0.020 25.42 7.05 3.60 0.74 0.69 0.25 0.36 0.50 0.022 0.000 41.3
10212 4.5 0.016 25.22 7.12 3.60 0.56 0.58 0.21 0.26 0.47 0.023 0.001 40.5
10213 4.5 0.024 25.38 7.06 3.52 0.64 0.63 0.21 0.29 0.61 0.029 0.001 40.3
* PREN = % Cr + 3.3% Mo + 16% N
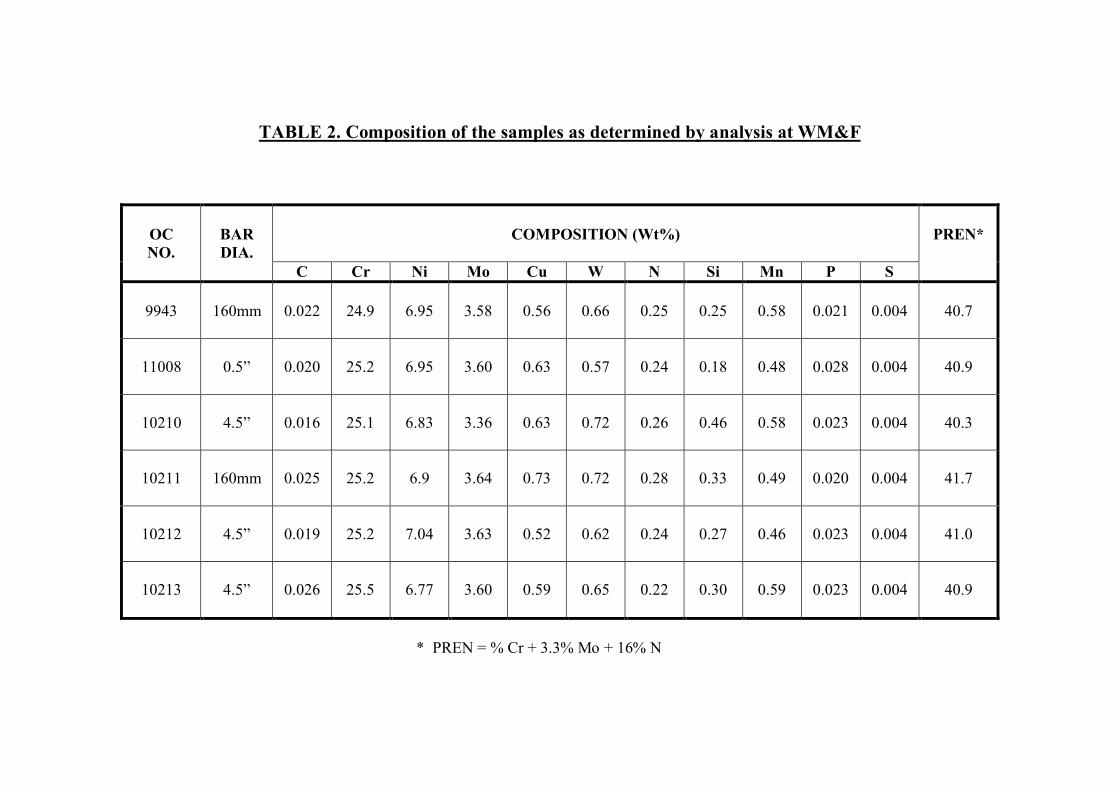
TABLE 2. Composition of the samples as determined by analysis at WM&F
COMPOSITION (Wt%)OCNO.
BARDIA.
C Cr Ni Mo Cu W N Si Mn P S
PREN*
9943 160mm 0.022 24.9 6.95 3.58 0.56 0.66 0.25 0.25 0.58 0.021 0.004 40.7
11008 0.5 0.020 25.2 6.95 3.60 0.63 0.57 0.24 0.18 0.48 0.028 0.004 40.9
10210 4.5 0.016 25.1 6.83 3.36 0.63 0.72 0.26 0.46 0.58 0.023 0.004 40.3
10211 160mm 0.025 25.2 6.9 3.64 0.73 0.72 0.28 0.33 0.49 0.020 0.004 41.7
10212 4.5 0.019 25.2 7.04 3.63 0.52 0.62 0.24 0.27 0.46 0.023 0.004 41.0
10213 4.5 0.026 25.5 6.77 3.60 0.59 0.65 0.22 0.30 0.59 0.023 0.004 40.9
* PREN = % Cr + 3.3% Mo + 16% N
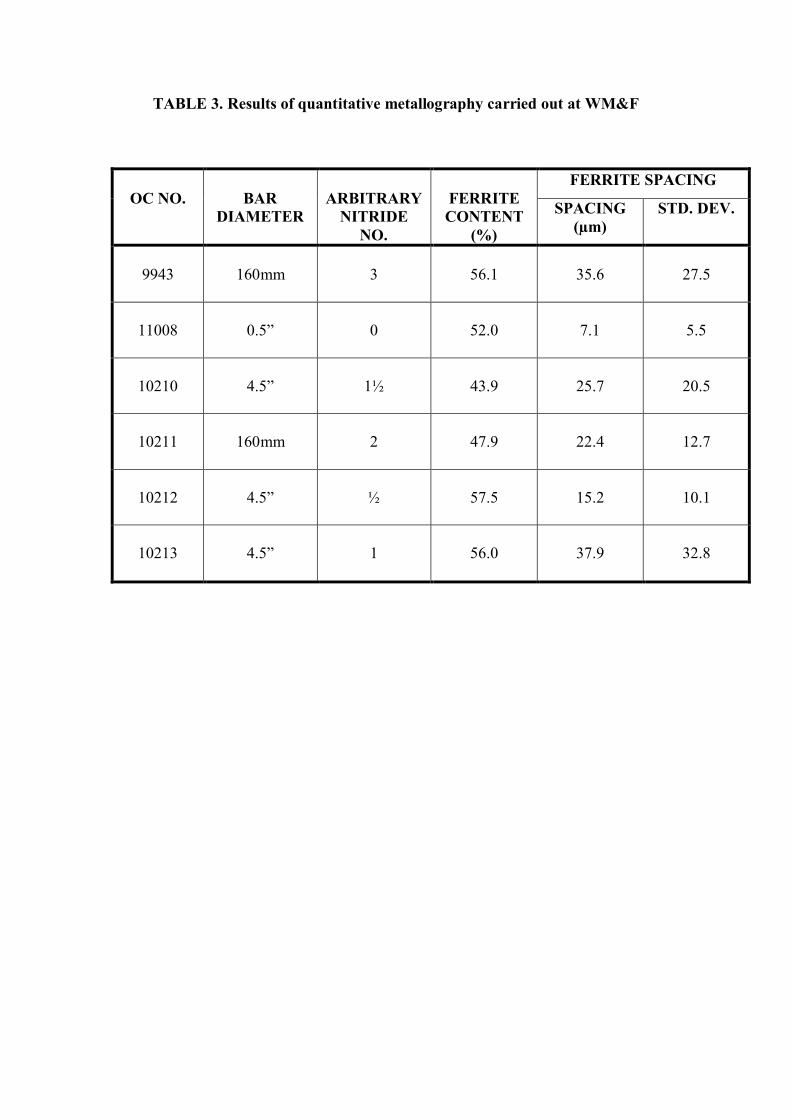
TABLE 3. Results of quantitative metallography carried out at WM&F
FERRITE SPACINGOC NO. BAR
DIAMETERARBITRARY
NITRIDENO.
FERRITECONTENT
(%)
SPACING(µm)
STD. DEV.
9943 160mm 3 56.1 35.6 27.5
11008 0.5 0 52.0 7.1 5.5
10210 4.5 1½ 43.9 25.7 20.5
10211 160mm 2 47.9 22.4 12.7
10212 4.5 ½ 57.5 15.2 10.1
10213 4.5 1 56.0 37.9 32.8

FIGURE 1 A typical microsection of sample OC11008 (nitride number 0) [X500]
FIGURE 2 A typical microsection of sample OC10210 (nitride number 1.5) [X500]
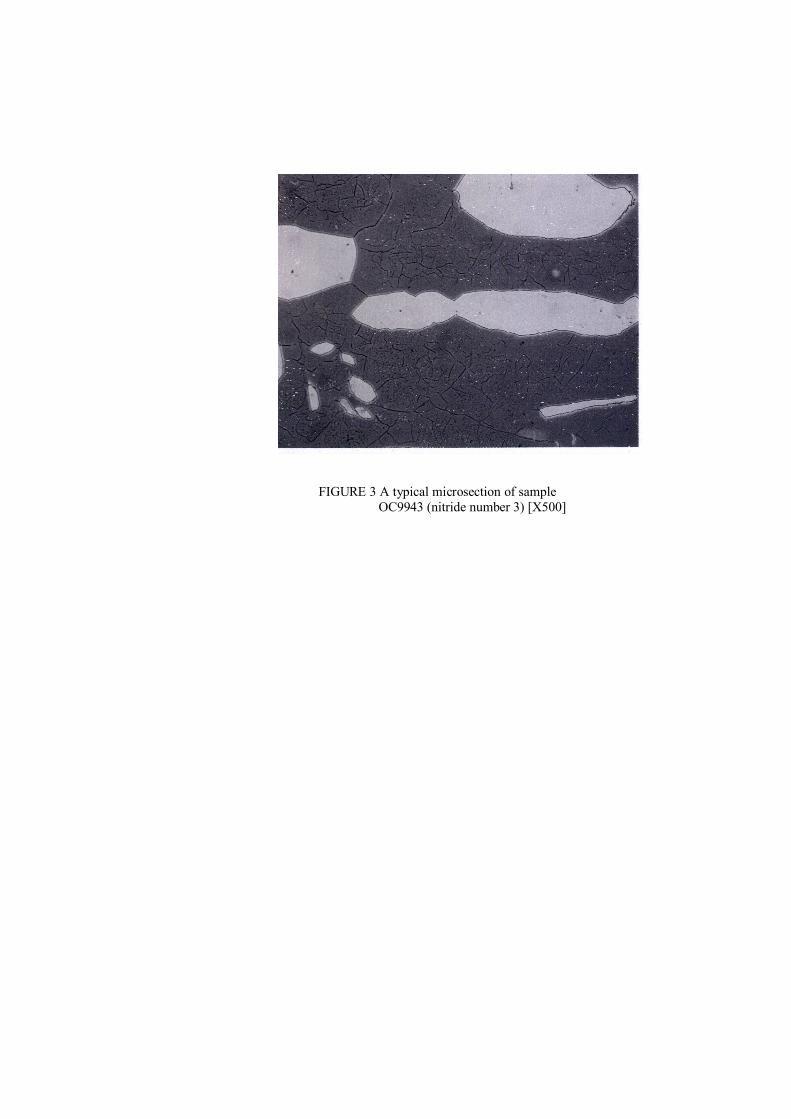
FIGURE 3 A typical microsection of sample OC9943 (nitride number 3) [X500]

FIGURE 4 Phase balance versus nitridenumber
40
45
50
55
60
0 0.5 1 1.5 2 2.5 3 3.5
Nitride Number
Ferr
ite C
onte
nt (%
)
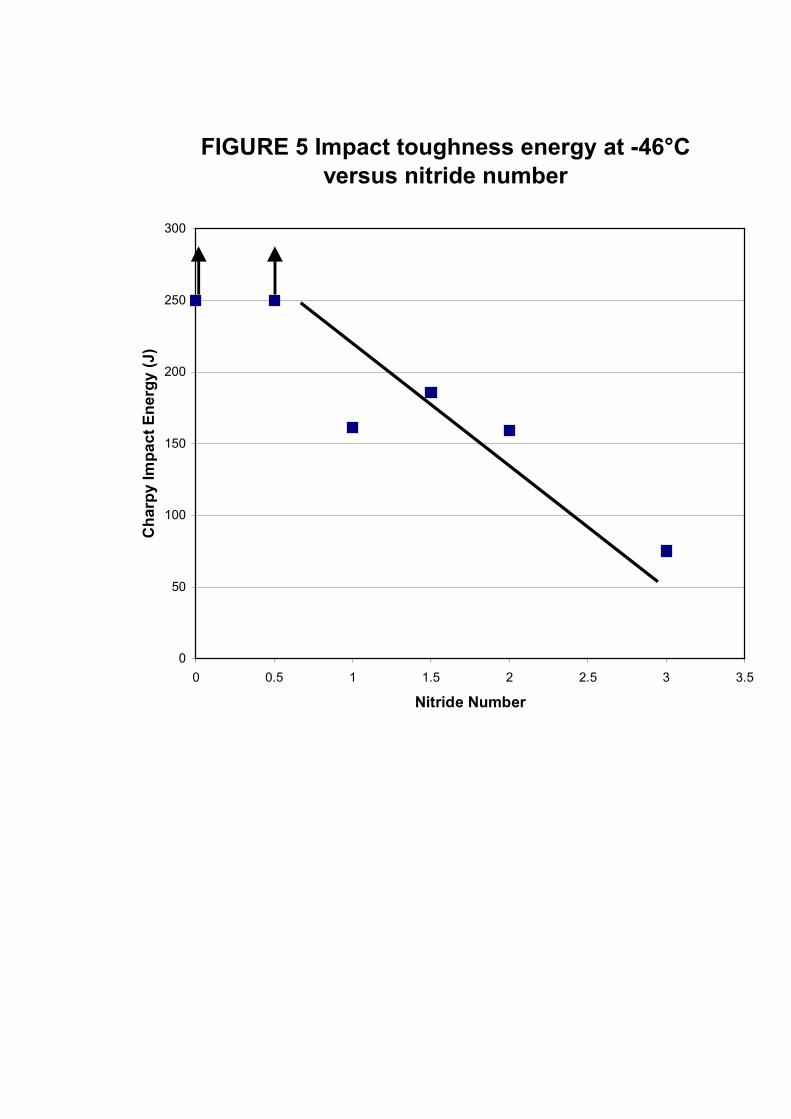
FIGURE 5 Impact toughness energy at -46°Cversus nitride number
0
50
100
150
200
250
300
0 0.5 1 1.5 2 2.5 3 3.5
Nitride Number
Cha
rpy
Impa
ct E
nerg
y (J
)
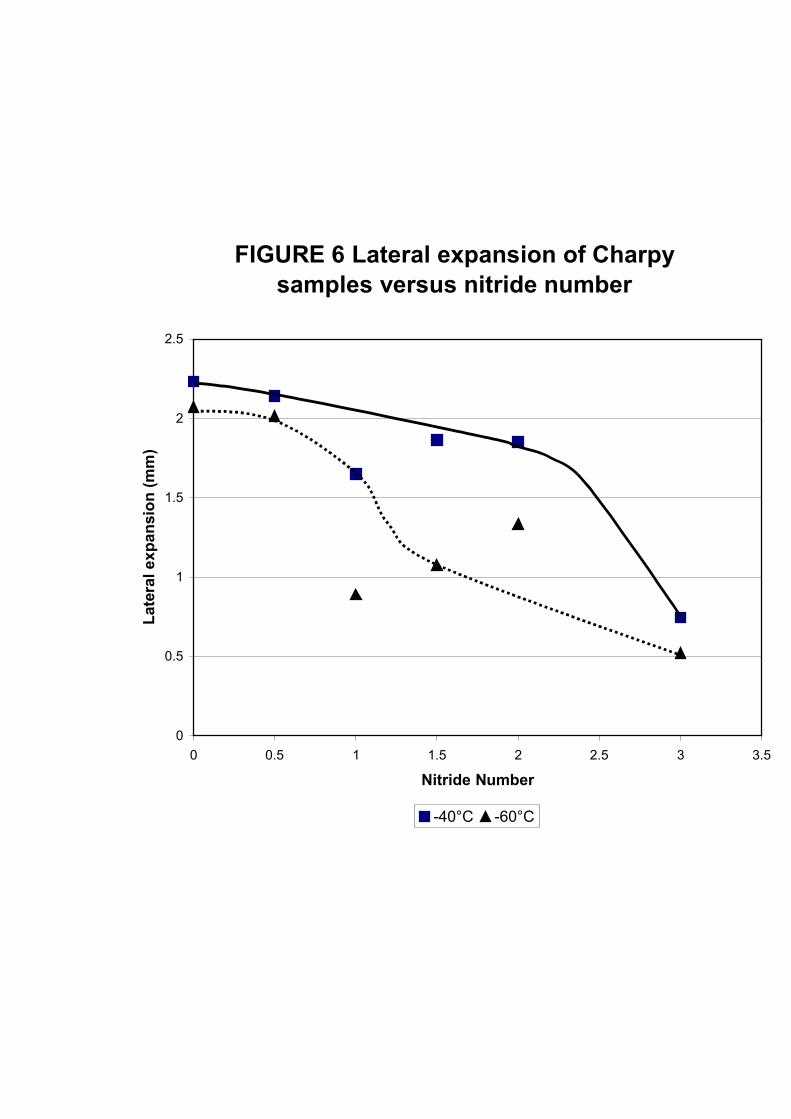
FIGURE 6 Lateral expansion of Charpysamples versus nitride number
0
0.5
1
1.5
2
2.5
0 0.5 1 1.5 2 2.5 3 3.5
Nitride Number
Late
ral e
xpan
sion
(mm
)
-40°C -60°C
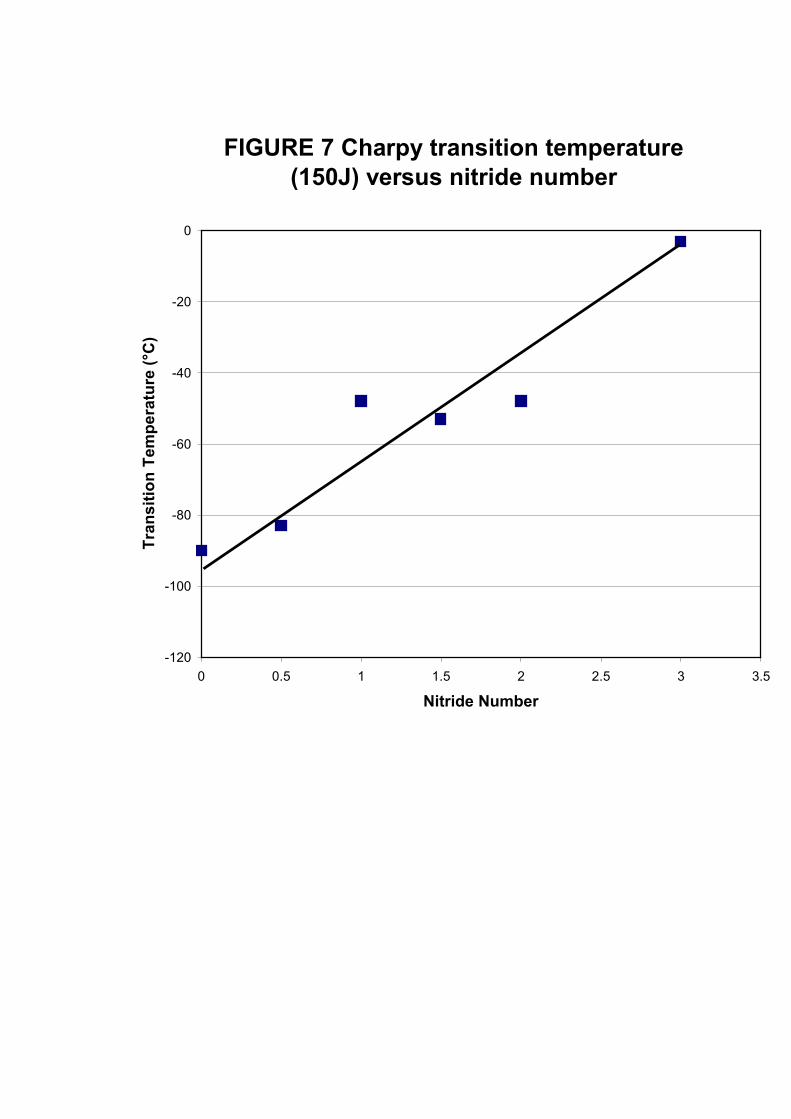
FIGURE 7 Charpy transition temperature(150J) versus nitride number
-120
-100
-80
-60
-40
-20
0
0 0.5 1 1.5 2 2.5 3 3.5
Nitride Number
Tran
sitio
n Te
mpe
ratu
re (°
C)
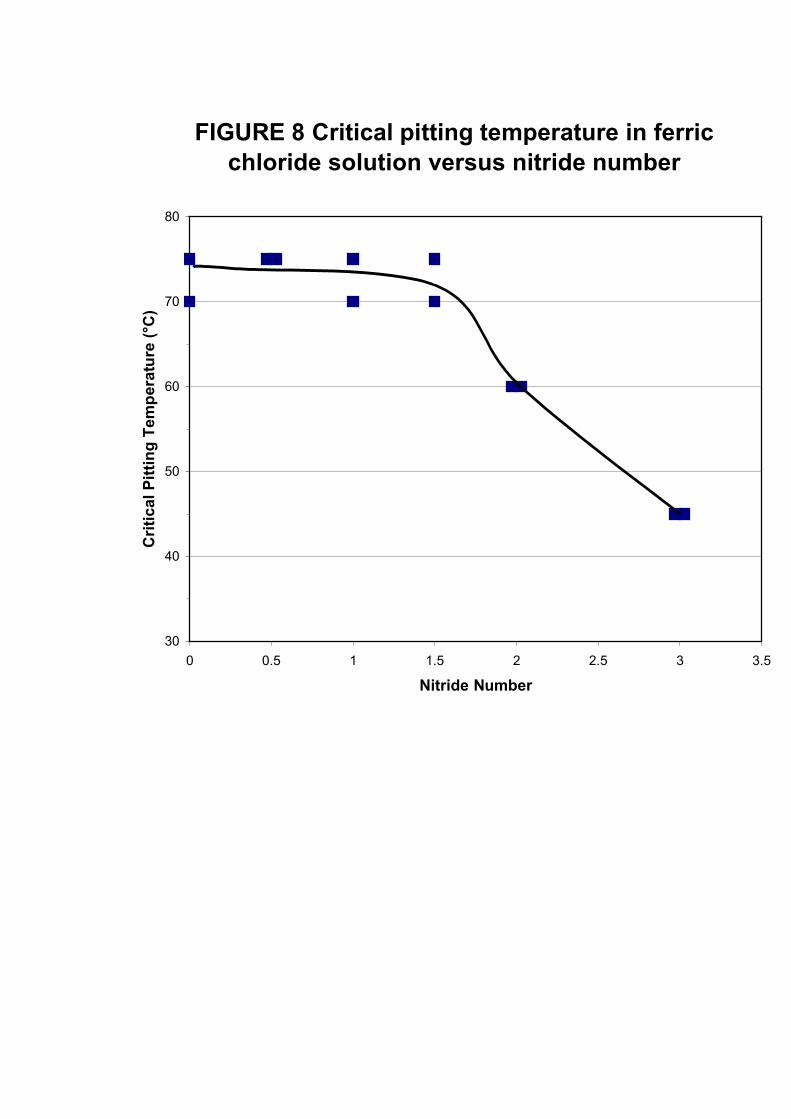
FIGURE 8 Critical pitting temperature in ferricchloride solution versus nitride number
30
40
50
60
70
80
0 0.5 1 1.5 2 2.5 3 3.5
Nitride Number
Crit
ical
Pitt
ing
Tem
pera
ture
(°C
)
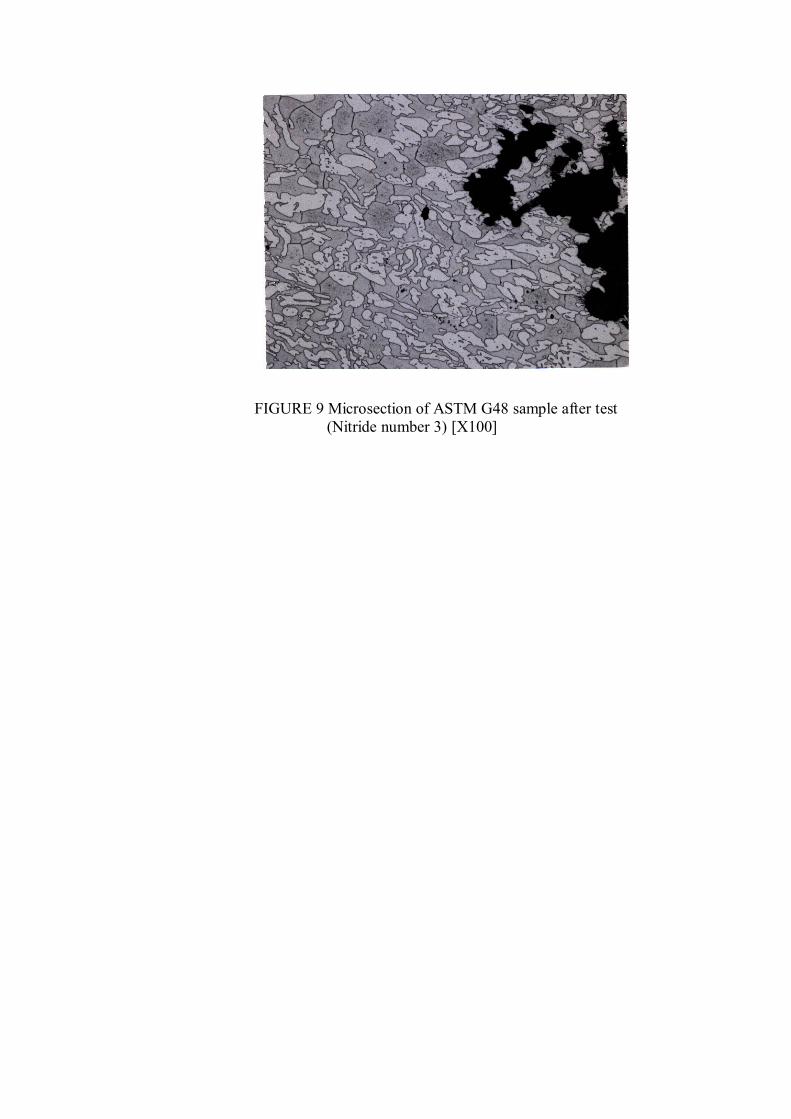
FIGURE 9 Microsection of ASTM G48 sample after test (Nitride number 3) [X100]

FIGURE 10 Critical pitting temperature in seawater versus nitride number
40
50
60
70
80
90
0 0.5 1 1.5 2 2.5 3 3.5
Nitride Number
Crit
ical
Pitt
ing
Tem
pera
ture
(°C
)
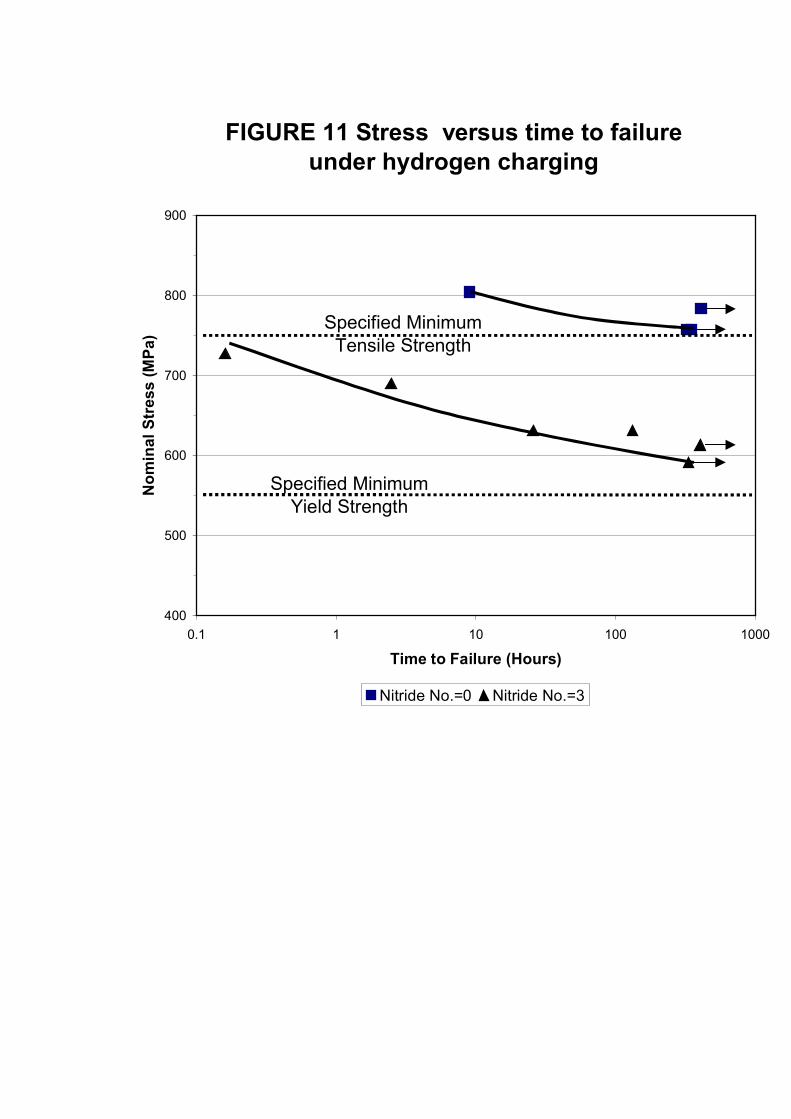
FIGURE 11 Stress versus time to failureunder hydrogen charging
400
500
600
700
800
900
0.1 1 10 100 1000
Time to Failure (Hours)
Nom
inal
Str
ess
(MPa
)
Nitride No.=0 Nitride No.=3
Specified MinimumYield Strength
Specified MinimumTensile Strength
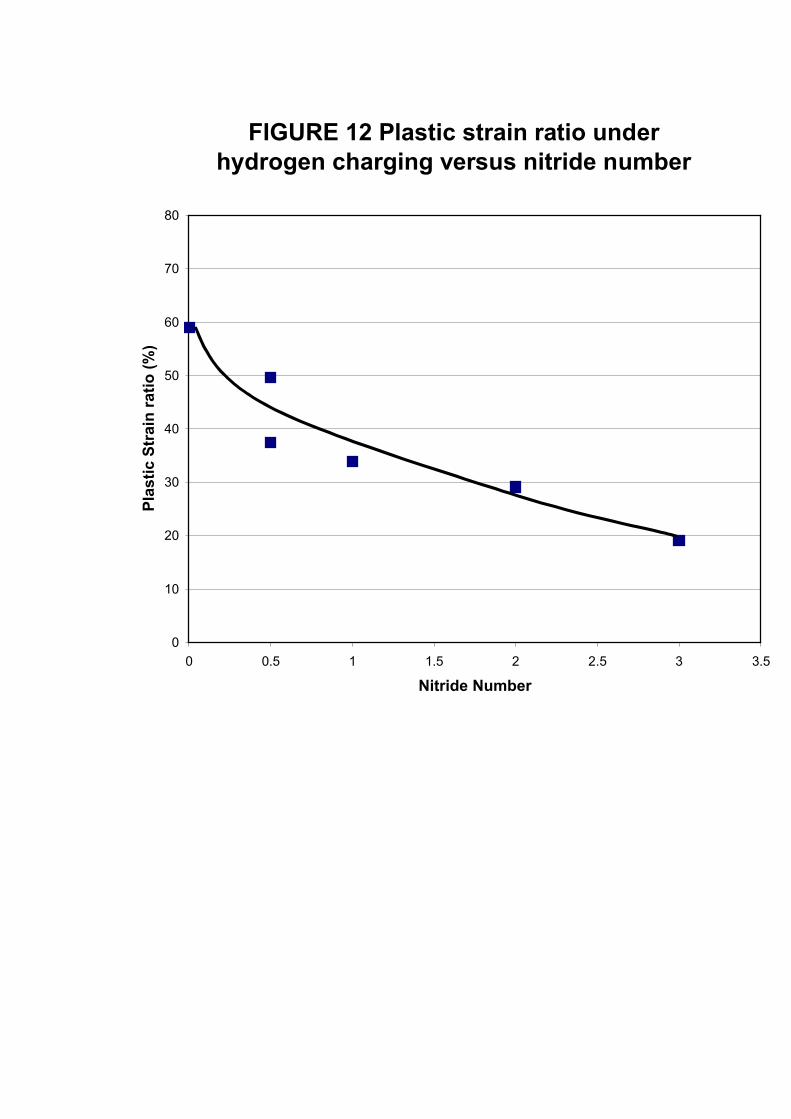
FIGURE 12 Plastic strain ratio underhydrogen charging versus nitride number
0
10
20
30
40
50
60
70
80
0 0.5 1 1.5 2 2.5 3 3.5
Nitride Number
Plas
tic S
trai
n ra
tio (%
)
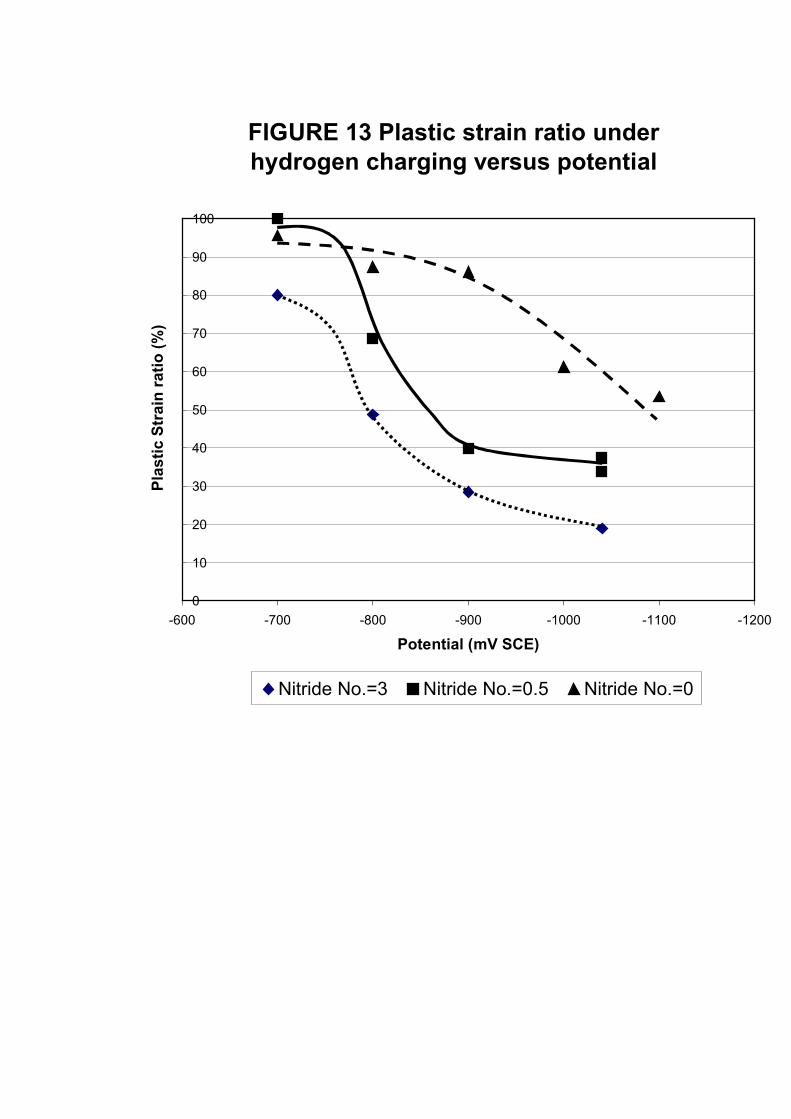
FIGURE 13 Plastic strain ratio underhydrogen charging versus potential
0
10
20
30
40
50
60
70
80
90
100
-1200-1100-1000-900-800-700-600
Potential (mV SCE)
Plas
tic S
trai
n ra
tio (%
)
Nitride No.=3 Nitride No.=0.5 Nitride No.=0
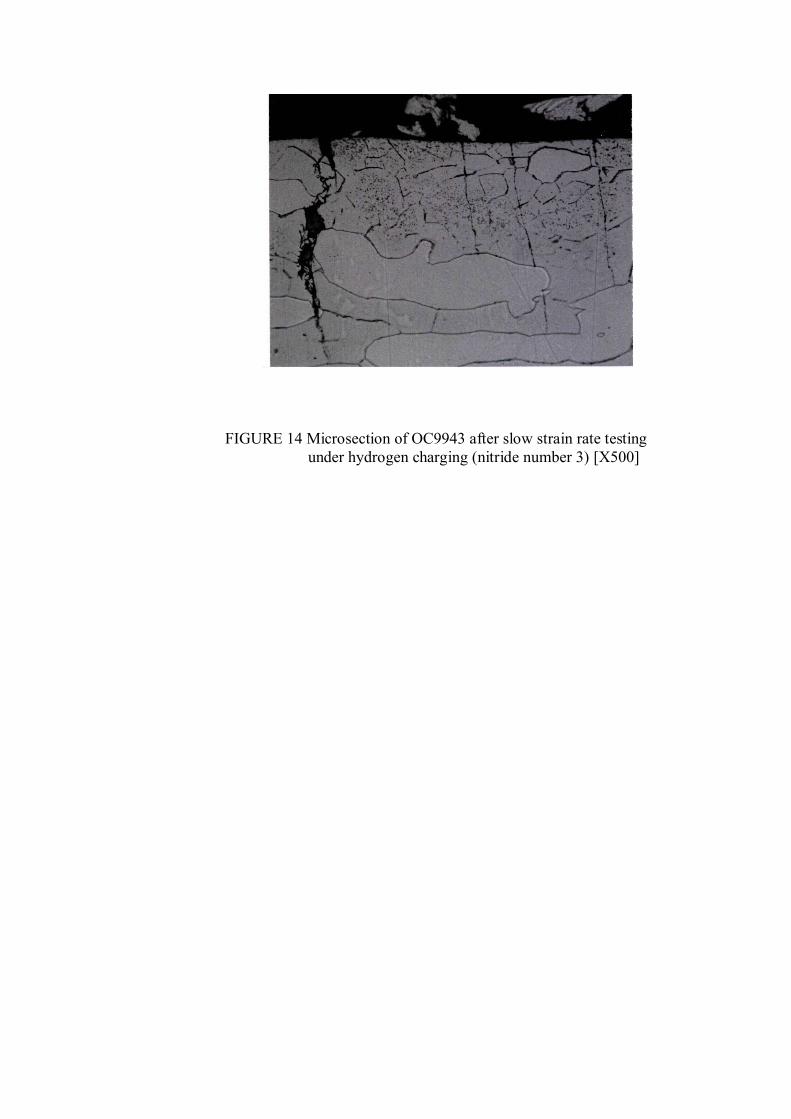
FIGURE 14 Microsection of OC9943 after slow strain rate testing under hydrogen charging (nitride number 3) [X500]