presented by delegation of surabaya city government file1229 1146 1783 1819 1815 1804 1797 1765...
TRANSCRIPT
LOW CARBON MANAGEMENT IN SURABAYA CITY
Presented by
Delegation of Surabaya City Government
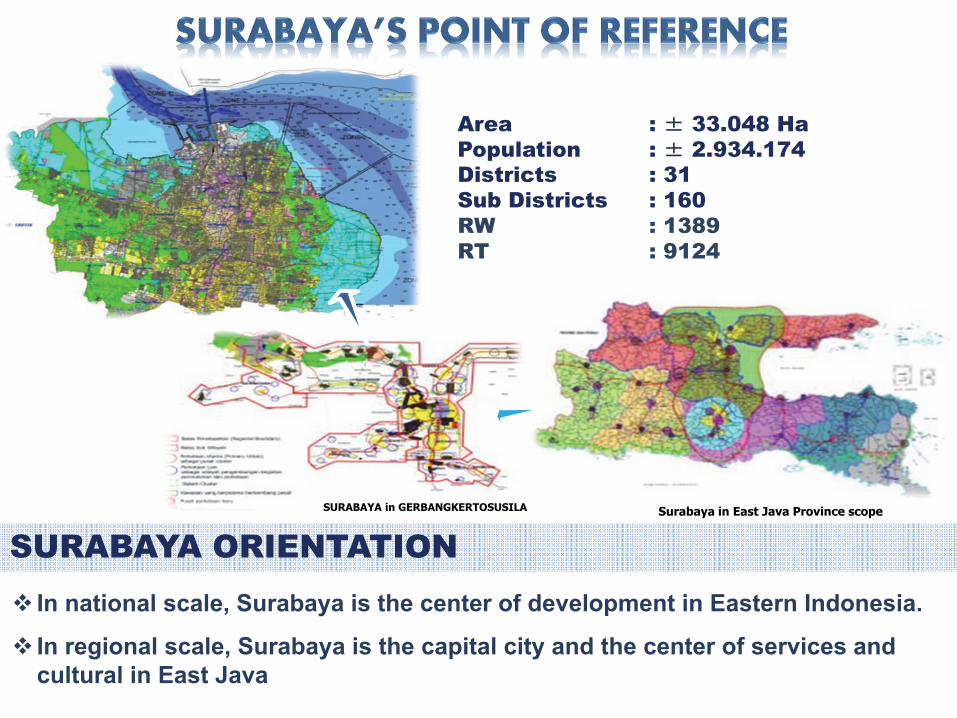
Surabaya in East Java Province scopeSURABAYA in GERBANGKERTOSUSILA
SURABAYA ORIENTATION In national scale, Surabaya is the center of development in Eastern Indonesia.
In regional scale, Surabaya is the capital city and the center of services and cultural in East Java
Area : ± 33.048 HaPopulation : ± 2.934.174Districts : 31Sub Districts : 160RW : 1389RT : 9124

"With a vision of long-term development plan 2005-2025:Surabaya as a city of international trade and services of local character is smart, clean and
ecologically friendlySurabaya City keep doing the best effort to improve the quality of life and environment for all people
in the city of Surabaya."
CONDITION OF SURABAYA CITY

“Waste management activities in Surabaya city is focused on efforts to reduce waste at its source, and performs processing of waste at the landfill using environmentally friendly
technologies.”
WASTE MANAGEMENT
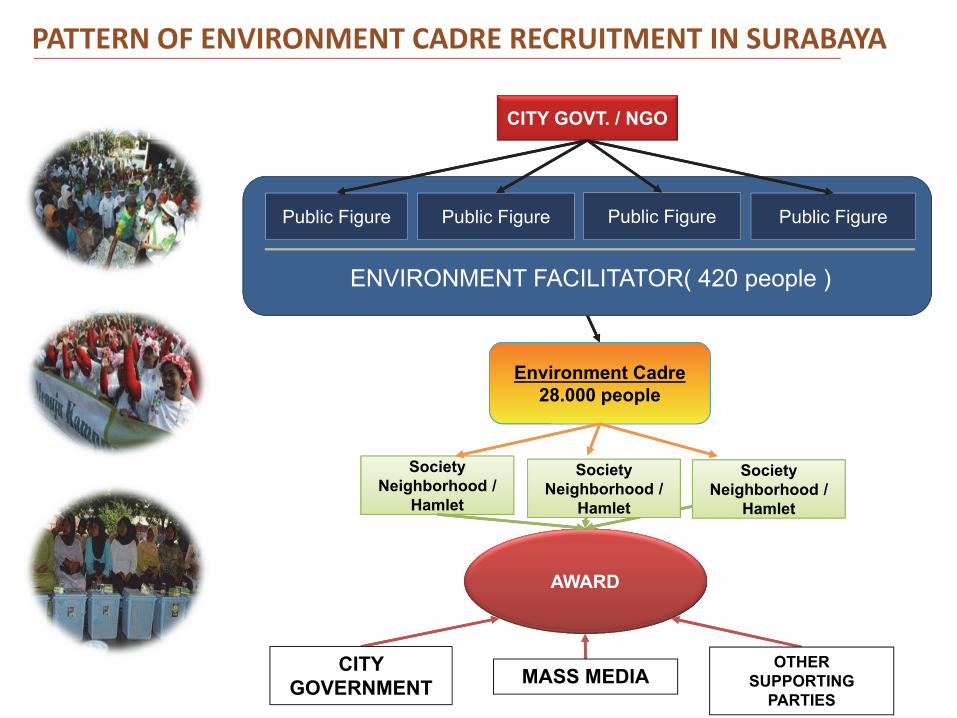
PATTERN OF ENVIRONMENT CADRE RECRUITMENT IN SURABAYA
CITY GOVT. / NGO
AWARD
CITY GOVERNMENT MASS MEDIA
OTHER SUPPORTING
PARTIES
Environment Cadre28.000 people
Society Neighborhood /
Hamlet
Public Figure Public Figure Public Figure Public Figure
ENVIRONMENT FACILITATOR( 420 people )
Society Neighborhood /
Hamlet
Society Neighborhood /
Hamlet

SEVERAL REGIONS ALREADY REDUCING THEIR WASTE
NO REGIONS NUMBER OF HOUSEHOLD
WASTE VOLUME (M3/ MONTH) Outcome
BEFORE AFTER
1 Rungkut Lor RW IV 1.165 65 162 Mojo RW XII 1.156 262 1393 Kebunsari RW II 638 63,16 21,764 Wonokromo RW V 523 46,32 0 1.500.000/month
5 Komplek Kenjeran RW I 260 90 06 Pakis RW III 1.056 202,8 147,337 Karah RW V 500 58 13,34 8.000.000/month
8 Margodadi RW VII 691 178 60,259 Jambangan RW II 510 68 26 8.000.000/month
10 Kedung Baruk RW V 350 14,4 4,3211 Tenggilis Mejoyo RW IV 791 420 90 1.500.000/month
12 Ketintang RW III 720 618 210,413 Margorukun RW X 617 186,04 65,05From 158 Villages in 2011, the average amount of waste reduced by household reaches
147,54 Ton / Day
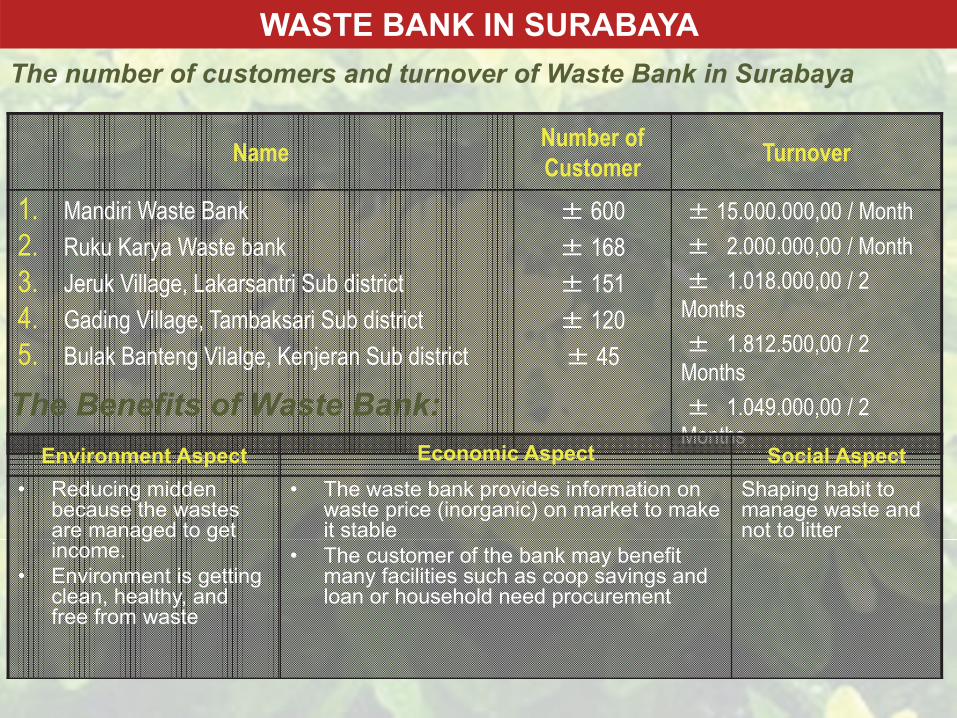
Name Number of Customer Turnover
1. Mandiri Waste Bank2. Ruku Karya Waste bank3. Jeruk Village, Lakarsantri Sub district4. Gading Village, Tambaksari Sub district5. Bulak Banteng Vilalge, Kenjeran Sub district
± 600 ± 168± 151 ± 120± 45
± 15.000.000,00 / Month± 2.000.000,00 / Month± 1.018.000,00 / 2
Months± 1.812.500,00 / 2
Months± 1.049.000,00 / 2
Months
The number of customers and turnover of Waste Bank in Surabaya
The Benefits of Waste Bank: Environment Aspect Economic Aspect Social Aspect
• Reducing midden because the wastes are managed to get income.
• Environment is getting clean, healthy, and free from waste
• The waste bank provides information on waste price (inorganic) on market to make it stable
• The customer of the bank may benefit many facilities such as coop savings and loan or household need procurement
Shaping habit to manage waste and not to litter
WASTE BANK IN SURABAYA

WASTE BANK ORGANIZATION IN SURABAYAWaste sorting
Deposit to Waste Bank exists in each neighborhood
Deposit in Waste Bank in Hamlet
City Scale Waste BankCollectors
Hamlet Waste BankHamlet Waste BankHamlet Waste Bank
Neighborhood Waste Bank Manager
Neighborhood Waste Bank Manager
Neighborhood Waste Bank Manager
Coordinator/Neighborhood
Customer/Household Customer/Household Customer/Household
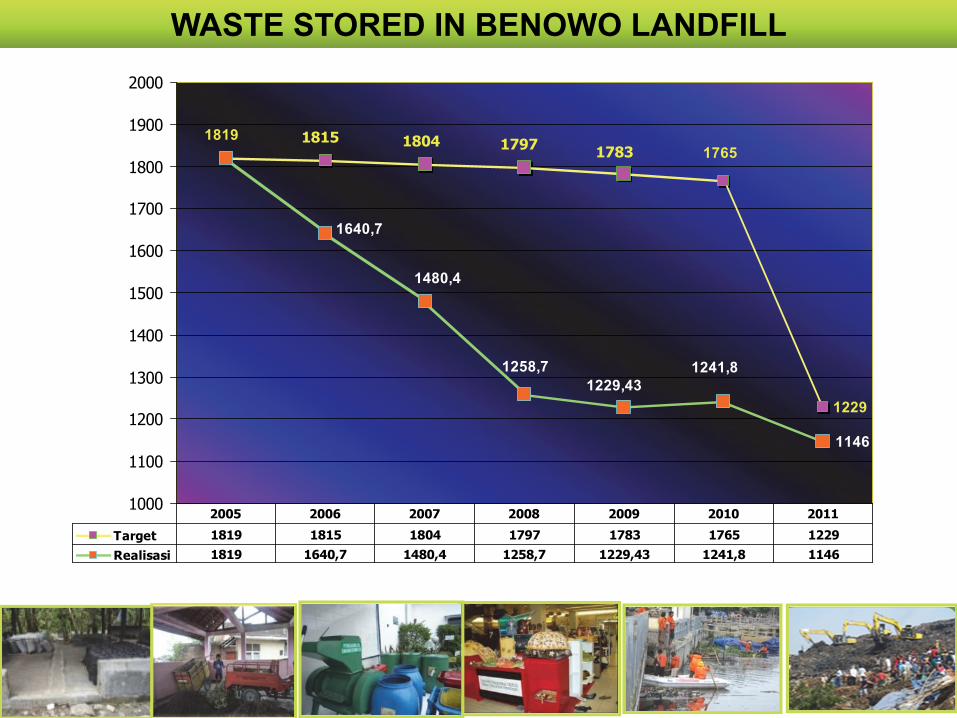
1229
1146
178317971804181518191765
1640,7
1480,4
1258,71229,43
1241,8
1000
1100
1200
1300
1400
1500
1600
1700
1800
1900
2000
Target 1819 1815 1804 1797 1783 1765 1229
Realisasi 1819 1640,7 1480,4 1258,7 1229,43 1241,8 1146
2005 2006 2007 2008 2009 2010 2011
WASTE STORED IN BENOWO LANDFILL
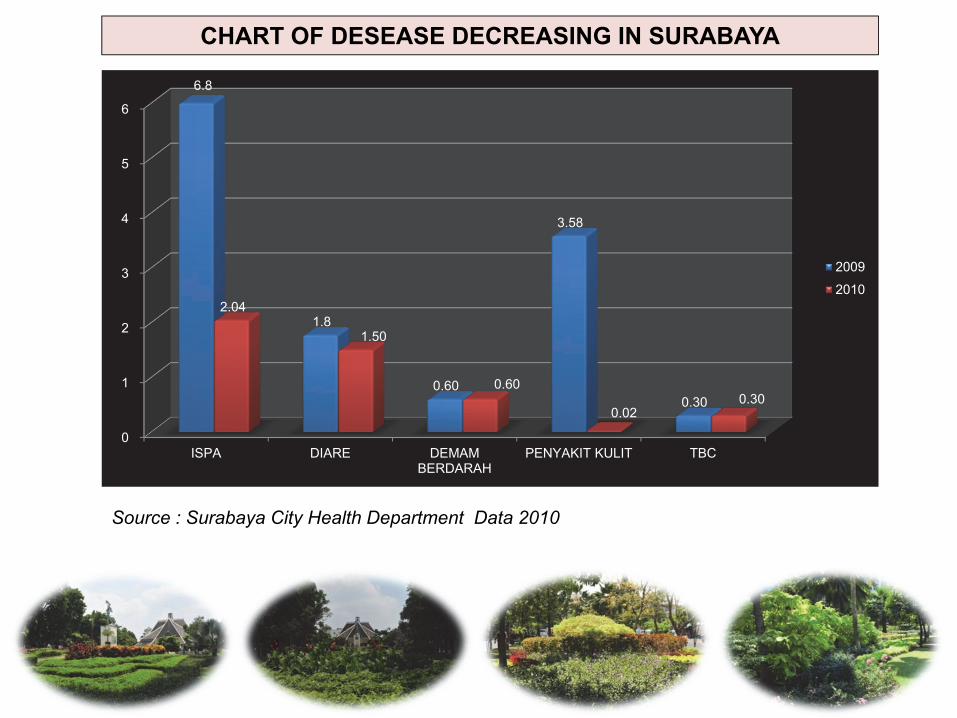
CHART OF DESEASE DECREASING IN SURABAYA
0
1
2
3
4
5
6
ISPA DIARE DEMAMBERDARAH
PENYAKIT KULIT TBC
6.8
1.8
0.60
3.58
0.30
2.04
1.50
0.60
0.02 0.30
2009
2010
Source : Surabaya City Health Department Data 2010
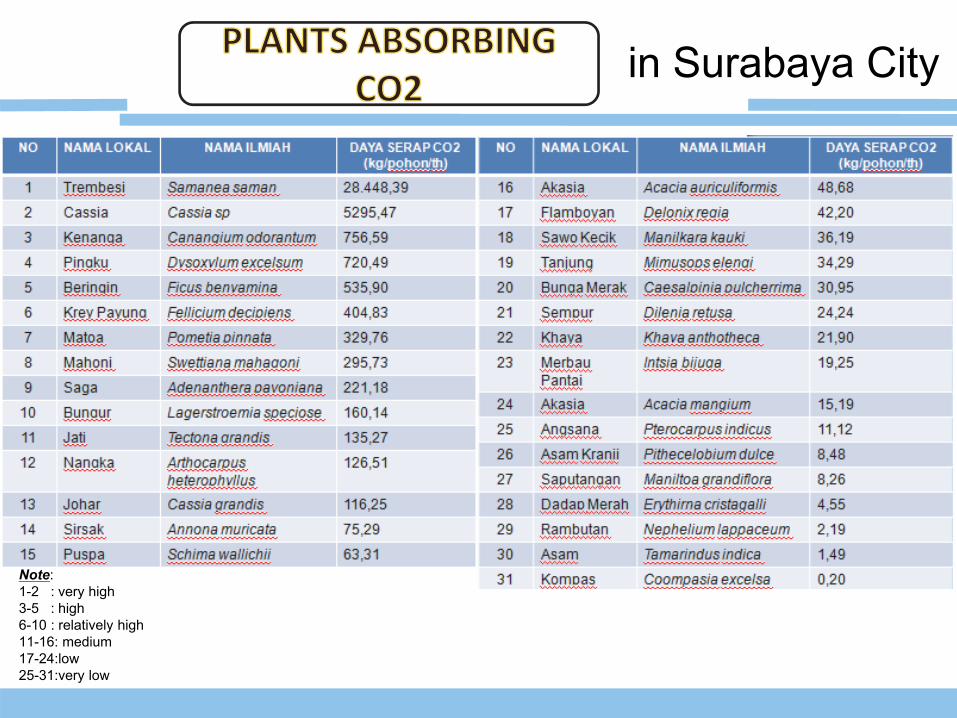
Note:1-2 : very high3-5 : high6-10 : relatively high11-16: medium17-24:low25-31:very low
in Surabaya City
ITSITS CITY FOREST
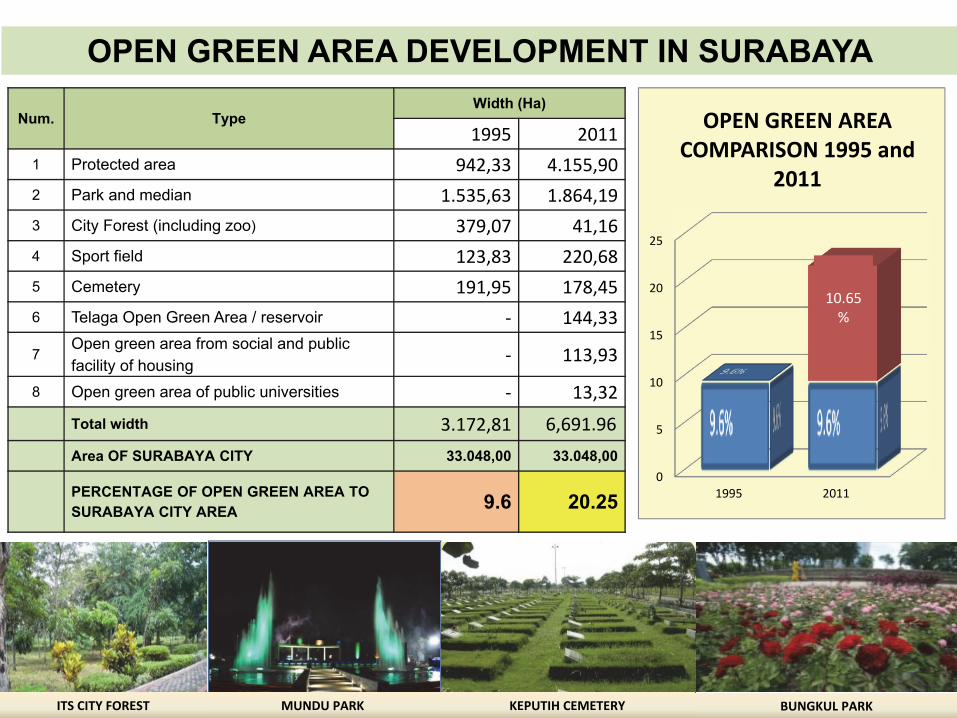
OPEN GREEN AREA DEVELOPMENT IN SURABAYA
MUNDU PARK KEPUTIH CEMETERY
0
5
10
15
20
25
1995 2011
OPEN GREEN AREA COMPARISON 1995 and
2011
10.65%
Num. TypeWidth (Ha)
1995 20111 Protected area 942,33 4.155,902 Park and median 1.535,63 1.864,193 City Forest (including zoo) 379,07 41,164 Sport field 123,83 220,685 Cemetery 191,95 178,456 Telaga Open Green Area / reservoir ‐ 144,33
7Open green area from social and public facility of housing ‐ 113,93
8 Open green area of public universities ‐ 13,32Total width 3.172,81 6,691.96 Area OF SURABAYA CITY 33.048,00 33.048,00
PERCENTAGE OF OPEN GREEN AREA TO SURABAYA CITY AREA 9.6 20.25
BUNGKUL PARK

1. Smart Environment 2011, Warta Ekonomoni 2. Indonesia Green Region Award 2011, Majalah
SWA & KBR68H3. ADIPURA 20114. The Best Park Management in Indonesia 2011
5. Adiwiyata Mandiri – SDN Kandangan III6. ASEAN Environment Suistanable City (ESC) Award 2011
7. Asian cities of the future 2009/20108. National Adiwiyata– SDK Santa Theresia
9. “Dubai International Award For Best Practices to Improves The Living Environment 2008” for Green and Cleas Initiative Indonesia
10. “The Green Apple Award 2007” for Environmental Best Practice
11. Energy globe 200512. Adipura 1988‐1998 and 2005‐201013. Adiwiyata14. Green Building in Surabaya:
ASEAN Center for Energy Award
ACHIEVEMENT OF SURABAYA IN ENVIRONMENT FIELD
Graha WonokoyoGraha Pangeran
SURABAYA CITY GOVERNMENT