presented by denise rowe stake, thomas kelley, and frank sataline
TRANSCRIPT

GLOBAL FINANCIAL CRISISGLOBAL FINANCIAL CRISISIMPACT ONIMPACT ONCOMMERCIAL REAL ESTATECOMMERCIAL REAL ESTATE
University of Connecticut Center for Real Estate University of Connecticut Center for Real Estate Alumni Panel DiscussionAlumni Panel DiscussionNovember 19, 2008November 19, 2008

Alumni PresentersAlumni Presenters
Denise Rowe StakeDenise Rowe Stake Vice President, Portfolio ManagementVice President, Portfolio Management Cornerstone Real Estate AdvisorsCornerstone Real Estate Advisors UConn Class of 1990 (BS), 1997 (MA) UConn Class of 1990 (BS), 1997 (MA)
Thomas KelleyThomas Kelley Managing DirectorManaging Director Babson Capital Management, LLCBabson Capital Management, LLC UConn Class of 1977 (BS) UConn Class of 1977 (BS)
Frank SatalineFrank Sataline Senior Managing DirectorSenior Managing Director Cigna Investment ManagementCigna Investment Management UConn Class of 1983 (BS), 1998 UConn Class of 1983 (BS), 1998
(MBA)(MBA)

Real Estate EquityReal Estate EquityDenise Rowe StakeDenise Rowe Stake

30, 2008September
Why Invest in Real Estate? Why Invest in Real Estate? Inves tment Total Returns
5.3%
-22.0%
7.9%
13.3%
0.2%
5.6%
14.2%
5.2% 4.3%
11.8%
3.1% 5.4%
-30%
-20%
-10%
0%
10%
20%
1 Year 3 Year 5 Year 10 Year
NCREIF - NPI S&P 500 Lehman Govt. Bond Index
Past performance is absolutely no
guarantee of future performance,
especially in the short-term and
maybe not in the long-term

Top 200 Pension Fund Allocations Top 200 Pension Fund Allocations
* 2008 is estimated based on a 20% decline in total assets and constant real estate dollars allocated
Real Es tate Allocation to Total As s ets
Source: Pensions and Investments, UBS Research, Cornerstone Research
- !Uh oh
0.0
0.5
1.0
1.5
2.0
2.5
3.0
3.5
4.0
4.5
5.0
5.5
6.0
85 86 87 88 89 90 91 92 93 94 95 96 97 98 99 00 01 02 03 04 05 06 07 08*
$ tr
illi
on
s
2.0%
2.5%
3.0%
3.5%
4.0%
4.5%
5.0%
5.5%Total assets (L)
Real estate allocation (R)

0
25
50
75
2001 2002 2003 2004 2005 2006 2007 2008
Bill
ion
s o
f U
S$
Apartments Industrial Office Retail
Monthly Sales Volume by Property Type
Commercial Real Estate Sales ActivityCommercial Real Estate Sales Activity
Source: Real Capital Analytics, Cornerstone Research 8-28-2008
Portfolio deals, REIT buyouts fueled peak activity in 2007, transactions fall to 5-year low in 2008

Cap Rates Dis connect
Commercial Real Estate ValuationCommercial Real Estate Valuation
Source: NCREIF, Cornerstone Research 8-28-2008
Transaction vs Current Value Cap Rates
4%
5%
6%
7%
8%
9%
10%
11%
93 94 95 96 97 98 99 00 01 02 03 04 05 06 07 08
Year
Ca
p R
ate
s
Cap Rates - All Sold Props
Current Value (Appraisal) Cap Rates

Office:Office: 2008Q3: 13.5% vacancy, up 30 basis points for quarter2008Q3: 13.5% vacancy, up 30 basis points for quarter Suburban vacancy up 40bp to 15.5%, CBD steady at 9.7% Suburban vacancy up 40bp to 15.5%, CBD steady at 9.7% Financial sector job cuts will push up CBD vacancyFinancial sector job cuts will push up CBD vacancy
Industrial:Industrial: 2008Q3 10.7% availability, up from 10.3% in Q22008Q3 10.7% availability, up from 10.3% in Q2 Supply should react quickly to slower demandSupply should react quickly to slower demand
Multifamily:Multifamily: 94.3% occupancy in Q3, down from 94.4% in Q2 94.3% occupancy in Q3, down from 94.4% in Q2 Reflecting weak employment and shadow supply in some markets Reflecting weak employment and shadow supply in some markets
Hotels:Hotels: Full Service Chain occupancy near 70% but is stressedFull Service Chain occupancy near 70% but is stressed Leisure/transient business travel were sharply off this summerLeisure/transient business travel were sharply off this summer Diminished airlift and corporate travel cuts will challenge 2009Diminished airlift and corporate travel cuts will challenge 2009
Retail:Retail: Most challenged sector near-termMost challenged sector near-term Weak October retail sales a precursor to disappointing holiday sales Weak October retail sales a precursor to disappointing holiday sales Accelerated retail chain consolidation hurts marginal players and Accelerated retail chain consolidation hurts marginal players and
locations locations
Real Estate FundamentalsReal Estate Fundamentals

Real Estate DebtReal Estate DebtThomas KellyThomas Kelly

Increasing Leverage, Decreasing Coverage through 2007 Vintage
0
20
40
60
80
100
120
2008200720062005200420032002
LT
V
0.00
0.20
0.40
0.60
0.80
1.00
1.20
1.40
1.60
DS
CR
Fitch Stressed LTV (*) Moody's Stressed LTV (***)
Fitch Stressed DSCR (**) Moody's Stressed DSCR (****)
Source: Rating Agency Presales
(**) Fitch Stressed DSCR is calculated based by using a blend of the Fitch term DSCR (Fitch NCF/Actual Debt Service) and Fitch constant DSCR (Fitch NCF/Fitch Constant Debt Service) (****) Moody’s Stressed DSCR = Moody's NCF / 9.25% Stressed Rate X Loan Balance(***) Moody’s Stressed LTV = Current Balance / (Moody's NCF / Moody's Cap Rates)
(*) Fitch Stressed LTV = Current Balance / (Fitch NCF / Fitch Stressed Cap Rates)
This presentation is provided for informational purposes only and should not be considered investment advice or an offer for a particular security or securities. The views and opinions expressed by the speaker are his own and do not necessarily represent the views of Babson Capital Management, LLC. Please consult your tax or financial advisor for additional information concerning your specific situation

Subordination LevelsSubordination Levels
0
5
10
15
20
25
30
35
40
1995 1996 1997 1998 1999 2000 2001 2002 2003 2004 2005 2006 2007 20080
5
10
15
20
25
30
35
40
10-Yr AAA (*) AA A BBB BB B
As of 10/4/06 12.01% 9.98% 7.45% 4.19% 2.32% 1.50%(*) 10-Yr AAA subordination level is derived from the junior ‘AAA’ tranche to facilitate comparisons to recent structural changes.
As of 10/9/07 12.08% 10.04% 7.59% 4.21% 2.45% 1.64%
Source: Rating Agency Presales
As of 10/9/08 13.55% 11.31% 8.56% 5.22% 3.14% 2.22%
This presentation is provided for informational purposes only and should not be considered investment advice or an offer for a particular security or securities. The views and opinions expressed by the speaker are his own and do not necessarily represent the views of Babson Capital Management, LLC. Please consult your tax or financial advisor for additional information concerning your specific situation

Loan Maturity Risk
This presentation is provided for informational purposes only and should not be considered investment advice or an offer for a particular security or securities. The views and opinions expressed by the speaker are his own and do not necessarily represent the views of Babson Capital Management, LLC. Please consult your tax or financial advisor for additional information concerning your specific situation

This presentation is provided for informational purposes only and should not be considered investment advice or an offer for a particular security or securities. The views and opinions expressed by the speaker are his own and do not necessarily represent the views of Babson Capital Management, LLC. Please consult your tax or financial advisor for additional information concerning your specific situation

As of: 11/17/08
Date Name Amount Source and Structure of Money Target Notes
12/12/2007 Term Auction Facility (TAF)
Fed buys bi-weekly term funding to depository instituions for fixed amounts of credit.
Treasury collateral for AAA RMBS and other OMO eligible collateral
3/11/2008Term Securities Lending Facility (TSLF) 28 day facility to FedNY primary dealers
Done in conjunction with BOE, BOC, ECB and Swiss Nat. Bank.
3/16/2008 Bear Stearns Bailout 29,000,000,000Fed backstop against losses to JPMorgan from Bear Stears Acquisition JPMorgan
JPM absorbs first billion of losses, then Fed takes up to $29B
3/16/2008Primary Dealers Credit Facility (PDCF)
Provides overnight treasury loans to primary dealers in exchange for eligible collateral.
9/7/2008Federal Takeover of Fannie/Freddie 200,000,000,000
Up to $100B to each agency in Treasury Funds Fannie/Freddie
In return, treasury gets $1B of 10% senior preferred stock in each company, and warrants for purchase of 80% of equity at virtually no cost.
9/17/2008 AIG Loan 122,800,000,000NY Fed credit liquidity facility to AIG secured by AIG. 3month LIBOR+850 AIG
Fed also got warrants for a 79.9% equity stake.
9/19/2008
Asset Backed Commercial Paper Money Market Mutual Fund Liquidity Facility (AMLF) 200,000,000,000
Fed loans to banking organizations to purchase asset backed commercial paper from money market mutual funds CP Market
Size is a guess. Amounts outstanding have varied.
9/29/2008 Auto Bailout 25,000,000,00025-year, low-interest, 5yr IO loans from the Energy Dept. GM, Chrysler, Ford
Democrats are considering doubling this to $50B. Supposedly to be used to retool aging plants to hybrid production. (Honda and Nissan have qualifying plants in US as well).
10/3/2008TARP (Troubled Asset Relief Program) 700,000,000,000
Treasury funds to buy troubled assets now including equity stakes in banks Banks and Insurers
$250B for immediate use, addl $100B with presidential approval, final $350B with congressional approval. Possibly being expanded to include more institutions.
10/7/2008Commerical Paper Funding Facility (CPFF) 256,144,000,000
Treasury backstop deposit at Fed, Fed purchases 3-month CP and ABS of highly rated institutions CP Market
Fed refused to say how much they would buy under this program, but noted that $1.3Trillion of paper would qualify.
10/21/2008Money Market Investor Funding Facility (MMIFF) 540,000,000,000
Fed takes CDs, bank notes and CP from highly rated US institutions as collateral for loans.
US Money Market Funds
Securities have to have maturities of 90 days or less. Program administered by JPM
~2,072,944,000,000
Govt. Bailout Plans
This presentation is provided for informational purposes only and should not be considered investment advice or an offer for a particular security or securities. The views and opinions expressed by the speaker are his own and do not necessarily represent the views of Babson Capital Management, LLC. Please consult your tax or financial advisor for additional information concerning your specific situation

Real Estate Portfolio ManagementReal Estate Portfolio ManagementFrank SatalineFrank Sataline

OverviewOverview
1.1. Answer the question, Answer the question, “Why real estate?”“Why real estate?”
3.3. How real estate fits into CIGNA’s How real estate fits into CIGNA’s investment strategies and portfolioinvestment strategies and portfolio
5.5. Where do we go from here?Where do we go from here?

?Why Real Estate ?Why Real Estate
PPR’s August ’08 Publication:PPR’s August ’08 Publication:
Why Real Estate Why Real Estate NowNow??
Long-term considerationsLong-term considerations Market neutralMarket neutral Return enhancementReturn enhancement Risk reductionRisk reduction Cash flowCash flow HedgingHedging
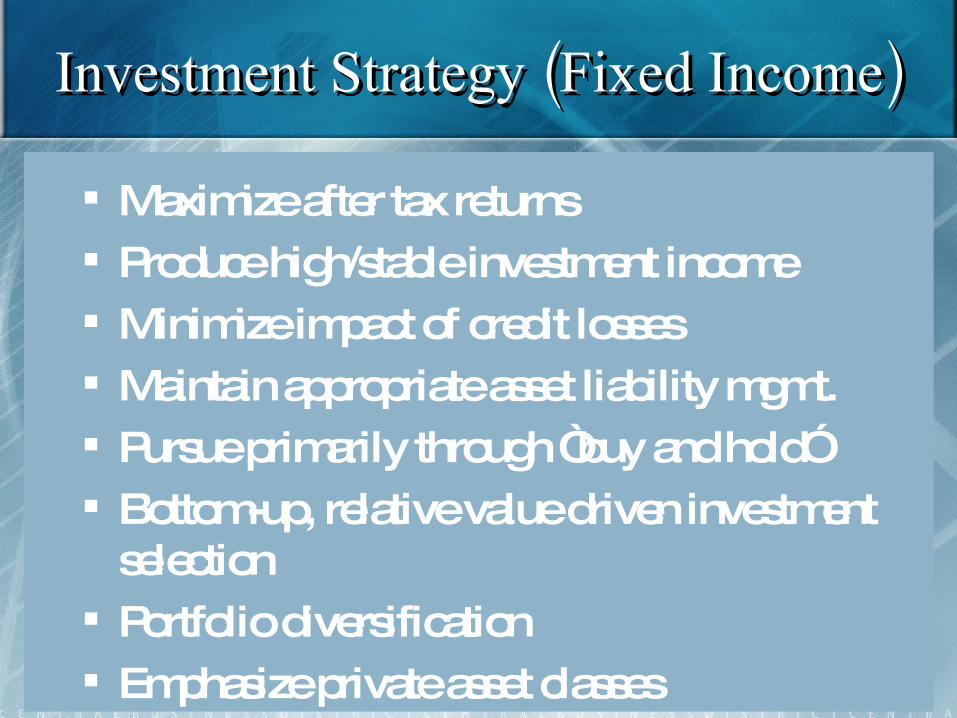
( )Investment Strategy Fixed Income ( )Investment Strategy Fixed Income
Maximize after tax returns Produce high/stable investment income Minimize impact of credit losses Maintain appropriate asset liability mgmt. Pursue primarily through “buy and hold” Bottom-up, relative value driven investment
selection Portfolio diversification Emphasize private asset classes

Risky Asset Investment Strategy Risky Asset Investment Strategy
Maximize economic returns
Optimize risk-adjusted net investment income
Leverage CIM’s underwriting and sourcing capabilities in core asset classes

’ ?Real Estate in CIGNA s Portfolio ’ ?Real Estate in CIGNA s Portfolio
Employee Benefits PortfolioEmployee Benefits Portfolio $15.6 billion$15.6 billion
Predominantly a fixed income investorPredominantly a fixed income investor plusplus real estate mezzanine and equity and real estate mezzanine and equity and
private mezzanine and private equity private mezzanine and private equity Commercial mortgagesCommercial mortgages
$3.5 billion or 22% of assets - $3.5 billion or 22% of assets - at targetat target Equity real estateEquity real estate
$.4 billion or 2.5% of assets - $.4 billion or 2.5% of assets - at only 1/3 of at only 1/3 of targettarget
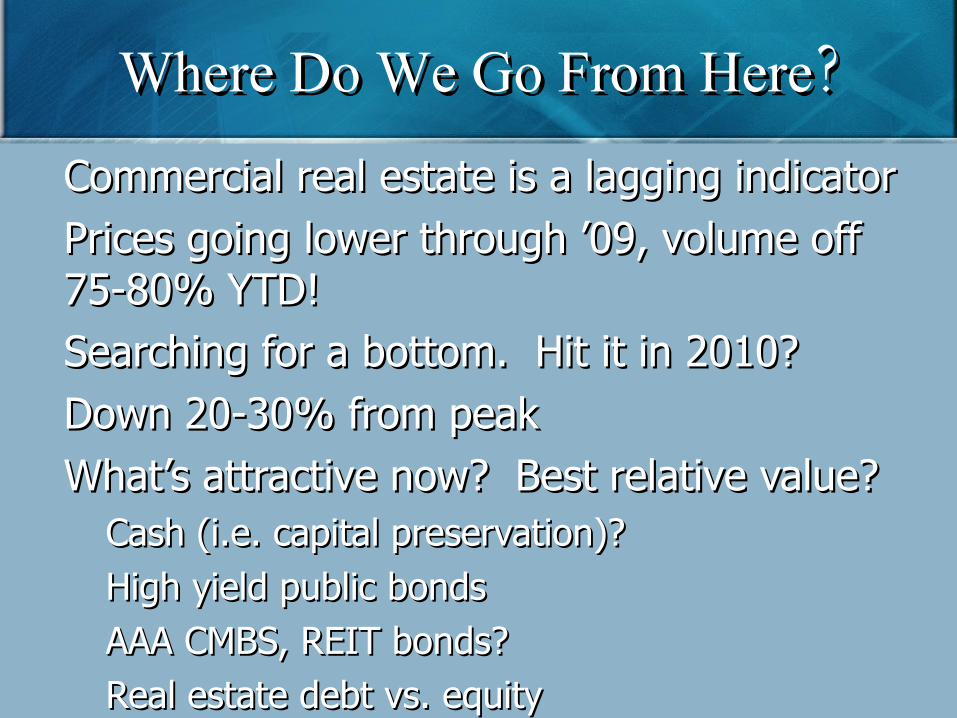
?Where Do We Go From Here ?Where Do We Go From Here
Commercial real estate is a lagging indicatorCommercial real estate is a lagging indicator Prices going lower through ’09, volume off Prices going lower through ’09, volume off
75-80% YTD!75-80% YTD! Searching for a bottom. Hit it in 2010? Searching for a bottom. Hit it in 2010? Down 20-30% from peakDown 20-30% from peak What’s attractive now? Best relative value? What’s attractive now? Best relative value?
Cash (i.e. capital preservation)?Cash (i.e. capital preservation)? High yield public bondsHigh yield public bonds AAA CMBS, REIT bonds?AAA CMBS, REIT bonds? Real estate debt vs. equity Real estate debt vs. equity

QUESTIONS?QUESTIONS?
Thank you alumni speakers.Thank you alumni speakers.
All are invited to a reception!All are invited to a reception!
University of Connecticut Center for Real EstateUniversity of Connecticut Center for Real EstateAlumni Panel DiscussionAlumni Panel DiscussionNovember 19, 2008November 19, 2008