presented by: diane garnick, cpa investment strategist + 1 (212) 278 9404 [email protected]...
TRANSCRIPT

Presented by:
Diane Garnick, CPAInvestment Strategist+ 1 (212) 278 9404
All material presented is compiled from sources believed to be reliable and current, but accuracy cannot be guaranteed. This is not to be construed as an offer to buy or sell any financial instruments and should not be relied upon as the sole factor in an investment making decision. As with all investments there are associated inherent risks. Please obtain and review all financial material carefully before investing. The opinions expressed herein are based on current market conditions and are subject to change without notice. Past performance is not indicative of future results.
This publication may contain confidential and proprietary information of Invesco Institutional and/or Invesco Ltd. Circulation, disclosure, or dissemination of all or any part of this material to any unauthorized persons is prohibited without prior written consent of Invesco.
For General Institutional Investor Use Only
Post-Traumatic Stress Investing

2
Investors Need To Process Their Losses Kübler-Ross stages of grief; Investments version
• Stage 1: Denial — We should suspend mark to market accounting and everything will go away— I should throw away my 401K statement without even opening it
• Stage 2: Anger— It is unfair that Wall Street benefited at my expense — Why did this happen to me?
• Stage 3: Bargaining— Just give me one relief rally and I can make it all back — I just need people to stop panicking and my best ideas will make me whole
again
• Stage 4: Depression— No one is hiring anywhere. Why should I bother? At least I can sleep late.
• Stage 5: Acceptance— I’m going to be ok. These things don’t last forever — I’m going to work on my career and be prepared for the opportunities when they
do come
Source: Invesco Ltd.
3
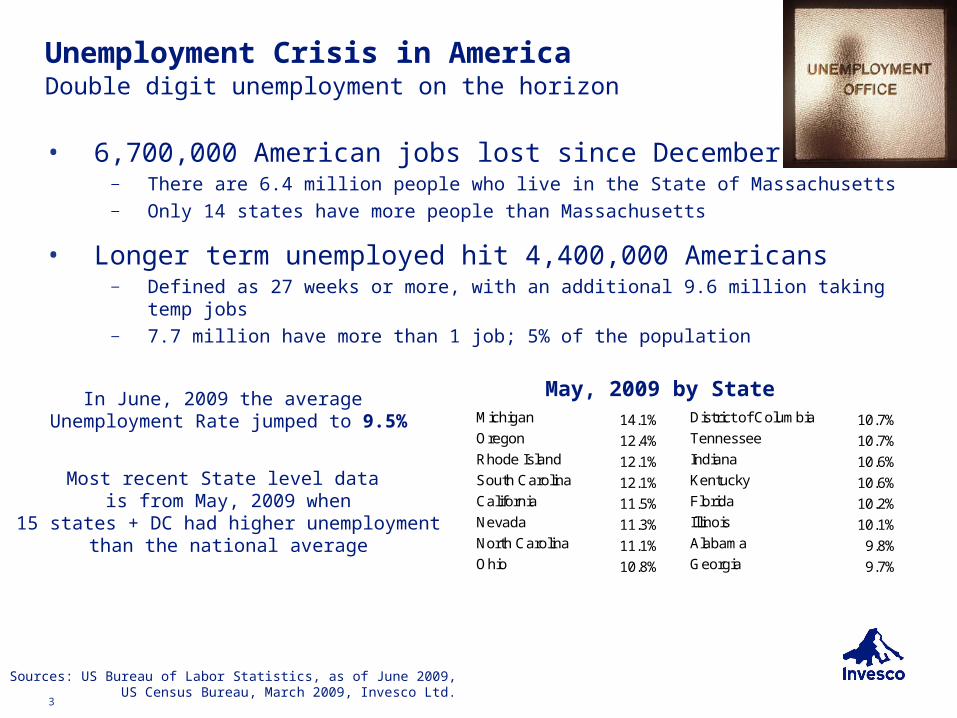
Unemployment Crisis in AmericaDouble digit unemployment on the horizon
• 6,700,000 American jobs lost since December 07— There are 6.4 million people who live in the State of Massachusetts— Only 14 states have more people than Massachusetts
• Longer term unemployed hit 4,400,000 Americans— Defined as 27 weeks or more, with an additional 9.6 million taking temp jobs— 7.7 million have more than 1 job; 5% of the population
Sources: US Bureau of Labor Statistics, as of June 2009, US Census Bureau, March 2009, Invesco Ltd.
In June, 2009 the average Unemployment Rate jumped to 9.5%
Most recent State level data
is from May, 2009 when15 states + DC had higher unemployment
than the national average
May, 2009 by StateMichigan 14.1% District of Columbia 10.7%Oregon 12.4% Tennessee 10.7%Rhode Island 12.1% Indiana 10.6%South Carolina 12.1% Kentucky 10.6%California 11.5% Florida 10.2%Nevada 11.3% Illinois 10.1%North Carolina 11.1% Alabama 9.8%Ohio 10.8% Georgia 9.7%
4
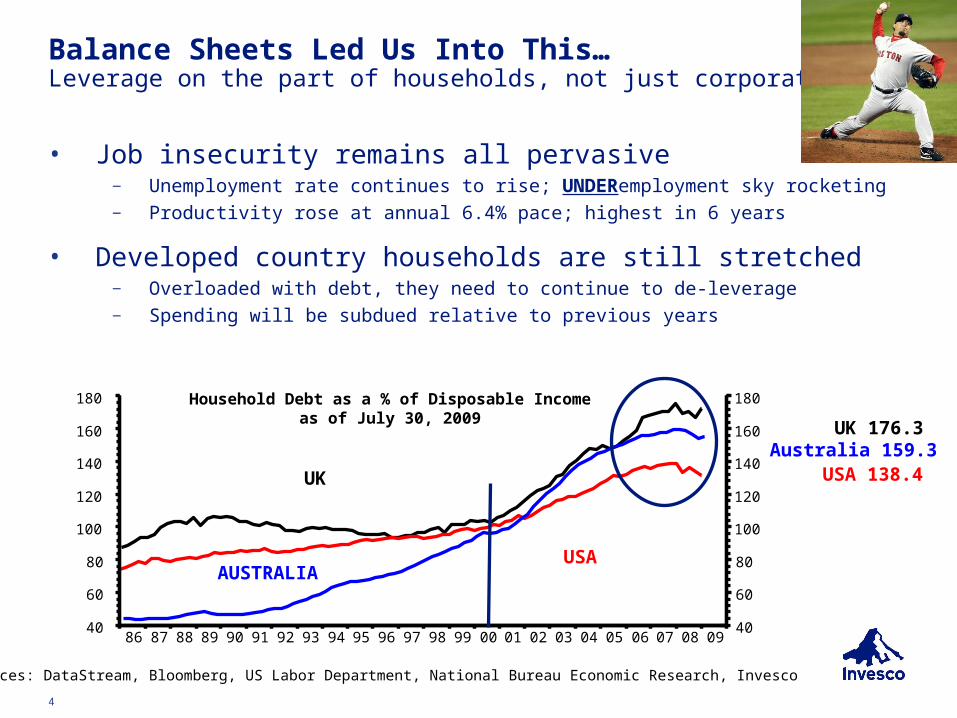
Balance Sheets Led Us Into This…Leverage on the part of households, not just corporates
Sources: DataStream, Bloomberg, US Labor Department, National Bureau Economic Research, Invesco
Household Debt as a % of Disposable Incomeas of July 30, 2009
86 87 88 89 90 91 92 93 94 95 96 97 98 99 00 01 02 03 04 05 06 07 08 0940
60
80
100
120
140
160
180
40
60
80
100
120
140
160
180
UK
USAAUSTRALIA
UK 176.3
USA 138.4Australia 159.3
• Job insecurity remains all pervasive — Unemployment rate continues to rise; UNDERemployment sky rocketing— Productivity rose at annual 6.4% pace; highest in 6 years
• Developed country households are still stretched— Overloaded with debt, they need to continue to de-leverage— Spending will be subdued relative to previous years

5
Real Estate Crisis in AmericaThe overindulgence of housing
• United States has a population of 298,757,310— Make the extreme assumption that every family should be a homeowner— Further state that each family should own only one home
• Average family size in the United Sates is 3.19— This number has been getting smaller, but over very long periods of time
• United States has 93,654,329 family units— Simply take the total population by the average family size
• There are currently 126,237,884 housing units available— This excludes homes currently under construction
• There are 32 million excess homes on the market right now— Represents a 26% overstocking of homes
Sources: U.S. Census Bureau, March 2009, Invesco Ltd.

6
Housing Prices Continue to Fall Initially resistant to declines; sticky asset
• There are 0.42 houses per person in the United States— This means for equilibrium the family size should be 2.37 not 3.19
• 77,112,947 people would need to move into new homes— Alternatively, we could demolish 32million homes
Instead, throughout 2008, the foreclosure rate beganto soar. By June, 2009 1 in 84 homes received adefault notice, or were already seized by banks
Metro Area Foreclosure rateStockton, CA 9.50%Las Vegas, NV 8.90%San Bernardino, CA 8.00%Bakersfield, CA 6.20%Phoenix, AZ 6.00%Ft Lauderdale, FL 6.00%Orlando, FL 5.50%Miami, FL 5.20%Sacramento, CA 5.20%Detroit, MI 4.50%Sarasota, FL 4.50%Fresno, CA 4.20%Tampa, FL 4.10%Oakland, CA 4.10%San Diego, CA 4.00%Palm Beach, FL 3.70%Atlanta, GA 3.30%Memphis, TN 3.20%Denver, CO 3.20%Ventura, CA 3.10%Source: RealtyTracSources: U.S. Census Bureau, Case Shiller, Invesco Ltd.

7
Trend is Increasing Family SizeThis could slow down the housing price recovery process
• Young adults putting off moving out on their own— Waiting to feel more secure in their jobs before they sign a one year lease
• Boomerang children in their 40s and 50s— At one point described children returning to their parent’s home after college— This recession is redefining that phenomena
• Newly unemployed seeking shelter— Traditional three to six months of savings has been lost by market performance— Realistic that it could take much longer without becoming underemployed
• Loss of home as a result of personal bankruptcy/foreclosure— 1,416,902 people filed bankruptcy in 2008
• Multigenerational households increased from 5m to 6.2m— In 2000 there were as few as 3.9m homes with three or more generations— One third of retirees have had to help their children pay bills in 2008
Sources: AARP, U.S. Census Bureau, Invesco Ltd.

8
Paradox of Thrift Slows Potential Recovery Wealth erosion coupled with employment uncertainty
• Savings rate jumped to 6.2% in May, 2009— Households are hoarding cash in an effort to recoup losses
• Chrysler sold 83,678 new cars in February, 2009— The FBI reports an average of 80,254 car thefts a month— Four car companies in the world sold more cars than the number of stolen cars
Sources: Bureau of Economic Analysis, FBI, WARDS, Invesco Ltd.
Sold Versus Stolen
126,198
109,583
97,544
83,67880,254
71,575
54,258
30,621
22,07318,313 16,401 15,805
0
20,000
40,000
60,000
80,000
100,000
120,000
140,000
GM
To
yota
Fo
rd
Ch
rysl
er
Sto
len
Car
s
Ho
nd
a
Nis
san
Hyu
nd
ai
Kia
Vo
lksw
agen
Maz
da
BM
W
Veh
icle
s fo
r th
e m
on
th o
f F
ebru
ary
09
US Personal Savings Rate
-4.0%
-3.0%
-2.0%
-1.0%
0.0%
1.0%
2.0%
3.0%
4.0%
5.0%
6.0%
Mar
-97
Jul-9
7
Nov
-97
Mar
-98
Jul-9
8
Nov
-98
Mar
-99
Jul-9
9
Nov
-99
Mar
-00
Jul-0
0
Nov
-00
Mar
-01
Jul-0
1
Nov
-01
Mar
-02
Jul-0
2
Nov
-02
Mar
-03
Jul-0
3
Nov
-03
Mar
-04
Jul-0
4
Nov
-04
Mar
-05
Jul-0
5
Nov
-05
Mar
-06
Jul-0
6
Nov
-06
Mar
-07
Jul-0
7
Nov
-07
Mar
-08
Jul-0
8
Nov
-08

9
Real GDP & Inflation Forecasts for 2009
ConsensusEconomics
2008 Realized 2009 Consensus Forecast(Invesco Forecast)
Real GDP CPI Inflation Real GDP CPI Inflation
U.S. 1.2% 4.0% -1.3% (-1.8%) 0.3% (-1.2%)
EU-12 1.0% 3.3% -0.9% (-1.5%) 1.4% (1.1%)
U.K. 0.8% 3.6% -1.5% (-2.0%) 1.2% (1.2%)
JAPAN 0.4% 1.6% -0.9% (-0.5%) 0.1% (-0.4%)
AUSTRALIA 2.3% 4.5% 1.1% (1.0%) 2.8% (3.1%)
CANADA 0.7% 2.4% -0.1% (-0.3%) 1.2% (0.9%)
CHINA 9.3% 6.1% 7.8% (6.8%) 1.7% (0.6%)
INDIA 6.9% 8.1% 6.3% (6.1%) 6.2% (2.4%)
Source: Invesco Ltd.

10
Redefining Risk in the New Paradigm Err on the side of wealth preservation
• Post liquidity crisis; investors less willing to lock up cash— Likely to result in the reemergence of the liquidity premium
• Risk budgeting strategies can help reduce volatility— Similar levels of risk from each asset class; return to “Risk Parity”
• Diversification remains central to portfolio construction— Macro continues to dominate fundamentals… so far
• Attractive current yield and annualized return— Current yield to help mitigate impending negative cash flows— In many cases dividends are at risk; high yields through price depreciation
• Asset management fees under pressure— Managers are struggling to survive; willing to forego the old 2/20 model

11
• Households are in need of balance sheet repair— Unlike other recessions, households have tremendous leverage — Work outs, particularly following bankruptcy, take a long time
• Resistance to Technology might lose to prudence— Desire to reduce costs will speed up technological implementation— Stable companies will take advantage of low rates and issue debt— Research, advisory and distribution will be rewarded (I admit, I’m biased)
• The promises of Technology might actually arrive— Eliminating the middlemen (Disintermediation)— Competitive price wars on customized products/services
• Technology corporate earnings are the centerpiece— At the start of the recession technology represented 16% of earnings— By the second half of 2010 it is forecasted to represent over 25% of earnings
Ten years after the bubble, Technology is thriving
Changing Consumer HabitsReluctantly spending, deflationary pressure persists
Source: Invesco Ltd., Standard & Poor’s as of April, 2009

12
• Frantic pace of change across multiple industries — Technological, regulatory and consumer changes happening simultaneously— Smaller companies can be nimble and adapt quickly
• Corporate America has their own credit crisis…Credibility!— Lack of leadership exists in many industries— Some innovative entrepreneurs will grow quickly and fill the void
• Conceptualize “The Law of Large Numbers” as an edge — A small number of companies will get it right and dominate the next regime— Investing in a large count of small companies increases your chances— Russell 2000 overlaid with active portfolio management is a great example
• From the entrepreneurs’ perspective downside risk is limited
— Their ability to get a job is limited right now— Very talented employees willing to work for low wages
Corporate activity in small cap (& beyond) is likely to riseSource: Invesco Ltd.
The Case for Small Cap in 2009 & 2010 Unlike the past, growth might not be the driver

13
• Horizontal activity has already picked up— Similar companies merging to reduce costs— Market sizes are shrinking, requiring a resizing
• Vertical activity will likely follow in 2009-2011 — Post horizontal activity, there are likely to be a handful of very large vs. tiny — Smaller companies might find selling to a customer easier than competing
• First mover advantage refuses to go away— The opportunity to select your partner is limited to first movers— Strategic decision to remain small might result in being crowded out
• Characteristics likely to attract bidders— Cash on hand and/or over funded pension plan— Stable, blue collar customer base— Low overhead, global operation
At long last, good news for the financial sectorThis Source: Invesco Ltd., Fortune
Cost Reduction Through M&A ActivityExpect proactive behavior from management

U.S. Market Neutral

15
US Market NeutralAttributes that could make this a compelling investment now
• High volatility implies a wide range of expected returns— This is an optimal time for active management
• Utilize all of the research you’re already paying for— Research findings can be used to identify long and short positions— The net result is a higher ‘transfer coefficient’— Performance attribution should demonstrate the level of skill vs. luck
• Ability to produce similar return patterns with lower volatility— Combining fundamental research with quantitative portfolio construction— Not all quants are created equal
• Reduces the need to time the markets— Risk controls are used to reduce sector, size and style bets

16
Investment Process OverviewTransparent, logical, risk focused approach
Trading
Stock Selection
Risk Assessment
Portfolio Construction
Portfolio
Universe DevelopmentDetermine investable universe appropriate to strategy
Add value through systematically
ranking stocks in universe
Identify and measure risk of all stocks in universe to avoid unintended exposures
Preserve value-added through cost-effective trading
Construct portfolio to meet desired return/risk characteristics
For Illustrative Purposes Only

17
U.S. Market Neutral CashComposite Performance Calendar Year And Annualized Returns (Gross)
7.8
18.9
8.27.0
-1.1
6.4
-3.0
5.0
11.1
1.8
4.7 4.83.0
1.2 1.1 1.7
4.16.0
4.75.0
-5
0
5
10
15
20
25
2008 2007 2006 2005 2004 2003 2002 2001 2000 1999
Market Neutral Cash
Citigroup 90-Day T-Bill
Percent
Annualized Periods Through December 2008 Q4 1 year 3 years 5 Years 10 Years
Inception 3/31/98
Market Neutral Cash 1.25% 7.78% 10.40% 9.26% 6.37% 7.12%
Citi 90-Day T-Bill 0.25% 1.80% 3.76% 3.19% 3.30% 3.41%
Excess Return 1.00% 5.98% 6.64% 6.17% 3.07% 3.71%
This presentation of Invesco is supplemental information to the GIPS® compliant presentations. Performance results do not reflect the deduction of investment advisory fees. A client’s actual return will be reduced by the advisory fees and any other expenses which may be incurred in the management of an investment advisory account. Past performance is not a guarantee of future results. Please see the performance & notes on page 17 for more information.

18
Invesco Market Neutral Cash CompositeSchedule of Investment Performance
Gross Rate ofReturn
(%)
Net Rate ofReturn
(%)
BenchmarkReturn
(%)
Numberof
Portfolios
Composite Assets (USD
millions)
Total FirmAssets (1)
(USD billions)
Composite Dispersion
(%)
2008 7.85 6.78 1.80 2 403 254.6 n/a2007 5.03 3.99 4.74 3 591 328.6 n/a2006 18.85 17.68 4.76 3 209 243.8 0.172005 8.16 7.09 3.00 4 183 174.6 0.052004 7.02 5.95 1.24 7 210 168.0 0.222003 (1.06) (2.04) 1.07 7 198 161.4 0.052002 6.39 5.34 1.70 5 236 66.6 0.182001 (2.99) (3.95) 4.09 6 318 65.1 0.232000 5.03 3.99 5.96 8 613 66.8 0.861999 11.11 10.01 4.74 5 801 19.4 n/a1998 (9 Months) 12.87 12.03 3.72 1 113 17.7 n/a
Annualized Compound Rates of Return Ending December 31, 2008: 1 Year 7.85 6.78 1.80 3 Year 10.42 9.33 3.76 5 Year 9.28 8.20 3.10Since Inception (3/31/1998) 7.12 6.06 3.41

19
Invesco Market Neutral Cash Composite NotesPerformance Notes: GIPS® Compliant
Invesco Worldwide has prepared and presented this report in compliance with the Global Investment Performance Standards (GIPS®).
Notes: 1 Invesco Worldwide(“The Firm”) manages a broad array of investment strategies around the world. The Firm comprises all Invesco firms outside of North America, combined with two
major Invesco firms within the United States, Invesco Institutional (N.A), Inc. (“IINA”), and Invesco Global Asset Management (N.A.), Inc. (“IGNA”). The Firm was incepted on 1st January 2003. For periods prior to 1st January 2006, the Firm excluded the managed account businesses within IINA and IGNA. From that date forward, these portfolios are included within the Firm definition. During 2006, the Firm completed a project to bring its stable value portfolios into compliance retroactively effective from 1st January 2001. During 2007, the Firm incorporated the fixed income business of Invesco Aim, an affiliate of IINA and IGNA, into its operating structure and currently includes this business, with the exception of the fixed income portion of balanced accounts managed by Invesco Aim, which are excluded from firm assets, within its Firm definition. Historic assets under management prior to 2006 and 2007, respectively, have not been restated to reflect these extensions of the Firm definition. IINA and IGNA were verified from 1st January 2001 and 1st January 1995, respectively. The ex-North America Invesco firms (previously defined separately for performance reporting purposes as “Invesco Global”) were verified from 1st January 1997. All verifications have been completed through 31 December 2007. Composite history and Firm assets prior to 1st January 2003 are those of its respective components. All entities within the Firm are directly or indirectly owned by Invesco Ltd. GIPS compliant firms whose assets are managed by subsidiaries of Invesco Ltd. are Invesco Worldwide, Invesco Aim Private Asset Management, Inc., AIM Trimark (which anticipates changing its name to Invesco Trimark by 31st December 2008), Invesco Aim U.S., and Atlantic Trust. Invesco Senior Secured Management, Inc. and Invesco Private Capital, Inc. are affiliates of the Firm. Each is an SEC registered investment adviser and is marketed as a separate entity. Their assets are excluded from total Firm assets.
2 The U.S. Market Neutral Cash is a large capitalization, market neutral strategy which utilizes a fundamentally based stock selection process. This process is combined with rigorous risk control to create an attractive return/risk product. The portfolio’s value added is a function of the return spread between the long and short portfolios and our ability to minimize transaction costs through state-of-the-art trading techniques. The goal of product is to outperform 90-day Treasury bills by 4% before fees, while maintaining a tracking error of less than 5%. The success of this process has been achieved through a disciplined approach to security selection combined with rigorous risk and cost control. The composite name was changed from Market Neutral Cash to U.S. Market Neutral Cash in October 2008.
3 The Composite returns are benchmarked to the Citigroup Treasury Bill 3 Month Index. The benchmark is used for comparative purposes only and generally reflects the risk or investment style of the product. Investments made by the Firm for the portfolios it manages according to respective strategies may differ significantly in terms of security holdings, industry weightings, and asset allocation from those of the benchmark. Accordingly, investment results and volatility will differ from those of the benchmark.
4 Valuations and portfolio total returns are computed and stated in U.S. Dollars. The firm consistently values all portfolios each day on a trade date basis. Portfolio level returns are calculated as time-weighted total returns on daily basis. Accrual accounting is used for all interest and dividend income. Past performance is not an indication of future results.
5 Composite dispersion is measured by the standard deviation across asset-weighted portfolio returns represented within the composite for the full year.
6 Gross-of-fee performance results are presented before management and custodial fees but after all trading commissions and withholding taxes on dividends, interest and capital gains, when applicable. Net-of-fee performance results are calculated by subtracting the management fee of 100 basis points per annum on all assets. Alternative fee structures, including performance incentive fees, are available.
7 The minimum portfolio size for the Composite is $2,000,000.
8 The composite creation date is March 31, 1998.
9 A complete list and description of Firm composites and performance results is available upon request. Additional information regarding policies for calculating and reporting returns is available upon request.

Invesco Ltd.
Partnership For Financial Security
21
Mission: Helping people worldwide build their financial security
Who We AreA global leader in investment management
• We’re one of the world’s leading independent global investment management firms
• We draw on the strength of many resources:— $403 (U.S.) billion in assets under management— Client support in 20 countries serving clients in more than 100 countries— 13 specialized investment centers— More than 5,000 employees worldwide— More than 500 investment professionals
• We deliver on a single focus: investment management
• We have the leadership, resources and integrity to look after our clients’ interests:
— Long history of managing assets for clients on a global basis— Publicly traded on New York Stock Exchange with $8.1 billion in market capitalization
All data as of December 30, 2008, unless otherwise noted. Source: Invesco Ltd.

22
Differentiators
Delivering the combined power of our distinctive worldwide investment management capabilities globally, we have:
Diversified Investments• Distinctive investment teams• Disciplined investment
processes• Global product breadth
Global Reach• Distributional and operational
strength and breadth• Local delivery and knowledge• Independent, objective
perspectives
Client Focus• Client relationship driven• Experienced, consultative
professionals• Needs-based innovation
Client Benefits
Disciplined Investment Process
Clearly articulated investment disciplines aligned with client expectations and underpinned by diligent oversight and rigorous quality control processes
Superior Client Service
Consistent, superior service delivered through exceptional support, access and responsiveness
Organizational Strength
The leadership, resources and integrity to look after our clients’ interests
Mission Helping people worldwide build their financial security
CorporatePrinciples
● We are passionate about our clients’ success
● We earn trust by acting with integrity
● People are the foundation of our success
● Working together, we achieve more
● We believe in the continuous pursuit of performance excellence
Our Business TodayInvesco mission, principles and differentiators
22

23
• Institutional separate accounts• Collective trusts• Mutual funds (onshore &
offshore)• Exchange-traded funds (ETFs)• Private placements• Sub-advised• SMA/UMA• Variable insurance funds
Delivered the Way Our Clients Want
Invesco Delivers Investment Strategies That Meet Our Clients’ Diverse Needs
Diversified Investment Strategies
Equity • Market cap• Investment style• Global/regional/single
country• Developed/Emerging• Sector• Quantitative
Asset Allocation• Traditional balanced• Target maturity• Target risk
Fixed Income and Cash• Duration• Quality• Sector• Global/regional/single
country• Developed/Emerging• Taxability
Alternatives• Real Estate
– Public real estate securities– Private direct real estate– US, Asian, European, Global
• Private Equity– Direct
Distressed– Fund of Funds
Buyout, VC, Emerging• Absolute Return
− Market Neutral− GTAA− Active Currency− Multi-strategy− Alternative Beta
• Directional Long/Short (130/30)• Financial Structures
− CDO/CLO/CSO− Opportunistic
• Commodities/ Natural Resources• Customized solutions
− Portable alpha− Liability-driven
ETFs are not diversified..

24
Invesco Aim
Investment focus: U.S., international and global equitiesAUM: $38.4 billion Invesco Trimark
Investment focus: Canadian equities, fixed income and global value
AUM: $19.4 billion
Invesco Asia-Pacific
Investment focus: Asian Ex-Japanese, Greater Chinese, Japanese and Australian equitiesAUM: $13.7 billion
Invesco Global Strategies
Investment focus: Global Equity (Global, non-U.S., and Emerging Market equities)Quantitative Equity (quantitative active, enhanced and long/short strategies)Global Asset Allocation (tactical asset allocation, alternative beta, and multi-asset class solutionsAUM: $30.1 billion
Invesco Real Estate
Investment focus: Global direct real estate investing and public real estate investingAUM: $23.5 billion
Invesco Worldwide Fixed Income
Investment focus: Money market, stable value, global fixed income and alternatives/financial structuresAUM: $150.7 billionInvesco
PowerShares
Investment focus: ETFsAUM: $9.2 billion
Atlantic Trust
Investment focus: High-net-worth multimanagementAUM: $13.4 billion
Invesco Perpetual
Investment focus: U.K. equities, fixed income and European equitiesAUM: $50.0 billion
Invesco Private Capital
Investment focus: Fund of funds and venture capital private equitiesAUM: $1.9 billion
WL Ross
Investment focus: Distressed and restructuring private equitiesAUM: $6.9 billion
Data as of December 31, 2008.
The Value We Deliver To Our ClientsSpecialized investment capabilities globally
One of Invesco’s greatest competitive advantages is the combined power of our distinctive worldwide investment management capabilities.
With offices worldwide, capabilities in virtually every asset class and investment style, a disciplined approach to investment management and a commitment to the highest standards for performance and client service, Invesco is uniquely positioned to compete in our evolving world.
24