presented by: -rahultolia -rajnishupadhaya -arnabdasweb.iitd.ac.in/~arunku/files/cel899_2011/cel899...
TRANSCRIPT
Presented By:-Vaibhav Kumar-Rahul Tolia-Rajnish Upadhaya-Arnab Das
� Pharmaceuticals are produced and used in increasingly larger amounts every year.
� The presence of pharmaceutical chemicals in the environment is a matter of concern due to
� lipophilic (affinity for lipids)
� non-biodegradability nature
� their biological activities
� The objective is to carry out the risk assessment analysis (w.r.t human health and ecological impact) for pharmaceuticals.
� The target chemical shall be PARACETAMOL.
� The scope is to constitute the identification of harmful effects of the compound 4-acetaminophenol present in paracetamol.
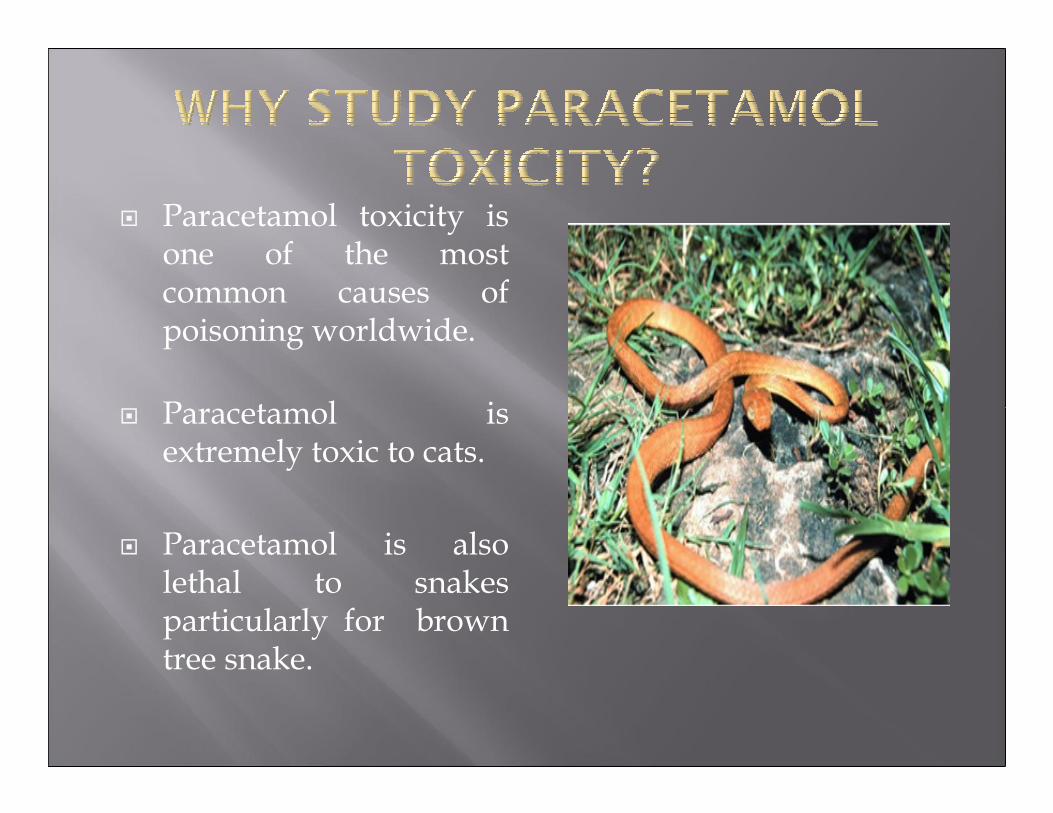
� Paracetamol toxicity is one of the most common causes of poisoning worldwide.
� Paracetamol is extremely toxic to cats.
� Paracetamol is also lethal to snakes particularly for brown tree snake.
� Paracetamol is used as an analgesic and antipyretic.
� Dosage for humans – 325 to 1000 mg/4000mg
in 24 Hrs
� Overdose – 24 standard tablets or 150 mg/kg body weight can cause liver damage in 24 Hrs
� The overdose threshold may be lowered in a person taking certain prescription medicines, or a person who is an alcoholic or is seriously undernourished.
� HUMANS
� Study of patients with cancer of renal pelvis and ureter
� No statististical significance/co-rrelation
� ANIMALS
� Paracetamol was tested for carcinogenicity by oral administration in mice and rats.
� Paracetamol did not promote urinary bladder carcinogenesis in rats and reduced the incidence of intestinal tumours
-NO evidence of Carcinogenicity
� Reproductive and developmental effects (Humans)
No effect of toxicity observed in pregnant women as well as in infants with paracetamol overdose
� Genetic and related effects
The ability of paracetamol to induce chromosomal aberrations in peripheral lymphocytes was studied and no effect was found
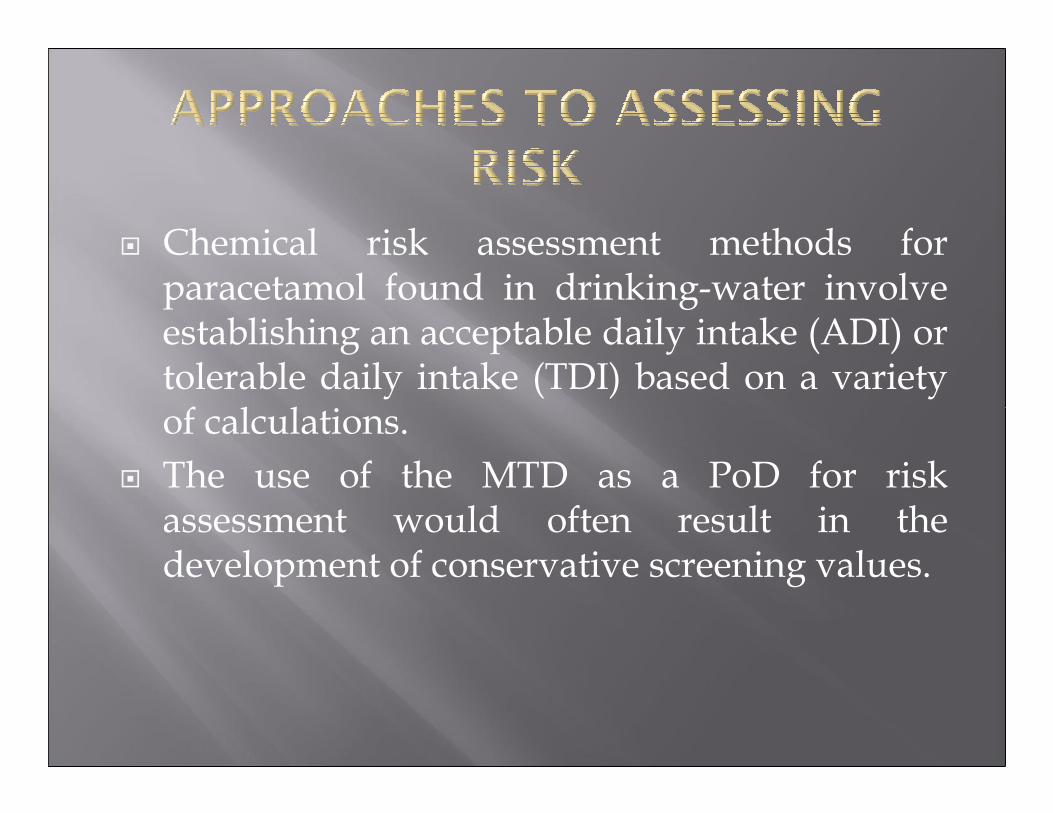
� Chemical risk assessment methods for paracetamol found in drinking-water involve establishing an acceptable daily intake (ADI) or tolerable daily intake (TDI) based on a variety of calculations.
� The use of the MTD as a PoD for risk assessment would often result in the development of conservative screening values.
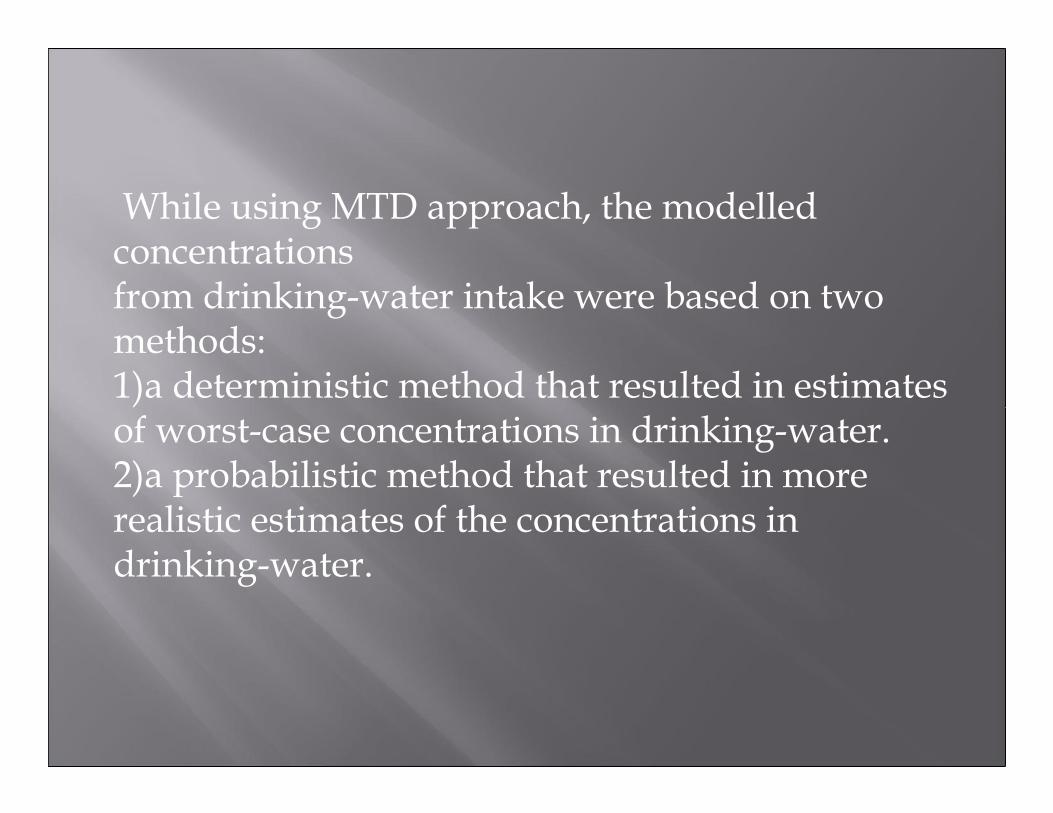
While using MTD approach, the modelledconcentrations from drinking-water intake were based on two methods:1)a deterministic method that resulted in estimates of worst-case concentrations in drinking-water.2)a probabilistic method that resulted in more realistic estimates of the concentrations in drinking-water.
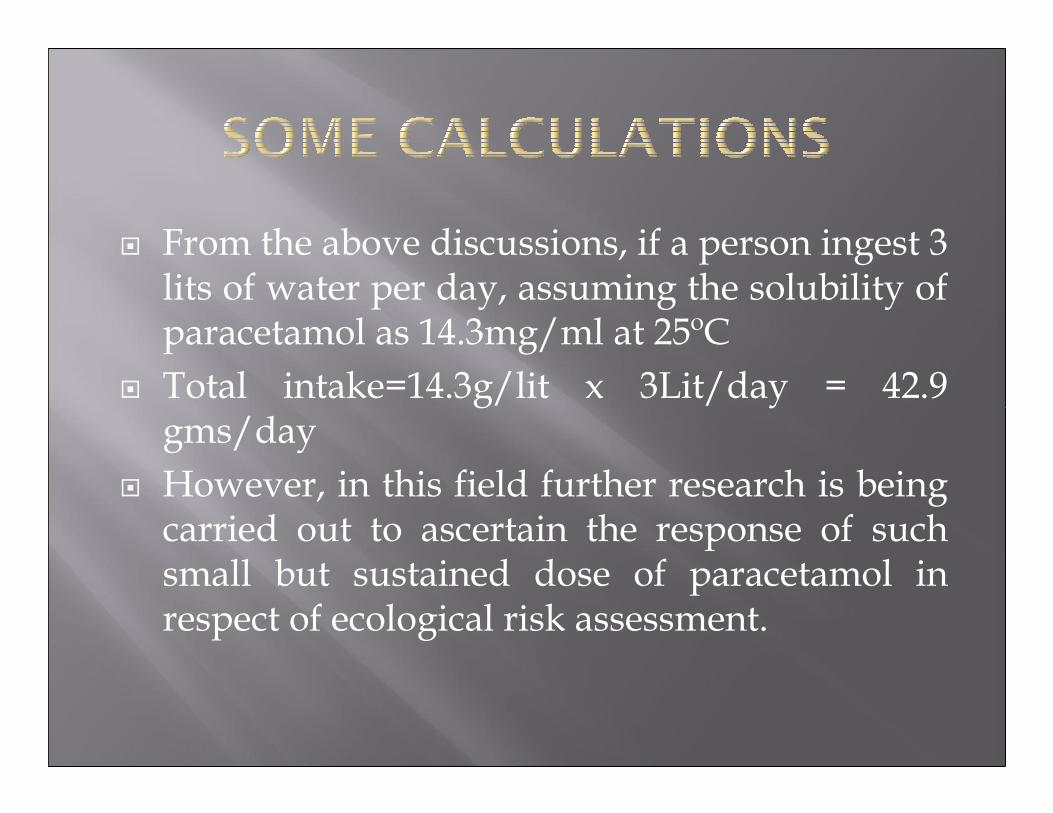
� From the above discussions, if a person ingest 3 lits of water per day, assuming the solubility of paracetamol as 14.3mg/ml at 25ºC
� Total intake=14.3g/lit x 3Lit/day = 42.9 gms/day
� However, in this field further research is being carried out to ascertain the response of such small but sustained dose of paracetamol in respect of ecological risk assessment.
� Although current published risk assessments indicate that trace concentrations Of Paracetamol in drinking-water are very unlikely to pose risks to human health.
� Research could look into improvement to risk assessment methodology to address concerns related to pharmaceuticals mixtures and the effects of chronic, low-level exposure to pharmaceuticals, including exposure of sensitive subpopulations, such as pregnant women and patients with particular diseases and medical treatments
� Routine monitoring programmes for paracetamol in water sources and Drinking water to reduce very low concentrations of pharmaceuticals in drinking-water are not deemed necessary due to the limited public health benefits.


HUMAN HEALTH RISK
ASSESSMENT OF JAPAN
NUCLEAR EXPLOSION
Guided by
Dr. Arun Kumar
CEL 899
Submitted by
Arshath A Rahim
Muhammad Mahad S
Vaishakh B
Saurabh Rai
17
OVERVIEW� Introduction
�Objective and Scope of study
� Literature Survey
� Data collection
� Models – Solid cancer and Leukemia
�Risk assessment
� Process
�Risk Management and communication
� Sensitivity Analysis
�Conclusion
�Reference
18
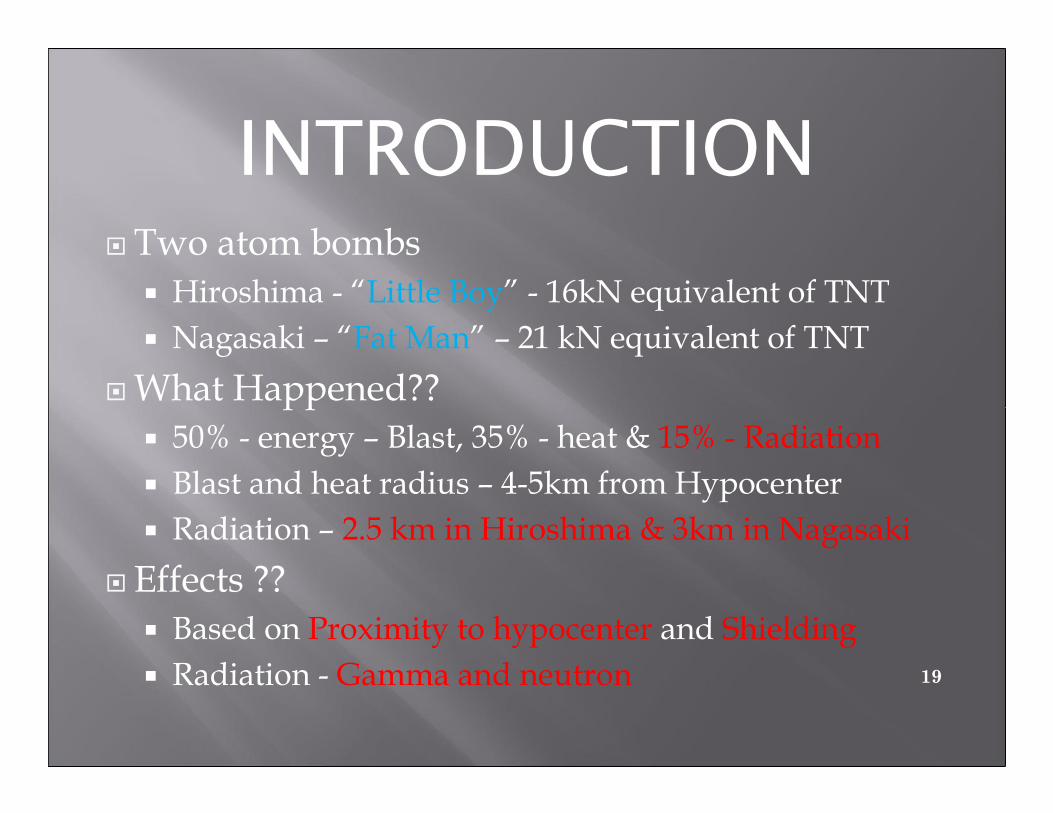
INTRODUCTION� Two atom bombs
� Hiroshima - “Little Boy” - 16kN equivalent of TNT
� Nagasaki – “Fat Man” – 21 kN equivalent of TNT
�What Happened??
� 50% - energy – Blast, 35% - heat & 15% - Radiation
� Blast and heat radius – 4-5km from Hypocenter
� Radiation – 2.5 km in Hiroshima & 3km in Nagasaki
� Effects ??
� Based on Proximity to hypocenter and Shielding
� Radiation - Gamma and neutron 19
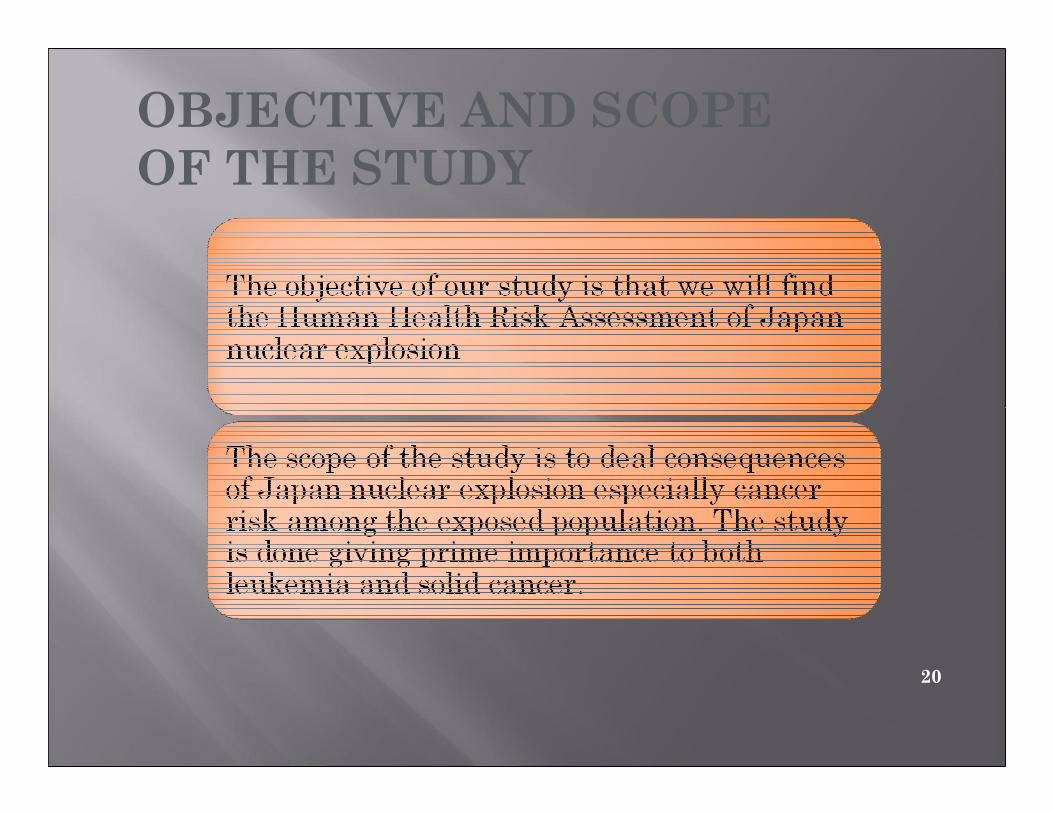
OBJECTIVE AND SCOPE
OF THE STUDY
20

LITERATURE SURVEY
Radiation effects- (Source: Evan et. al. (2011))
� LeukemiaRarer form of cancer
Radiation-induced leukaemia occurred 2-3 years after exposure
risk of leukaemia reached a peak within 6-8 years after exposure and has decreased with time
� Solid Cancerthe major types of cancer, including cancers of
the stomach, lung, liver, colon, bladder, breast, ovary, thyroid, and skin
Risks of solid cancers increase in direct proportion to dose
percentage increase in risk was greater for those exposed as children, at least in the early
21

•Non Cancer diseases
•significant excess risks for cardiovascular, digestive,
respiratory and non-malignant thyroid diseases
•diseases most specifically associated with aging
(arteriosclerosis, senile cataract, dementia, osteoporosis,
arthritis),the clearest evidence of increased risk with
radiation exposure is for arteriosclerosis22
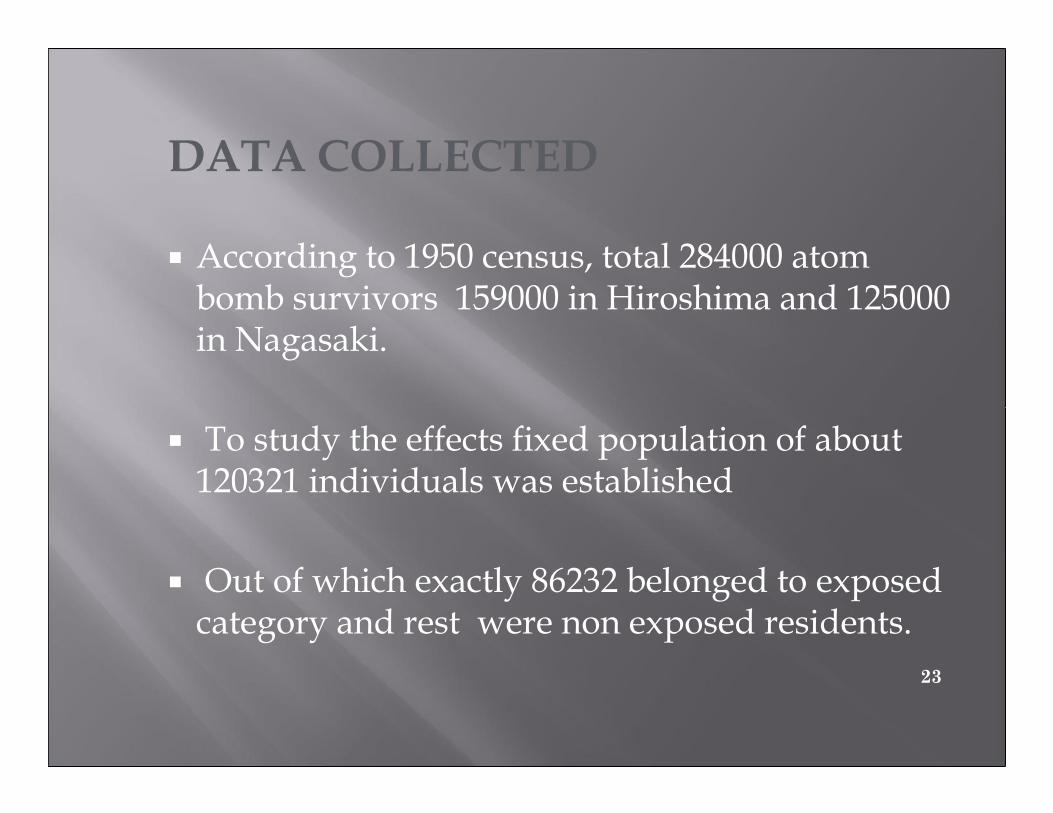
DATA COLLECTED
� According to 1950 census, total 284000 atom bomb survivors 159000 in Hiroshima and 125000 in Nagasaki.
� To study the effects fixed population of about 120321 individuals was established
� Out of which exactly 86232 belonged to exposed category and rest were non exposed residents.
23
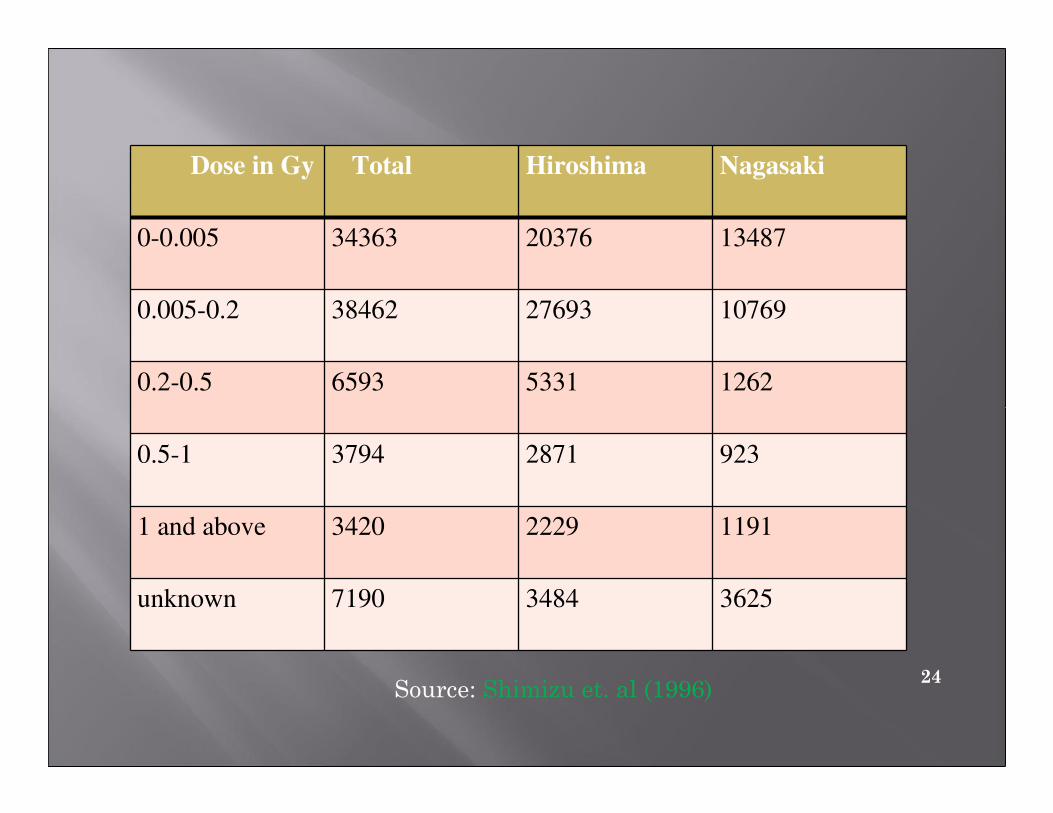
Dose in Gy Total Hiroshima Nagasaki
0-0.005 34363 20376 13487
0.005-0.2 38462 27693 10769
0.2-0.5 6593 5331 1262
0.5-1 3794 2871 923
1 and above 3420 2229 1191
unknown 7190 3484 3625
24Source: Shimizu et. al (1996)
MODELS USED
� Linear model
� Linear quadratic model
� With constant α,β and γ parameters
� With variable α,β and γ considering Age and sex of the
population
�General dose response model of cancer -
radiation
� Considering the last exponential stage
� Similar to linear quadratic model with variable
25
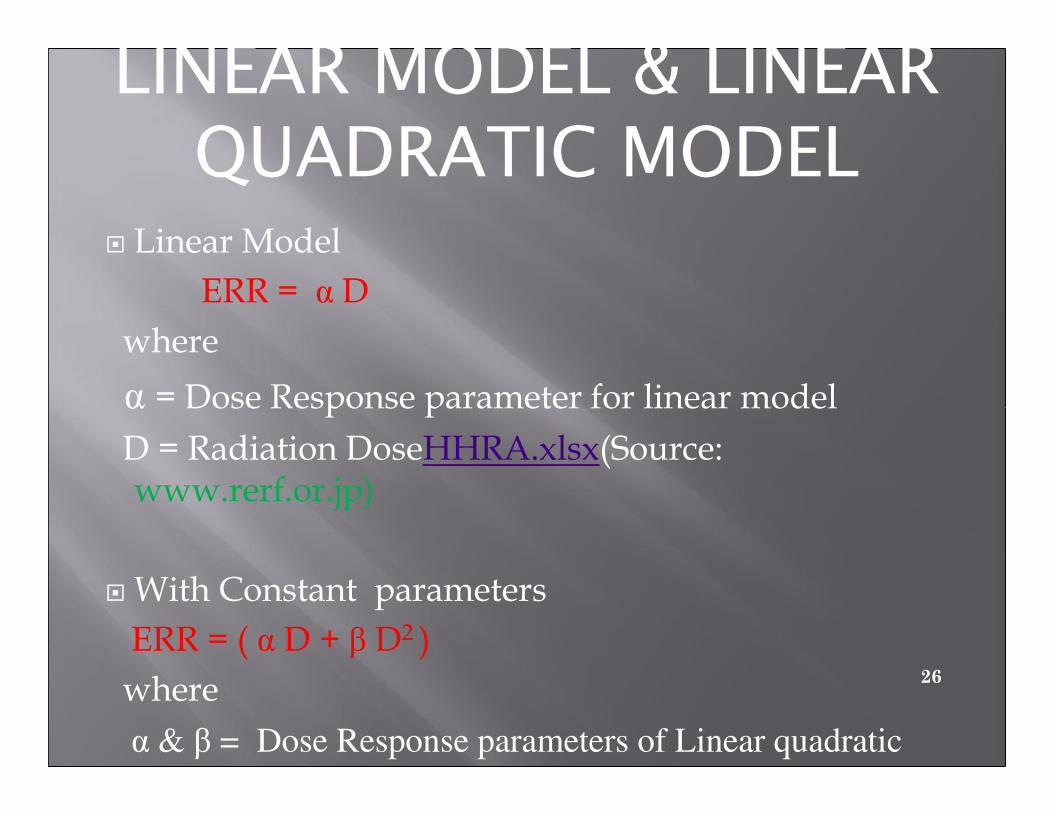
LINEAR MODEL & LINEAR
QUADRATIC MODEL� Linear Model
ERR = α D
where
α = Dose Response parameter for linear model
D = Radiation DoseHHRA.xlsx(Source: www.rerf.or.jp)
� With Constant parameters
ERR = ( α D + β D2 )
where
α & β = Dose Response parameters of Linear quadratic
model
26
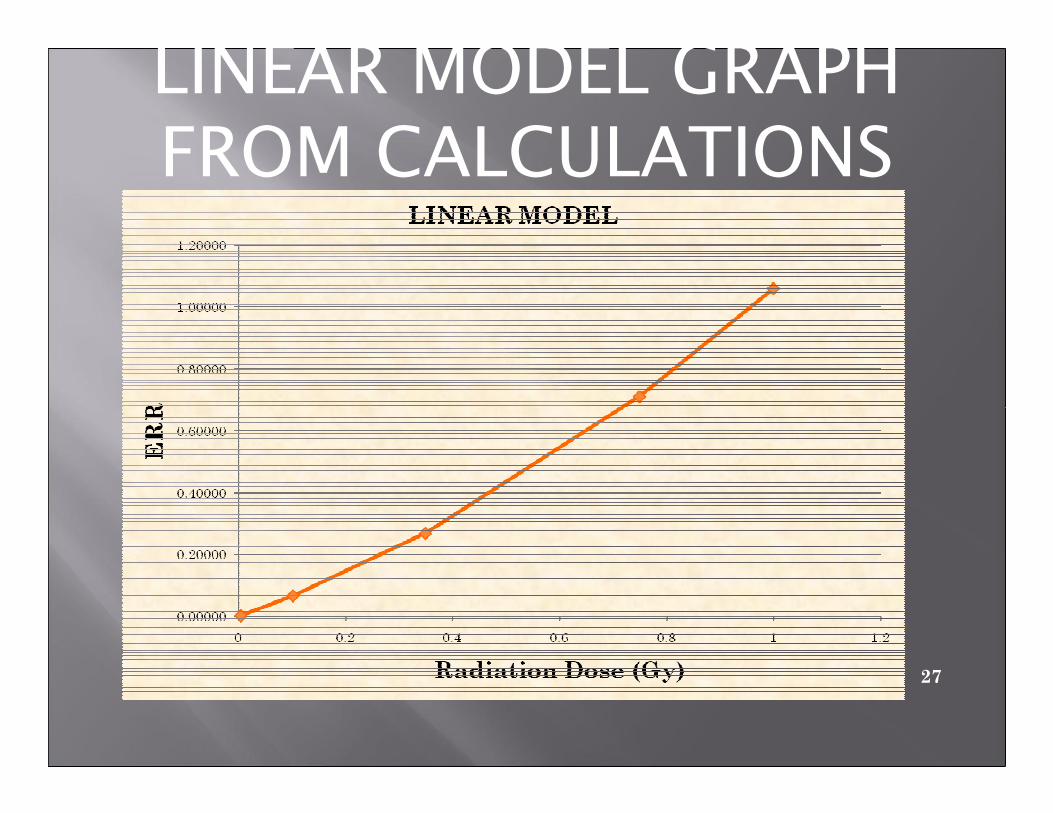
LINEAR MODEL GRAPH
FROM CALCULATIONS
27
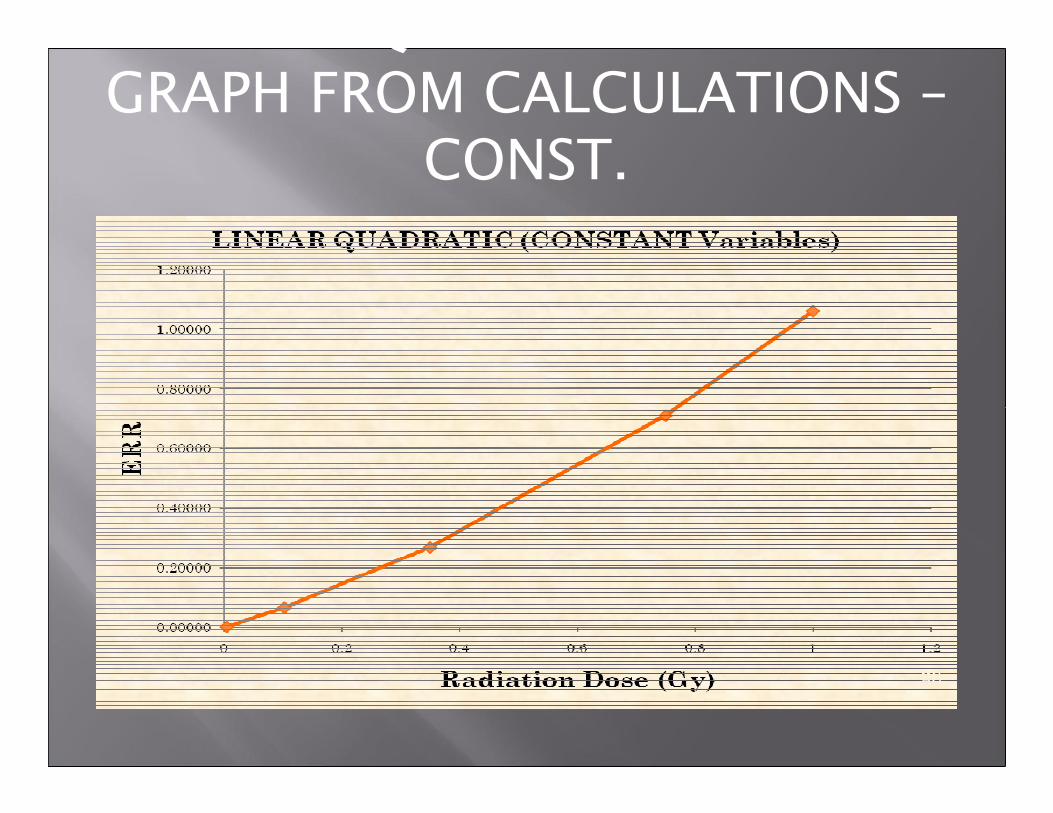
LINEAR QUADRATIC MODEL
GRAPH FROM CALCULATIONS –
CONST.
28
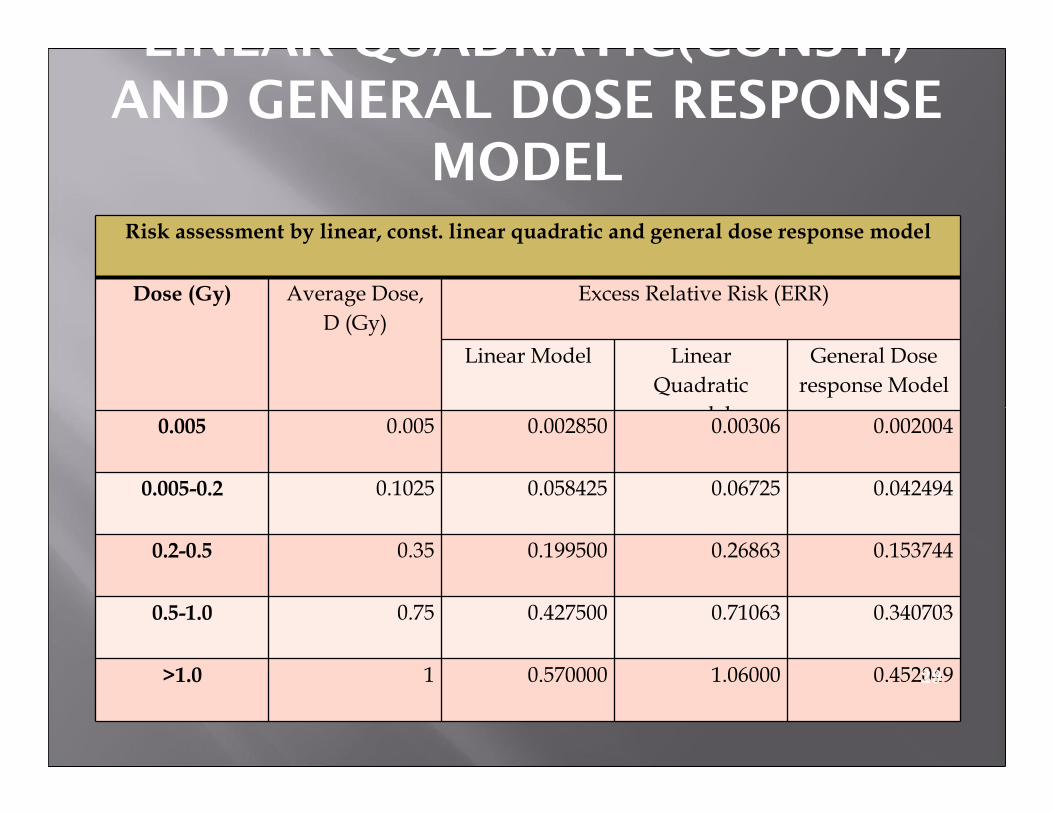
LINEAR QUADRATIC(CONST.)
AND GENERAL DOSE RESPONSE
MODELRisk assessment by linear, const. linear quadratic and general dose response model
Dose (Gy) Average Dose,
D (Gy)
Excess Relative Risk (ERR)
Linear Model Linear
Quadratic
model
General Dose
response Model
0.005 0.005 0.002850 0.00306 0.002004
0.005-0.2 0.1025 0.058425 0.06725 0.042494
0.2-0.5 0.35 0.199500 0.26863 0.153744
0.5-1.0 0.75 0.427500 0.71063 0.340703
>1.0 1 0.570000 1.06000 0.45204929

LINEAR QUADRATIC
MODEL�With Variable parameters of α,β and γ with age
and sex (Source: Preston et. al. (1994))
�Male population
� Age 0- 19 years
ERR = 0.33(D + 0.79D2) e(-0.17(t-25))
� Age 20 – 39 years
ERR = 0.48(D + 0.79D2) e(-0.13(t-25))
� Age > 40 years
ERR = 1.31(D + 0.79D2) e(-0.07(t-25))
where α,β and γ are as in the order given in the
equation
30
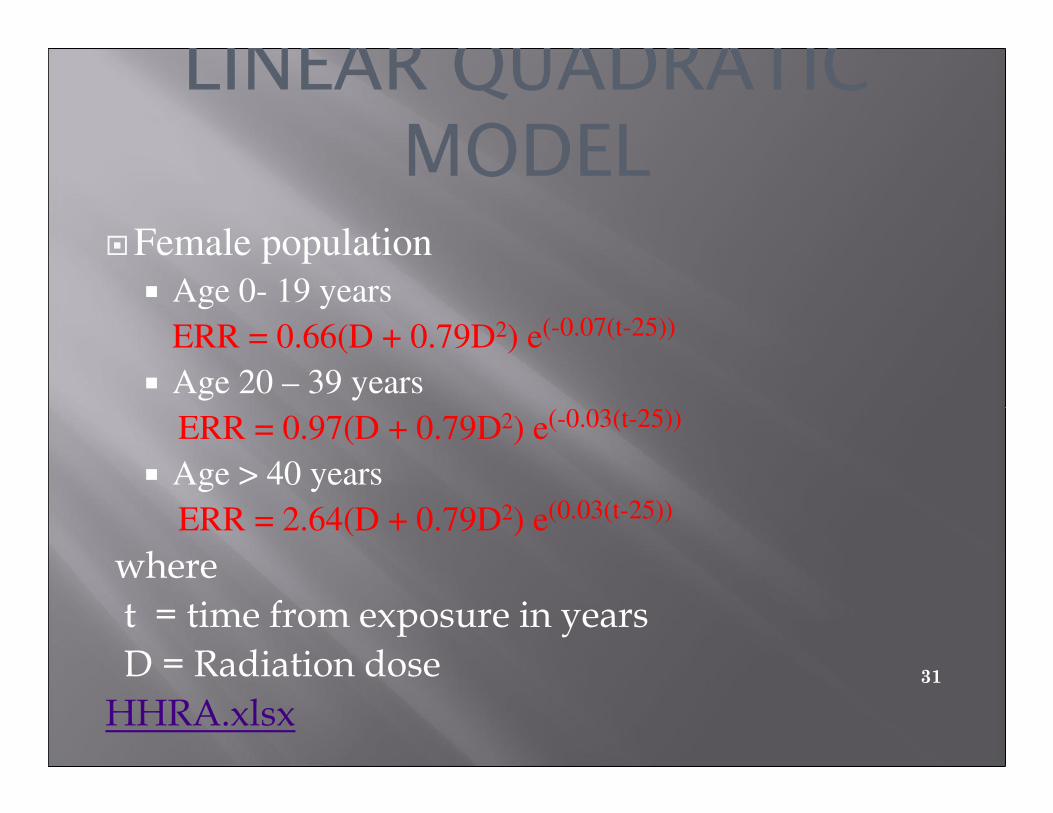
LINEAR QUADRATIC
MODEL�Female population
� Age 0- 19 years
ERR = 0.66(D + 0.79D2) e(-0.07(t-25))
� Age 20 – 39 years
ERR = 0.97(D + 0.79D2) e(-0.03(t-25))
� Age > 40 years
ERR = 2.64(D + 0.79D2) e(0.03(t-25))
where
t = time from exposure in years
D = Radiation dose
HHRA.xlsx31
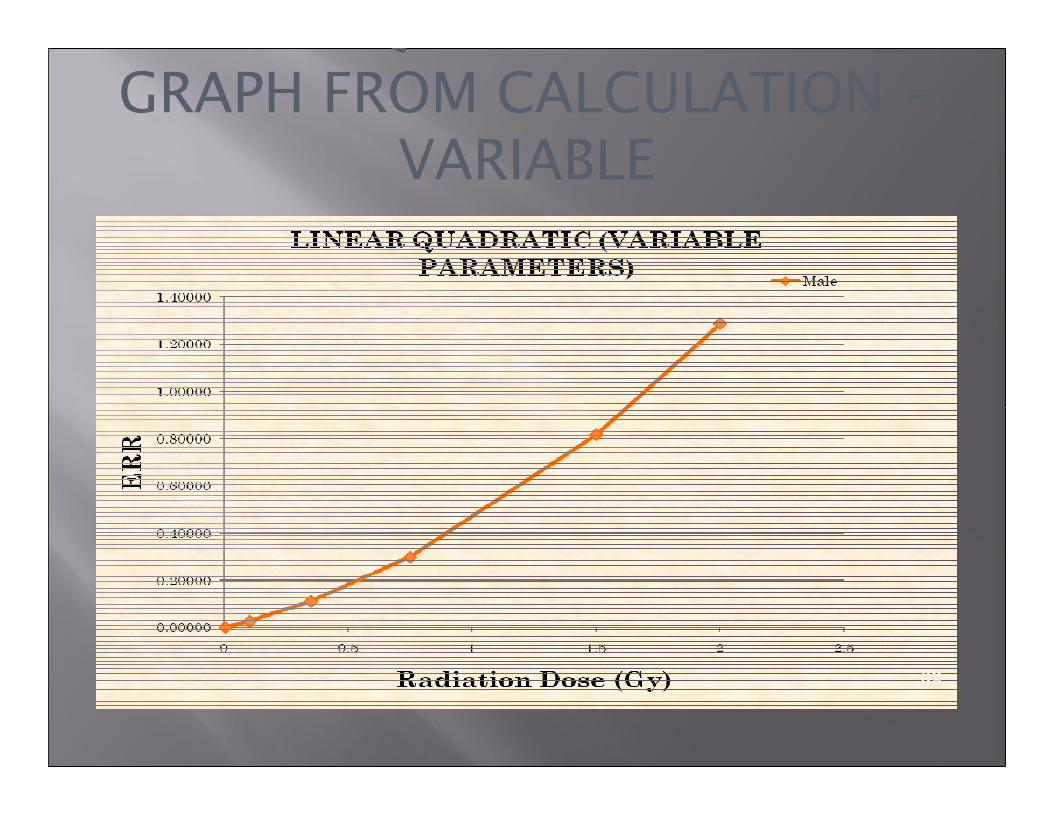
LINEAR QUADRATIC MODEL
GRAPH FROM CALCULATION -
VARIABLE
32
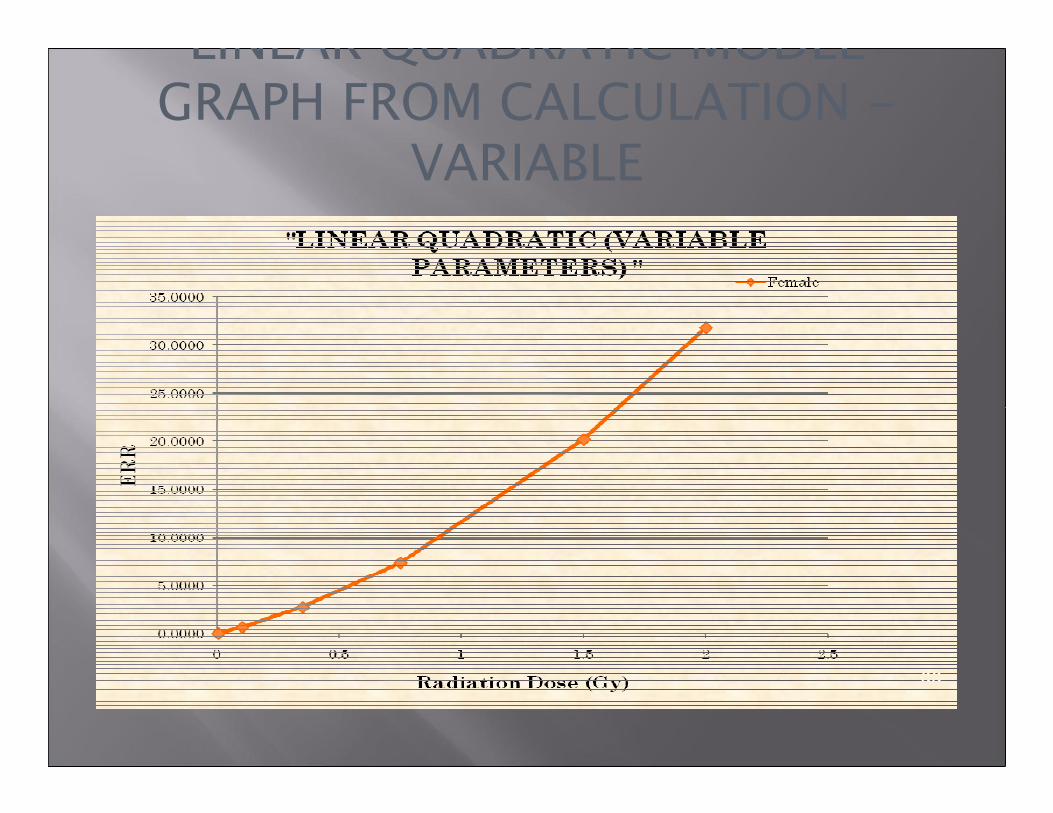
LINEAR QUADRATIC MODEL
GRAPH FROM CALCULATION -
VARIABLE
33
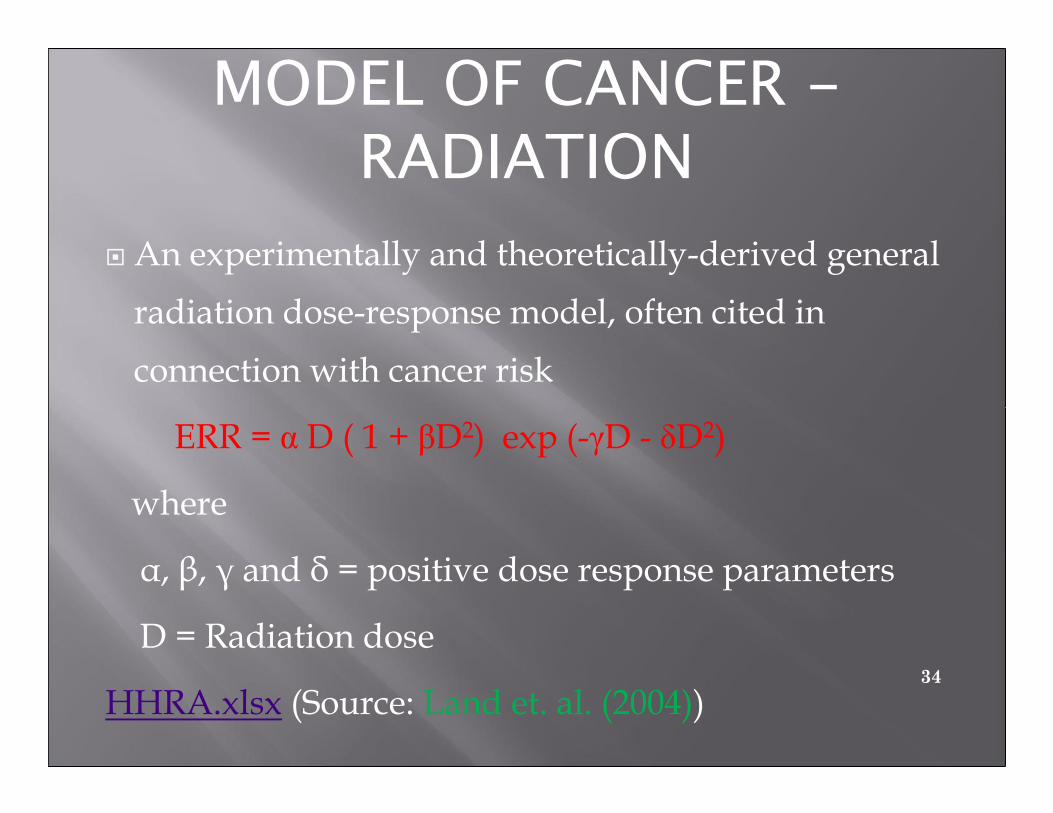
MODEL OF CANCER -
RADIATION
� An experimentally and theoretically-derived general
radiation dose-response model, often cited in
connection with cancer risk
ERR = α D ( 1 + βD2) exp (-γD - δD2)
where
α, β, γ and δ = positive dose response parameters
D = Radiation dose
HHRA.xlsx (Source: Land et. al. (2004))34

GENERAL DOSE RESPONSE
MODEL FOR ALL CANCERS –
FROM CALCULATIONS
35
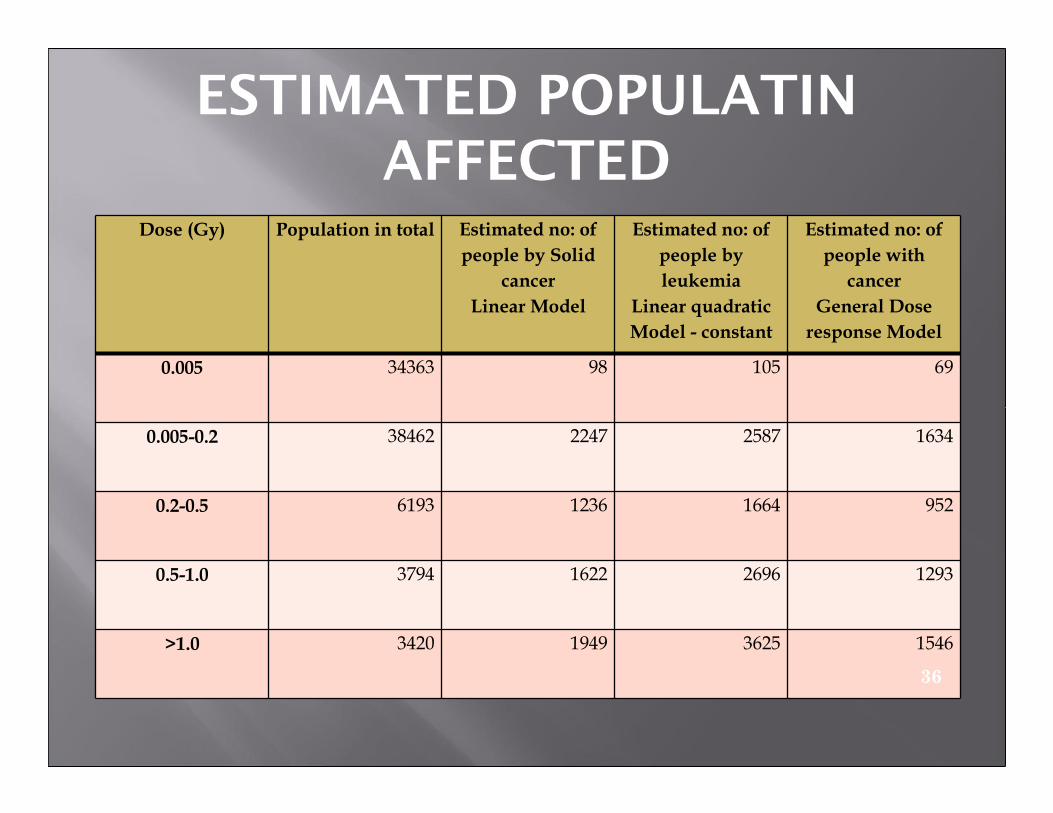
ESTIMATED POPULATIN
AFFECTEDDose (Gy) Population in total Estimated no: of
people by Solid
cancer
Linear Model
Estimated no: of
people by
leukemia
Linear quadratic
Model - constant
Estimated no: of
people with
cancer
General Dose
response Model
0.005 34363 98 105 69
0.005-0.2 38462 2247 2587 1634
0.2-0.5 6193 1236 1664 952
0.5-1.0 3794 1622 2696 1293
>1.0 3420 1949 3625 1546
36
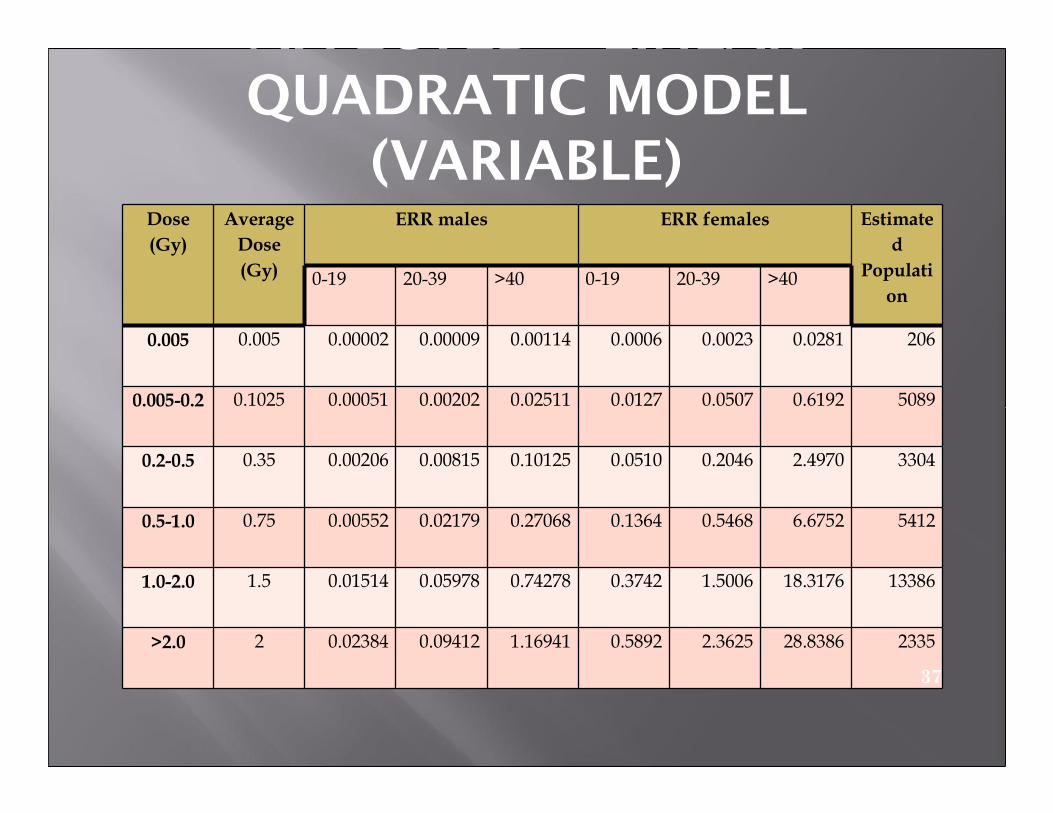
AFFECTED – LINEAR
QUADRATIC MODEL
(VARIABLE)Dose
(Gy)
Average
Dose
(Gy)
ERR males ERR females Estimate
d
Populati
on0-19 20-39 >40 0-19 20-39 >40
0.005 0.005 0.00002 0.00009 0.00114 0.0006 0.0023 0.0281 206
0.005-0.2 0.1025 0.00051 0.00202 0.02511 0.0127 0.0507 0.6192 5089
0.2-0.5 0.35 0.00206 0.00815 0.10125 0.0510 0.2046 2.4970 3304
0.5-1.0 0.75 0.00552 0.02179 0.27068 0.1364 0.5468 6.6752 5412
1.0-2.0 1.5 0.01514 0.05978 0.74278 0.3742 1.5006 18.3176 13386
>2.0 2 0.02384 0.09412 1.16941 0.5892 2.3625 28.8386 2335
37

GRAPH SHOWING ESTIMATED
POPULATION BY VARIOUS
METHODS
38
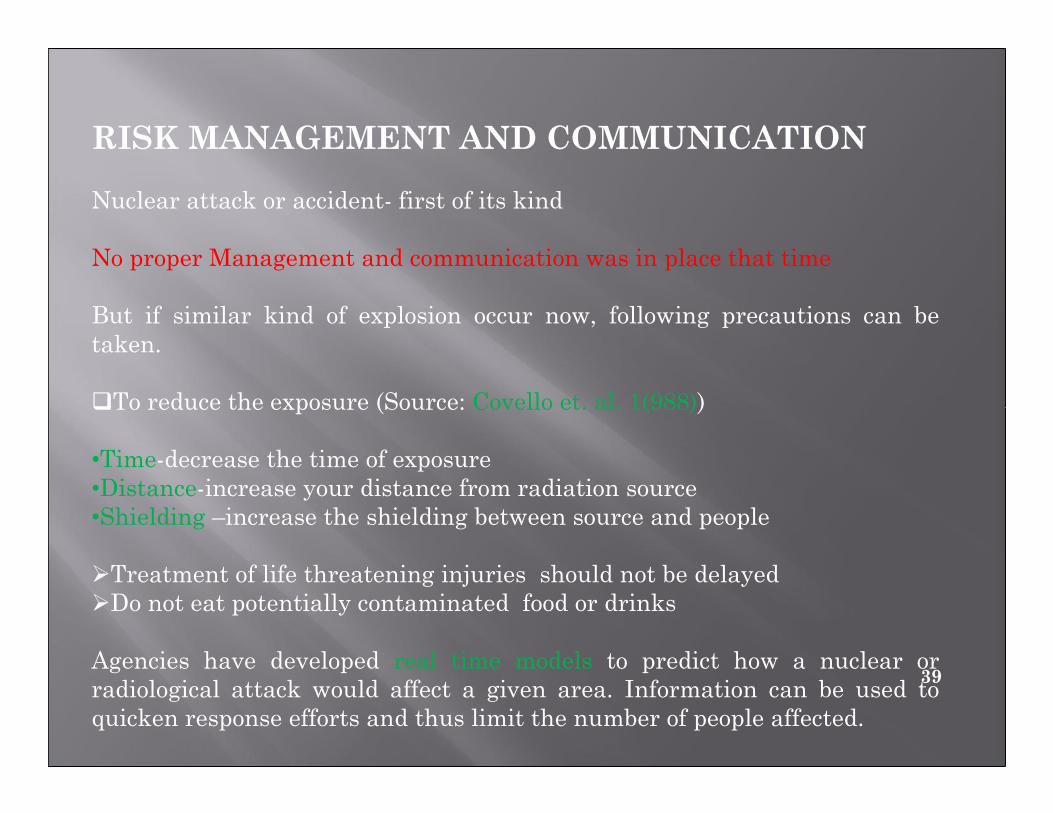
RISK MANAGEMENT AND COMMUNICATION
Nuclear attack or accident- first of its kind
No proper Management and communication was in place that time
But if similar kind of explosion occur now, following precautions can be
taken.
�To reduce the exposure (Source: Covello et. al. 1(988))
•Time-decrease the time of exposure
•Distance-increase your distance from radiation source
•Shielding –increase the shielding between source and people
�Treatment of life threatening injuries should not be delayed
�Do not eat potentially contaminated food or drinks
Agencies have developed real time models to predict how a nuclear or
radiological attack would affect a given area. Information can be used to
quicken response efforts and thus limit the number of people affected.
39
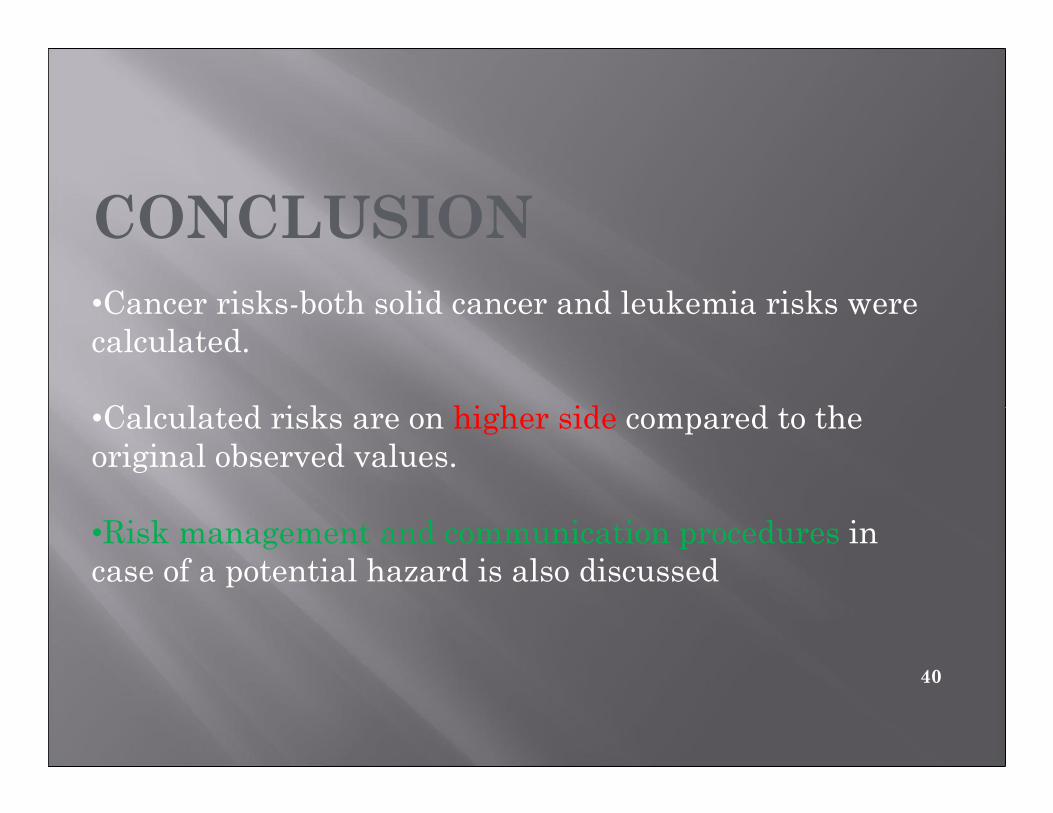
CONCLUSION
•Cancer risks-both solid cancer and leukemia risks were
calculated.
•Calculated risks are on higher side compared to the
original observed values.
•Risk management and communication procedures in
case of a potential hazard is also discussed
40
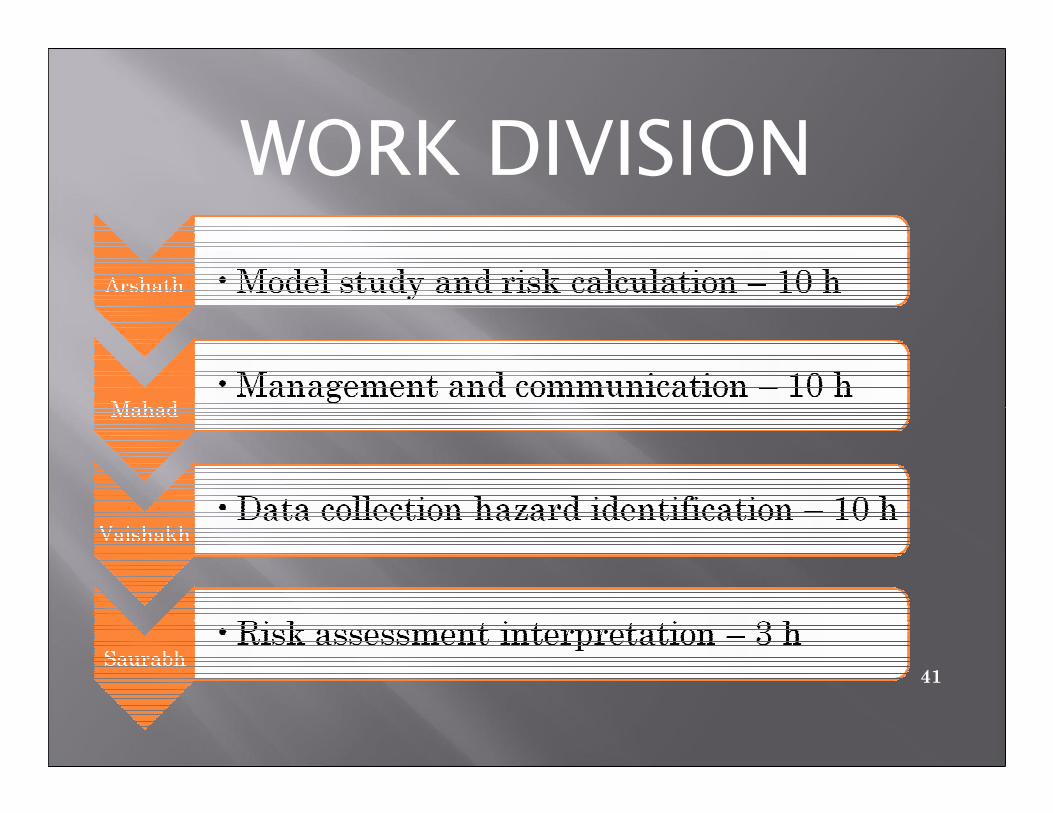
WORK DIVISION
41
REFERENCES� Evan B. D, Kiyohiko M, Harry M. C Dale L. P, Kazunori K, YukikoS, Saeko F and Roy E. S (2011), Long-term Radiation-RelatedHealth Effects in a Unique Human Population: Lessons Learnedfrom the Atomic Bomb Survivors of Hiroshima and Nagasaki,American Medical Association, Vol. 5,Suppl. 1, 122-133
� Land CE, Jeggo PA, Kellerer AM, Little JB, Pierce DA and Ullrich RL (2004), Low dose Extrapolation of Radiation-Related Cancer Risk,Committee taskgroup report, Vol.12, Suppl. 421,1-212
� Little, M.P., C.R. Muirhead, and M.W. Charles. 1999a. Describingtime and age variations in the risk of radiation-induced
42
REFERENCES� Health Risks from Exposure to Low Levels of IonizingRadiation: BEIR VII Phase 2 (2006), Board on RadiationEffects Research (BRER), National Research Council of theNational Academies, 266 -275.
� Masanobu T, (1962) Leukaemia in Nagasaki Atomic BombSurvivors from 1945 through 1959. Bull. Org. mond. Sante11962, 26, 619-631
� Shimizu Y, Mabuchi K, Preston D.L & Shigematsu I, (1996) Mortality study of atomic-bomb survivors:implications for assessment of radiation accidents, Wld hllh slalisl. quart., 49, pg 35-49.
� Sunitharalingam N, Podgorsak E. B, Hendry J.H,(2005), Basic Radiobiology, Chapter 14, 494 -504
� www.epa.gov� www.rerf.or.jp
43

THANK YOU
44

BHOPAL GAS
TRAGEDY
SUBMITTED BYLOHIT JAIN 20112799
MANJULA DEVAK 2011CEW2821
SHWETA YADAV 2011CEW2812
SHAILZA SHARMA 2011CEW2643
SUBMITTED TO: DR. ARUN KUMAR
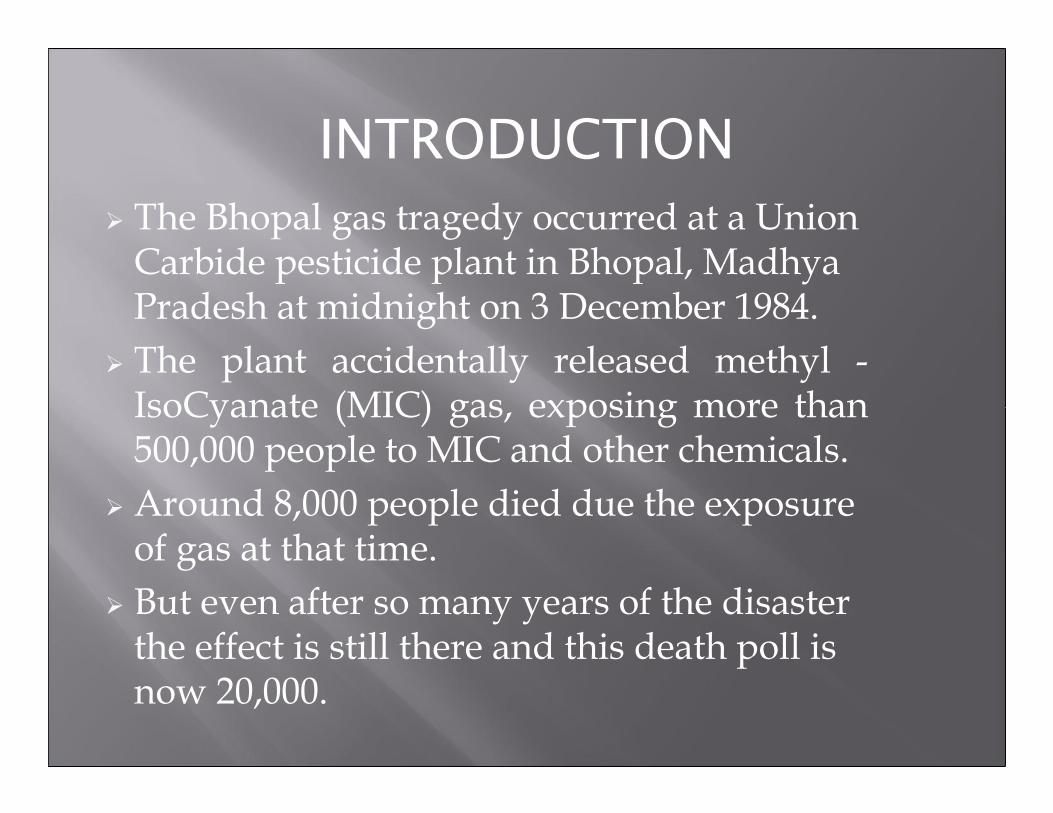
INTRODUCTION
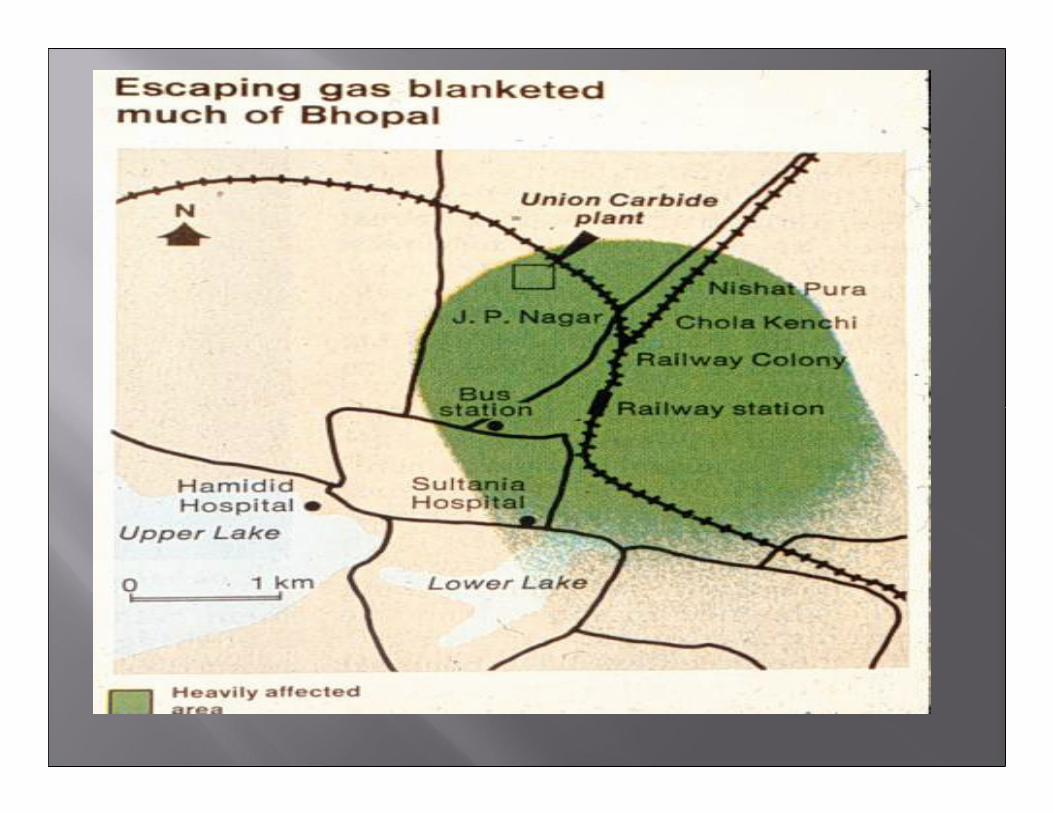
� The Bhopal gas tragedy occurred at a Union Carbide pesticide plant in Bhopal, Madhya Pradesh at midnight on 3 December 1984.
� The plant accidentally released methyl -IsoCyanate (MIC) gas, exposing more than 500,000 people to MIC and other chemicals.
� Around 8,000 people died due the exposure of gas at that time.
� But even after so many years of the disaster the effect is still there and this death poll is now 20,000.
OBJECTIVES
� To perform HHRA by calculating HAZARD QUOTIENT
� System Analysis, To get more depth information about any event and its related different consequences
� To identify the causes and develop Event tree & Fault tree.
� Solution to problem
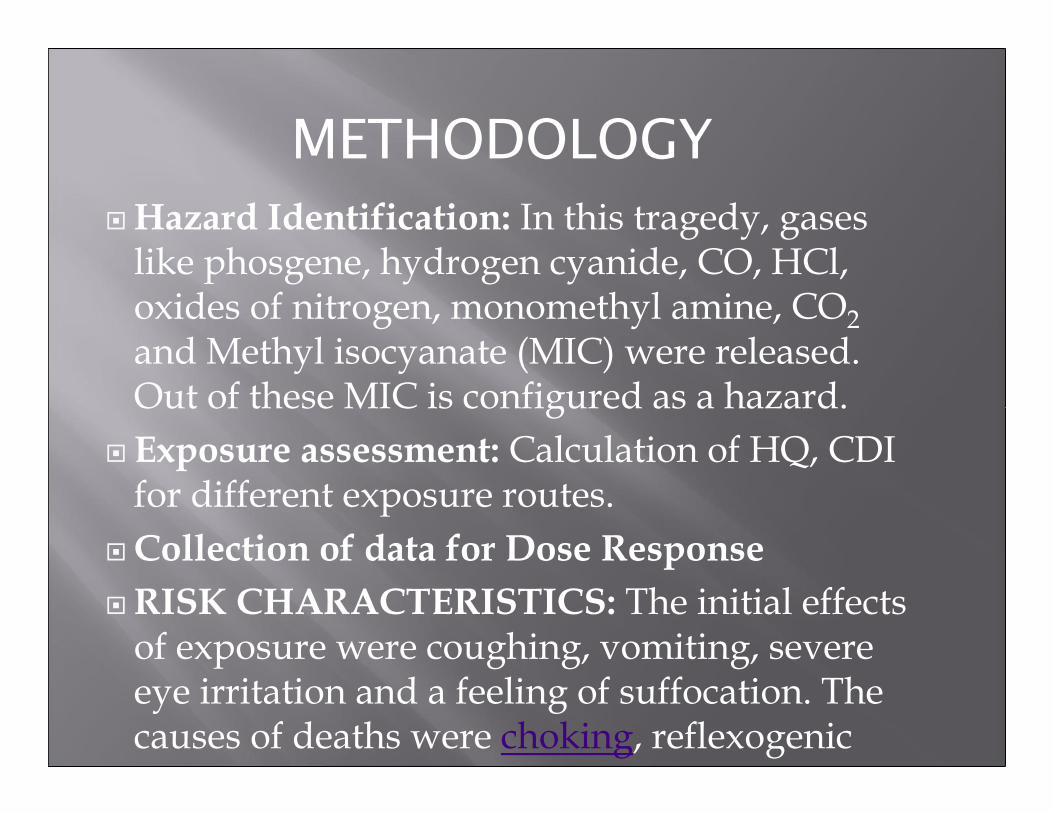
METHODOLOGY
�Hazard Identification: In this tragedy, gases like phosgene, hydrogen cyanide, CO, HCl, oxides of nitrogen, monomethyl amine, CO2
and Methyl isocyanate (MIC) were released. Out of these MIC is configured as a hazard.
� Exposure assessment: Calculation of HQ, CDI for different exposure routes.
�Collection of data for Dose Response
�RISK CHARACTERISTICS: The initial effects of exposure were coughing, vomiting, severe eye irritation and a feeling of suffocation. The causes of deaths were choking, reflexogeniccirculatory collapse etc.
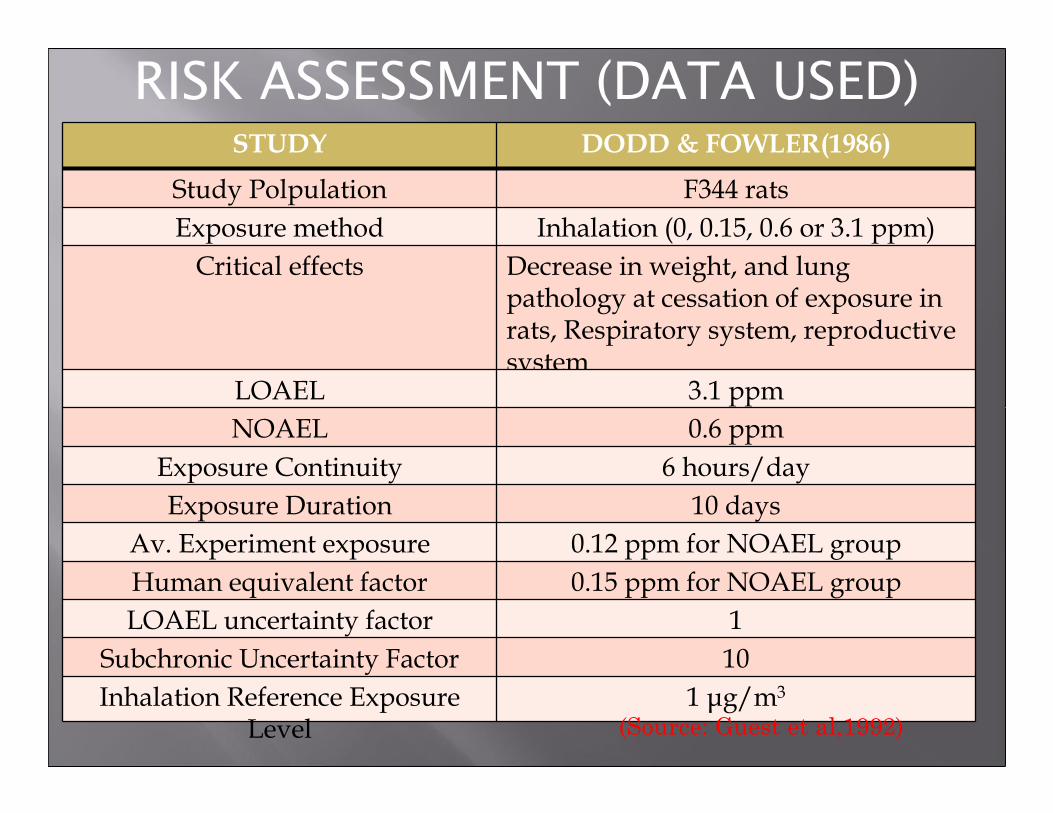
RISK ASSESSMENT (DATA USED)STUDY DODD & FOWLER(1986)
Study Polpulation F344 rats
Exposure method Inhalation (0, 0.15, 0.6 or 3.1 ppm)
Critical effects Decrease in weight, and lung pathology at cessation of exposure in rats, Respiratory system, reproductive system
LOAEL 3.1 ppm
NOAEL 0.6 ppm
Exposure Continuity 6 hours/day
Exposure Duration 10 days
Av. Experiment exposure 0.12 ppm for NOAEL group
Human equivalent factor 0.15 ppm for NOAEL group
LOAEL uncertainty factor 1
Subchronic Uncertainty Factor 10
Inhalation Reference Exposure Level
1 µg/m3
(Source: Guest et al,1992)
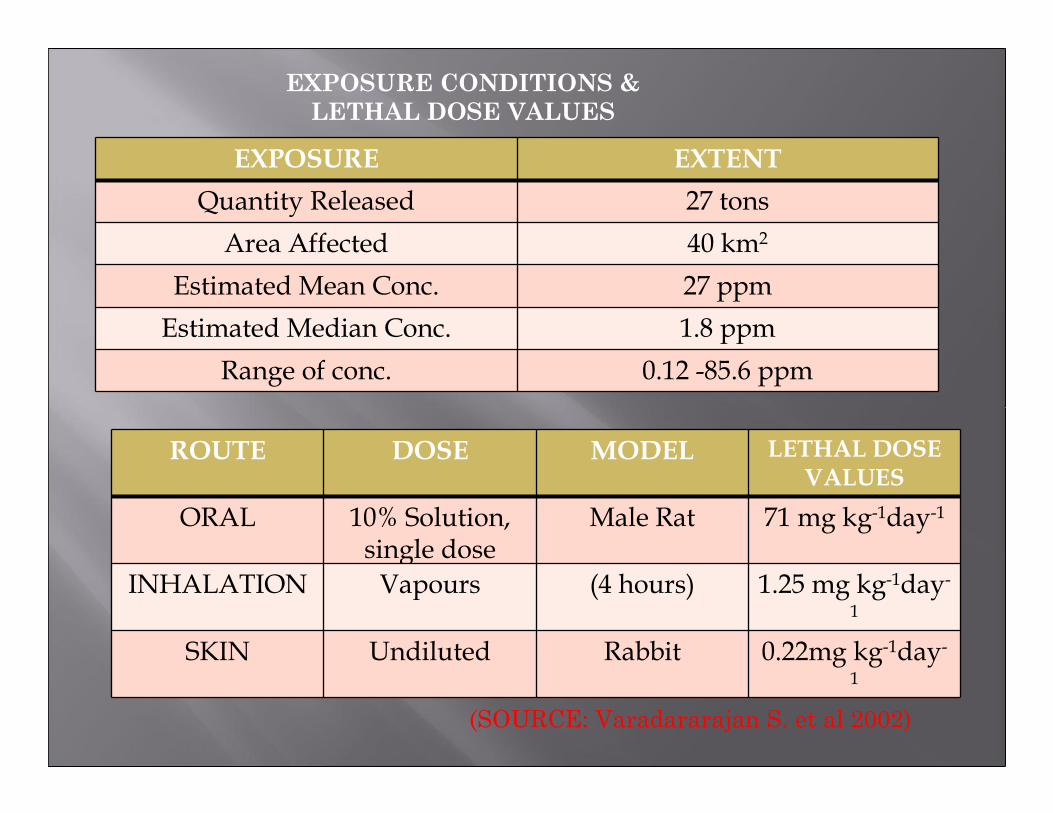
EXPOSURE EXTENT
Quantity Released 27 tons
Area Affected 40 km2
Estimated Mean Conc. 27 ppm
Estimated Median Conc. 1.8 ppm
Range of conc. 0.12 -85.6 ppm
ROUTE DOSE MODEL LETHAL DOSE VALUES
ORAL 10% Solution, single dose
Male Rat 71 mg kg-1day-1
INHALATION Vapours (4 hours) 1.25 mg kg-1day-1
SKIN Undiluted Rabbit 0.22mg kg-1day-1
EXPOSURE CONDITIONS &
LETHAL DOSE VALUES
(SOURCE: Varadararajan S. et al 2002)

INHALATION ROUTE� Estimated median conc. = 1.8 mg/l
�Human beings are exposed to= 0.6 L/day
�Av. Body wt = 50 kg
�ADD = 0.0216 mg kg-1day-1
�REL= 1.25 mg/kg/day (Varadararajan S. et al 2002)
�HQ = 0.01728 < 1; Hence Safe
DERMAL ROUTE :
� Lethal Dose value = 0.22 mg/kg/day
�HQ = 0.0982 <1; Hence Safe
ORAL ROUTE:
� Lethal Dose value = 71 mg/kg/day
�HQ= 3.042 X 10^-4; Hence Safe

SYSTEM ANALYSIS FOR GAS
LEAKAGE
UNION
CARBDIDE
INDUSTRY
SUBSYSTEM
HUMAN
ENVIRONMENT
BHOPAL
SYSTEM
ENVIRONMENT
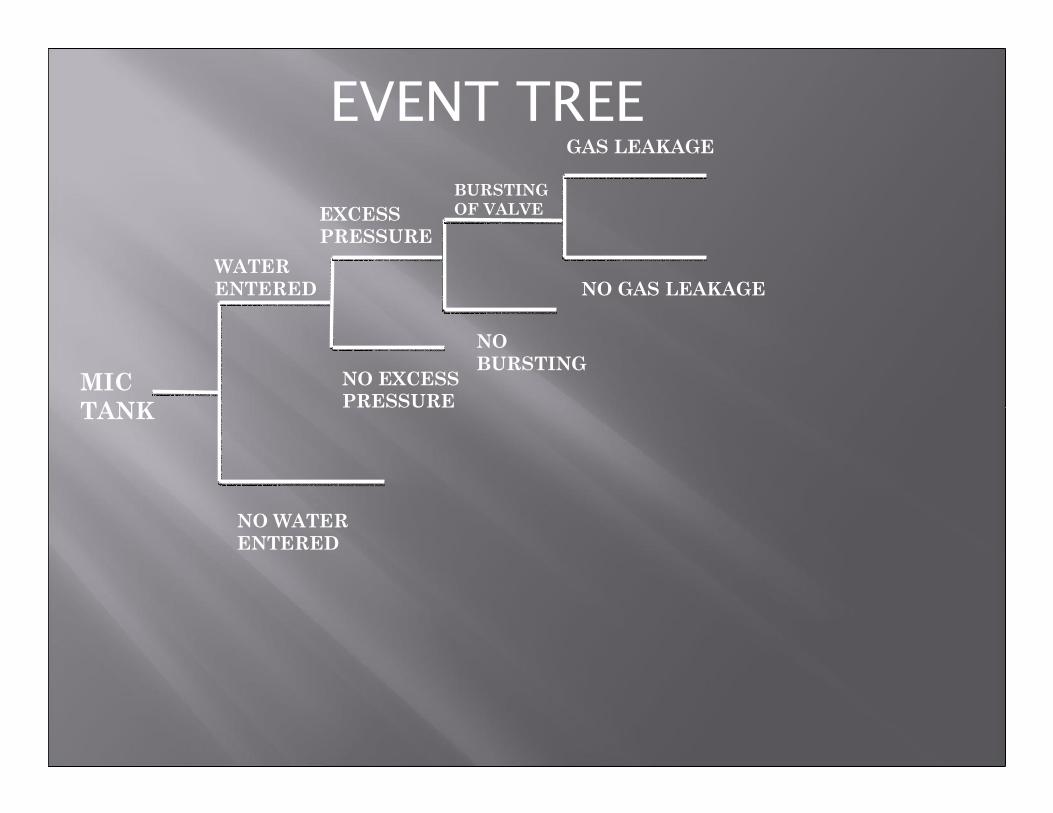
EVENT TREE
MIC
TANK
WATER
ENTERED
EXCESS
PRESSURE
NO EXCESS
PRESSURE
NO WATER
ENTERED
BURSTING
OF VALVE
NO
BURSTING
GAS LEAKAGE
NO GAS LEAKAGE
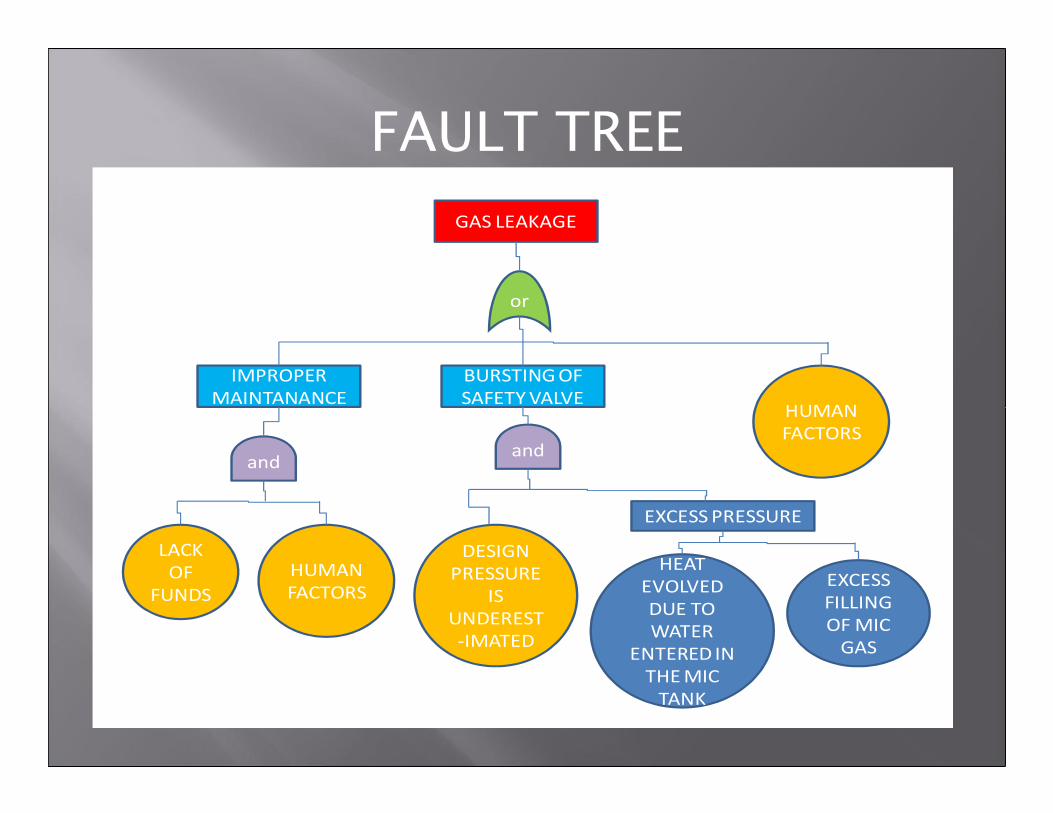
FAULT TREE
GAS LEAKAGE
BURSTING OF
SAFETY VALVE
IMPROPER
MAINTANANCEHUMAN
FACTORS
DESIGN
PRESSURE
IS
UNDEREST
-IMATED
HUMAN
FACTORS
LACK
OF
FUNDS
or
andand
EXCESS PRESSURE
HEAT
EVOLVED
DUE TO
WATER
ENTERED IN
THE MIC
TANK
EXCESS
FILLING
OF MIC
GAS
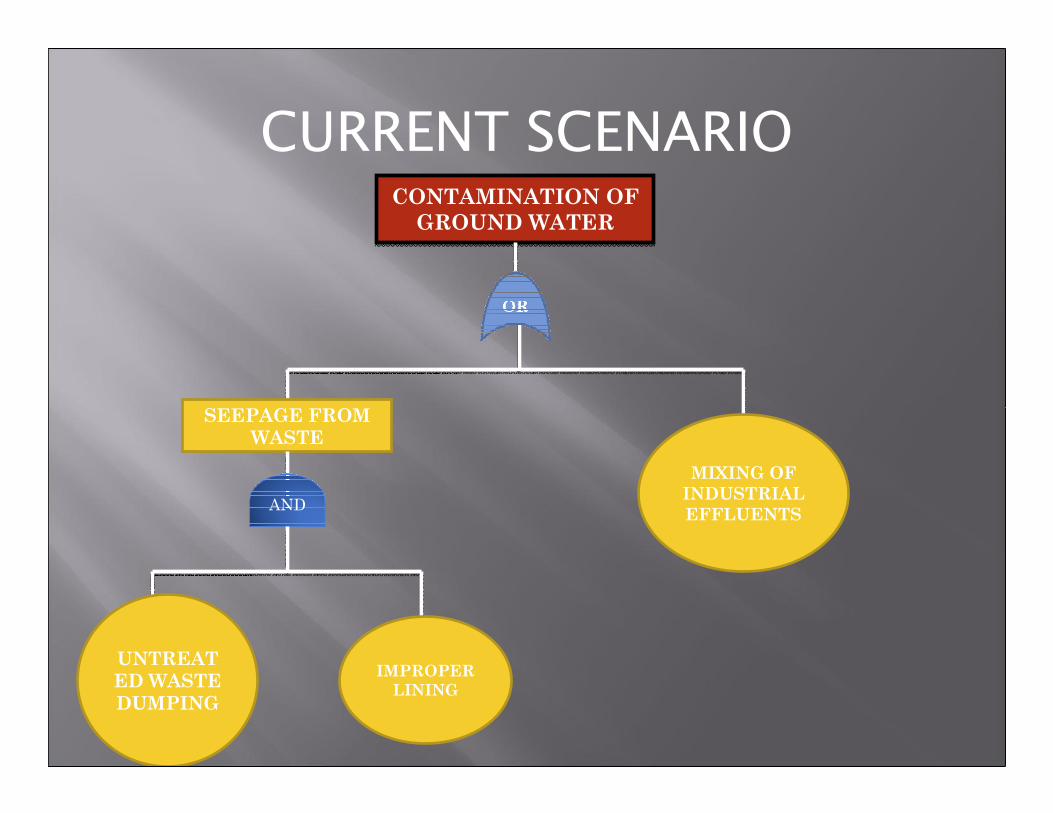
CURRENT SCENARIOCONTAMINATION OF
GROUND WATER
CONTAMINATION OF
GROUND WATER
SEEPAGE FROM
WASTE
AND
MIXING OF
INDUSTRIAL
EFFLUENTS
UNTREAT
ED WASTE
DUMPING
IMPROPER
LINING
SOLUTION TO PROBLEM
� The problem can be avoided if the proper maintenance is done.
� Factor of safety should be higher for the tank and pressure valve.
� Sufficient availability of fund for the periodic maintenance.
REFERENCES
� Indian Council of Medical Research (ICMR). Annual Report,Bhopal Gas Disaster Research Centre. Bhopal, India: ICMR, 1991.
� Varma DR, and Guest I. 1993. The Bhopal accident and methyl isocyanate toxicity. J. Toxicol. Environmental Health 40:513-529.
� R. J. Willey, The Bhopal Disaster - a Case History, AIChE-CCPS, New York, New York 1998.
� V. RAMANA DHARA, The Union Carbide Disaster in Bhopal: A Review of Health Effects, International Medical Commission on Bhopal ROSALINE DHARA, 2002.
� http://bhopal.net/document_library/medical_documents/medical_documents
http://www.gits4u.com/envo/envo22.htm

TERM PAPER
CEL 899 – Environmental Risk Assessment
TITLE: Ecological Risk Assessment of the Gulf of Mexico Oil Spill
Presented By :
Abhishek Kumar (Entry No.- 2007MT50426)
Himanshu Tyagi (Group Leader, Entry No.- 2011CEW2797)
Mohd. Osama Warsi (Entry No.- 2011CEW2811)
Suman Kumari Dhaka (Entry No.- 2011CEW2814)
Under the Guidance of Dr. Arun Kumar
Department of Civil EngineeringINDIAN INSTITUTE OF TECHNOLOGY - DELHI
New Delhi – 110016 (INDIA)
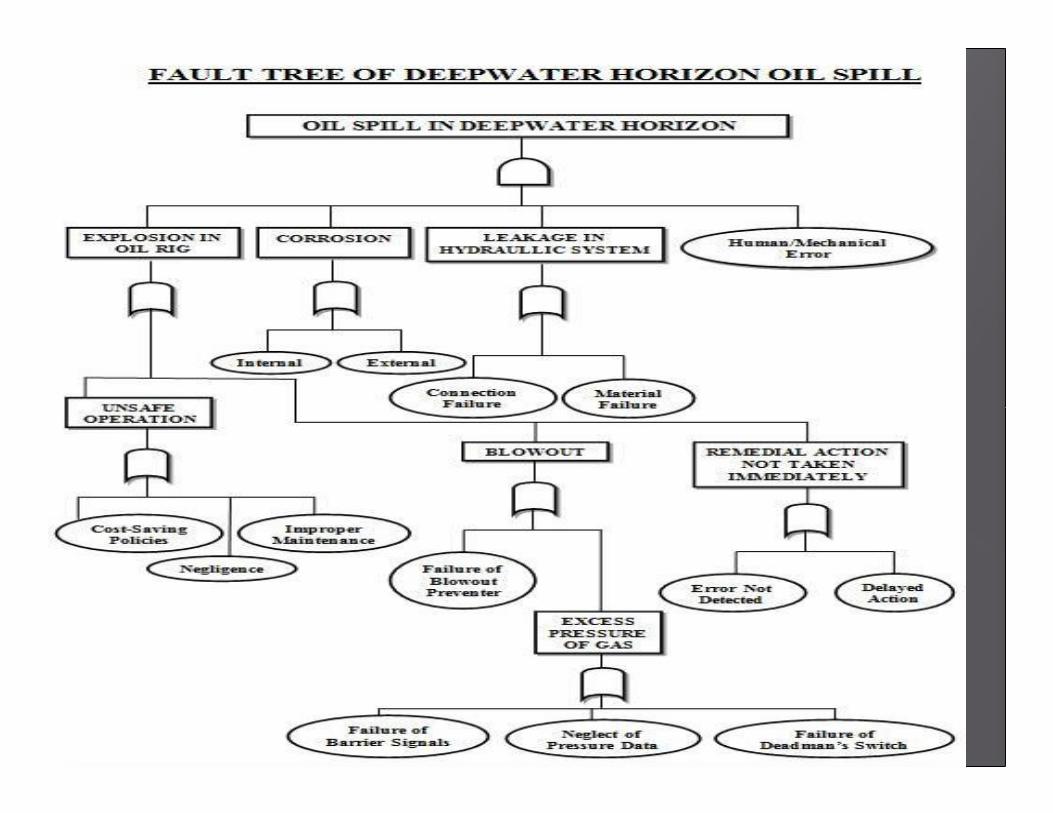
INTRODUCTION� An oil spill is a leakage from an oceangoing tanker,
pipelines, or other oil sources.
� Oil spills occur very frequently and cause enormous
ecological harm and hence their ecological risk assessment
is of prime importance.
� The ‘Deepwater Horizon oil spill’ (Also referred to as
‘The BP oil spill’, ‘The Gulf of Mexico oil spill’ or
‘The Macondo Blowout’) is an oil spill in the Gulf of
Mexico which occurred for 3 months in the year 2010.
� The spill stemmed from a sea-floor oil gusher that resulted
from an explosion of Deepwater Horizon.
� The explosion killed 11 men working on the platform and
injured 17 others.
� About 125 miles of Louisiana coast (Our location of
INTRODUCTION (CONTINUED)� The leak was stopped by capping the gushing wellhead,
after it had released about 4.9 million barrels (7,80,000
m3) of crude oil.
� The daily flow rate diminished over time, starting at about
62,000 barrels/day and decreasing as the reservoir of
Hydrocarbons feeding the gusher was gradually depleted.
� On 19th September, 2010, the relief process was
successfully completed and the Federal Government
declared the well effectively dead.
� The spill caused extensive damage to the
Gulf's fishing and tourism industries.
� The White House Oil Spill Commission released a final
report and blamed BP and its partners for making a series
of cost-cutting decisions.
SCOPE OF WORK� The ambit of our work was confined to:
1.Abstraction of background information
2.Study of timeline of the incident
3.Investigation of the causes of the accident
4.Analysis of the available scientific data
5.Evaluation of the consequences
6.Study of cause-effect relationship
7.Examination of remedial measures
8.Monitoring of water, air, sediments and dispersants
9.Interpretation of test results
10.Estimation of community outreach plans

METHODOLOGY ADOPTED� The methodology adopted by us in the ecological risk
assessment of the Gulf of Mexico oil spill comprised of
the following stages:
1.Hazard identification
2.Exposure assessment
3.Dose-Response information
4.Risk characterization
5.Assessment of corrective measures
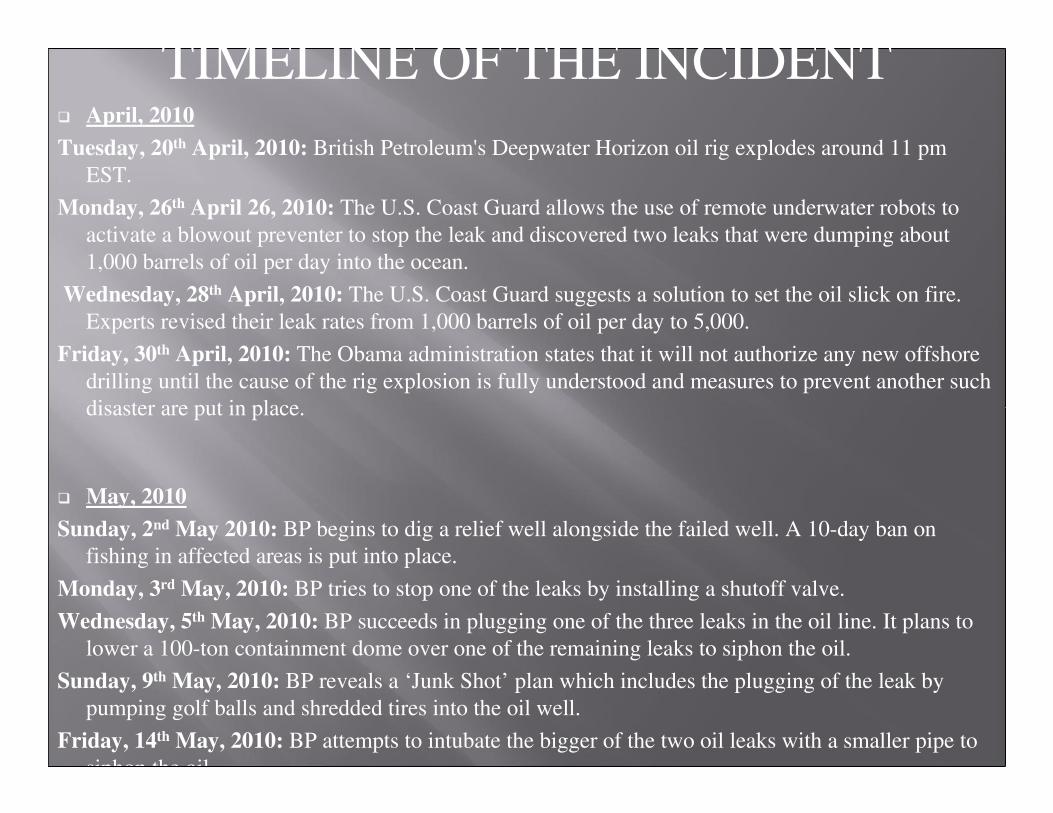
TIMELINE OF THE INCIDENT� April, 2010
Tuesday, 20th April, 2010: British Petroleum's Deepwater Horizon oil rig explodes around 11 pm
EST.
Monday, 26th April 26, 2010: The U.S. Coast Guard allows the use of remote underwater robots to
activate a blowout preventer to stop the leak and discovered two leaks that were dumping about
1,000 barrels of oil per day into the ocean.
Wednesday, 28th April, 2010: The U.S. Coast Guard suggests a solution to set the oil slick on fire.
Experts revised their leak rates from 1,000 barrels of oil per day to 5,000.
Friday, 30th April, 2010: The Obama administration states that it will not authorize any new offshore
drilling until the cause of the rig explosion is fully understood and measures to prevent another such
disaster are put in place.
� May, 2010
Sunday, 2nd May 2010: BP begins to dig a relief well alongside the failed well. A 10-day ban on
fishing in affected areas is put into place.
Monday, 3rd May, 2010: BP tries to stop one of the leaks by installing a shutoff valve.
Wednesday, 5th May, 2010: BP succeeds in plugging one of the three leaks in the oil line. It plans to
lower a 100-ton containment dome over one of the remaining leaks to siphon the oil.
Sunday, 9th May, 2010: BP reveals a ‘Junk Shot’ plan which includes the plugging of the leak by
pumping golf balls and shredded tires into the oil well.
Friday, 14th May, 2010: BP attempts to intubate the bigger of the two oil leaks with a smaller pipe to
siphon the oil.
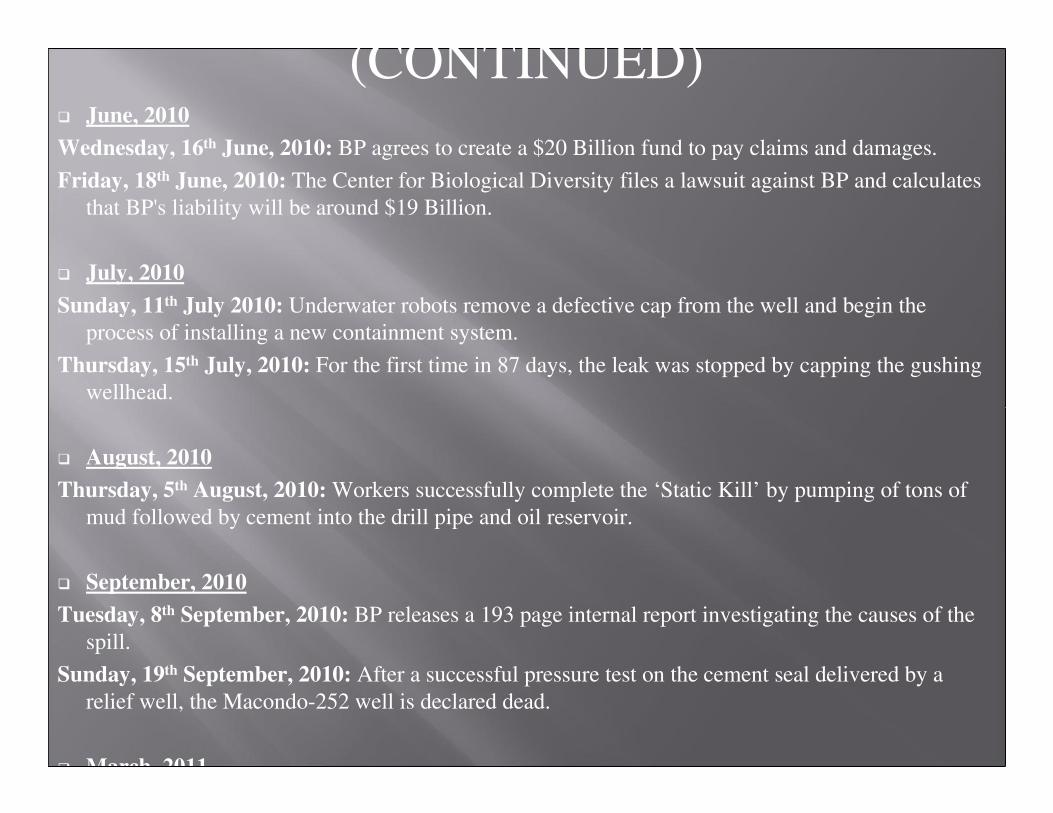
(CONTINUED)� June, 2010
Wednesday, 16th June, 2010: BP agrees to create a $20 Billion fund to pay claims and damages.
Friday, 18th June, 2010: The Center for Biological Diversity files a lawsuit against BP and calculates
that BP's liability will be around $19 Billion.
� July, 2010
Sunday, 11th July 2010: Underwater robots remove a defective cap from the well and begin the
process of installing a new containment system.
Thursday, 15th July, 2010: For the first time in 87 days, the leak was stopped by capping the gushing
wellhead.
� August, 2010
Thursday, 5th August, 2010: Workers successfully complete the ‘Static Kill’ by pumping of tons of
mud followed by cement into the drill pipe and oil reservoir.
� September, 2010
Tuesday, 8th September, 2010: BP releases a 193 page internal report investigating the causes of the
spill.
Sunday, 19th September, 2010: After a successful pressure test on the cement seal delivered by a
relief well, the Macondo-252 well is declared dead.
� March, 2011


HAZARDS IDENTIFIED
S. NO. CONTAMINANT TYPE
1 Benzene Carcinogen
2 Ethyl-Benzene Non-Carcinogen
3 Fluorine Non-Carcinogen
4 Naphthalene Non-Carcinogen
5 Nickel Non-Carcinogen
6 Toluene Non-Carcinogen
7 Vanadium Non-Carcinogen
8 Xylene Non-Carcinogen

EXPOSURE ASSESSMENT
S.
NO.
CONTAMINA
NT
CONCENTRATION
In Air(In
µg/m3)
In Water(In
µg/L)1 Benzene 0.68 1
2 Ethyl-Benzene 0.91 1.2
3 Fluorine Not Detected Not Detected
4 Naphthalene 0.033 4
5 Nickel 0.23 310
6 Toluene 2.14 15
7 Vanadium Not Detected Not Detected
8 Xylene 0.04 10

HUMANS)
S.
NO.
CONTAMINAN
T
(Non-
Carcinogen)
HAZARD
QUOTIENT
H.Q./TOTA
L H.Q.
PRIORITY
RANK
For
Air
For
Water
For
Air
For
Water
For
Air
For
Wate
r1 Ethyl-Benzene 1.82 1.71 x 10⁻⁴ 0.72 8.07 x 10-
41 2
2 Naphthalene 0.22 0.28 0.079 0.99 3 1
3 Nickel N.A. 1.42 x 10⁻⁴ N.A. 5 x 10⁻⁴N.A. 4
4 Toluene 0.0856 2.14 x 10⁻⁴ 0.033 7.56 x 10-
44 3
5 Xylene 0.4 7.14 x 10⁻⁴ 0.158 2.53 x 10-
42 5
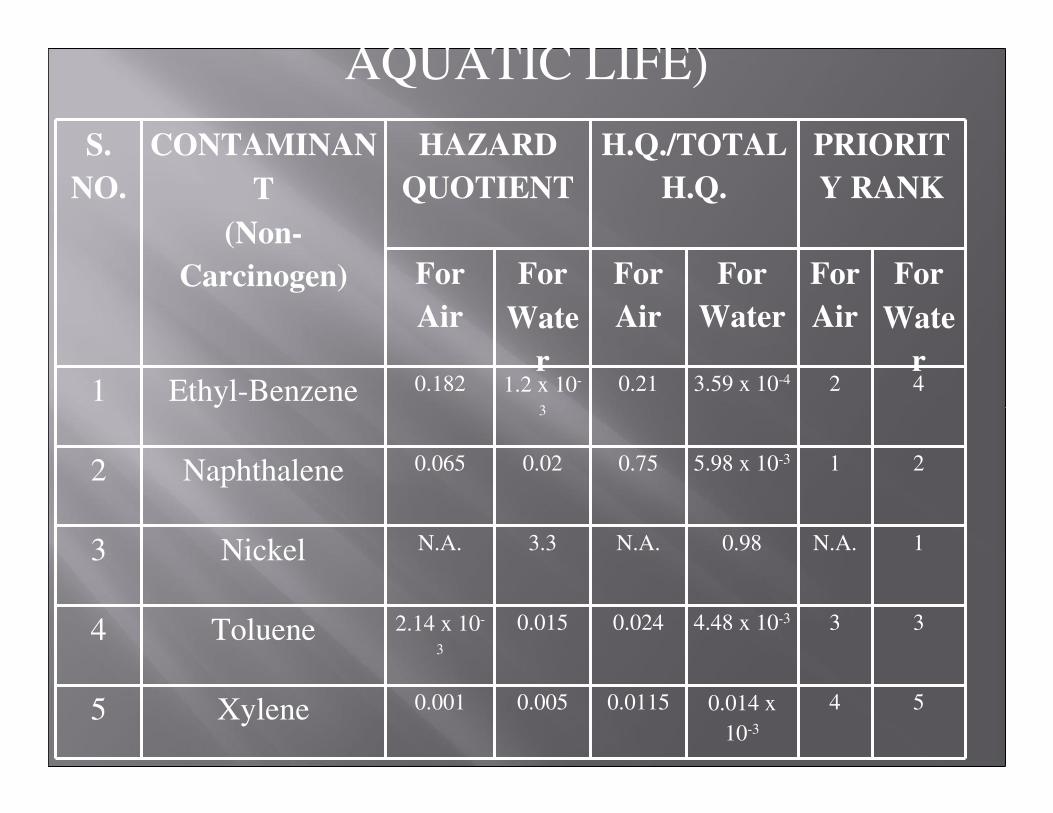
AQUATIC LIFE)
S.
NO.
CONTAMINAN
T
(Non-
Carcinogen)
HAZARD
QUOTIENT
H.Q./TOTAL
H.Q.
PRIORIT
Y RANK
For
Air
For
Wate
r
For
Air
For
Water
For
Air
For
Wate
r1 Ethyl-Benzene 0.182 1.2 x 10-
3
0.21 3.59 x 10⁻⁴ 2 4
2 Naphthalene 0.065 0.02 0.75 5.98 x 10⁻³ 1 2
3 Nickel N.A. 3.3 N.A. 0.98 N.A. 1
4 Toluene 2.14 x 10-
3
0.015 0.024 4.48 x 10⁻³ 3 3
5 Xylene 0.001 0.005 0.0115 0.014 x
10-3
4 5
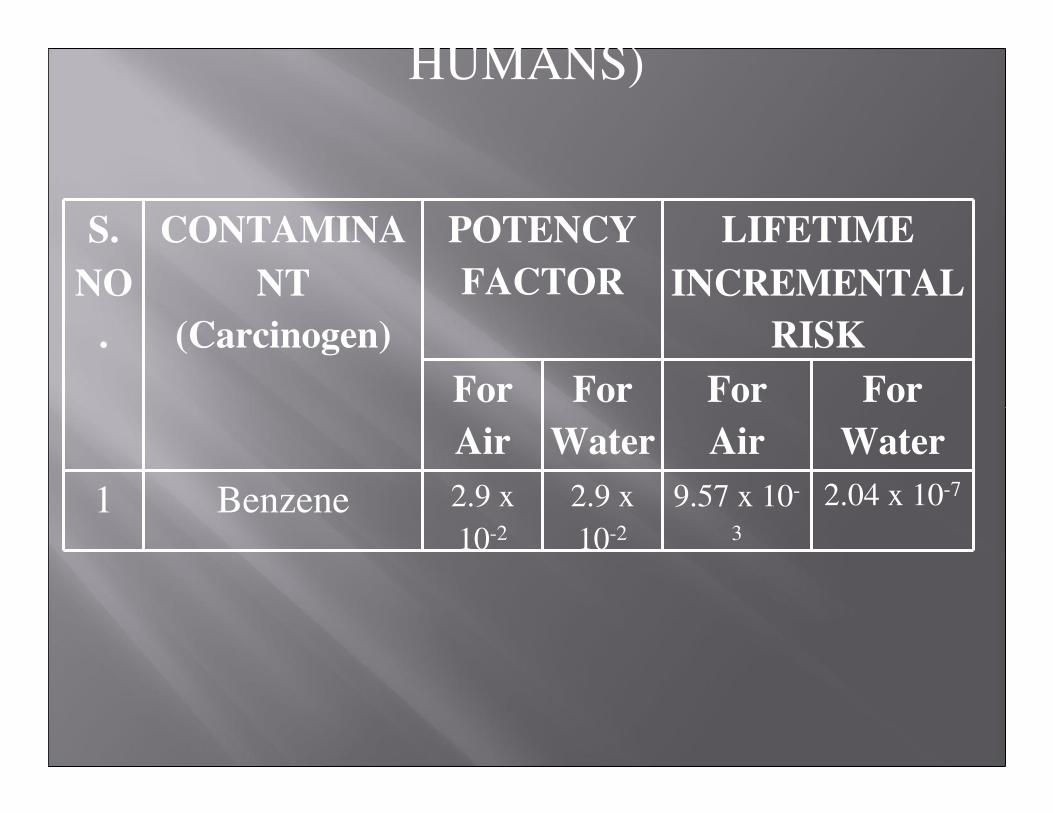
HUMANS)
S.
NO
.
CONTAMINA
NT
(Carcinogen)
POTENCY
FACTOR
LIFETIME
INCREMENTAL
RISK
For
Air
For
Water
For
Air
For
Water
1 Benzene 2.9 x
10-2
2.9 x
10-2
9.57 x 10-
3
2.04 x 10⁻⁷
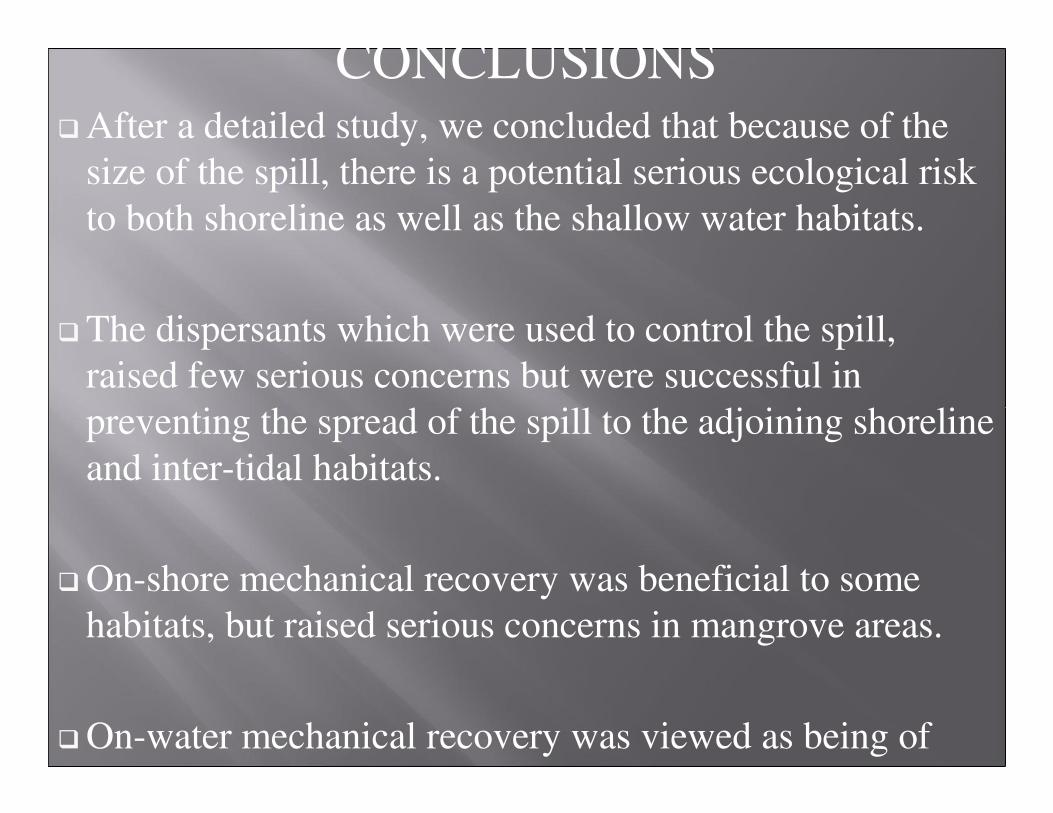
CONCLUSIONS� After a detailed study, we concluded that because of the
size of the spill, there is a potential serious ecological risk
to both shoreline as well as the shallow water habitats.
� The dispersants which were used to control the spill,
raised few serious concerns but were successful in
preventing the spread of the spill to the adjoining shoreline
and inter-tidal habitats.
� On-shore mechanical recovery was beneficial to some
habitats, but raised serious concerns in mangrove areas.
� On-water mechanical recovery was viewed as being of
limited utility in this scenario.
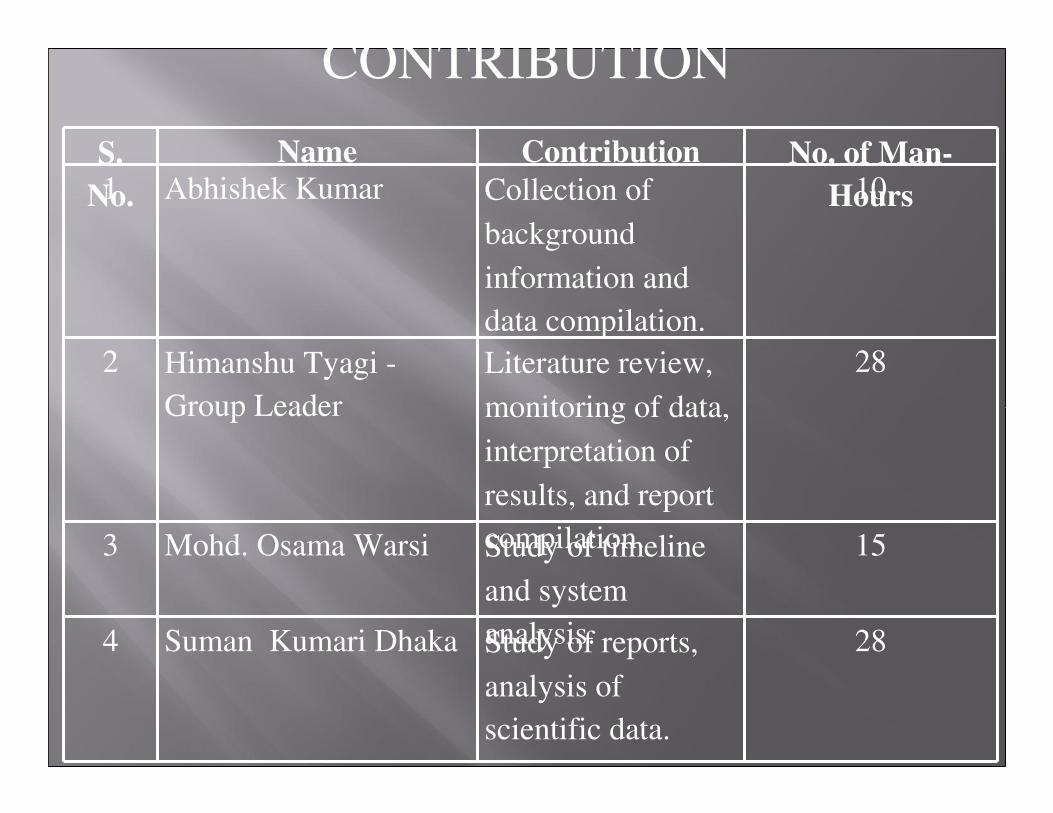
CONTRIBUTION
S.
No.
Name Contribution No. of Man-
Hours1 Abhishek Kumar Collection of
background
information and
data compilation.
10
2 Himanshu Tyagi -
Group Leader
Literature review,
monitoring of data,
interpretation of
results, and report
compilation.
28
3 Mohd. Osama Warsi Study of timeline
and system
analysis.
15
4 Suman Kumari Dhaka Study of reports,
analysis of
scientific data.
28
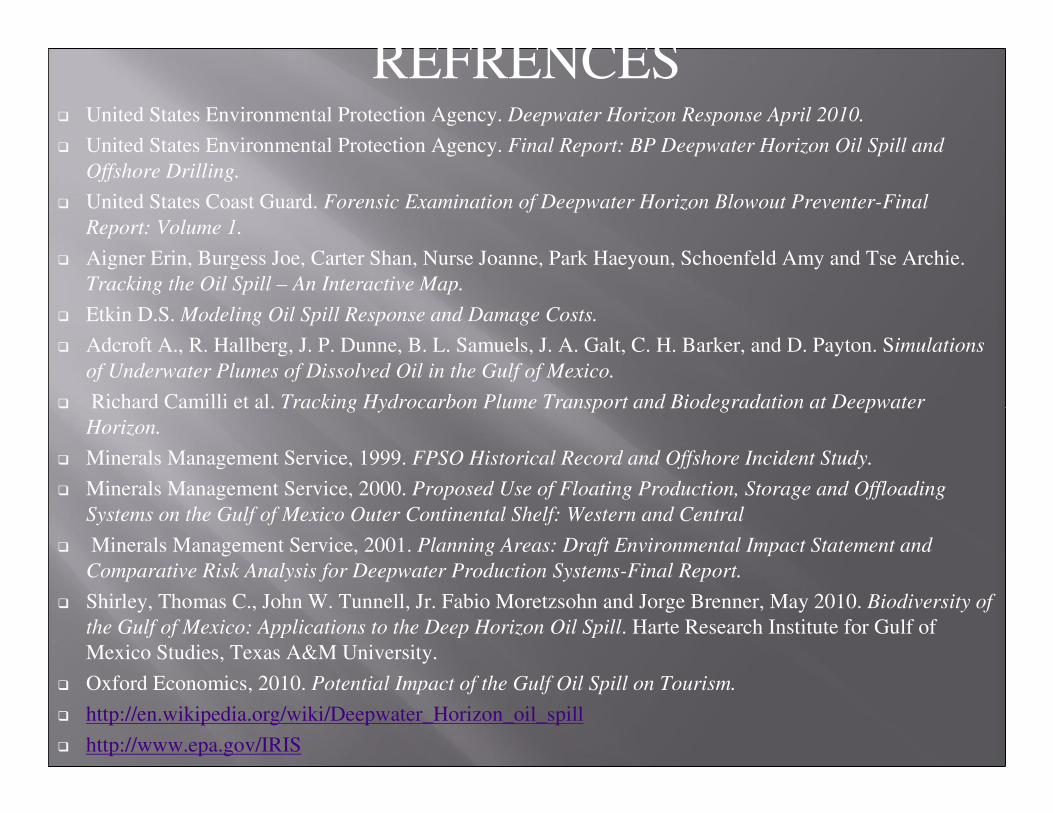
REFRENCES� United States Environmental Protection Agency. Deepwater Horizon Response April 2010.
� United States Environmental Protection Agency. Final Report: BP Deepwater Horizon Oil Spill and
Offshore Drilling.
� United States Coast Guard. Forensic Examination of Deepwater Horizon Blowout Preventer-Final
Report: Volume 1.
� Aigner Erin, Burgess Joe, Carter Shan, Nurse Joanne, Park Haeyoun, Schoenfeld Amy and Tse Archie.
Tracking the Oil Spill – An Interactive Map.
� Etkin D.S. Modeling Oil Spill Response and Damage Costs.
� Adcroft A., R. Hallberg, J. P. Dunne, B. L. Samuels, J. A. Galt, C. H. Barker, and D. Payton. Simulations
of Underwater Plumes of Dissolved Oil in the Gulf of Mexico.
� Richard Camilli et al. Tracking Hydrocarbon Plume Transport and Biodegradation at Deepwater
Horizon.
� Minerals Management Service, 1999. FPSO Historical Record and Offshore Incident Study.
� Minerals Management Service, 2000. Proposed Use of Floating Production, Storage and Offloading
Systems on the Gulf of Mexico Outer Continental Shelf: Western and Central
� Minerals Management Service, 2001. Planning Areas: Draft Environmental Impact Statement and
Comparative Risk Analysis for Deepwater Production Systems-Final Report.
� Shirley, Thomas C., John W. Tunnell, Jr. Fabio Moretzsohn and Jorge Brenner, May 2010. Biodiversity of
the Gulf of Mexico: Applications to the Deep Horizon Oil Spill. Harte Research Institute for Gulf of
Mexico Studies, Texas A&M University.
� Oxford Economics, 2010. Potential Impact of the Gulf Oil Spill on Tourism.
� http://en.wikipedia.org/wiki/Deepwater_Horizon_oil_spill
� http://www.epa.gov/IRIS
http://www.epa.gov/bpspill

THANK YOU

Human Health Risk Assessment of Pesticides In Food Items
CEL-899Environmental Risk
Assessment
Coordinator : Dr. Arun Kumar
Divya Singh - 2011CEZ8032Jatin Anand - 2010CEW3424Raktim Haldar - 2011CEZ8033S. Mridul Naidu - 2010CET3036
INTRODUCTION
�Pesticides are substances or mixture of substances intended for preventing, destroying, repelling or mitigating any pest. �are benefits to their use such as increased productivity of agricultural items.�drawbacks, such as potential toxicity to humans and other animals.•These substances get bio-accumulated in the products obtained from these plants and enter the human and animal body on consumption, posing serious health and carcinogenic risks.
SCOPE OF WORK
•Collection of concentration data
•Determination of Average daily
dose
•Calculation of hazard index
•Characterization of risk.
•Suggesting risk management and
communication strategies
METHODOLOGY
Step1:Collection of data from various literature.
Step2: Oral Rfd values for the pesticides and the hazard
quotient was calculated for each food item(USEPA IRIS).
Step3: The various hazard quotients were compared and
Critical cases determined.
Step4: Risk management and
communication strategies
Step5: Researched about these
cases from various literature.

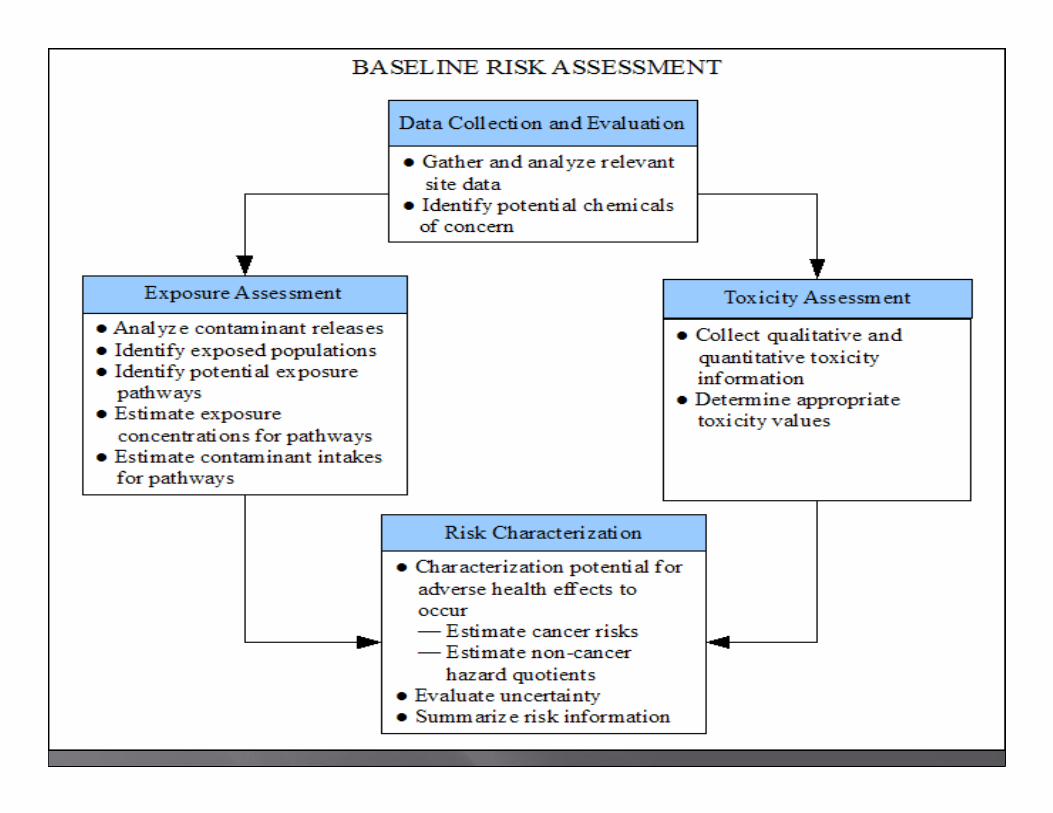
WHAT ARE THE STEPS OF RISK ASSESSMENT?A human health risk assessment is the process to estimate the nature and
probability of adverse health effects in humans who may be exposed to chemicals in contaminated environmental media, now or in the future.
Step 1
Identify the hazards
Step 2
Decide who might be harmed and how
Step 3
Evaluate the risks and decide on precautions
Step 4
Record your findings and implement them
Step 5
Review your assessment and update if necessary

INTRODUCTION TO THE PESTICIDES
NOEL
1 ppm diet (0.05 mg/kg
bw/day)
RfD 5E-4 mg/kg/day
ADVERSE
AFFECT
Geno-toxicity and
Endocrine Disruption.
DDT :
BHC :
NOAEL
4 ppm diet [0.33 mg/kg/day
(females)]
RfD 3E-4 mg/kg/day
ADVERSE
EFFECT
Effects Blood, immunity ,nervous
systems, and the liver and
ENDOSULFAN :
NOAEL
15 ppm [0.6 mg/kg-day (male);
0.7 mg/kg-day (female)]
RfD 6E-3 mg/kg/day
ADVERSE
EFFECT
Delayed sexual maturity and
interferes with the sex-
hormone synthesis,Endocrine
Disruption

CONTAMINATED FODDER
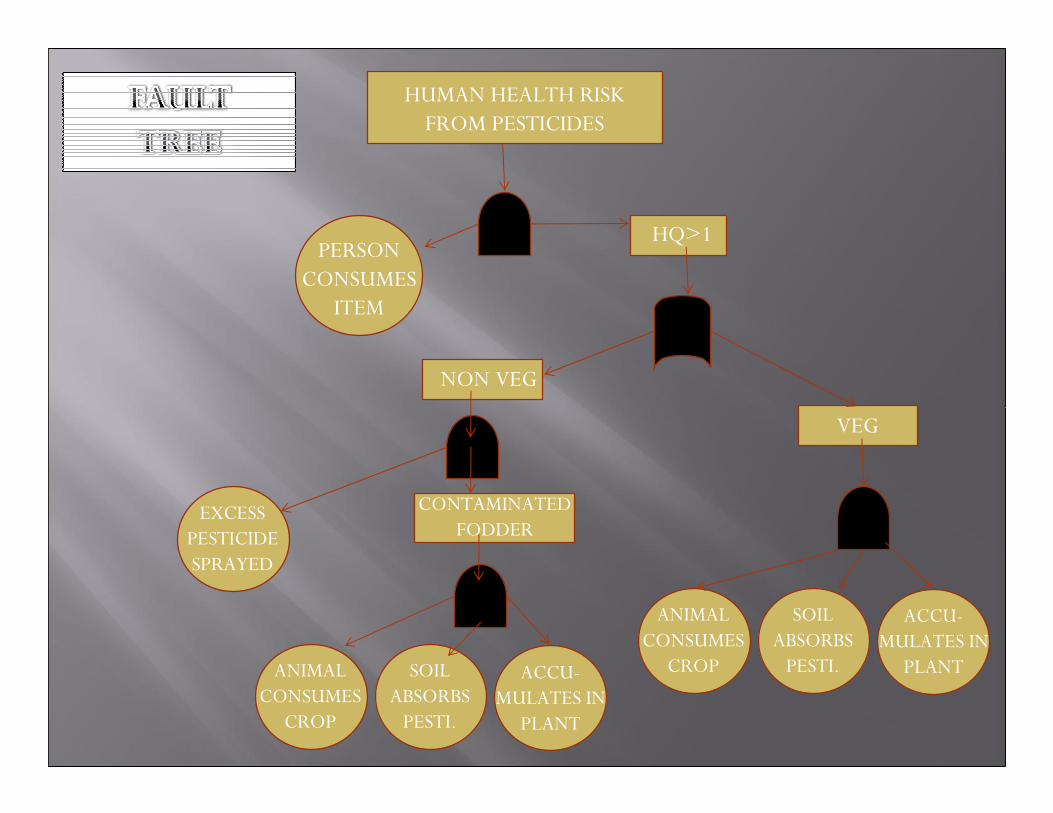
HUMAN HEALTH RISK FROM PESTICIDES
PERSON CONSUMES
ITEM
HQ>1
NON VEG
VEG
EXCESSPESTICIDESPRAYED
ANIMALCONSUMES
CROP
SOIL ABSORBSPESTI.
ACCU-MULATES IN
PLANT
ANIMALCONSUMES
CROP
SOIL ABSORBSPESTI.
ACCU-MULATES IN
PLANT
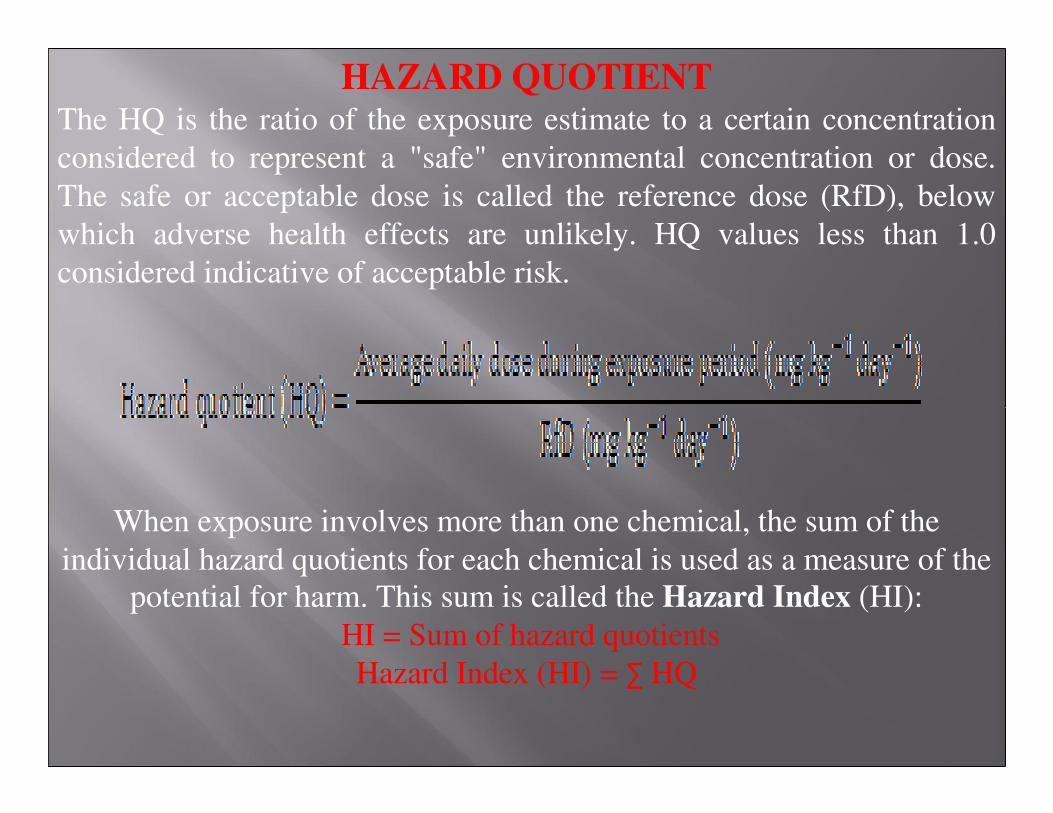
HAZARD QUOTIENTThe HQ is the ratio of the exposure estimate to a certain concentration
considered to represent a "safe" environmental concentration or dose.
The safe or acceptable dose is called the reference dose (RfD), below
which adverse health effects are unlikely. HQ values less than 1.0
considered indicative of acceptable risk.
When exposure involves more than one chemical, the sum of the
individual hazard quotients for each chemical is used as a measure of the potential for harm. This sum is called the Hazard Index (HI):
HI = Sum of hazard quotients
Hazard Index (HI) = ∑ HQ

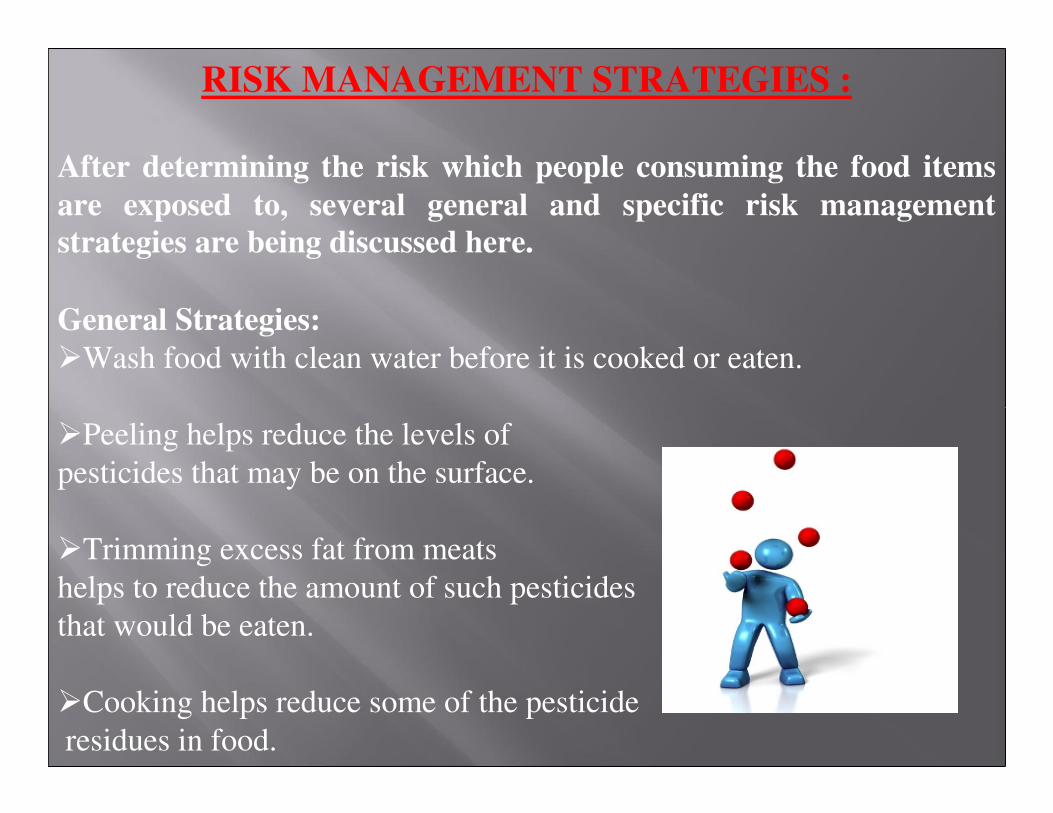
RISK MANAGEMENT STRATEGIES :
After determining the risk which people consuming the food items
are exposed to, several general and specific risk management
strategies are being discussed here.
General Strategies:
�Wash food with clean water before it is cooked or eaten.
�Peeling helps reduce the levels of
pesticides that may be on the surface.
�Trimming excess fat from meats
helps to reduce the amount of such pesticides
that would be eaten.
�Cooking helps reduce some of the pesticide
residues in food.
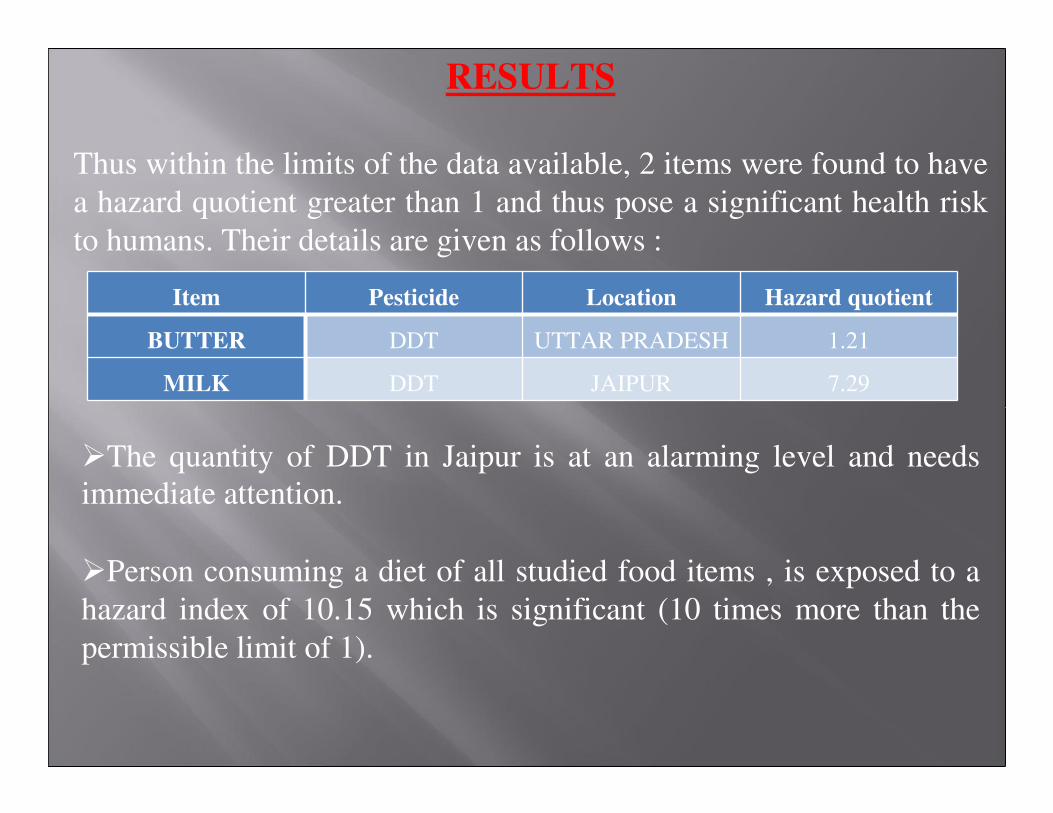
Item Pesticide Location Hazard quotient
BUTTER DDT UTTAR PRADESH 1.21
MILK DDT JAIPUR 7.29
RESULTS
Thus within the limits of the data available, 2 items were found to have
a hazard quotient greater than 1 and thus pose a significant health risk
to humans. Their details are given as follows :
�The quantity of DDT in Jaipur is at an alarming level and needs immediate attention.
�Person consuming a diet of all studied food items , is exposed to a
hazard index of 10.15 which is significant (10 times more than the
permissible limit of 1).
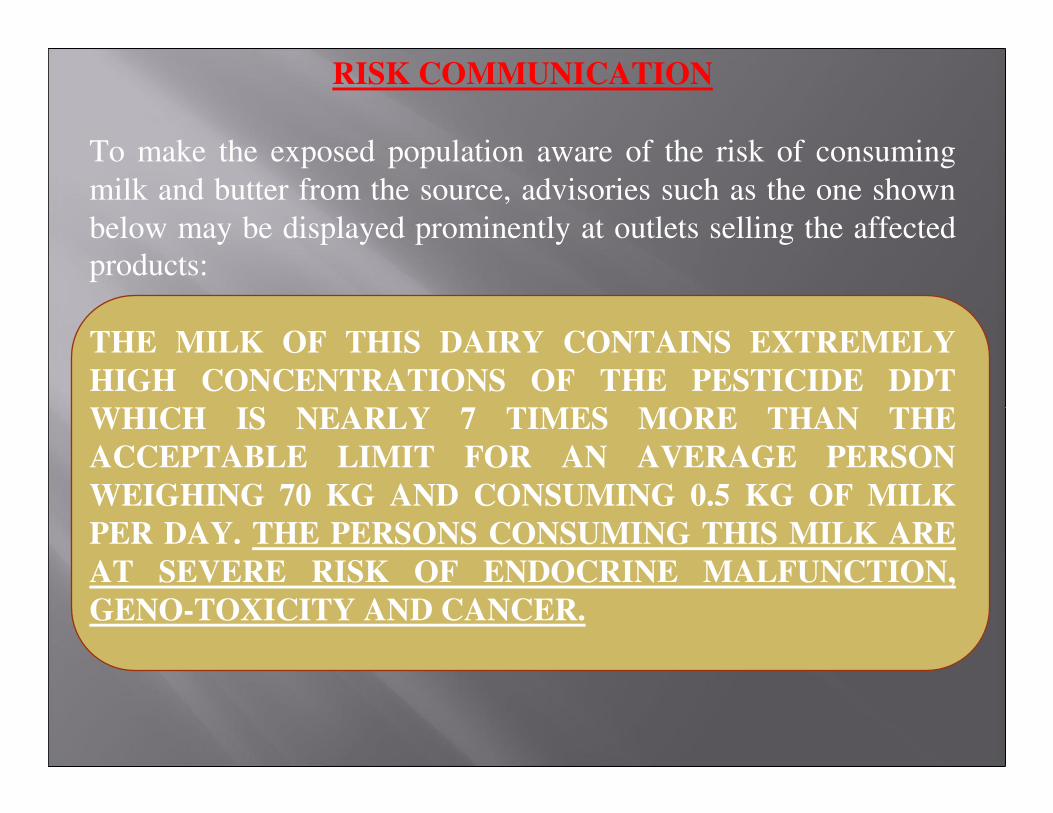
RISK COMMUNICATION
To make the exposed population aware of the risk of consuming
milk and butter from the source, advisories such as the one shown
below may be displayed prominently at outlets selling the affected products:
THE MILK OF THIS DAIRY CONTAINS EXTREMELY
HIGH CONCENTRATIONS OF THE PESTICIDE DDT
WHICH IS NEARLY 7 TIMES MORE THAN THE
ACCEPTABLE LIMIT FOR AN AVERAGE PERSON
WEIGHING 70 KG AND CONSUMING 0.5 KG OF MILK
PER DAY. THE PERSONS CONSUMING THIS MILK ARE
AT SEVERE RISK OF ENDOCRINE MALFUNCTION,
GENO-TOXICITY AND CANCER.
LIMITATIONS OF THE STUDY
�The study is severely limited by the lack of relevant data and the studies conducted are all from different parts of the country.
�It has been assumed that a person is consuming all the food items
studies in a day, although they have been studied in different parts.
�Several food items contained traces of other minor pesticides but that
has been ignored for the sake of simplicity of the study.
�All the substances are assumed to be acting
as a non-carcinogen only.