presenter name presentation location...
TRANSCRIPT

PRESENTER NAMEPRESENTATION LOCATIONDD-MONTH-YYYY
© 2007 Boart Longyear. All rights reserved.
PRESENTER NAMEPRESENTATION LOCATIONDD-MONTH-YYYY
© 2007 Boart Longyear. All rights reserved.
FULL YEAR RESULTS31 December 2008
Boart Longyear Limited ACN 123052728FULL YEAR RESULTS
31 December 2008Boart Longyear Limited ACN 123052728

© 2009 Boart Longyear. All rights reserved.
2
Important notice and disclaimerThis presentation has been prepared by Boart Longyear Limited (the “Company”). It contains general information about the Company’s activities as at the date of the presentation. It is information given in summary form and does not purport to be complete. The distribution of this presentation in jurisdictions outside Australia may be restricted by law and you should observe any such restrictions.
This presentation is not (and nothing in it should be construed as) an offer, invitation, solicitation or recommendation with respect to the subscription for, purchase or
sale of any security in any jurisdiction, and neither this document nor anything in it shall form the basis of
any contract or commitment. The presentation is not intended to be relied upon as advice to investors or potential investors and does not take into account the investment objectives, financial situation or needs of any particular investor. All investors should consider such factors in consultation with a professional advisor of their choosing, when deciding if an investment is appropriate.
The Company has prepared this presentation based on information available to it, including information derived from publicly available sources that have not been independently verified. No representation or warranty, express or implied, is made as to the fairness, accuracy, completeness, correctness or reliability of the information, opinions and conclusions expressed.
Any statements or assumptions in this presentation as to future matters may prove to be incorrect and differences may be material. This presentation should not be relied upon as a recommendation or forecast by the Company. To the maximum extent permitted by law, none of the
Company, its directors, employees or agents, nor any other person accepts any liability, including, without limitation, any liability arising from fault or negligence on the part of any of them or any other person, for any loss arising from the use of this presentation or its contents or otherwise arising in connection with it.
Due care and attention should be undertaken when considering and
analyzing the financial performance of the Company. All references to dollars are to United States currency unless otherwise stated.

© 2009 Boart Longyear. All rights reserved.
3
Agenda
2008 Highlights
Financial Review
Operating Update
Outlook
Q&A

© 2009 Boart Longyear. All rights reserved.
4
Revenues increased by 17% to $1,839 million
EBITDA increased by 20% to $356 million
NPAT increased by 93% to $157 million or 10.4¢
per fully diluted share
Net working capital as a % of revenues improved by over 100 b.p. to 15.7%
Continued improvement in safety metrics…increasingly important customer metric!
— Lost time incident rate (LTIR) down 59%
— Total recordable injury rate (TCIR) down 34%
2008 Highlights
Record Performance Achieved …
…But 2008 Represents the Peak in the Current Cycle

© 2009 Boart Longyear. All rights reserved.
5
Dec/Jan business activity was lower than expected…
Rig utilization levels (post holiday period) have not improved…yet -
Increase in drilling tendering activity
- 2nd
quarter rig commitments at higher levels
Products backlog has stabilized at Nov./Dec./Jan. levels
-
Most customers appear to have 3-6 months of consumable inventory
-
Expect order book to increase in 2Q/3Q
Current Business Conditions
Metrics indicate business activity should improve from current levels…timing and magnitude hard to predict!

© 2009 Boart Longyear. All rights reserved.
6
2009 Priorities
Shift in focus From Growth to Cash
and Cost
2009 Cash Levers Capex; Working Capital; Acquisitions
“Cost out”
actions Started in 4th
quarter & accelerating
Debt Refinance by year end
Free Cash Flow Positive Under the Range of Current Planning Scenarios

© 2009 Boart Longyear. All rights reserved.
7

© 2009 Boart Longyear. All rights reserved.
8
2008 Consolidated Overview
5
(1 ) Gross margin includes depreciation expense and 2007 has been restated to reflect certain SG&A re-classifications(2 )
Adjusted EBITDA excludes the impact of $20.3 million of restructuring and impairment charges.(3) Adjusted NPAT excludes the after-tax impact ($13.8 million) of restructuring and impairment charges.
'07 / '08US $M 2007 2008 % change
Revenue 1,576 1,839 17%
Gross Margin 1 506 578 14%Gross Margin % 32% 31%
EBITDA 297 356 20%EBITDA Margin % 19% 19%
Adjusted EBITDA 2 376 Adjusted EBITDA Margin % 20%
NPAT 81 157 93%
Adjusted NPAT 3 171 Adjusted NPAT Margin % 9%
Cash From Operations 246 271 10%
2008 Highlights
Nov / Dec softer than expected
Volume growth and pricing
Organic and acquisition growth
Lower corporate SG&A (%)
Lower financing costs
$20 million of restructuring
Operating Cash flow up 10%

© 2009 Boart Longyear. All rights reserved.
9
2008 Consolidated OverviewRevenue Bridge
EBITDA Bridge
$s in
mill
ions
$s in
mill
ions
1,576
15181 60 25 54
1,839
2007 Revenue Price / Volume Rig Additions Acquisitions FX Divestitures 2008 Revenue
64
297
102
21 12 5
2 15
356
2007 EBITDA Pricing / Volume Rig Additions Acquisitions FX Cost Increases Divestitures Restructuring 2008 EBITDA

© 2009 Boart Longyear. All rights reserved.
10
Drilling Services
EBITDA Bridge
YOY price increases of approximately 7%
Three strategic acquisitions: Britton Brothers, Aqua Drilling and Eklund
Drilling
Labor
and other cost inflation recovered in price
YOY Growth 31%
'07 / '08US $ in millions 2007 2008 % change
Revenue 971 1,241 28%
EBITDA 225 295 31%EBITDA Margin % 23% 24%
225
2111
70
1
30 9 6
295
2007 EBITDA Rig Additions Acquisitions Pricing FX Gains Labor Inflation& Training
OperatingExpenses
Other 2008 EBITDA

© 2009 Boart Longyear. All rights reserved.
11
22
128125
30
13
4 111
12
2007EBITDA
Price Eff iciency& Sourcing
Savings
FX Gain Volume Divestitures CostInf lation
Other 2008EBITDA
Products
Average selling prices up by 5%
Revenues lower due to sale of Diamond Wire and MCE ($54 million YOY revenue impact)
Westrod
acquisition
Raw material costs higher
Revenue bookings very weak in Nov –
Dec period
EBITDA Bridge
YOY Growth 2%
(1)
Excluding impact of divestitures, YOY revenue change was 8%
'07 / '08US $ in millions 2007 2008 % change
Revenue 605 598 -1% 1
EBITDA 125 128 2%EBITDA Margin % 21% 21%

© 2009 Boart Longyear. All rights reserved.
12
2009 Goal –
Maximize cash to minimize debt
Net Working Capital Analysis
1 Yearly cycle in working capital
2 Working capital reduces with lower revenues
Capex
at maintenance levels + capitalized drilling rods and casings
Growth in Underground, Environmental and Energy
No acquisitions planned
Dividend suspended
Cash Levers
($200)
$0
$200
$400
$600
Dec 2007
Mar 2008
Jun 2008Sept 2
008Dec 2
008 0%
-25%
-50%
NWC
Com
pone
nts
in M
illio
ns
0.0%
5.0%
10.0%
15.0%
20.0%
25.0%
NW
C /L
TM R
even
ue
NWCAccounts PayableInventoryAccounts ReceivableNWC/LTM Revenue
$154
$40
$120 $119
$0$0
$57
$0
$129
$0
$50
$100
$150
$200
2007 2008 2009 est.
$s in
mill
ions
Capex Acquisitions - net Dividends
1 2
2009 Reduction in Revenue Scenarios
$249 $330 $40

© 2009 Boart Longyear. All rights reserved.
13
Debt Maturity Timeline
$585
$65
$162
$0
$100
$200
$300
$400
$500
$600
1Q09 2Q09 3Q09 4Q09 1Q10 2Q10 … … … … 2Q12
in M
illio
ns
Undrawn Revolver
LCs (2)
364 Day Line of Credit(3)Revolver (Drawn)
Term Loan B
Capital Structure
1.
Current pricing for debt does not include impact of $425 million
notional amount of floating to fixed rate swaps; average rate 4.7%.
2.
Outstanding letters of credit at 31 December 2008 were approximately $11 million
3.
364 Day Line of Credit put in place in January 2009
4.
Available liquidity at 31 December 2008 was approximately $83 million.
Libor + 55 bps, currently 2.05% 1
No repayments due in 2009
Strong and supportive bank group
By year end…
— Extend maturities
— Refinance
Libor + 65 bps, currently 1.05% 1
Libor + 65 bps, currently 2.15% 1$25 3
Undrawn
Revolver
LCs
2
364 Day Line of Credit 3
Revolver (Drawn)
Term Loan B
Term Loan A

© 2009 Boart Longyear. All rights reserved.
14
Variable Cost Structure Actions
Strict inventory controlling
Steel prices down by 32%
Renegotiating supplier terms
2008 Cash Cost of Goods Sold(~$1.2 billion)
Diesel prices down by 53%
Training and recruiting costs lower
Logistics costs lower
Returning under-utilized equipment
Drilling Services:Labor pressures diminishing
- less overtime
- no shift premiums
Experience / more efficient drill crews retained
Products:Reducing work weeks
Plant rationalizations continuing
Labor
Materials & Consumables
Fuel
& M
aint
enan
ce
Equipment & Lease
s
Travel & Freight
Other

© 2009 Boart Longyear. All rights reserved.
15
Financial Priorities for 2009
Manage / maintain liquidity position
Debt reduction planned to occur in 2009
Extension or refinancing of debt facilities expected by year end
Drive working capital conversion
Continue to adjust cost base to reflect current business environment
-
Direct costs
-
Corporate SG&A (Overheads)

© 2009 Boart Longyear. All rights reserved.
16

© 2009 Boart Longyear. All rights reserved.
17
Significant Slowdown in Business Environment Mining exploration spend expected to fall Mining and resources financing
from recent levels
Most metal prices have fallen
Source: GSJBW
Source: Bloomberg - equity and equity-linked issues in resources sector less than $200 mm in size; February 9, 2009
$0
$1,000
$2,000
$3,000
$4,000
1Q 2Q 3Q 4Q 1Q 2Q 3Q 4Q 1Q 2Q 3Q 4Q 1Q 2Q 3Q 4Q 1Q
$ in
US
Bill
ions
2005 2006 2007 2008 2009
Exploration by Mineral
$0
$2
$4
$6
$8
$10
$12
$14
2004 A 2005 A 2006 A 2007 A 2008 B
in B
illion
s of U
SD Other
PGM
Diamond
Base Metals
Gold
Source: MEG 2008
Source: Bloomberg
Fundamental demand drivers are challenging …
Major mining companies delaying exploration and production
Juniors conserving cash…….some recent financing activity
Consumable stock levels being reduced
Capital equipment decisions deferred
20%
40%
60%
80%
100%
120%
140%
Feb-08 Apr-08 Jun-08 Aug-08 Oct-08 Dec-08 Feb-09
Gold Copper Zinc Nickel

© 2009 Boart Longyear. All rights reserved.
18
0%
50%
100%
150%
Sep-07 Dec-07 Mar-08 Jun-08 Sep-08 Dec-08 Mar-09
Leading IndicatorsOur Products backlog has fallen dramatically …
0%
20%
40%
60%
80%
100%
Sep-07 Dec-07 Mar-08 Jun-08 Sep-08 Dec-08 Mar-09
Our Drilling rig utilization levels are lower…
Bac
klog
–In
dexe
d to
Sep
t. ‘0
7R
ig U
tiliz
atio
n %
Post holiday seasonal rebound?
Customers consuminginventory
~85%

© 2009 Boart Longyear. All rights reserved.
19
Business Restructuring Initiatives
Corporate SG&A reductions
Regional consolidations
$80 million(~2,000 positions)
Transfer of Adelaide manufacturing
Shift/capacity reductions at:– Salt Lake City, United States
– North Bay, Canada
– Wuxi, China
– Wroclaw, Poland
– Eiterfeld, Germany
– Mississauga, Canada
Parked rigs and released drilling crews
Consolidated support services
Rooftop reductions
Hiring and pay freeze; executives and Directors salary reduction of 10%
Voluntary separation program initiated
Continue divesting of non-core assets
2. Additional actions in process …
Sold U.S. Residential Water
Closed France E&I
1. Fourth quarter actions …
Drilling Services
1,311 Positions
SG&A276 Positions
Products Manufacturing 413 Positions

© 2009 Boart Longyear. All rights reserved.
20
Boart Longyear Advantages
Source: Management estimates.
~50% of Rigs($791 million)
~15% of Rigs($230 million)
~10% of Rigs($309 million)
~25% of Rigs($508 million)
North America
South America
Asia Pacific
EMEA
Diversification…
Commodity
Geography Products andServicesExploration andProduction Customer Accounts
$
= 2008 Revenues
© 2009 Boart Longyear. All rights reserved.
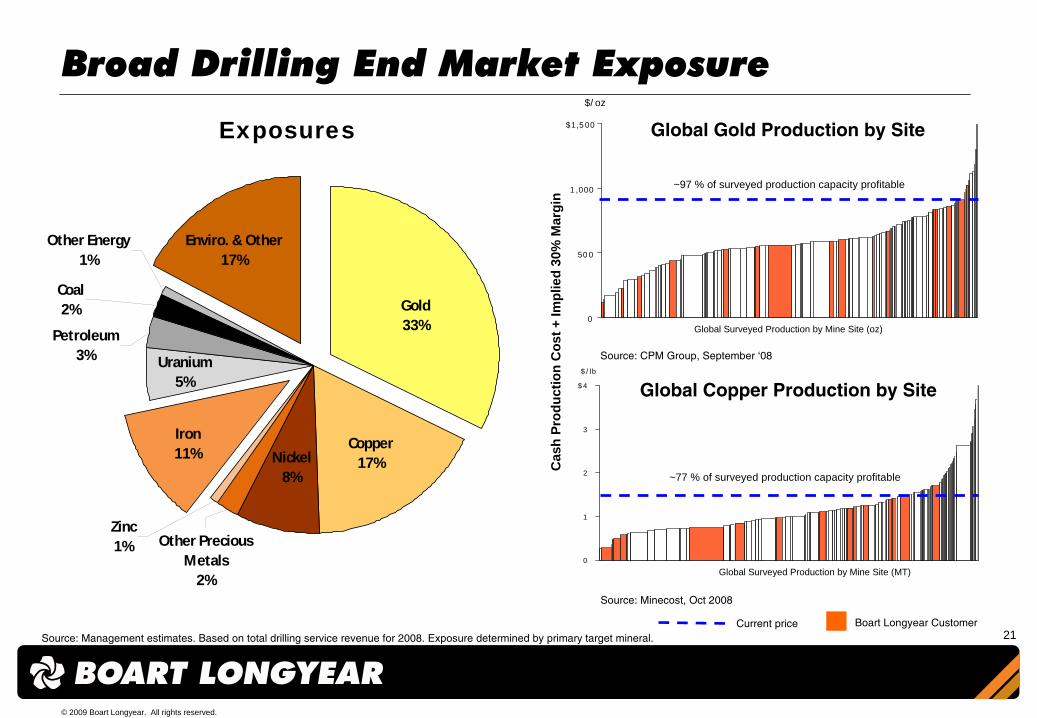
21
0
1
2
3
$4
$/lb
Global Copper Production by Site
~77 % of surveyed production capacity profitable
Source: Minecost, Oct 2008
Global Surveyed Production by Mine Site (MT)
Broad Drilling End Market Exposure
Exposures
Source: Management estimates. Based on total drilling service revenue for 2008. Exposure determined by primary target mineral.
Enviro. & Other17%
Other Energy 1%
Coal2%
Petroleum3% Uranium
5%
Iron11%
Zinc1% Other Precious
Metals2%
Nickel8%
Copper17%
Gold33%
Boart Longyear Customer
Cas
h Pr
oduc
tion
Cos
t + Im
plie
d 30
% M
argi
n
0
500
1,000
$1,500
$/oz
Current price
Source: CPM Group, September ‘08
Global Gold Production by Site
~97 % of surveyed production capacity profitable
Global Surveyed Production by Mine Site (oz)

© 2009 Boart Longyear. All rights reserved.
22
Production~25%
Development~50%
Exploration~25%
Greenfield Exploration
Mine Site Development
Underground Production
Resource Definition
1Management estimates based on 2008 Drilling Services revenues
Majority of drilling activity is focused on Production and Development

© 2009 Boart Longyear. All rights reserved.
23
Key Account Management (KAM)
Capital spending of Majors expected to be more stable…
(1)
Drilling Services division
Top 10 = 35.6% of 2008 Revenues1
Top 10 = 32.9% of 2007 Revenues1

© 2009 Boart Longyear. All rights reserved.
24
Long Term View…Ongoing Product Development
Drilling Services– Hands-Free Rod Handling– Mobile Underground Drilling– Energy Markets (GEO & CBM)– Sonic
Consumables– Quick Descent Core Barrel– High Productivity Coring System
New Product Vitality Index2008 2007
% of Products revenue from introduction in last 3 years 9% 4%
Gross margin uplift on new product introductions 260 b.p.
4200 Exploration Drill Hands-free rod handler
Capital Equipment– 4200 Exploration Drill– DB95 Tie Back Drill– Fly Rig (heli-portable)
Percussive– S215M2 Quiet Rock Drill
Mobile Drill Rig (MDR)Target of ~20%

© 2009 Boart Longyear. All rights reserved.
25
2009

© 2009 Boart Longyear. All rights reserved.
26
$0
$500
$1,000
$1,500
$2,000
2008 Actual 0% -25% -50%2009 Revenue Scenarios
Reve
nues
in $
US
mill
ions
Very challenging operating environment
Efficiency will improve…Costs lower1) Experienced crews
2) Newer rigs3) Lower costs – labor, logistics and fuel
Extend or Refinance by year end
Gold, Environmental, Underground…Stable
Planning Scenarios(Dec 2008)
Operating Rhythms…
Quarterly Monthly
Monthly Weekly
Weekly Daily
2009 Focus

© 2009 Boart Longyear. All rights reserved.
27

© 2009 Boart Longyear. All rights reserved.
28

© 2009 Boart Longyear. All rights reserved.
29
Basis of Preparation
Financial information has been prepared in accordance with A-IFRS
All financial figures are reported in US$
Earning per share computations reflect the weighted average number of ordinary shares issued as at 31 December 2007 (1,489,057,017) and 31 December 2008 (1,502,010,607)

© 2009 Boart Longyear. All rights reserved.
30
2008 Income StatementExtract from the Boart Longyear Annual Financial Report –
year ended 31 December 2008
2008 2007US$'000 US$'000
Revenue 1,838,538 1,575,737 Cost of goods sold (1,260,620) (1,069,360) Gross margin 577,918 506,377
Other revenue - - Other income 18,427 18,466 General and administrative expenses (181,695) (150,260) Selling and marketing expenses (118,295) (129,295) Restructuring expenses and related impairments (20,328) (5,584) Other expenses (6,697) (2,734) Operating profit 269,330 236,970
Interest income 1,637 5,012 Finance costs (39,688) (105,922)
Profit before taxation 231,279 136,060 Income tax (expense) benefit (74,555) (54,945)
Profit for the year attributable to equity holders of the parent 156,724 81,115
Earnings per share:Basic and diluted earnings per share 10.4 cents 5.4 cents
Consolidated

© 2009 Boart Longyear. All rights reserved.
31
2008 2007US$'000 US$'000
Current assetsCash and cash equivalents 50,603 87,548 Trade and other receivables 234,578 243,212 Inventories 177,296 176,265 Other financial assets 306 604 Current tax receivable 10,161 9,918 Prepaid expenses 26,166 32,975
499,110 550,522 Assets classified as held for sale - 16,067 Total current assets 499,110 566,589
Non-current assetsProperty, plant and equipment 403,693 358,360 Goodwill 234,571 206,186 Other intangible assets 73,456 29,478 Deferred tax assets 68,537 31,391 Other financial assets - - Other assets 1,609 544 Defined benefit plan asset 13,031 19,797 Total non-current assets 794,897 645,756 Total assets 1,294,007 1,212,345 Current liabilitiesTrade and other payables 195,597 244,685 Provisions 23,109 14,318 Current tax payable 32,378 25,323 Loans and borrowings 3,314 6,543
254,398 290,869 Liabilities directly associated with non-current
assets classified as held for sale - 8,370 Total current liabilities 254,398 299,239
Non-current liabilitiesTrade and other payables 1,293 200 Loans and borrowings 811,604 650,170 Other financial liabilities 27,197 12,985 Deferred tax liabilities 2,130 7,632 Provisions 45,037 22,479 Total non-current liabilities 887,261 693,466 Total liabilities 1,141,659 992,705 Net assets 152,348 219,640 EquityIssued capital 478,036 479,673 Reserves (118,319) 22,534 Other equity (141,539) (141,539) Retained earnings (accumulated losses) (65,830) (141,028) Total equity 152,348 219,640
Consolidated
2008 Balance sheetExtract from the Boart Longyear Annual Financial Report –
year ended 31 December 2008

© 2009 Boart Longyear. All rights reserved.
32
2008 2007US$'000 US$'000
Cash flows from operating activitiesProfit for the year 156,724 81,115 Adjustments provided by operating activities:
Income tax expense (benefit) recognised in profit 74,555 54,945 Finance costs recognised in profit 39,688 105,922 Depreciation and amortisation 86,347 59,848 Investment revenue recognised in profit (1,637) (5,012) Loss on sale or disposal of non-current assets 1,018 272 Gain on disposal of businesses (9,131) (3,218) Impairment of current and non-current assets 6,577 - Foreign exchange gain (loss) 6,462 (6,506) Share-based compensation 2,224 775 Non-operating expenses (536) 10,807
Changes in net assets and liabilities, net of effectsfrom acquisition and disposal of businesses:(Increase) decrease in assets:
Trade and other receivables (16,213) (24,025) Inventories (48,559) (46,326) Other assets (2,222) (6,187)
Increase (decrease) in liabilities:Trade and other payables (29,505) 46,084 Provisions 5,058 (22,904)
Cash generated from operations 270,850 245,590
Interest paid (38,023) (36,623) Interest received 1,637 5,012 Income taxes paid (91,593) (56,201) Net cash flows from operating activities 142,871 157,778
Consolidated
2008 Cash flowExtract from the Boart Longyear Annual Financial Report –
year ended 31 December 2008

© 2009 Boart Longyear. All rights reserved.
33
2008 2007US$'000 US$'000
Cash flows from investing activitiesPurchase of property, plant and equipment (145,910) (124,278) Proceeds from sale of property, plant and equipment 3,484 7,293 Development costs paid (5,081) (3,032) Software costs paid (15,890) - Payments for acquisitions of businesses (138,426) (129,833) Proceeds on disposal of subsidiary, net of cash disposed 19,624 10,053 Payments for investments - - Purchase of derivative instruments - (1,054)
Net cash flows used in investing activities (282,199) (240,851)
Cash flows from financing activitiesProceeds from issuance of shares - 1,952,655 Payments for share buy-back for LTIP (1,637) - Payments for share issuance costs - (76,613) Payments for debt issuance costs (523) (16,955) Interest and other costs of finance related to
pre-IPO debt structure - (37,332) Proceeds from borrowings 287,079 1,060,518 Repayment of borrowings (133,128) (1,709,427) Dividends paid (57,108) - Payment to redeemable note holders - (1,030,828)
Net cash flows from financing activities 94,683 142,018
Net increase (decrease) in cash and cash equivalents (44,645) 58,945
Cash and cash equivalents at the beginning of the year 87,548 25,530 Effects of exchange rate changes on the balance
of cash held in foreign currencies 7,700 3,073 Cash and cash equivalents at the end of the year 50,603 87,548
Consolidated
2008 Cash flow (continued)Extract from the Boart Longyear Annual Financial Report –
year ended 31 December 2008

© 2009 Boart Longyear. All rights reserved.
34
Reconciliation of 2007 Actual to 2007 Pro forma Income Statement
For additional details on the above pro forma adjustments, please see the company’s 2007 full year financial presentation which has been filed with the ASX.
US$m IPO & related Pro forma Head office Restructuring, Other 20072007 non-recurring acquisition relocation and enhancements non-recurring Foreign exchange Interest Tax Pro formaActual costs adjustments staffing costs and divestments costs gain adjustment adjustment Actual
Revenue 1,576 3 (8) 1,571
EBITDA 297 15 12 3 15 8 (13) 336
EBIT 237 15 12 3 16 8 (13) 278
Net Finance Costs (101) 5 61 (35)
Tax Expense (55) (23) (78)
NPAT 81 15 12 3 16 13 (13) 61 (23) 165

© 2009 Boart Longyear. All rights reserved.
35