presenters rod wolford and beth larsonrod wolford and beth larson level 3level 3 evaluations...
TRANSCRIPT

PresentersRod Wolford and Beth Larson
Level 3
Evaluations
Training Impact
FOF COMMUNICATIONS
OSHA Trainers Exchange Conference 2013

This educational material was produced under grant number SH-222242 from the Occupational Safety and Health Administration, U.S. Department of Labor to the Roofers & Waterproofers Research and Education Trust It does not necessarily reflect the views or policies of the U.S. Department of Labor, nor does mention of trade names, commercial products, or organizations imply endorsement by the U.S. Government.
4 Key Session Objectives
FOF
At the end of this session, you will be able to:
• Indicate likelihood of incorporating essential elements into future Level 3 evaluation plan
• Describe at least one specific way in which the elements could be adapted in an evaluation plan
• Identify at least 3 of 5 essential elements of successful Level 3 evaluation
• Say you learned at least one thing you can use in your work

Brief Review of Harwood Best Practices
FOF
Kirkpatrick Training Evaluation Model
Evaluating Training Programs, Donald Kirkpatrick, 1975Preparing Instructional Objectives, Robert Mager, 1975Report from 1999 National Conference on Workplace Safety and Health Training, DHHS (NIOSH)
• Level 1 – Reaction: immediate perceptions of training quality/usefulness (Ex: Rate instructor, materials, facility, etc.)
• Level 2 – Learning: immediate knowledge testing
• Level 3 – Behavior/Impact: changes in practices and/or conditions at least 3 to 6 months after training
Tight budgets
Big workplace hazards and risks
Short timeframes
Possible nationwide scope of many Harwood grant programs
Level 3: Assess Impact
FOF
Level 3 plans must be tailored for Harwood grants
Susan HarwoodTraining Grant
Program
Level 3 Planning
Think of S & H training as a type of INTERVENTION
Should the training and the evaluation be designed simultaneously?
Yes No I Don’t Know
Delivers a TREATMENT to trainees Primary purpose is to produce desired IMPACT(s)
FOF
When should Level 3 evaluation begin?
Level 3 Planning
FOF
1. Select a MODEL or LOGIC (rationale for training/evaluation design)
Overview of basic Level 3 evaluation tasks
5. Report findings to OSHA / provide feedback for training program
2. Develop a feasible HYPOTHESIS based on a CREDIBLE
PREMISE3. Design/administer measurement INSTRUMENTS (pre/post/follow up)
4. Conduct STATISTICAL ANALYSIS OF DATA
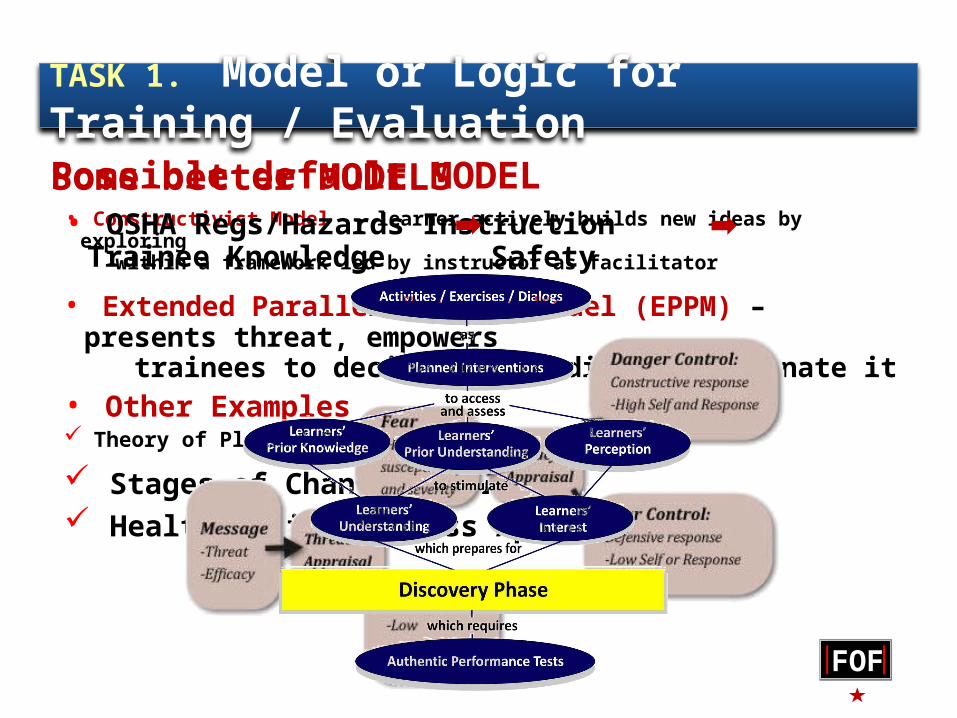
• Constructivist Model – learner actively builds new ideas by exploring within a framework led by instructor as facilitator
Some better MODELS
TASK 1. Model or Logic for Training / Evaluation
FOF
• Other Examples Theory of Planned Behavior Stages of Change Model Health Action Process Approach
• Extended Parallel Process Model (EPPM) – presents threat, empowers trainees to decide how to diffuse/eliminate it
Possible default MODEL• OSHA Regs/Hazards Instruction Trainee Knowledge Safety
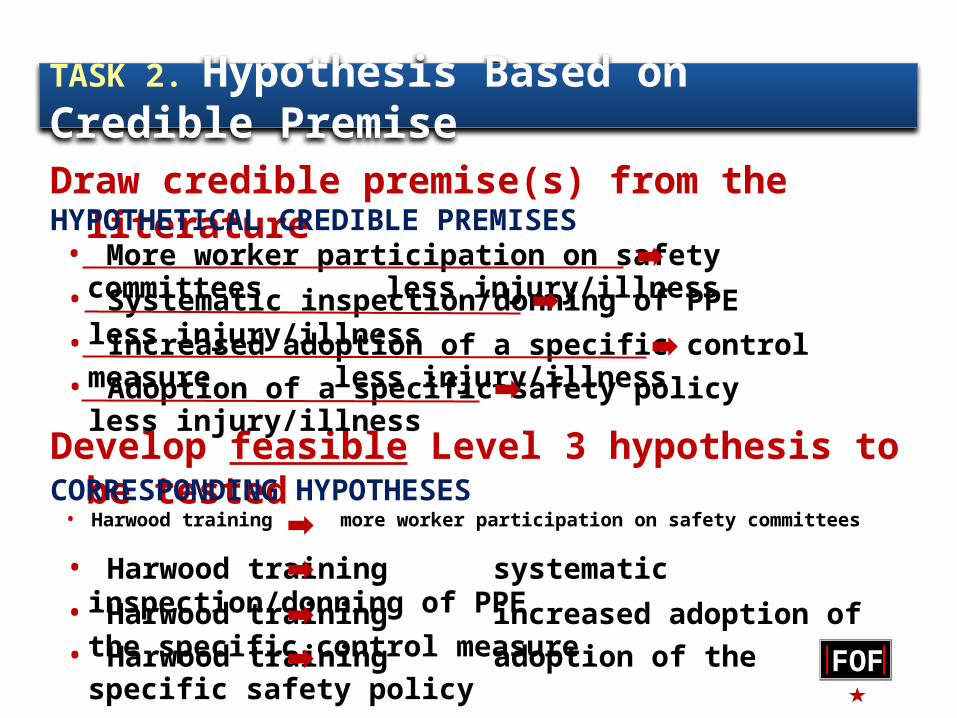
TASK 2. Hypothesis Based on Credible Premise
FOF
Draw credible premise(s) from the literature
Develop feasible Level 3 hypothesis to be tested
HYPOTHETICAL CREDIBLE PREMISES
CORRESPONDING HYPOTHESES
• More worker participation on safety committees less injury/illness
• Systematic inspection/donning of PPE less injury/illness
• Increased adoption of a specific control measure less injury/illness
• Adoption of a specific safety policy less injury/illness
• Harwood training more worker participation on safety committees
• Harwood training systematic inspection/donning of PPE
• Harwood training increased adoption of the specific control measure• Harwood training adoption of the specific safety policy
FOF
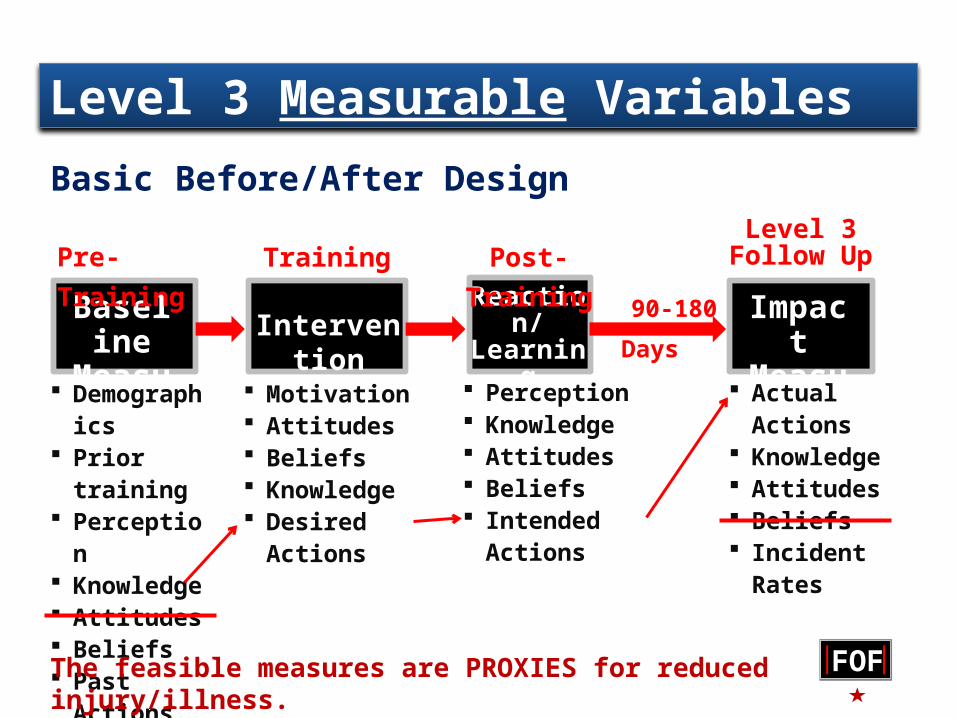
Level 3 Measurable Variables
BaselineMeasure Intervention
Reaction/LearningMeasure
Pre-Training Training Post-TrainingLevel 3
Follow Up
ImpactMeasure
90-180 Days
Demographics
Prior training Perception Knowledge Attitudes Beliefs Past Actions Incident
Rates
Motivation Attitudes Beliefs Knowledge Desired Actions
Perception Knowledge Attitudes Beliefs Intended Actions
Basic Before/After Design
The feasible measures are PROXIES for reduced injury/illness.
Actual Actions Knowledge Attitudes Beliefs Incident Rates
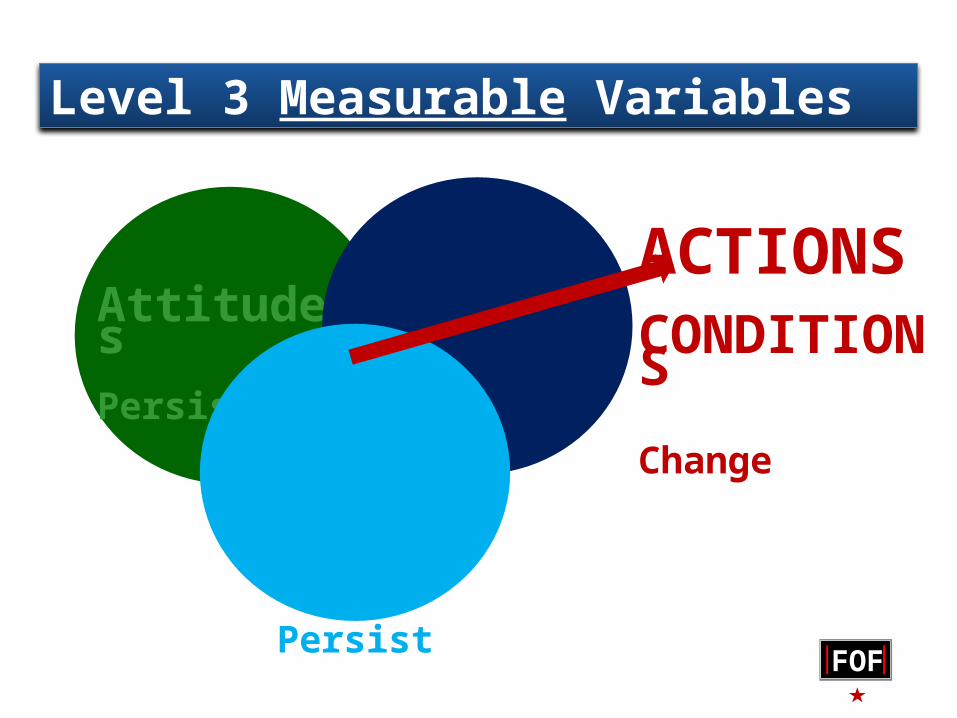
Level 3 Measurable Variables
FOF
Attitudes Persist
Knowledge Persists
Beliefs Persist
ACTIONS
CONDITIONS Change
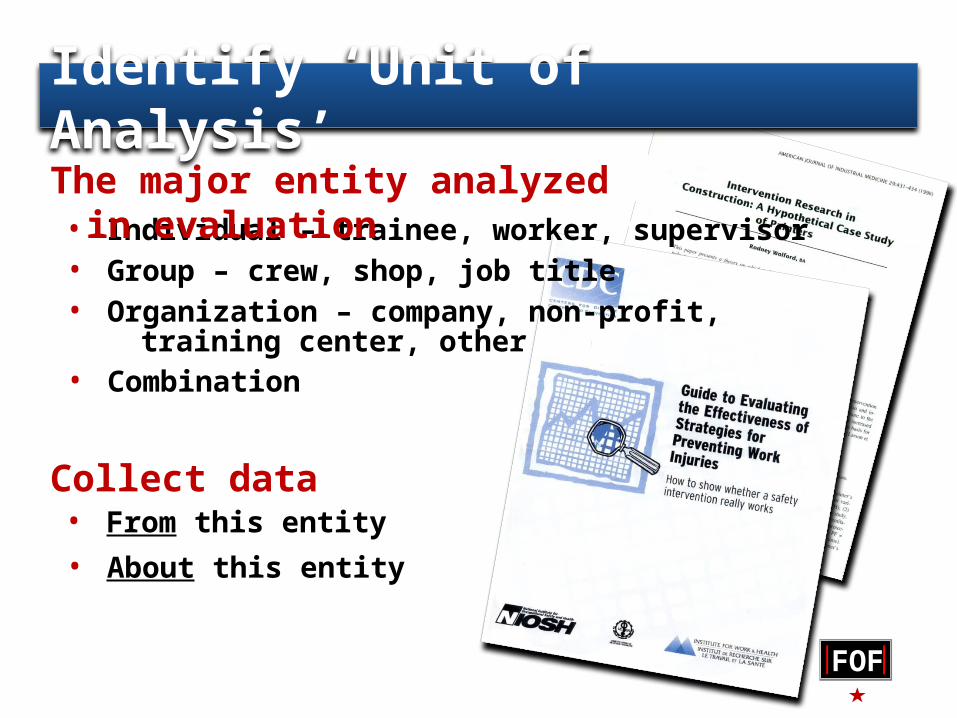
Identify ‘Unit of Analysis’
FOF
• Individual – trainee, worker, supervisor• Group – crew, shop, job title• Organization – company, non-profit,
training center, other• Combination
Collect data• From this entity
• About this entity
tionThe major entity analyzed in evaluation

Identify ‘Unit of Analysis’
FOF
EXAMPLE: Individual trainee as ‘unit of analysis’
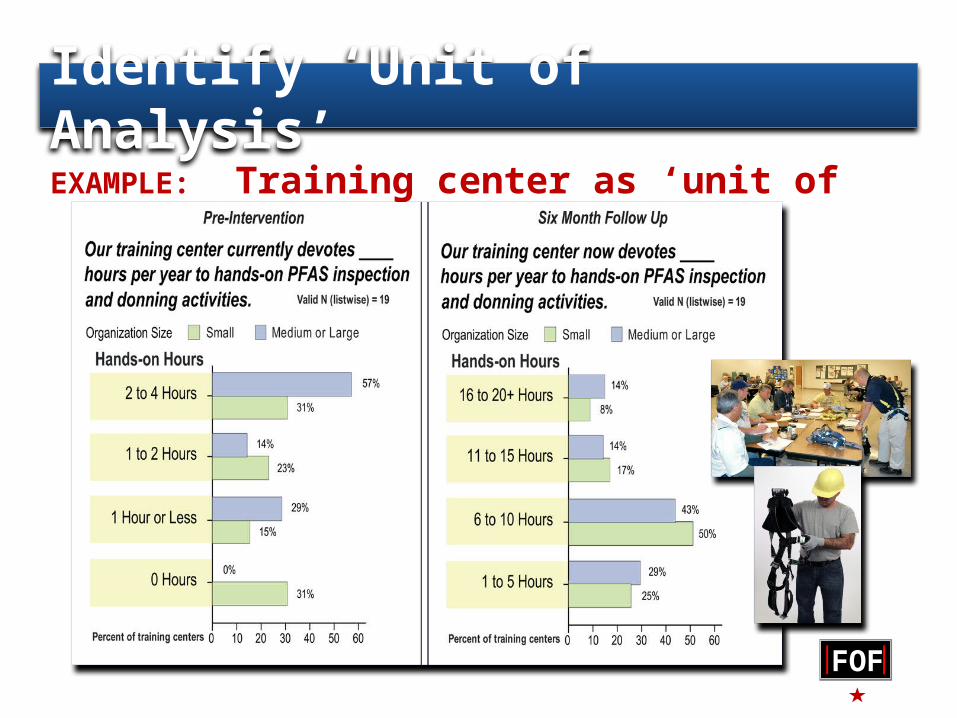
Identify ‘Unit of Analysis’
FOF
EXAMPLE: Training center as ‘unit of analysis’
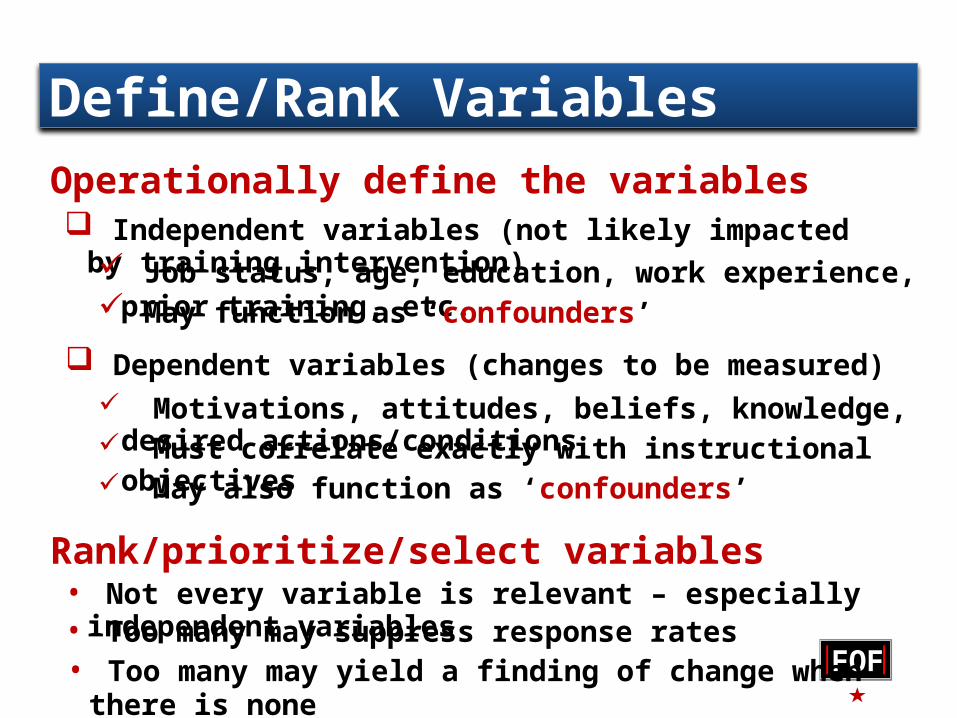
Define/Rank Variables
FOF
Operationally define the variables Independent variables (not likely impacted by training intervention)
Job status, age, education, work experience, prior training, etc.
Dependent variables (changes to be measured) Motivations, attitudes, beliefs, knowledge, desired actions/conditions
Rank/prioritize/select variables• Not every variable is relevant – especially independent variables• Too many may suppress response rates
May function as ‘confounders’
Must correlate exactly with instructional objectives May also function as ‘confounders’
• Too many may yield a finding of change when there is none
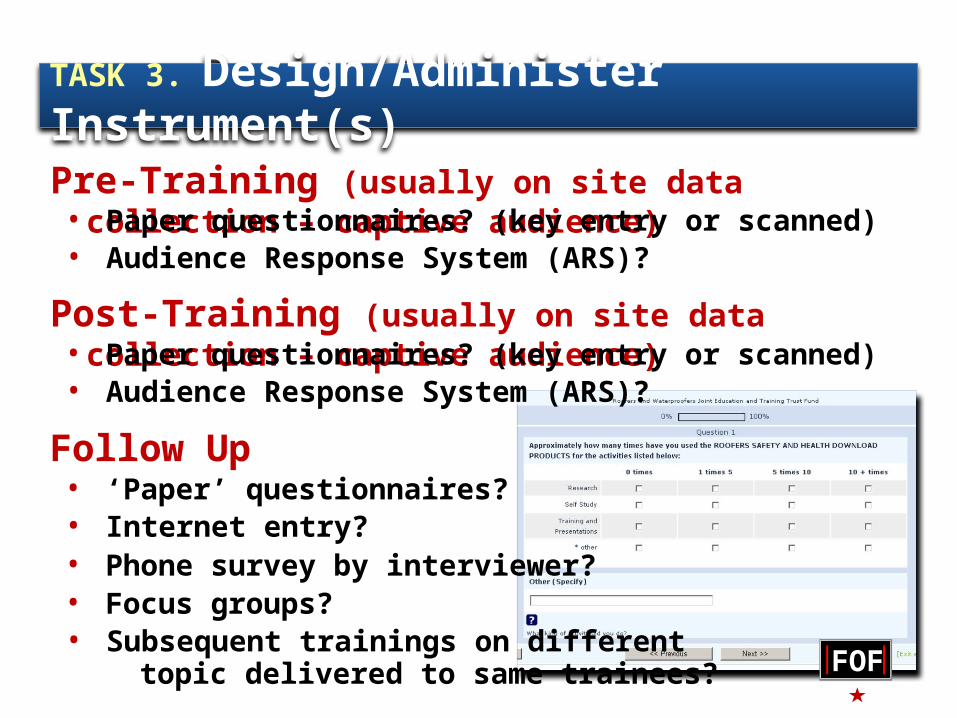
TASK 3. Design/Administer Instrument(s)
FOF
Pre-Training (usually on site data collection – captive audience)
Post-Training (usually on site data collection – captive audience)
Follow Up
• Paper questionnaires? (key entry or scanned)
• Paper questionnaires? (key entry or scanned)
• Audience Response System (ARS)?
• Audience Response System (ARS)?
• ‘Paper’ questionnaires?• Internet entry?• Phone survey by interviewer?
• Subsequent trainings on different topic delivered to same trainees?
• Focus groups?
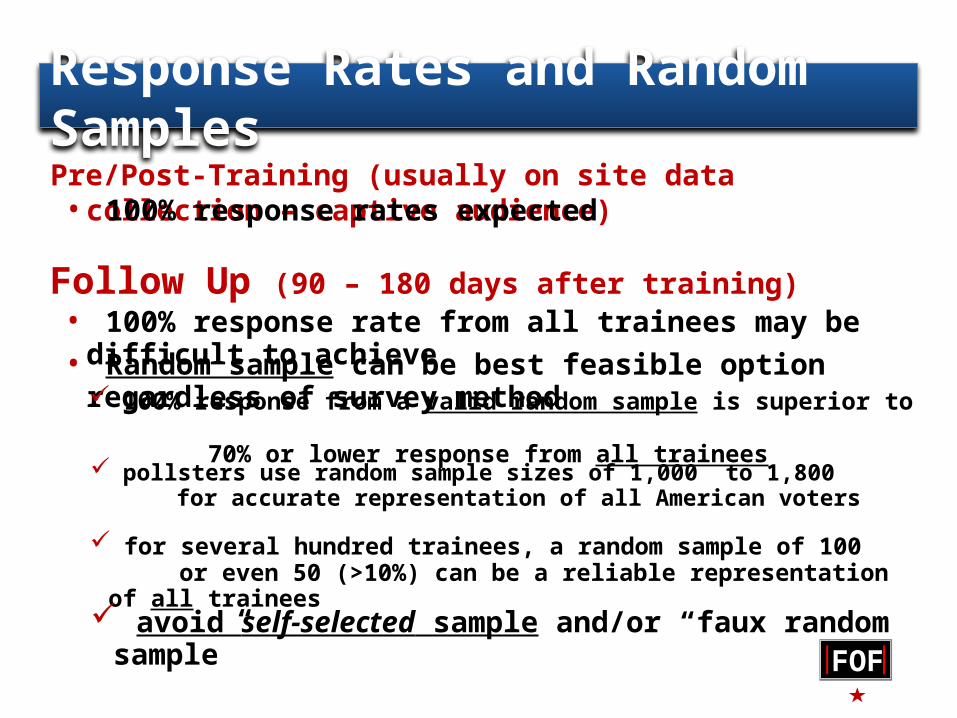
Response Rates and Random Samples
FOF
Pre/Post-Training (usually on site data collection – captive audience)
Follow Up (90 – 180 days after training)
• 100% response rates expected
• 100% response rate from all trainees may be difficult to achieve• Random sample can be best feasible option regardless of survey method
100% response from a valid random sample is superior to 70% or lower response from all trainees
pollsters use random sample sizes of 1,000 to 1,800 for accurate representation of all American voters
for several hundred trainees, a random sample of 100 or even 50 (>10%) can be a reliable representation of all trainees
avoid self-selected sample and/or “faux random sample”
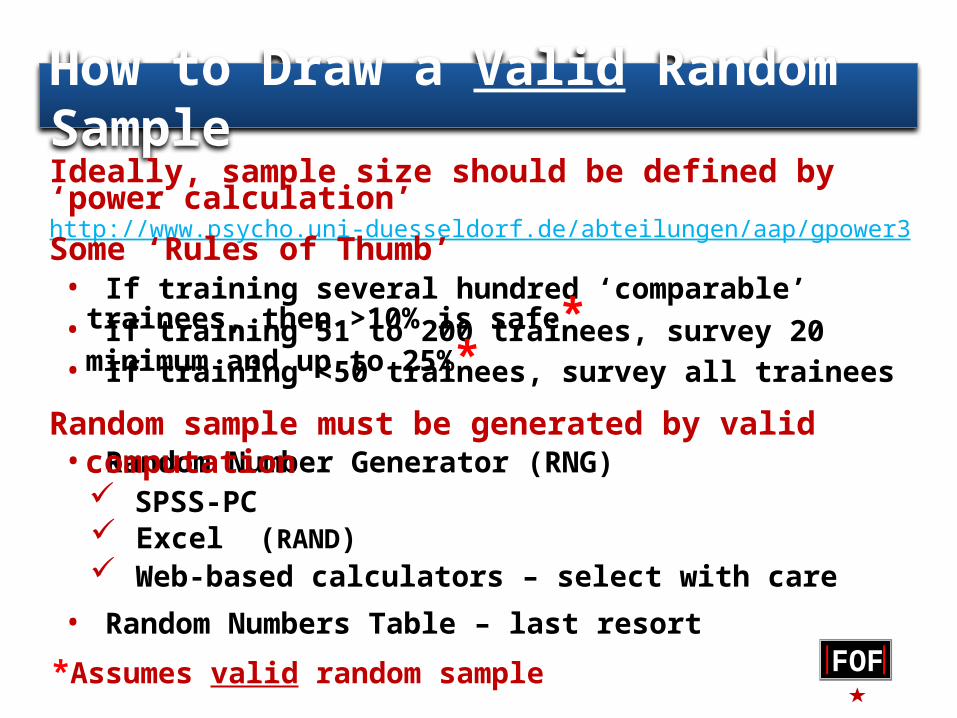
How to Draw a Valid Random Sample
FOF
Ideally, sample size should be defined by ‘power calculation’http://www.psycho.uni-duesseldorf.de/abteilungen/aap/gpower3
• Random Number Generator (RNG) SPSS-PC Excel (RAND) Web-based calculators – select with care
• Random Numbers Table – last resort
Random sample must be generated by valid computation
• If training several hundred ‘comparable’ trainees, then >10% is safe*• If training 51 to 200 trainees, survey 20 minimum and up to 25%*• If training <50 trainees, survey all trainees
Some ‘Rules of Thumb’
*Assumes valid random sample
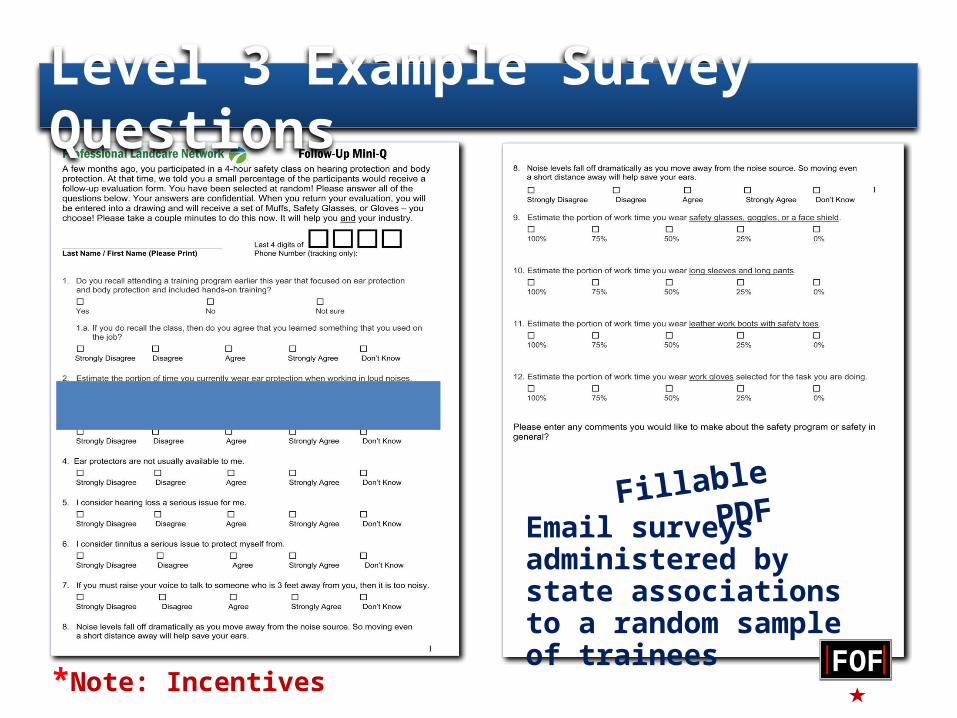
Fillable PDF
Email surveys administered by state associations to a random sample of trainees
*Note: Incentives
Level 3 Example Survey Questions
FOF
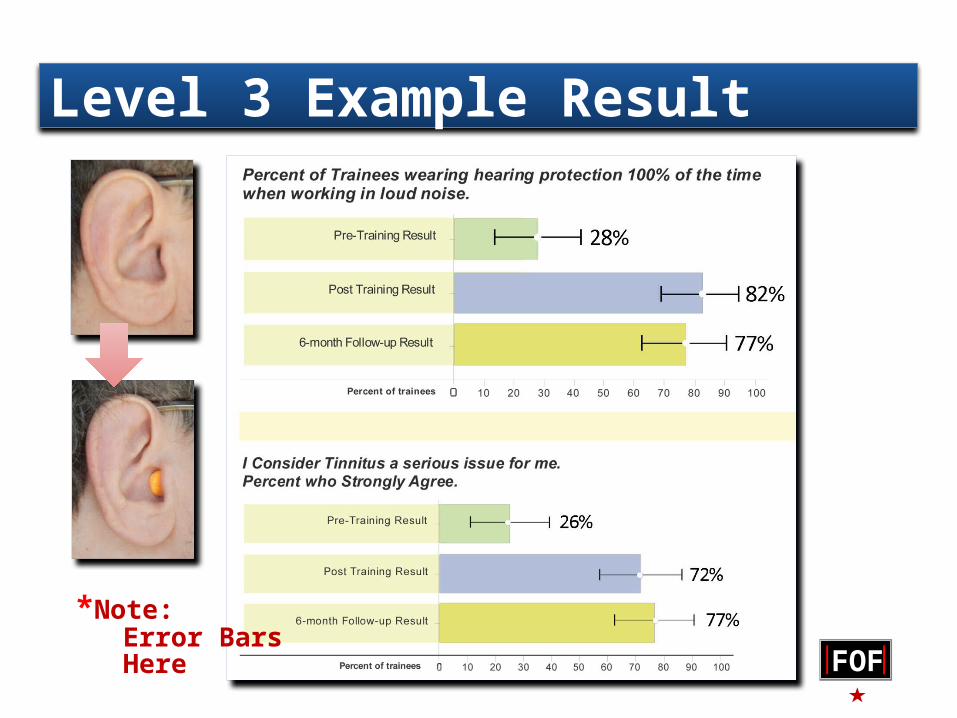
Level 3 Example Result
FOF
*Note: Error Bars Here
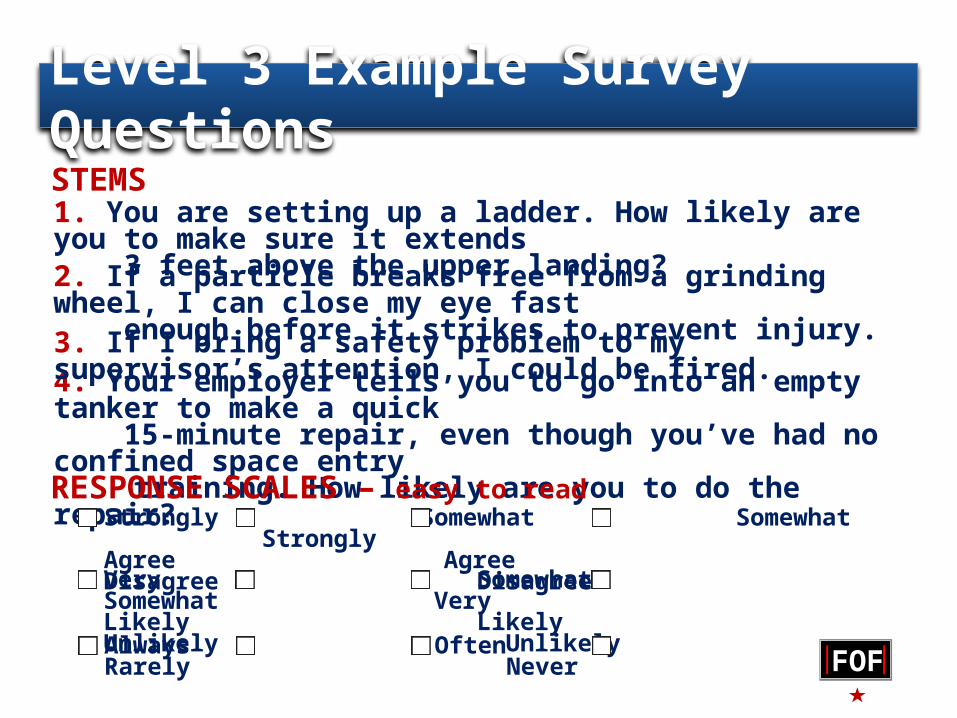
Level 3 Example Survey Questions
1. You are setting up a ladder. How likely are you to make sure it extends 3 feet above the upper landing?
4. Your employer tells you to go into an empty tanker to make a quick 15-minute repair, even though you’ve had no confined space entry training. How likely are you to do the repair?
2. If a particle breaks free from a grinding wheel, I can close my eye fast enough before it strikes to prevent injury.3. If I bring a safety problem to my supervisor’s attention, I could be fired.
STEMS
FOF
RESPONSE SCALES – easy to readStrongly Somewhat Somewhat StronglyAgree Agree Disagree Disagree
Very Somewhat Somewhat VeryLikely Likely Unlikely Unlikely
Always Often Rarely Never
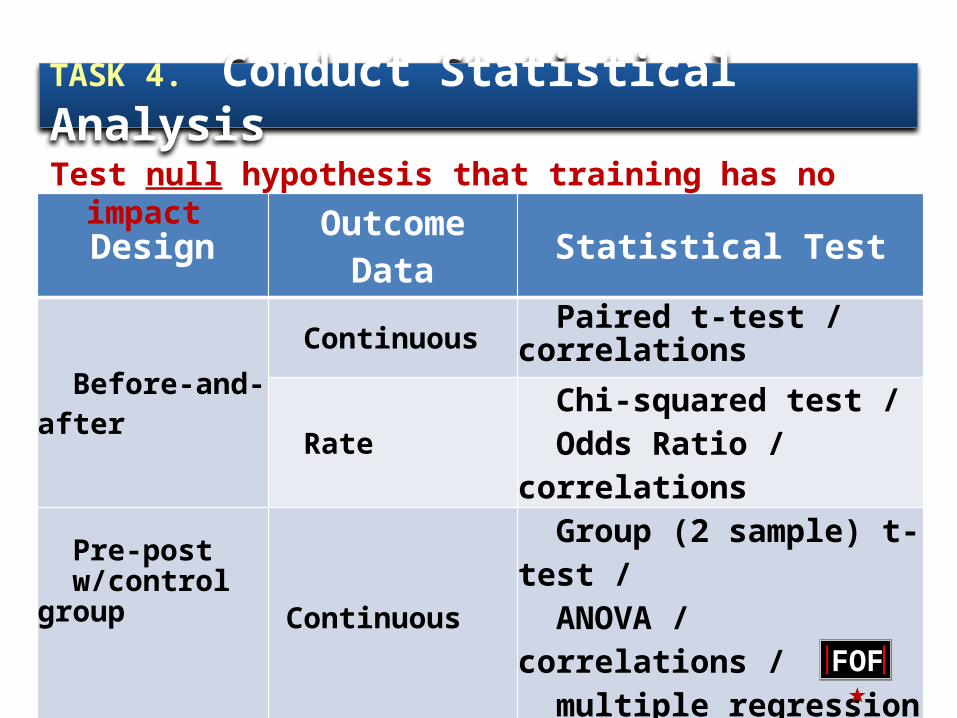
TASK 4. Conduct Statistical Analysis
Design Outcome Data Statistical Test
Before-and-after Continuous Paired t-test / correlations
Rate Chi-squared test / Odds Ratio / correlations
Pre-post w/control group
Continuous Group (2 sample) t-test / ANOVA / correlations / multiple regression
Rate z-test
Time series Categorical / Rate / Continuous
GLM Repeated Measures /Time series analysis
FOF
Test null hypothesis that training has no impact

Example Results: Two-sample t-test
FOF
Error Bar shows percents of non-Hispanic and Hispanic strongly agreeing targeted work activities are hazardous
The error bars are derived from Two-sample t-tests
RED = PREGREEN = POST
FOF
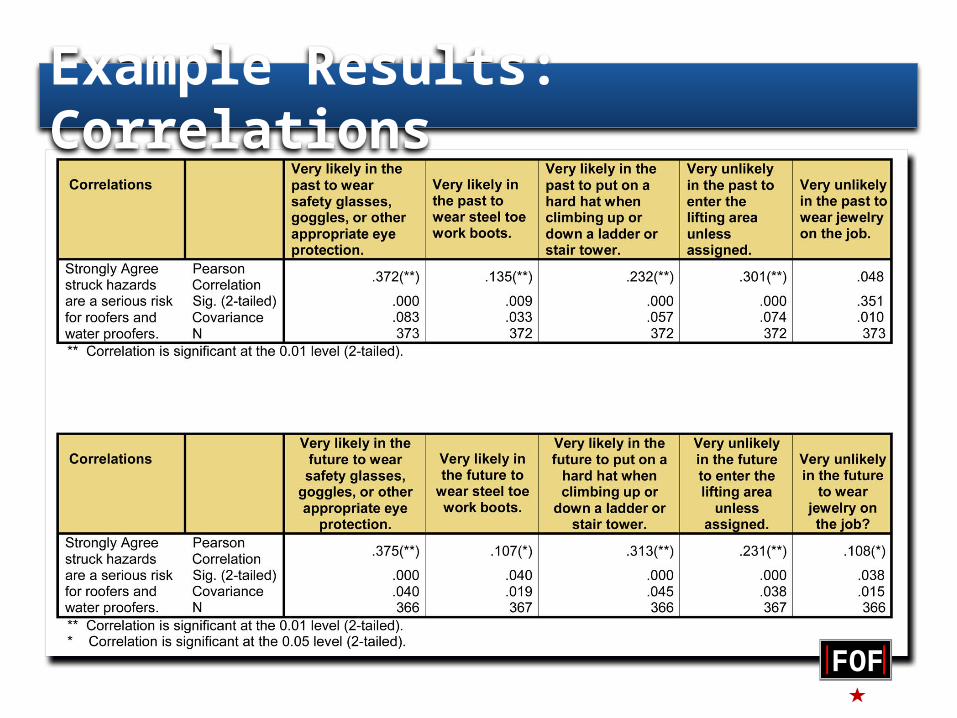
Example Results: Correlations
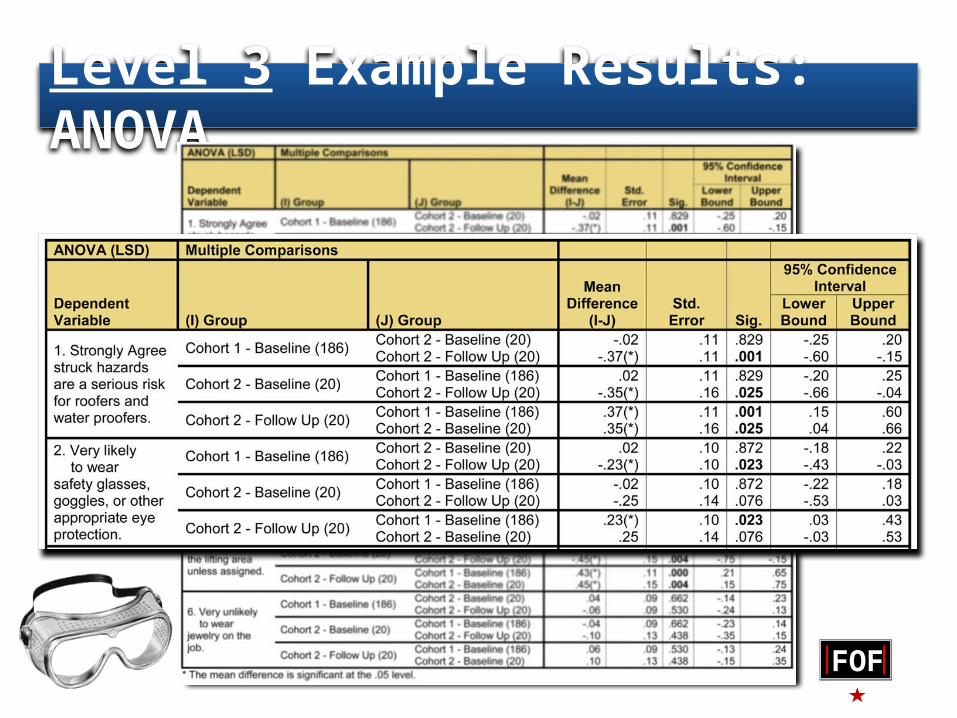
Level 3 Example Results: ANOVA
FOF
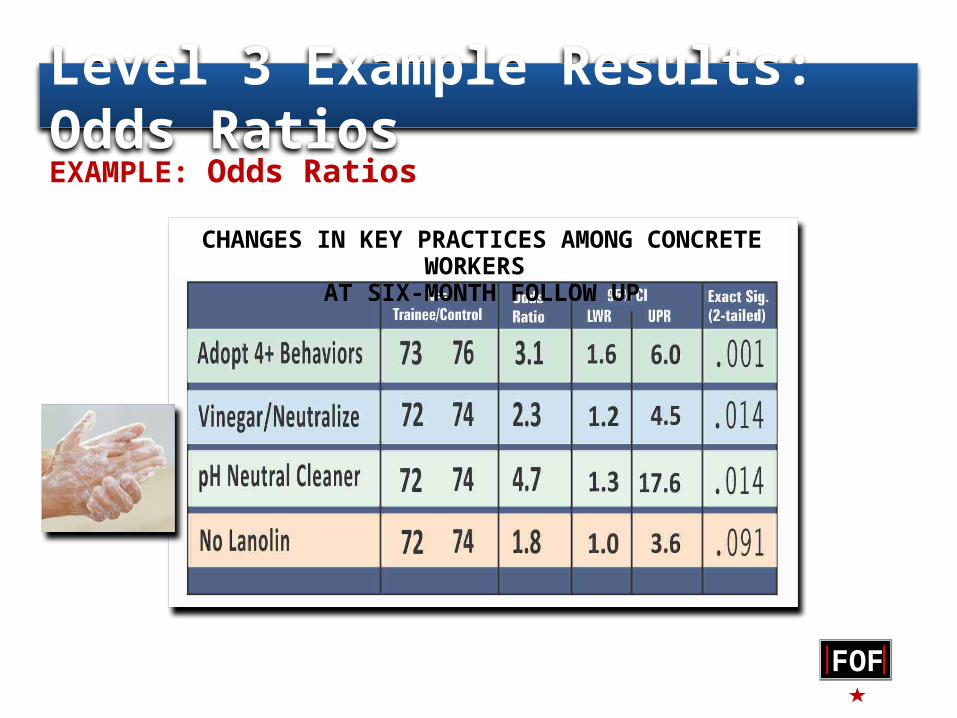
Level 3 Example Results: Odds Ratios
FOF
EXAMPLE: Odds Ratios
CHANGES IN KEY PRACTICES AMONG CONCRETE WORKERS AT SIX-MONTH FOLLOW UP
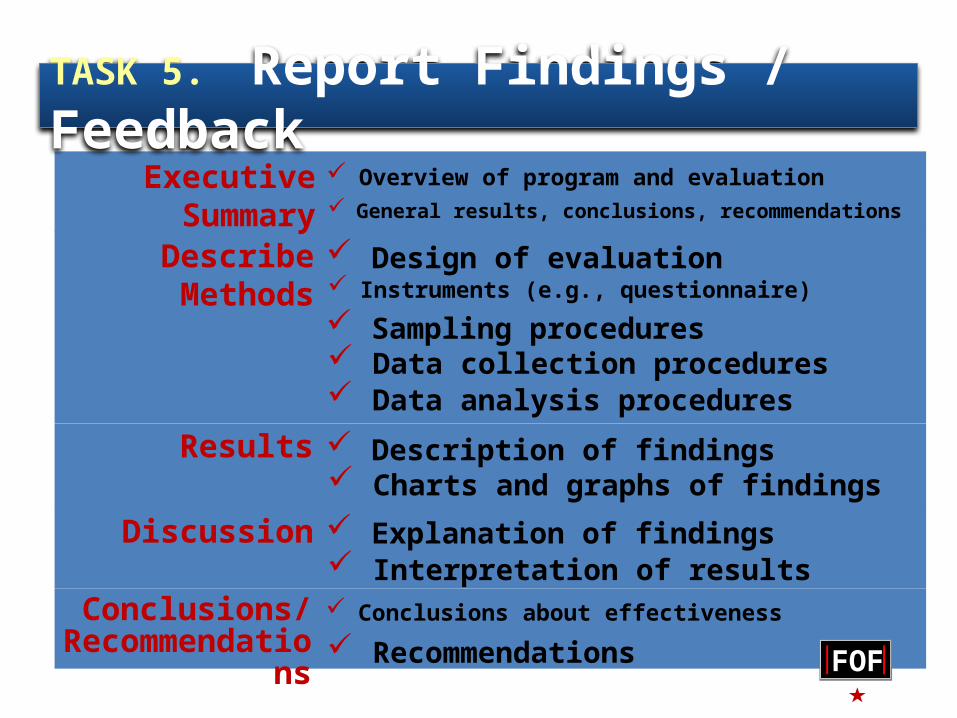
TASK 5. Report Findings / FeedbackExecutive Summary Overview of program and evaluation
FOF
General results, conclusions, recommendations
Describe Methods Design of evaluation Instruments (e.g., questionnaire) Sampling procedures Data collection procedures Data analysis procedures
Results Description of findings Charts and graphs of findings
Discussion Explanation of findings Interpretation of results
Conclusions/Recommendations
Conclusions about effectiveness Recommendations