presidents and the us economy: an econometric...
TRANSCRIPT

Presidents and The US Economy: An Econometric
Exploration
Working Paper 20324
July 2014

Introduction
• An extensive and well-known body of scholarly research documents and explores the fact that macroeconomic performance is a strong predictor of U.S. presidential election outcomes.
• Scores of papers find that better performance boosts the vote of the incumbent’s party. In stark. contrast, economists have paid scant attention to predictive power running in the opposite direction: from election outcomes to subsequent macroeconomic performance.
• while hardly a secret, is not nearly as widely known as it should be: The U.S. economy grows notably faster when a Democrat is president than when a Republican is.

• The U.S. economy not only grows faster, according to real GDP and other measures, during Democratic versus Republican presidencies, it also produces more jobs, lowers the unemployment rate, generates higher corporate profits and investment, and turns in higher stock market returns.
1. The stark facts the sample contains seven complete Democratic terms (Truman-2, Kennedy-Johnson, Johnson, Carter,Clinton-1, Clinton-2, and Obama-1) and nine complete Republican terms (Eisenhower-1, Eisenhower-2, Nixon, Nixon-Ford, Reagan-1, Reagan-2 , Bush I, Bush II-1, and Bush II-2)

• During the 64 years that make up these 16 terms, real GDP growth averaged 3.33% at an annual rate. But the average growth rates under Democratic and Republican presidents were starkly different: 4.35% and 2.54% respectively. This 1.80 percentage point gap (henceforth, the “D-R gap”) is astoundingly large relative to the sample mean. It implies that over a typical four year presidency the U.S. economy grew by 18.6% when the president was a Democrat, but only by 10.6% when he was a Republican. And the variances of quarterly growth rates are roughly equal (3.8% for Democrats, 3.9% for Republicans, annualized), so Democratic presidents preside over growth that is faster but not more volatile.


• Figure 1 displays the story graphically. Panel A shows average growth rates by presidential term. While there is substantial variation in growth rates (from over 6 percent for Truman-2 to under 1 percent for Bush II-2), the D-R gap is apparent. Panel B tells the same story in a slightly different way, by organizing the data by presidencies rather than by terms (treating both the eight Kennedy-Johnson years and the eight Nixon-Ford years as single presidencies, and with the data on Truman extended back to 1947:Q2).
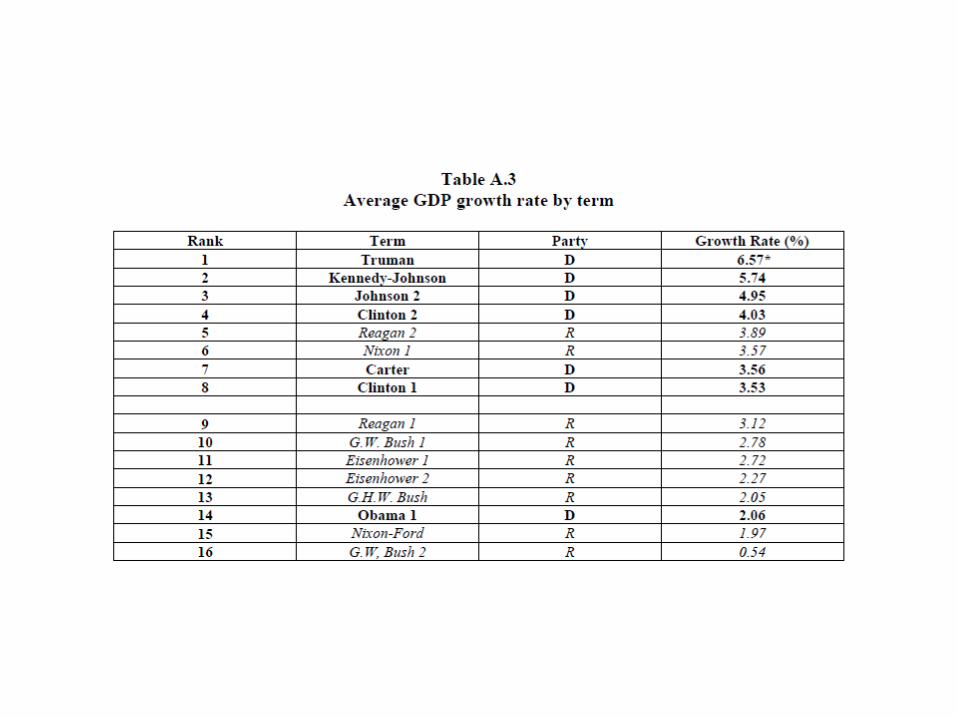
• The D-R gap can also be illustrated by rank-ordering the growth performances of all 16 terms in the sample (Table A.3)

• NBER recession dating gives an even more lopsided view of the D-R difference. Over the 256 quarters in these 16 terms, Republicans occupied the White House for 144 quarters, Democrats for 112. But of the 49 quarters classified by the NBER as in recession, only eight came under Democrats versus 41 under Republicans. Thus, the U.S. economy was in recession for 1.1 quarters on average during each Democratic term, but for 4.6 quarters during each Republican term. These results for GDP and quarters-in-recession are summarized in Panel A of Table 1.


• The other panels of Table 1 summarize results for a wide variety of other indicators of economic performance.
• Panel B considers alternative measures of aggregate output. The D-R gap for the growth rate of GDP per capita, which corrects for any differences in population growth, is essentially the same as for GDP itself (1.76% versus 1.80%). The D-R gap is somewhat larger in the nonfarm business sector (2.15%) and much larger for industrial production (3.77%). Each of these partisan growth gaps is statistically significant.

• Panel C considers employment and unemployment. The D-R gap in the annual growth rate of payroll employment is 1.42 percentage points, the gap in employee hours in nonfarm businesses is somewhat larger (1.65 points), and both are statistically significant. Somewhat puzzling, given these results, the partisan gap for employment is much smaller in the household survey—just 0.56 percentage point—and not statistically significant at conventional levels.
• Delving into the sectoral details (shown in Appendix Table A.4), the growth rates of every major component of real GDP except exports were higher under Democratic rather than Republican presidents, although the margins are small an statistically insignificant in a number of cases.


2. But might it actually be...?
• we ask in this short section whether the president’s party affiliation might actually be standing in for something else. For example, might the key difference really be some presidential trait other than his party affiliation? Or might the partisan makeup of Congress actually be the key ingredient? The answers, as we will see next, are no.
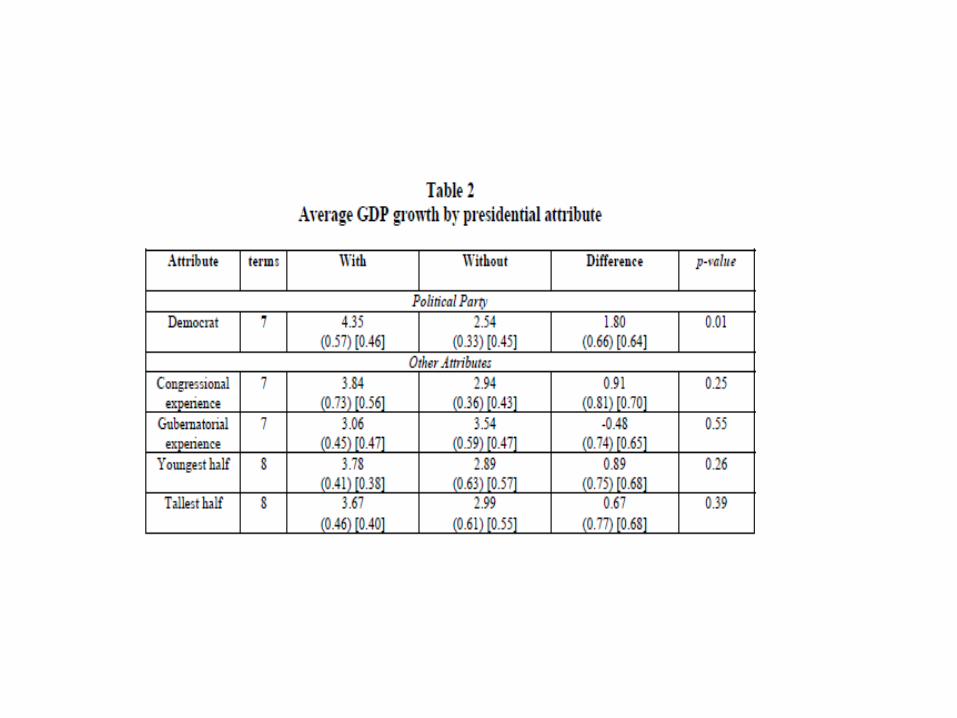
2.1 Other presidential traits • The four top presidential terms, ranked by GDP growth, are all
Democratic: Truman’s elected term, Kennedy-Johnson, Johnson’s elected term, and Clinton’s second term. Those four are the foundation of the overall D-R growth gap. But might there be some other characteristic, shared by these presidents, that explains the differential growth performance better? For example, maybe younger-than-average presidents--a group that includes Kennedy, Johnson, and Clinton--do better. (They do.) Or maybe presidents who were once members of Congress—a group that includes Truman, Kennedy, and Johnson--do better. (They also do)
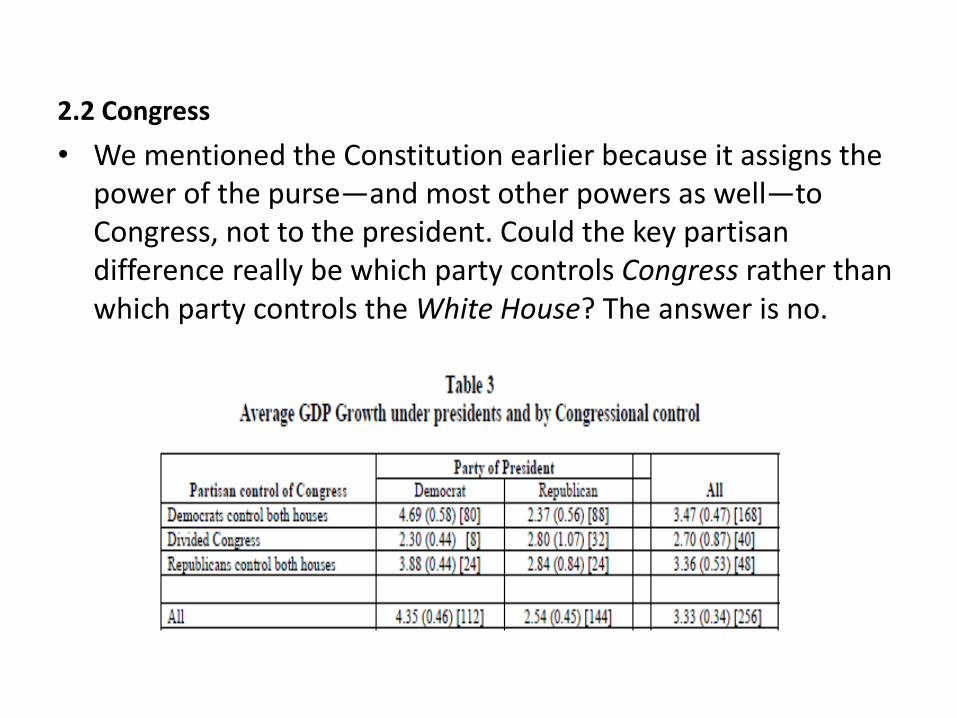
2.2 Congress
• We mentioned the Constitution earlier because it assigns the power of the purse—and most other powers as well—to Congress, not to the president. Could the key partisan difference really be which party controls Congress rather than which party controls the White House? The answer is no.
3.2 Initial conditions
• A different question of timing is whether the Democratic advantage can be attributed to relatively favorable initial conditions. That is, are Democrats more likely to take office just as the economy is poised to take off, and/or are Republicans more likely to take office when the economy is primed for a recession? If so, the direction of causality runs from economic performance to party of the president rather than from party to performance.


• Were these turnarounds anticipated? That is, were Democrats elected when future growth was expected to be strong and/or Republicans elected when recessions were imminent? Simple time series calculations suggest not. After all, GDP growth is positively serially correlated, so that high growth in year t is more likely to be followed by high growth in year t+1 than by low growth. Because Republicans inherit high growth, they should be more likely to experience high growth early in their administrations than Democrats. But Figure 2 indicates just the opposite. Thus, the reverse-causality explanation for the D-R gap is inconsistent with the serial correlation in the data.

• But perhaps the serial correlation calculation is too simplistic. Maybe unique factors in the transition years made high growth for new Democratic administrations and low growth for new Republican administrations forecastable. This question is investigated in several ways in Table 5, and the answer appears to be that little, if any, of the D-R gap was forecastable.


Empirical methods
• Several of these explanations suggest that the D-R gap arises in part from variables or “shocks” (e.g., oil price shocks, productivity shocks, or defense spending shocks) that we can potentially measure. Let et denote one of these shocks, yt denote the growth rate of real GDP.
• where Demt is an indicator variable for a Democratic president, Rept is an indicator for a Republican president, and ut is a regression error. (Clearly, Demt + Rept = 1 for every t).

Explaining the partisan growth gap: Results
• The first two lines of Table 7 look into oil prices more deeply by displaying the estimated effects of oil shocks for each presidential term.

Productivity
• Examining the term-by-term detail in Table 7reveals that much of the explanatory power comes from large positive TFP shocks in the Truman and Kennedy-Johnson administrations plus sizable negative shocks in Reagan’s first term, Bush I, and the second term of Bush II.
Wars
• Table 7 show that Ramey defense spending shocks led to an increase in average GDP growth of 1.1 percent during the Truman administration, but had only small effects in other administrations. We also carried out the analysis using the defense-related government expenditures shocks measured by Fisher and Peters (2010). These shocks are constructed as excess returns for a portfolio of stocks of defense contractors. Because these returns were not unusually large during the Korean War buildup, the Fisher-Peter shocks explain essentially none of D-R gap.

Conclusion
• it appears that the Democratic edge stems mainly from more benign oil shocks, superior TFP performance, a more favorable international environment, and perhaps more optimistic consumer expectations about the near-term future. Many other potential explanations are examined but fail to explain the partisan growth gap.

با تشکر از توجه شما