press release - rustocks.com file1 press release mobile telesystems announces financial results for...
TRANSCRIPT
1
Press release
Mobile TeleSystems Announces Financial Results for the Third Quarter Ended September 30, 2010
November 18, 2010
Moscow, Russian Federation – Mobile TeleSystems OJSC (“MTS” - NYSE: MBT), the leading telecommunications provider in Russia and the CIS, today announces its unaudited US GAAP financial results for the three months ended September 30, 2010.
Key Financial Highlights of Q3 20101
Consolidated revenues up 10.8% y-o-y to $2,911 million
Consolidated OIBDA2 up 8.2% y-o-y to $1,309 million with a 45.0% OIBDA margin
Consolidated net income attributable to the Group of $475 million
Free cash-flow3 increased in Q3 2010 and reached $2.4 billion for the nine months ended
September 30, 2010
Key Corporate and Industry Highlights
Acquisition of a 95% stake in Metro-Telecom for RUB 339.35 million ($11.01 million4)
Acquisition of Multiregion, one of the leading groups of broadband and cable TV providers in Russia, for $123.5 million
Decrease in the interest rates on Gazprombank‟s RUB 6.46 billion facility and on Sberbank‟s RUB 53 billion facilities
Completion of a series of transactions involving the sale by the Comstar group of companies to Rostelecom of the 25%+1 share in the charter capital of Svyazinvest for RUB 26 billion
Successful completion of voluntary tender offer to the Comstar shareholders resulting in the acquisition of 37,614,087 ordinary Comstar shares, or approximately 9.0% of Comstar‟s issued share capital
LTE launch in Uzbekistan – first commercial network in the CIS
Outlook upgrade of the S&P credit rating from Stable to Positive
Affirmation of the Fitch credit rating at BB+/Outlook Stable
Voluntarily repayment of the second tranche of the syndicated loan in the amount of $161.5 million; the loan was originally signed in April 2006 and carried a 5-year maturity
1 Because Comstar-UTS, TS-Retail and Metro-Telecom were acquired from JSC Sistema, the majority owner of MTS,
Comstar, TS-Retail and Metro-Telecom, the acquisitions were accounted for as transactions between entities under common control. Similar to a pooling of interest, whereby the assets and liabilities of Comstar-UTS, TS-Retail and Metro-Telecom were recorded at Sistema's carrying value, MTS' historical financial information was recast to include the acquired entities for all periods presented
2 See Attachment A for definitions and reconciliation of OIBDA and OIBDA margin to their most directly comparable US GAAP
financial measures 3 See Attachment B for reconciliation of free cash-flow to net cash provided by operating activity
4 According to the Russian Central Bank exchange rate of 30.8227 RUB/USD as of August 27, 2010

2
Redemption of the $400 million in October 2010
Placement of the series 07 and series 08 ruble-denominated bonds totaling RUB 25 billion
Transfer of MTS ordinary share to the “A1” listing on the Moscow Interbank Currency Exchange (MICEX)
Completion of 3G deployment throughout markets of operation with 3G launch in Turkmenistan
Signing of a non-binding indicative offer to acquire for RUB 11.59 billion ($379.01 million5)
Sistema-Telecom, whose primary assets include the distinctive „egg‟ trademarks used by MTS and its subsidiaries
Commentary
Mikhail Shamolin, President and CEO of MTS, commented, "For the period, we delivered strong sequential and annual growth in all of our markets of operation. During the quarter we improved Group‟s revenue 10.8%% year over year to $2.9 billion dollars. We attribute this growth to the positive seasonal dynamics, subscriber additions and a general increase in usage in our core markets." Alexey Kornya, MTS Vice President and Chief Financial Officer, said, "We have been very successful in our efforts aimed at optimizing our debt portfolio. We reached an agreement to lower interest rates on our Sberbank facilities in the total amount of 53 billion rubles. In line with our preference for ruble denominated debt, we voluntarily repaid the second – and last - tranche of our outstanding syndicated loan in the amount of $161.5 million; the loan was originally signed in April 2006 and carried a 5-year maturity. At the end of the period, non-ruble debt accounted for roughly 37% of our debt portfolio, but this should decrease by the end of the year." Mr. Kornya added, "In October we completed the redemption of a $400 million Eurobond. Just recently, we tapped local debt markets placing series-07 and series-08 ruble-denominated bonds - a 5-year 15 billion RUB issue with a coupon of 8.15% and a 7-year 10 billion RUB issue with a coupon of 8.7%. This makes us the first Russian corporate to solicit 7-year money from the market, which is a strong statement on our financial position given the volatility we are now seeing in global capital markets." Continued Mr. Shamolin, "As you are aware, we are moving forward with the acquisition of Comstar that creates the largest integrated telecommunications provider in Russia and the CIS. As a part of the process, we launched a voluntary tender offer (VTO) to Comstar shareholders for up to 9.0% of Comstar‟s issued share capital. The VTO was successful, which allowed us to increase our ownership stake in Comstar to 70.97% of Comstar‟s issued share capital (or 73.33% excluding treasury shares). The merger process is expected to be completed by mid-April 2011 subject to the shareholders‟ approval of the transaction and certain regulatory steps. We will seek the approval from the shareholders of both MTS and Comstar at Extraordinary General Meetings on December 23, 2010." He continued, "Earlier this week we signed a non-binding indicative offer to acquire 100% of Sistema Telecom LLC. As you may recall, in 2006 Sistema introduced the umbrella brand to link its telecommunications assets in the eyes of their customers. In the years since, however, the market has undergone significant changes that saw ownership of many of these key assets shift to MTS. Today, we are truly operating under a unified brand to all of our customers and are continuously extending our brand to different services. Given the prospects we see in our market, we feel it is only
5
According to the average exchange rate of 30.57 RUB/USD for the 60-day period from September 4, 2010 to November 4,
2010
3
logical to acquire full control of our logos and trademarks to ensure that all shareholders benefit equally in the brand‟s further development as we continue to implement our “3i” strategy."
This press release provides a summary of some of the key financial and operating indicators for the period ended September 30, 2010. For full disclosure materials, please visit http://www.mtsgsm.com/resources/reports/.
4
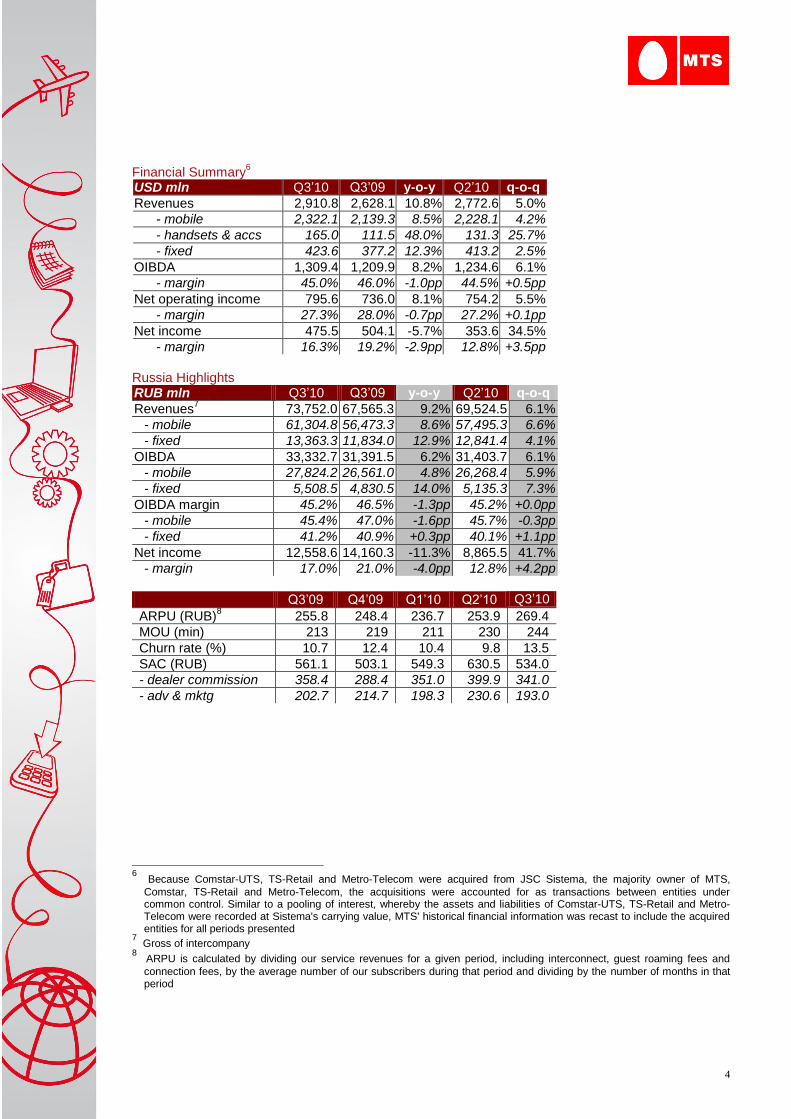
Financial Summary6
USD mln Q3‟10 Q3‟09 y-o-y Q2‟10 q-o-q
Revenues 2,910.8 2,628.1 10.8% 2,772.6 5.0%
- mobile 2,322.1 2,139.3 8.5% 2,228.1 4.2%
- handsets & accs 165.0 111.5 48.0% 131.3 25.7%
- fixed 423.6 377.2 12.3% 413.2 2.5%
OIBDA 1,309.4 1,209.9 8.2% 1,234.6 6.1%
- margin 45.0% 46.0% -1.0pp 44.5% +0.5pp
Net operating income 795.6 736.0 8.1% 754.2 5.5%
- margin 27.3% 28.0% -0.7pp 27.2% +0.1pp
Net income 475.5 504.1 -5.7% 353.6 34.5%
- margin 16.3% 19.2% -2.9pp 12.8% +3.5pp Russia Highlights RUB mln Q3‟10 Q3‟09 y-o-y Q2‟10 q-o-q
Revenues7 73,752.0 67,565.3 9.2% 69,524.5 6.1%
- mobile 61,304.8 56,473.3 8.6% 57,495.3 6.6%
- fixed 13,363.3 11,834.0 12.9% 12,841.4 4.1%
OIBDA 33,332.7 31,391.5 6.2% 31,403.7 6.1%
- mobile 27,824.2 26,561.0 4.8% 26,268.4 5.9%
- fixed 5,508.5 4,830.5 14.0% 5,135.3 7.3%
OIBDA margin 45.2% 46.5% -1.3pp 45.2% +0.0pp
- mobile 45.4% 47.0% -1.6pp 45.7% -0.3pp
- fixed 41.2% 40.9% +0.3pp 40.1% +1.1pp
Net income 12,558.6 14,160.3 -11.3% 8,865.5 41.7%
- margin 17.0% 21.0% -4.0pp 12.8% +4.2pp
Q3‟09 Q4‟09 Q1‟10 Q2‟10 Q3‟10
ARPU (RUB)8 255.8 248.4 236.7 253.9 269.4
MOU (min) 213 219 211 230 244
Churn rate (%) 10.7 12.4 10.4 9.8 13.5
SAC (RUB) 561.1 503.1 549.3 630.5 534.0
- dealer commission 358.4 288.4 351.0 399.9 341.0
- adv & mktg 202.7 214.7 198.3 230.6 193.0
6 Because Comstar-UTS, TS-Retail and Metro-Telecom were acquired from JSC Sistema, the majority owner of MTS,
Comstar, TS-Retail and Metro-Telecom, the acquisitions were accounted for as transactions between entities under common control. Similar to a pooling of interest, whereby the assets and liabilities of Comstar-UTS, TS-Retail and Metro-Telecom were recorded at Sistema's carrying value, MTS' historical financial information was recast to include the acquired entities for all periods presented
7 Gross of intercompany
8 ARPU is calculated by dividing our service revenues for a given period, including interconnect, guest roaming fees and
connection fees, by the average number of our subscribers during that period and dividing by the number of months in that period

5
Ukraine Highlights UAH mln Q3‟10 Q3‟09 y-o-y Q2‟10 q-o-q
Revenues 2,303.8 2,215.6 4.0% 2,146.4 7.3%
OIBDA 1,144.0 1,067.5 7.2% 1,004.9 13.8%
- margin 49.7% 48.2% +1.5pp 46.8% +2.9pp
Net income 364.2 195.8 86.0% 208.3 74.8%
- margin 15.8% 8.8% +7.0pp 9.7% +6.1pp
Q3‟09 Q4‟09 Q1‟10 Q2‟10 Q3‟10
ARPU (UAH) 40.1 38.3 35.2 39.5 41.6
MOU (min) 478 506 527 541 541
Churn rate (%) 10.4 9.7 9.4 7.2 6.6
SAC (UAH) 45.9 56.8 66.9 64.3 58.0
- dealer commission 16.3 22.3 34.2 31.8 29.4
- adv & mktg 17.7 22.7 21.2 21.4 17.8
- handset subsidy 1.4 2.6 2.1 1.8 1.3
- SIM card & voucher 10.5 9.2 9.4 9.2 9.5 Uzbekistan Highlights
9
USD mln Q3‟10 Q3‟09 y-o-y Q2‟10 q-o-q
Revenues 114.9 101.1 13.6% 113.3 1.4%
OIBDA 64.4 52.0 23.8% 65.8 -2.1%
- margin 56.1% 51.4% +4.7pp 58.1% -2.0pp
Net income 27.6 32.3 -14.6% 31.7 -12.9%
- margin 24.0% 32.0% -8.0pp 28.0% -4.0pp
Q3‟09 Q4‟09 Q1‟10 Q2‟10 Q3‟10
ARPU (USD) 5.1 5.0 4.8 5.0 4.8
MOU (min) 500 534 520 534 508
Churn rate (%) 8.1 8.0 5.9 6.1 7.2
SAC (USD) 8.3 6.7 6.1 6.0 7.8 Turkmenistan Highlights TMT mln Q3‟10 Q3‟09 y-o-y Q2‟10 q-o-q
Revenues 159.3 122.8 29.7% 152.3 4.6%
OIBDA 97.3 73.1 33.1% 94.3 3.2%
- margin 61.1% 59.5% +1.6pp 62.0% -0.9pp
Net income 59.9 44.5 34.6% 58.4 2.6%
- margin 37.6% 36.2% +1.4pp 38.4% -0.8pp
Q3‟09 Q4‟09 Q1‟09 Q2‟10 Q3‟10
ARPU (TMT) 29.7 27.6 25.2 25.0 23.3
MOU (min) 241 250 267 289 325
Churn rate (%) 4.5 5.7 9.9 3.0 6.1
SAC (TMT) 18.4 9.4 10.5 11.8 10.1
9 The functional currency in Uzbekistan is the US dollar
6
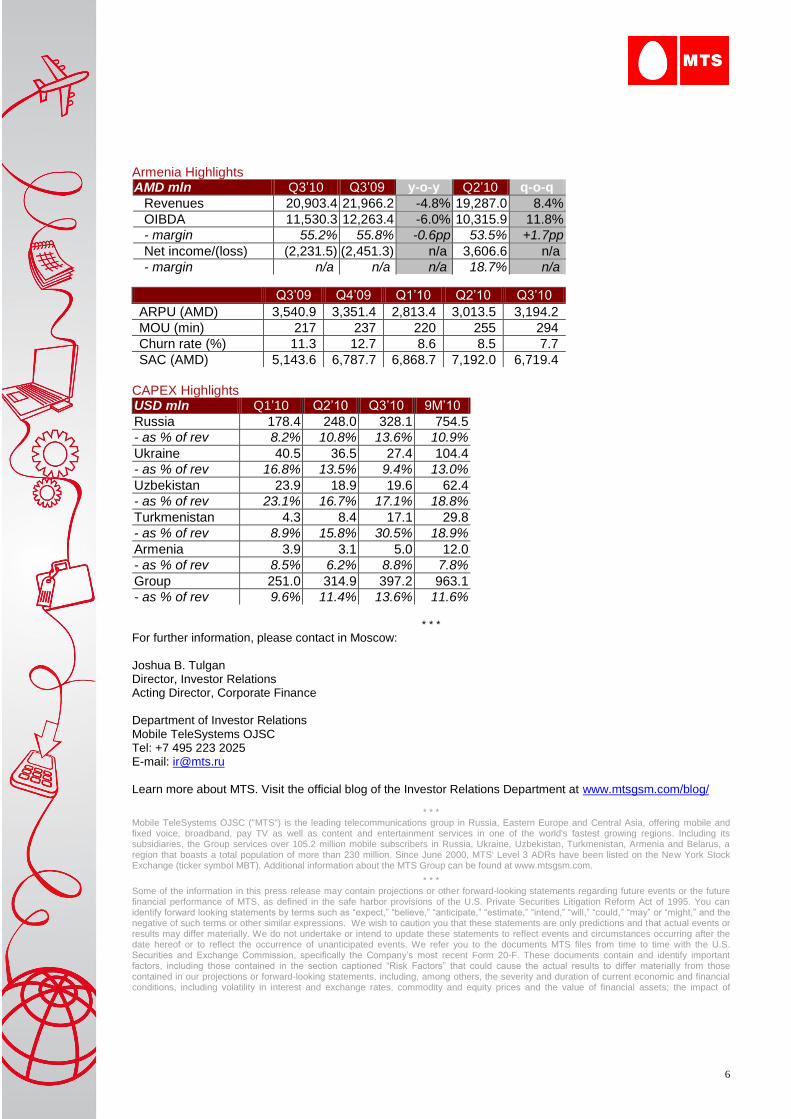
Armenia Highlights AMD mln Q3‟10 Q3‟09 y-o-y Q2‟10 q-o-q
Revenues 20,903.4 21,966.2 -4.8% 19,287.0 8.4%
OIBDA 11,530.3 12,263.4 -6.0% 10,315.9 11.8%
- margin 55.2% 55.8% -0.6pp 53.5% +1.7pp
Net income/(loss) (2,231.5) (2,451.3) n/a 3,606.6 n/a
- margin n/a n/a n/a 18.7% n/a
Q3‟09 Q4‟09 Q1‟10 Q2‟10 Q3‟10
ARPU (AMD) 3,540.9 3,351.4 2,813.4 3,013.5 3,194.2
MOU (min) 217 237 220 255 294
Churn rate (%) 11.3 12.7 8.6 8.5 7.7
SAC (AMD) 5,143.6 6,787.7 6,868.7 7,192.0 6,719.4 CAPEX Highlights USD mln Q1‟10 Q2‟10 Q3‟10 9M‟10
Russia 178.4 248.0 328.1 754.5
- as % of rev 8.2% 10.8% 13.6% 10.9%
Ukraine 40.5 36.5 27.4 104.4
- as % of rev 16.8% 13.5% 9.4% 13.0%
Uzbekistan 23.9 18.9 19.6 62.4
- as % of rev 23.1% 16.7% 17.1% 18.8%
Turkmenistan 4.3 8.4 17.1 29.8
- as % of rev 8.9% 15.8% 30.5% 18.9%
Armenia 3.9 3.1 5.0 12.0
- as % of rev 8.5% 6.2% 8.8% 7.8%
Group 251.0 314.9 397.2 963.1
- as % of rev 9.6% 11.4% 13.6% 11.6%
* * *
For further information, please contact in Moscow: Joshua B. Tulgan Director, Investor Relations Acting Director, Corporate Finance Department of Investor Relations Mobile TeleSystems OJSC Tel: +7 495 223 2025 E-mail: [email protected] Learn more about MTS. Visit the official blog of the Investor Relations Department at www.mtsgsm.com/blog/
* * *
Mobile TeleSystems OJSC ("MTS") is the leading telecommunications group in Russia, Eastern Europe and Central Asia, offering mobile and fixed voice, broadband, pay TV as well as content and entertainment services in one of the world's fastest growing regions. Including its subsidiaries, the Group services over 105.2 million mobile subscribers in Russia, Ukraine, Uzbekistan, Turkmenistan, Armenia and Belarus, a region that boasts a total population of more than 230 million. Since June 2000, MTS' Level 3 ADRs have been listed on the New York Stock Exchange (ticker symbol MBT). Additional information about the MTS Group can be found at www.mtsgsm.com.
* * * Some of the information in this press release may contain projections or other forward-looking statements regarding future events or the future financial performance of MTS, as defined in the safe harbor provisions of the U.S. Private Securities Litigation Reform Act of 1995. You can identify forward looking statements by terms such as “expect,” “believe,” “anticipate,” “estimate,” “intend,” “will,” “could,” “may” or “might,” and the negative of such terms or other similar expressions. We wish to caution you that these statements are only predictions and that actual events or results may differ materially. We do not undertake or intend to update these statements to reflect events and circumstances occurring after the date hereof or to reflect the occurrence of unanticipated events. We refer you to the documents MTS files from time to time with the U.S. Securities and Exchange Commission, specifically the Company‟s most recent Form 20-F. These documents contain and identify important factors, including those contained in the section captioned “Risk Factors” that could cause the actual results to differ materially from those contained in our projections or forward-looking statements, including, among others, the severity and duration of current economic and financial conditions, including volatility in interest and exchange rates, commodity and equity prices and the value of financial assets; the impact of

7
Russian, U.S. and other foreign government programs to restore liquidity and stimulate national and global economies, our ability to maintain our current credit rating and the impact on our funding costs and competitive position if we do not do so, strategic actions, including acquisitions and dispositions and our success in integrating acquired businesses, including Comstar-UTS, potential fluctuations in quarterly results, our competitive environment, dependence on new service development and tariff structures, rapid technological and market change, acquisition strategy, risks associated with telecommunications infrastructure, governmental regulation of the telecommunications industries and other risks associated with operating in Russia and the CIS, volatility of stock price, financial risk management and future growth subject to risks.
* * *
8
Attachments to the Third Quarter 2010 Earnings Press Release
Attachment A
Non-GAAP financial measures. This press release includes financial information prepared in accordance with accounting principles generally accepted in the United States of America, or US GAAP, as well as other financial measures referred to as non-GAAP. The non-GAAP financial measures should be considered in addition to, but not as a substitute for, the information prepared in accordance with US GAAP. Due to the rounding and translation practices, US dollar and functional currency margins, as well as other non-GAAP financial measures, may differ.
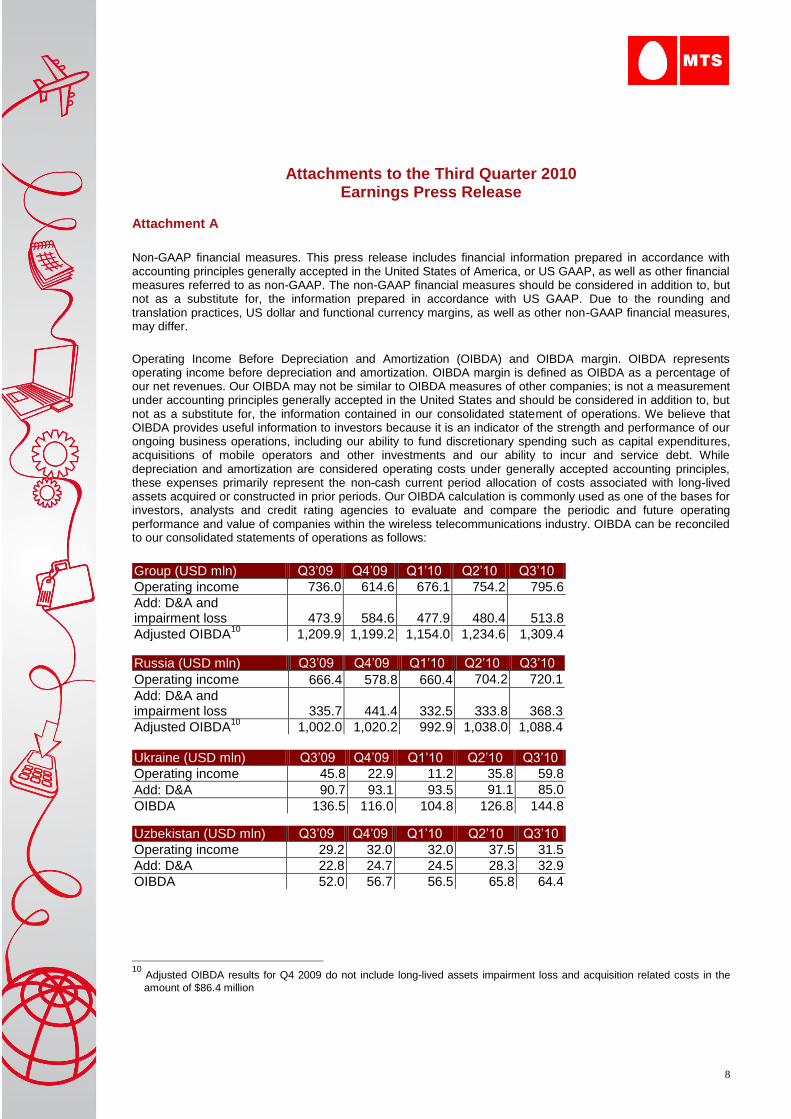
Operating Income Before Depreciation and Amortization (OIBDA) and OIBDA margin. OIBDA represents operating income before depreciation and amortization. OIBDA margin is defined as OIBDA as a percentage of our net revenues. Our OIBDA may not be similar to OIBDA measures of other companies; is not a measurement under accounting principles generally accepted in the United States and should be considered in addition to, but not as a substitute for, the information contained in our consolidated statement of operations. We believe that OIBDA provides useful information to investors because it is an indicator of the strength and performance of our ongoing business operations, including our ability to fund discretionary spending such as capital expenditures, acquisitions of mobile operators and other investments and our ability to incur and service debt. While depreciation and amortization are considered operating costs under generally accepted accounting principles, these expenses primarily represent the non-cash current period allocation of costs associated with long-lived assets acquired or constructed in prior periods. Our OIBDA calculation is commonly used as one of the bases for investors, analysts and credit rating agencies to evaluate and compare the periodic and future operating performance and value of companies within the wireless telecommunications industry. OIBDA can be reconciled to our consolidated statements of operations as follows:
Group (USD mln) Q3‟09 Q4‟09 Q1‟10 Q2‟10 Q3‟10
Operating income 736.0 614.6 676.1 754.2 795.6
Add: D&A and impairment loss 473.9 584.6 477.9
480.4
513.8
Adjusted OIBDA10
1,209.9 1,199.2 1,154.0 1,234.6 1,309.4
Russia (USD mln) Q3‟09 Q4‟09 Q1‟10 Q2‟10 Q3‟10
Operating income 666.4 578.8 660.4 704.2 720.1
Add: D&A and impairment loss 335.7 441.4 332.5
333.8
368.3
Adjusted OIBDA10
1,002.0 1,020.2 992.9 1,038.0 1,088.4 Ukraine (USD mln) Q3‟09 Q4‟09 Q1‟10 Q2‟10 Q3‟10
Operating income 45.8 22.9 11.2 35.8 59.8
Add: D&A 90.7 93.1 93.5 91.1 85.0
OIBDA 136.5 116.0 104.8 126.8 144.8
Uzbekistan (USD mln) Q3‟09 Q4‟09 Q1‟10 Q2‟10 Q3‟10
Operating income 29.2 32.0 32.0 37.5 31.5
Add: D&A 22.8 24.7 24.5 28.3 32.9
OIBDA 52.0 56.7 56.5 65.8 64.4
10
Adjusted OIBDA results for Q4 2009 do not include long-lived assets impairment loss and acquisition related costs in the
amount of $86.4 million
9
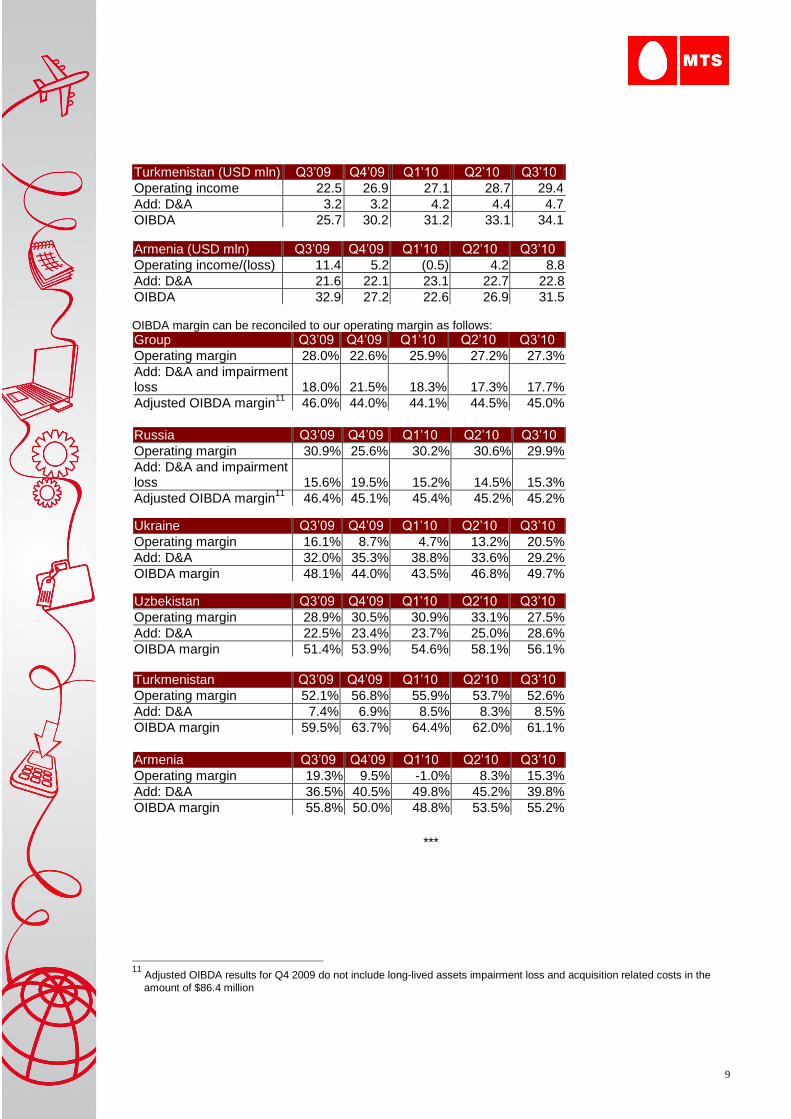
Turkmenistan (USD mln) Q3‟09 Q4‟09 Q1‟10 Q2‟10 Q3‟10
Operating income 22.5 26.9 27.1 28.7 29.4
Add: D&A 3.2 3.2 4.2 4.4 4.7
OIBDA 25.7 30.2 31.2 33.1 34.1
Armenia (USD mln) Q3‟09 Q4‟09 Q1‟10 Q2‟10 Q3‟10
Operating income/(loss) 11.4 5.2 (0.5) 4.2 8.8
Add: D&A 21.6 22.1 23.1 22.7 22.8
OIBDA 32.9 27.2 22.6 26.9 31.5 OIBDA margin can be reconciled to our operating margin as follows:
Group Q3‟09 Q4‟09 Q1‟10 Q2‟10 Q3‟10
Operating margin 28.0% 22.6% 25.9% 27.2% 27.3%
Add: D&A and impairment loss 18.0% 21.5% 18.3%
17.3%
17.7%
Adjusted OIBDA margin11
46.0% 44.0% 44.1% 44.5% 45.0%
Russia Q3‟09 Q4‟09 Q1‟10 Q2‟10 Q3‟10
Operating margin 30.9% 25.6% 30.2% 30.6% 29.9%
Add: D&A and impairment loss 15.6% 19.5% 15.2%
14.5%
15.3%
Adjusted OIBDA margin11
46.4% 45.1% 45.4% 45.2% 45.2%
Ukraine Q3‟09 Q4‟09 Q1‟10 Q2‟10 Q3‟10
Operating margin 16.1% 8.7% 4.7% 13.2% 20.5%
Add: D&A 32.0% 35.3% 38.8% 33.6% 29.2%
OIBDA margin 48.1% 44.0% 43.5% 46.8% 49.7%
Uzbekistan Q3‟09 Q4‟09 Q1‟10 Q2‟10 Q3‟10
Operating margin 28.9% 30.5% 30.9% 33.1% 27.5%
Add: D&A 22.5% 23.4% 23.7% 25.0% 28.6%
OIBDA margin 51.4% 53.9% 54.6% 58.1% 56.1% Turkmenistan Q3‟09 Q4‟09 Q1‟10 Q2‟10 Q3‟10
Operating margin 52.1% 56.8% 55.9% 53.7% 52.6%
Add: D&A 7.4% 6.9% 8.5% 8.3% 8.5%
OIBDA margin 59.5% 63.7% 64.4% 62.0% 61.1%
Armenia Q3‟09 Q4‟09 Q1‟10 Q2‟10 Q3‟10
Operating margin 19.3% 9.5% -1.0% 8.3% 15.3%
Add: D&A 36.5% 40.5% 49.8% 45.2% 39.8%
OIBDA margin 55.8% 50.0% 48.8% 53.5% 55.2%
***
11
Adjusted OIBDA results for Q4 2009 do not include long-lived assets impairment loss and acquisition related costs in the
amount of $86.4 million

10
Attachment B
Net debt represents total debt less cash and cash equivalents and short-term investments. Our net debt calculation is commonly used as one of the bases for investors, analysts and credit rating agencies to evaluate and compare our periodic and future liquidity within the wireless telecommunications industry. The non-GAAP financial measures should be considered in addition to, but not as a substitute for, the information prepared in accordance with US GAAP.
Net debt can be reconciled to our consolidated statements of financial position as follows:
USD mln As of Dec 31,
2009 As of Sep 30,
2010
Current portion of debt and of capital lease obligations 2,022.5 1,461.7
Long-term debt 6,326.8 5,012.5
Capital lease obligations 0.9 1.5
Total debt 8,350.2 6,475.7
Less:
Cash and cash equivalents
Short-term investments
2,529.0
206.5
2,161.4
325.9
Net debt 5,614.7 3,988.4
Last twelve month (LTM) OIBDA can be reconciled to our consolidated statements of operations as follows:
USD mln
Three months ended Dec 31, 2009
Nine months ended Sep 30, 2010
Twelve months ended Sep 30, 2010
A B C=A+B
Net operating income 614.6 2,225.9 2,840.5 Add: depreciation and amortization
498.2 1,472.0 1,970.2
Add: long-lived assets impairment loss and acquisition related costs
86.4 - 86.4
Adjusted OIBDA12
1,199.2 3,697.9 4,897.1
12
Adjusted OIBDA results for Q4 2009 do not include long-lived assets impairment loss and acquisition related costs in the
amount of $86.4 million
11
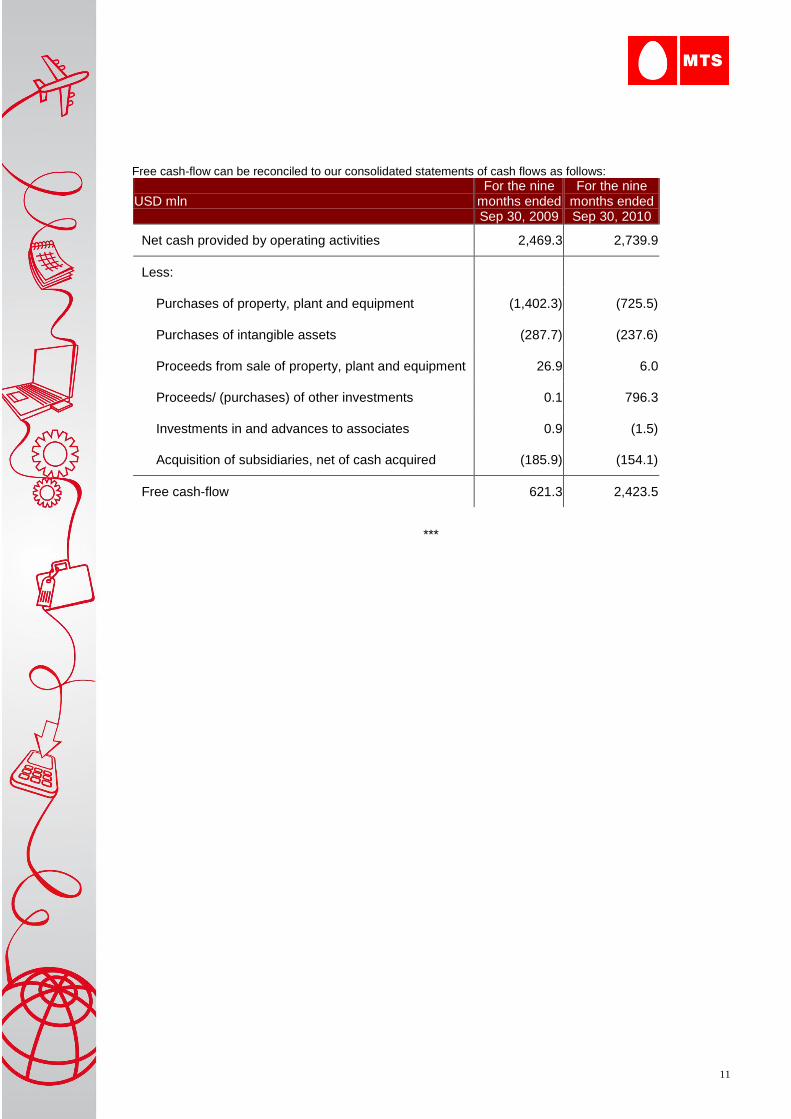
Free cash-flow can be reconciled to our consolidated statements of cash flows as follows:
USD mln
For the nine months ended Sep 30, 2009
For the nine months ended Sep 30, 2010
Net cash provided by operating activities 2,469.3 2,739.9
Less:
Purchases of property, plant and equipment (1,402.3) (725.5)
Purchases of intangible assets (287.7) (237.6)
Proceeds from sale of property, plant and equipment 26.9 6.0
Proceeds/ (purchases) of other investments 0.1 796.3
Investments in and advances to associates 0.9 (1.5)
Acquisition of subsidiaries, net of cash acquired (185.9) (154.1)
Free cash-flow 621.3 2,423.5
***
12
Attachment C
Definitions
Subscriber. We define a “subscriber” as an individual or organization whose account shows chargeable activity within sixty one days in the case of post-paid tariffs, or one hundred and eighty three days in the case of our pre-paid tariffs, or whose account does not have a negative balance for more than this period.
Average monthly service revenue per subscriber (ARPU). We calculate our ARPU by dividing our service revenues for a given period, including interconnect, guest roaming fees and connection fees, by the average number of our subscribers during that period and dividing by the number of months in that period.
Average monthly minutes of usage per subscriber (MOU). MOU is calculated by dividing the total number of minutes of usage during a given period by the average number of our subscribers during the period and dividing by the number of months in that period.
Churn. We define our “churn” as the total number of subscribers who cease to be a subscriber as defined above during the period (whether involuntarily due to non-payment or voluntarily, at such subscriber‟s request), expressed as a percentage of the average number of our subscribers during that period.
Subscriber acquisition cost (SAC). We define SAC as total sales and marketing expenses and handset subsidies for a given period. Sales and marketing expenses include advertising expenses and commissions to dealers. SAC per gross additional subscriber is calculated by dividing SAC during a given period by the total number of gross subscribers added by us during the period.
***
13
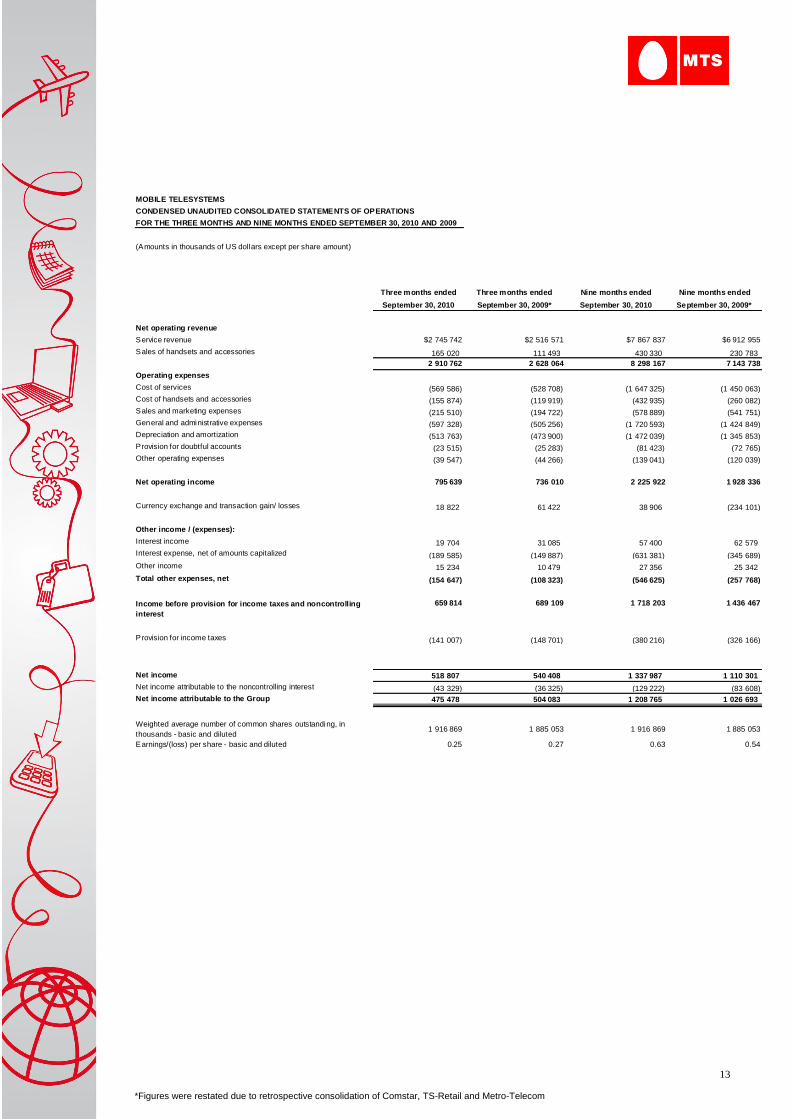
MOBILE TELESYSTEMS
CONDENSED UNAUDITED CONSOLIDATED STATEMENTS OF OPERATIONS
FOR THE THREE MONTHS AND NINE MONTHS ENDED SEPTEMBER 30, 2010 AND 2009
(Amounts in thousands of US dollars except per share amount)
Three months ended Three months ended Nine months ended Nine months ended
September 30, 2010 September 30, 2009* September 30, 2010 September 30, 2009*
Net operating revenue
Service revenue $2 745 742 $2 516 571 $7 867 837 $6 912 955
Sales of handsets and accessories 165 020 111 493 430 330 230 783
2 910 762 2 628 064 8 298 167 7 143 738
Operating expenses
Cost of services (569 586) (528 708) (1 647 325) (1 450 063)
Cost of handsets and accessories (155 874) (119 919) (432 935) (260 082)
Sales and marketing expenses (215 510) (194 722) (578 889) (541 751)
General and administrative expenses (597 328) (505 256) (1 720 593) (1 424 849)
Depreciation and amortization (513 763) (473 900) (1 472 039) (1 345 853)
Provision for doubtful accounts (23 515) (25 283) (81 423) (72 765)
Other operating expenses (39 547) (44 266) (139 041) (120 039)
Net operating income 795 639 736 010 2 225 922 1 928 336
Currency exchange and transaction gain/ losses 18 822 61 422 38 906 (234 101)
Other income / (expenses):
Interest income 19 704 31 085 57 400 62 579
Interest expense, net of amounts capitalized (189 585) (149 887) (631 381) (345 689)
Other income 15 234 10 479 27 356 25 342
Total other expenses, net (154 647) (108 323) (546 625) (257 768)
Income before provision for income taxes and noncontrolling
interest
659 814 689 109 1 718 203 1 436 467
Provision for income taxes (141 007) (148 701) (380 216) (326 166)
Net income 518 807 540 408 1 337 987 1 110 301
Net income attributable to the noncontrolling interest (43 329) (36 325) (129 222) (83 608)
Net income attributable to the Group 475 478 504 083 1 208 765 1 026 693
Weighted average number of common shares outstanding, in
thousands - basic and diluted1 916 869 1 885 053 1 916 869 1 885 053
Earnings/(loss) per share - basic and diluted 0.25 0.27 0.63 0.54
*Figures were restated due to retrospective consolidation of Comstar, TS-Retail and Metro-Telecom

14
MOBILE TELESYSTEMS
CONDENSED UNAUDITED CONSOLIDATED STATEMENT OF FINANCIAL POSITION
AS OF SEPTEMBER 30, 2010 AND DECEMBER 31, 2009
(Amounts in thousands of US dol lars)
As of September 30, As of December 31,
2010 2009*
CURRENT ASSETS:
Cash and cash equivalents $2 161 418 $2 529 011
Short-term investments 325 929 206 470
Trade receivables, net 770 700 595 747
Accounts receivable, related parties 17 314 16 697
Inventory and spare parts 249 697 239 572
VAT receivable 95 283 110 288
Prepaid expenses and other current assets 642 269 703 092
Total current assets 4 262 610 4 400 877
PROPERTY, PLANT AND EQUIPMENT 7 289 715 7 750 617
INTANGIBLE ASSETS 2 400 561 2 236 393
INVESTMENTS IN AND ADVANCES TO ASSOCIATES 220 363 220 450
INVESTMENTS IN SHARES OF SVYAZINVEST 859 669
OTHER INVESTMENTS 49 816 48 701
OTHER ASSETS 222 874 245 615
Total assets $14 445 939 $15 762 322
CURRENT LIABILITIES
Accounts payable 503 954 509 846
Accrued expenses and other current liabilities 2 189 433 1 666 201
Accounts payable, related parties 75 539 81 664
Current portion of long-term debt, capital lease obligations 1 461 733 2 022 499
Total current liabilities 4 230 659 4 280 210
LONG-TERM LIABILITIES
Long-term debt 5 012 456 6 326 824
Capital lease obl igations 1 508 921
Deferred income taxes 284 495 298 453
Long-term accounts payable, related parties 39 115 38 273
Deferred revenue and other 372 430 373 011
Total long-term liabilities 5 710 004 7 037 482
Total liabilities 9 940 663 11 317 692
Redeemable noncontrolling interests 108 095 82 261
SHAREHOLDERS’ EQUITY:
Common stock: (2,096,975,792 shares with a par value of 0.1 rubles authorized and
1,993,326,138 shares issued as September 30, 2010 and December 31, 2009
(777,396,505 of which are in the form of ADS as of September 30, 2010 and December
31, 2009) 50 558 50 558
Treasury stock (76,456,876 common shares at cost as of September 30, 2010 and
December 31, 2009) (1 054 926) (1 054 926)
Additional paid-in capital 2 104
Accumulated other comprehensive income (741 981) (748 828)
Retained earnings 5 169 235 5 092 422
Total shareholders' equity attributable to the Group 3 422 886 3 341 330
Noncontrolling interest 974 295 1 021 039
TOTAL SHAREHOLDERS` EQUITY 4 397 181 4 362 369
Total liabilities and shareholders’ equity $14 445 939 $15 762 322
*Figures were restated due to retrospective consolidation of Comstar, TS-Retail and Metro-Telecom
15
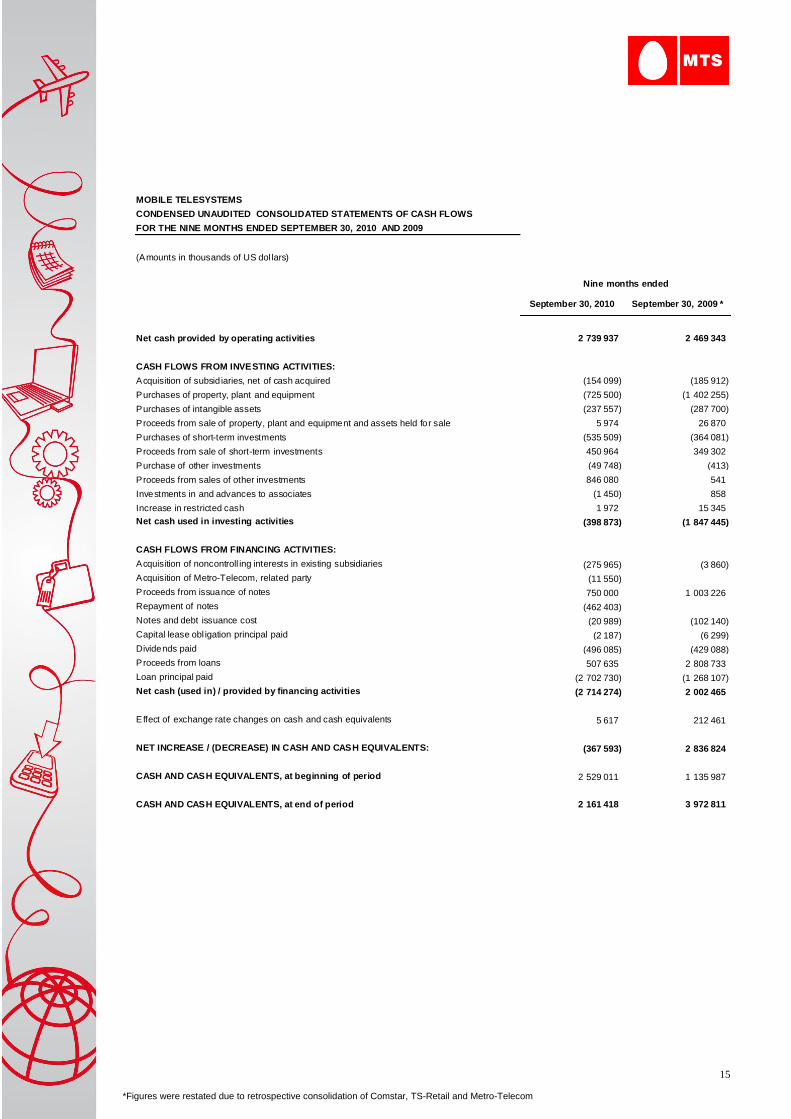
MOBILE TELESYSTEMS
CONDENSED UNAUDITED CONSOLIDATED STATEMENTS OF CASH FLOWS
FOR THE NINE MONTHS ENDED SEPTEMBER 30, 2010 AND 2009
(Amounts in thousands of US dol lars)
September 30, 2010 September 30, 2009 *
Net cash provided by operating activities 2 739 937 2 469 343
CASH FLOWS FROM INVESTING ACTIVITIES:
Acquisition of subsid iaries, net of cash acquired (154 099) (185 912)
Purchases of property, plant and equipment (725 500) (1 402 255)
Purchases of intangible assets (237 557) (287 700)
Proceeds from sale of property, plant and equipment and assets held for sale 5 974 26 870
Purchases of short-term investments (535 509) (364 081)
Proceeds from sale of short-term investments 450 964 349 302
Purchase of other investments (49 748) (413)
Proceeds from sales of other investments 846 080 541
Investments in and advances to associates (1 450) 858
Increase in restricted cash 1 972 15 345
Net cash used in investing activities (398 873) (1 847 445)
CASH FLOWS FROM FINANCING ACTIVITIES:
Acquisition of noncontroll ing interests in existing subsidiaries (275 965) (3 860)
Acquisition of Metro-Telecom, related party (11 550)
Proceeds from issuance of notes 750 000 1 003 226
Repayment of notes (462 403)
Notes and debt issuance cost (20 989) (102 140)
Capital lease obl igation principal paid (2 187) (6 299)
Dividends paid (496 085) (429 088)
Proceeds from loans 507 635 2 808 733
Loan principal paid (2 702 730) (1 268 107)
Net cash (used in) / provided by financing activities (2 714 274) 2 002 465
Effect of exchange rate changes on cash and cash equivalents 5 617 212 461
NET INCREASE / (DECREASE) IN CASH AND CASH EQUIVALENTS: (367 593) 2 836 824
CASH AND CASH EQUIVALENTS, at beginning of period 2 529 011 1 135 987
CASH AND CASH EQUIVALENTS, at end of period 2 161 418 3 972 811
Nine months ended
*Figures were restated due to retrospective consolidation of Comstar, TS-Retail and Metro-Telecom