press release...press release paris, february 22, 2018 2017 results further strong progress in...
TRANSCRIPT

PRESS RELEASE
Paris, February 22, 2018
2017 Results
Further strong progress in results
Solid organic growth in all Business Sectors and regions (up 4.7%); acceleration in H2 (up 6.0%) and in Q4 (up 6.5%)
Positive trends in sales prices, up 2.0%; acceleration in H2 (up 2.3%) and in Q4 (up 2.7%) Further rise in operating income, up 9.6% like-for-like, and in operating margin, up to 7.4%
from 7.2% Further strong increase in recurring net income1, up 16.7% Free cash flow2 up 7.6% to €1,353 million Ahead of our strategic objectives, with €641 million in acquisitions and €290 million in cost
savings Net debt at €5.95 billion (versus €5.64 billion at end-2016); buyback of 8.3 million shares during
the year 2017 dividend up at €1.30 per share, to be paid wholly in cash
Pierre-André de Chalendar, Chairman and Chief Executive Officer of Saint-Gobain, commented: “Saint-Gobain’s robust growth and the acceleration in our performance over the course of the year illustrates the effectiveness of our strategy. All Business Sectors and regions contributed to this good set of results, especially France which confirmed its recovery. In line with our focus on pricing in an environment where inflation is increasing once again, sales prices rose significantly, particularly in the second half of the year. Cost savings, another priority for the Group, exceeded objectives at €290 million. The Group pursued its profitable growth strategy by stepping up both its financial investments, with 28 small and mid-sized acquisitions in the year, and its capital expenditure, with a focus on emerging countries, Industry 4.0, and digitalization, particularly in Building Distribution. In 2018, we expect the economic climate to remain supportive. We will continue to implement our strategic objectives and are targeting a further like-for-like increase in operating income.”
1. Recurring net income: net attributable income excluding capital gains and losses on disposals, asset write-downs and material non-recurring provisions. 2. Cash flow from operations excluding the tax impact of capital gains and losses on disposals, asset write-downs and material non-recurring provisions,
less capital expenditure.
(€m) 2016 2017 Change Change
like-for-like
Sales 39,093 40,810 +4.4% +4.7%
Operating income 2,818 3,028 +7.5% +9.6%
Recurring net income1 1,398 1,631 +16.7%
Net attributable income 1,311 1,566 +19.5%
Free cash flow2 1,258 1,353 +7.6%

2
Operating performance The Group’s 2017 sales totaled €40,810 million, up 4.4% on a reported basis and up 4.7% like-for-like. Organic growth was driven both by higher volumes (up 2.7%) and higher prices (up 2.0%) in all Business Sectors and all regions, despite the adverse impact of the June 2017 cyber-attack. The price effect continued to grow (up 2.3% in the second half), against a backdrop of rising raw material and energy costs over the course of the year. The Group structure impact added 0.9% to growth as the Group’s stepped up its acquisitions with the consolidation of companies in Asia and emerging countries (Emix, Tumelero, Solcrom, Megaflex), in new niche technologies and services (H-Old, France Pare-Brise, Scotframe), and to consolidate our strong positions (Glava, Pietta Glass, SimTek, bolt-on acquisitions in Building Distribution). However, overall growth was tempered by a negative 1.2% currency effect over the year (a negative 2.6% in the second half), mainly reflecting the depreciation of the pound sterling, US dollar and certain Asian and emerging country currencies against the euro.
The Group’s operating margin1 widened to 7.4% from 7.2% in 2016, with 7.7% for the second half (versus 7.4% in second-half 2016). There was a further like-for-like increase in operating income, up 12.4% in the second half, bringing growth over the full year to 9.6%. The year was also marked by the cyber-attack on June 27; the Group was able to react swiftly not only to re-establish a return to normal in our operating activities, but also to reinforce our defenses. The impact on 2017 is estimated at a negative €80 million on operating income. Overall, around half of the impact of the cyber-attack concerned Building Distribution, while the rest concerned the Group’s industrial businesses, particularly Construction Products. From a geographical perspective, Western European countries were the hardest hit, especially Nordic countries, Germany and France. Capital expenditure increased to €1.54 billion in 2017 from €1.37 billion in 2016, and focused on growth capex outside Western Europe, Industry 4.0 and digitalization. The Group achieved €290 million in cost savings compared to 2016, exceeding its objectives. Free cash flow showed a clear improvement, up 7.6% to €1,353 million. Operating working capital requirements remained stable at a good level of 28 days. The Group stepped up its acquisitions, which represented over €500 million in full-year sales. Legal proceedings initiated by Schenker-Winkler Holding to restore its voting rights are in progress. Saint-Gobain remains confident in the outcome of its plan to acquire a controlling interest in Sika.
Performance of Group Business Sectors Innovative Materials sales climbed 5.3% like-for-like over the year and 6.5% in the second half. The operating margin for the Business Sector improved significantly, to 12.4% from 11.2%, spurred by both Flat Glass and High-Performance Materials.
Flat Glass like-for-like sales increased 5.2% over the year (up 4.7% in the second half). Automotive glass advanced in all regions in terms of both sales and orders, bolstered in particular by strong momentum in Asia and emerging countries. Sales linked to the construction market in Western Europe improved, with float glass price trends stabilizing and higher prices for transformed glass in the second half; Asia and emerging countries continued to grow. Organic growth along with a positive price-cost spread for raw materials and energy drove a further rally in the operating margin, up to 10.1% from 9.1% in 2016.
1. Operating margin = Operating income expressed as a percentage of sales.

3
High-Performance Materials (HPM) sales rose 5.8% on a like-for-like basis (up 9.2% in the second half), lifted by all regions and especially Asia and emerging countries. After a hesitant start to the year, North America saw good momentum in the second half. All HPM businesses reported growth over the year, particularly Ceramics on the back of strong sales in the second half. The operating margin continued to improve, up to 15.1% from 13.7% in 2016 driven by volumes, amid limited increases in raw material and energy costs.
Construction Products (CP) reported 6.2% organic growth, with 8.8% in the second half. The operating margin was 9.1% versus 9.3% in 2016, affected primarily by the timelag between pricing and cost increases, with however a more significant pricing effect at the end of the year.
Interior Solutions like-for-like sales moved up 5.9% over the year and 7.6% in the second half, spurred by growth in Asia and emerging countries. Volumes continued to pick up in Western Europe and especially France. Trading in North America improved in the second half. Prices rose significantly, with an acceleration over the course of the year, but remained behind the sharp increase in raw material and energy costs. This led to a decline in the margin, at 9.5% in 2017 versus 10.3% in 2016.
Exterior Solutions reported 6.7% organic growth in 2017, driven by an improvement in all businesses in the second half (up 10.1%) and particularly Exterior Products in the US. In the second half, this business benefited from additional weather-related demand in the US, whilst the pricing environment remained tough. Pipe began to recover, led by the rise in prices amid strong inflation in raw material costs; volumes were down over the year, hit by the lack of major export contracts, but stabilized in the second half thanks to the upturn in Brazil and the improvement in China. Mortars had a very good year, reporting an acceleration in growth in the second half thanks to Asia and emerging countries, with an improved performance in Brazil in a construction market that nevertheless remains uncertain. The operating margin moved up to 8.4% from 7.9% in 2016 despite raw material and energy cost inflation.
Building Distribution posted 3.6% organic growth for the year, with 4.1% in the second half. Trading in France continued to recover, led by good momentum in new-builds and the progress in renovation. Nordic countries enjoyed robust growth throughout the year, as did the Netherlands and Spain. The UK grew at the same rate in the second half as in the first half, with prices rising but volumes down. Germany and Brazil contracted slightly. The operating margin for 2017 remained stable at 3.4%, despite the impact of the cyber-attack and of the acceleration in digital investments, edging up to 4.1% in the second half (versus 4.0% in second-half 2016).
Analysis by region
France confirmed its recovery over the year with 3.5% organic growth, including 4.8% in the second half buoyed by dynamic new-build activity and progress in renovation. The operating margin for 2017 widened, at 3.1% versus 2.9% in 2016.
Other Western European countries saw like-for-like sales growth of 3.1%, with 3.6% growth in the second half. This reflects advances in all our countries with the exception of Germany which remains hesitant, affected by production transfers. The UK delivered further growth driven by prices, despite volumes settling and a lack of visibility. The operating margin was down, at 5.9% compared to 6.2% in 2016, hit by the impact of the cyber-attack which primarily affected this region, and by the rise in raw material and energy costs.
North America improved, posting like-for-like growth of 6.0%, including 9.8% growth in the second half. Construction volumes continued to trend well, boosted namely by additional weather-related demand in the second half; industry also saw a good improvement overall. The price effect improved slightly in an inflationary cost environment. The operating margin gained ground, up to 11.3% from 10.5% in 2016.
Asia and emerging countries continued to advance, posting robust organic growth of 9.2% led by all regions. Growth came in at 11.4% in the second half, driven by an improved performance in Brazil in particular. The operating margin continued to rise, up to 11.5% from 10.9% in 2016.

4
Analysis of the 2017 consolidated financial statements
The 2017 consolidated financial statements were approved and adopted by Saint-Gobain’s Board of Directors at its meeting of February 22, 2018. The consolidated financial statements were audited and certified by the statutory auditors.
2016 2017
%
change
€m (A) (B) (B)/(A)
Sales and ancillary revenue 39,093 40,810 4.4%
Operating income 2,818 3,028 7.5%
Operating depreciation and amortization 1,180 1,206 2.2%
EBITDA (operating income + operating depr./amort.) 3,998 4,234 5.9%
Non-operating costs (312) (337) 8.0%
Capital gains and losses on disposals, asset write-downs, corporate acquisition fees and earn-out payments
(202) (180) -10.9%
Business income 2,304 2,511 9.0%
Net financial expense (541) (448) -17.2%
Income tax (416) (438) 5.3%
Share in net income of associates 5 0 n.m.
Net income before minority interests 1,352 1,625 20.2%
Minority interests 41 59 43.9%
Net attributable income 1,311 1,566 19.5%
Earnings per share2 (in €) 2.36 2.84 20.3%
Recurring1 net income 1,398 1,631 16.7%
Recurring1 earnings per share2 (in €) 2.53 2.96 17.0%
Cash flow from operations3 2,749 3,020 9.9%
Cash flow from operations excluding capital gains tax4 2,628 2,891 10.0%
Capital expenditure5 1,370 1,538 12.3%
Free cash flow6 1,258 1,353 7.6%
Investments in securities 362 641 77.1%
Net debt 5,644 5,955 5.5% , ,
1. Recurring net income: net attributable income excluding capital gains and losses on disposals, asset write-downs and material
non-recurring provisions. 2. Calculated based on the number of shares outstanding at December 31 (550,785,719 shares in 2017, versus 553,388,403
shares in 2016). 3. Cash flow from operations = operating cash flow excluding material non-recurring provisions. 4. Cash flow from operations excluding capital gains tax = (3) less the tax impact of capital gains and losses on disposals, asset
write-downs and material non-recurring provisions. 5. Capital expenditure: investments in property, plant and equipment. 6. Free cash flow = (4) less capital expenditure.

5
Consolidated sales increased by 4.7% like-for-like, led by both volumes and prices. On a reported basis, sales were up 4.4% with a negative 1.2% currency impact (even stronger in the second half at -2.6%), due mainly to the depreciation of the pound sterling, US dollar and certain Asian and emerging country currencies against the euro. The positive 0.9% Group structure impact essentially reflects the consolidation of acquisitions made in Asia and emerging countries, in new niche technologies and services, and to consolidate our strong positions. Operating income increased 7.5% on a reported basis despite a negative currency effect, and by 9.6% like-for-like. The operating margin stood at 7.4% of sales versus 7.2% of sales in 2016. EBITDA climbed 5.9% to €4,234 million, or 10.4% of sales (10.2% of sales in 2016).
Non-operating costs were higher at €337 million versus €312 million in 2016, with a decrease in restructuring costs but a rise in litigation-related expenses. Non-operating costs include a €90 million accrual to the provision for asbestos-related litigation involving CertainTeed in the US, unchanged from 2016. The net balance of capital gains and losses on disposals, asset write-downs and corporate acquisition fees was an expense of €180 million compared to an expense of €202 million in 2016. In 2017, this item includes €237 million in asset write-downs and €57 million in gains on disposals of assets less acquisition fees. Business income rose 9.0%. Net financial expense improved sharply, down 17.2% to €448 million from €541 million in 2016. This primarily reflects the decrease in the cost of gross debt to 2.8% at December 31, 2017 from 3.4% at end-2016. The tax rate on recurring net income was 25% compared to 27% in 2016, owing mainly to items such as the reimbursement of the 3% tax on dividends in France. Income tax expense was €438 million versus €416 million in 2016, with the US tax reform resulting in a non-recurring gain of €91 million. Recurring net income (excluding capital gains and losses, asset write-downs and material non-recurring provisions) jumped 16.7% to €1,631 million. Net attributable income climbed 19.5% to €1,566 million in 2017. Capital expenditure totaled €1,538 million (€1,370 million in 2016), representing 3.8% of sales (3.5% of sales in 2016). Cash flow from operations improved, up 9.9% to €3,020 million (€2,749 million in 2016). Before the tax impact of capital gains and losses on disposals, asset write-downs and material non-recurring provisions, cash flow from operations climbed 10.0% to €2,891 million and free cash flow increased 7.6% to €1,353 million (3.3% of sales versus 3.2% of sales in 2016). Operating working capital requirements (WCR) remained stable at a good level of 28 days’ sales, a rise of €130 million in value terms (to €3,140 million). Investments in securities picked up pace, at €641 million (€362 million in 2016), and relate to targeted acquisitions in Asia and emerging countries (Megaflex, Isoroc, Tumelero), in new niche technologies and services (TekBond, Maris, Scotframe), and to consolidate our strong positions (Glava, Biolink, Kirson, Wattex, SimTek, bolt-on acquisitions in Building Distribution). Net debt rose to €5.95 billion from €5.64 billion, due mainly to the acceleration in acquisitions and to share buybacks for €403 million. Net debt represents 32% of consolidated equity, compared to 29% at December 31, 2016. The net debt to EBITDA ratio remained stable at 1.4 at end-2017.

6
Update on asbestos claims in the US
Some 3,100 claims were filed against CertainTeed in 2017, down slightly on 2016. At the same time, around 3,900 claims were settled (versus 3,700 in 2016), bringing the total number of outstanding claims to around 34,300 at December 31, 2017, a decrease of around 800 compared to end-2016. A total of USD 76 million in indemnity payments were made in the 12 months to December 31, 2017, compared to USD 97 million in 2016. In light of these trends and of the €90 million provision accrual in 2017, the total provision for CertainTeed’s asbestos-related claims amounted to USD 555 million at December 31, 2017, compared to USD 562 million at December 31, 2016.
Dividend
At today’s meeting, Compagnie de Saint-Gobain’s Board of Directors decided to recommend to the June 7, 2018 Shareholders’ Meeting to pay in cash an increased dividend of €1.30 per share (versus €1.26 in 2016), demonstrating once again our focus on shareholder returns in the context of our strong 2017 results and our confidence looking ahead. This dividend represents 44% of recurring net income and a dividend yield of 2.8% based on the closing share price at December 29, 2017 (€45.98). The ex-dividend date has been set at June 11 and the dividend will be paid on June 13, 2018.
Strategic priorities and outlook
The Group continued to implement its strategic priorities in 2017: - €290 million in cost savings versus 2016, ahead of our objectives, as part of the
€1.2 billion cost reduction program for 2017-2020. Our focus on Industry 4.0 and digitalization is beginning to bear fruit;
- 28 acquisitions of small and mid-sized companies for a total of €641 million and disposals for a total of €213 million, as part of the portfolio optimization strategy targeting €2 billion in acquisitions for 2017-2020;
- 8.3 million shares bought back (€403 million) in line with long-term objectives, and 7 million shares cancelled, thereby reducing the number of outstanding shares to 550.8 million at December 31, 2017 (553.4 million at December 31, 2016).
In 2018, the Group should benefit from a supportive economic environment: - further growth in France, led by the new-build market and by progress in renovation; - progression in other Western European countries, despite continued uncertainty in
the UK; - growth in North America, in both construction markets and industry; - good momentum in Asia and emerging countries.
For 2018, the Group expects the following for its Business Sectors: - continued growth and a good margin level in Innovative Materials; - better volumes and prices, focus on the price-cost spread in Construction Products; - Building Distribution should benefit from volume growth in Western Europe.
Saint-Gobain will continue its disciplined approach to cash management and financial strength. In particular, it will pursue:
- its focus on sales prices amid continued inflationary pressure on costs; - its cost savings program, with the aim of unlocking additional savings of around
€300 million (calculated on the 2017 cost base); - its capital expenditure program of around €1.7 billion (representing around 4% of
sales, in line with our objectives), with a focus on growth capex outside Western Europe and also on productivity (Industry 4.0) and digital transformation, particularly in Building Distribution;
- its commitment to invest in R&D to support its differentiated, high value-added strategy;
- its focus on high levels of free cash flow generation.
The Group is targeting a further like-for-like increase in operating income in 2018.

7
Financial calendar
- An information meeting for analysts and investors will be held at 8:30am (GMT+1) on February 23, 2018 and will be broadcast live on www.saint-gobain.com/en/full-year-2017-results
- Sales for the first quarter of 2018: April 26, 2018, after close of trading on the Paris Bourse. - First-half 2018 results: July 26, 2018, after close of trading on the Paris Bourse.
Analyst/Investor relations
Press relations
Vivien Dardel Florent Nouveau Floriana Michalowska
+33 1 47 62 44 29 +33 1 47 62 30 93 +33 1 47 62 35 98
Laurence Pernot Susanne Trabitzsch
+33 1 47 62 30 10 +33 1 47 62 43 25
Indicators of organic growth and like-for-like changes in sales/operating income reflect the Group’s underlying performance excluding the impact of:
changes in Group structure, by calculating indicators for the year under review based on the scope of consolidation of the previous year (Group structure impact);
changes in foreign exchange rates, by calculating the indicators for the year under review and those for the previous year based on identical foreign exchange rates for the previous year (currency impact);
changes in applicable accounting policies.
All indicators contained in this press release (not defined in the footnotes) are explained in the notes to the 2017 consolidated financial statements, available by clicking here: www.saint-gobain.com/en/full-year-2017-results
The glossary below shows the note of the financial statements in which you can find an explanation of each indicator. Glossary: Cash flow from operations Note 3 Net debt Note 8 EBITDA Note 3 Non-operating costs Note 3 Operating income Note 3 Net financial expense Note 8 Recurring net income Note 3 Business income Note 3 Important disclaimer – forward-looking statements: This press release contains forward-looking statements with respect to Saint-Gobain’s financial condition, results, business, strategy, plans and outlook. Forward-looking statements are generally identified by the use of the words “expect”, “anticipate”, “believe", "intend", "estimate", "plan" and similar expressions. Although Saint-Gobain believes that the expectations reflected in such forward-looking statements are based on reasonable assumptions as at the time of publishing this document, investors are cautioned that these statements are not guarantees of its future performance. Actual results may differ materially from the forward-looking statements as a result of a number of known and unknown risks, uncertainties and other factors, many of which are difficult to predict and are generally beyond the control of Saint-Gobain, including but not limited to the risks described in Saint-Gobain’s registration document available on its website (www.saint-gobain.com). Accordingly, readers of this document are cautioned against relying on these forward-looking statements. These forward-looking statements are made as of the date of this document. Saint-Gobain disclaims any intention or obligation to complete, update or revise these forward-looking statements, whether as a result of new information, future events or otherwise. This press release does not constitute any offer of purchase or exchange, nor any solicitation of an offer to sell or exchange securities of Saint-Gobain.
For any further information, please visit www.saint-gobain.com.

I. SALES
by sector and division:
Innovative Materials1
9,857 10,383 +5.3% +4.4% +5.3%
Flat Glass 5,364 5,672 +5.7% +4.7% +5.2%
High-Performance Materials 4,507 4,738 +5.1% +4.3% +5.8%
Construction Products1
11,921 12,624 +5.9% +4.7% +6.2%
Interior Solutions 6,583 6,884 +4.6% +3.9% +5.9%
Exterior Solutions 5,423 5,834 +7.6% +5.7% +6.7%
Building Distribution 18,248 18,800 +3.0% +2.4% +3.6%
Internal sales and misc. -933 -997 n.m. n.m. n.m.
Group Total 39,093 40,810 +4.4% +3.5% +4.7%1 including inter-division eliminations.
by geographic area:
France 10,225 10,600 +3.7% +3.5% +3.5%
Other Western European countries 17,292 17,611 +1.8% +1.1% +3.1%
North America 5,198 5,418 +4.2% +4.1% +6.0%
Emerging countries and Asia 8,281 9,166 +10.7% +8.3% +9.2%
Internal sales -1,903 -1,985 n.m. n.m. n.m.
Group Total 39,093 40,810 +4.4% +3.5% +4.7%
II. OPERATING INCOME
by sector and division:
Innovative Materials 1,106 1,286 +16.3% +11.2% +12.4%
Flat Glass 490 571 +16.5% +9.1% +10.1%
High-Performance Materials 616 715 +16.1% +13.7% +15.1%
Construction Products 1,106 1,143 +3.3% +9.3% +9.1%
Interior Solutions 675 652 -3.4% +10.3% +9.5%
Exterior Solutions 431 491 +13.9% +7.9% +8.4%
Building Distribution 616 631 +2.4% +3.4% +3.4%
Misc. -10 -32 n.m. n.m. n.m.
Group Total 2,818 3,028 +7.5% +7.2% +7.4%
by geographic area:
France 301 331 +10.0% +2.9% +3.1%
Other Western European countries 1,072 1,034 -3.5% +6.2% +5.9%
North America 544 611 +12.3% +10.5% +11.3%
Emerging countries and Asia 901 1,052 +16.8% +10.9% +11.5%
Group Total 2,818 3,028 +7.5% +7.2% +7.4%
III. BUSINESS INCOME
by sector and division:
Innovative Materials 901 1,188 +31.9% +9.1% +11.4%
Flat Glass 426 580 +36.2% +7.9% +10.2%
High-Performance Materials 475 608 +28.0% +10.5% +12.8%
Construction Products 941 950 +1.0% +7.9% +7.5%
Interior Solutions 555 556 +0.2% +8.4% +8.1%
Exterior Solutions 386 394 +2.1% +7.1% +6.8%
Building Distribution 552 493 -10.7% +3.0% +2.6%
Misc. (a)
-90 -120 n.m. n.m. n.m.
Group Total 2,304 2,511 +9.0% +5.9% +6.2%
by geographic area:
France 252 187 -25.8% +2.5% +1.8%
Other Western European countries 980 865 -11.7% +5.7% +4.9%
North America (a)
249 388 +55.8% +4.8% +7.2%
Emerging countries and Asia 823 1,071 +30.1% +9.9% +11.7%
Group Total 2,304 2,511 +9.0% +5.9% +6.2%(a)
after asbestos-related charge (before tax) of €90m in 2016 and in 2017
Like-for-like
change
Change on an
actual
structure basis
Appendix 1: Results by business sector and geographic area - Full Year
2016
(in EUR m)
2017
(in EUR m)
Change on an
actual
structure basis
Change on a
comparable
structure basis
2016
(in EUR m)
Change on an
actual
structure basis
2017
(in EUR m)
2017
(in % of sales)
2017
(in % of sales)
2016
(in % of sales)
2017
(in EUR m)
2016
(in % of sales)
2016
(in EUR m)
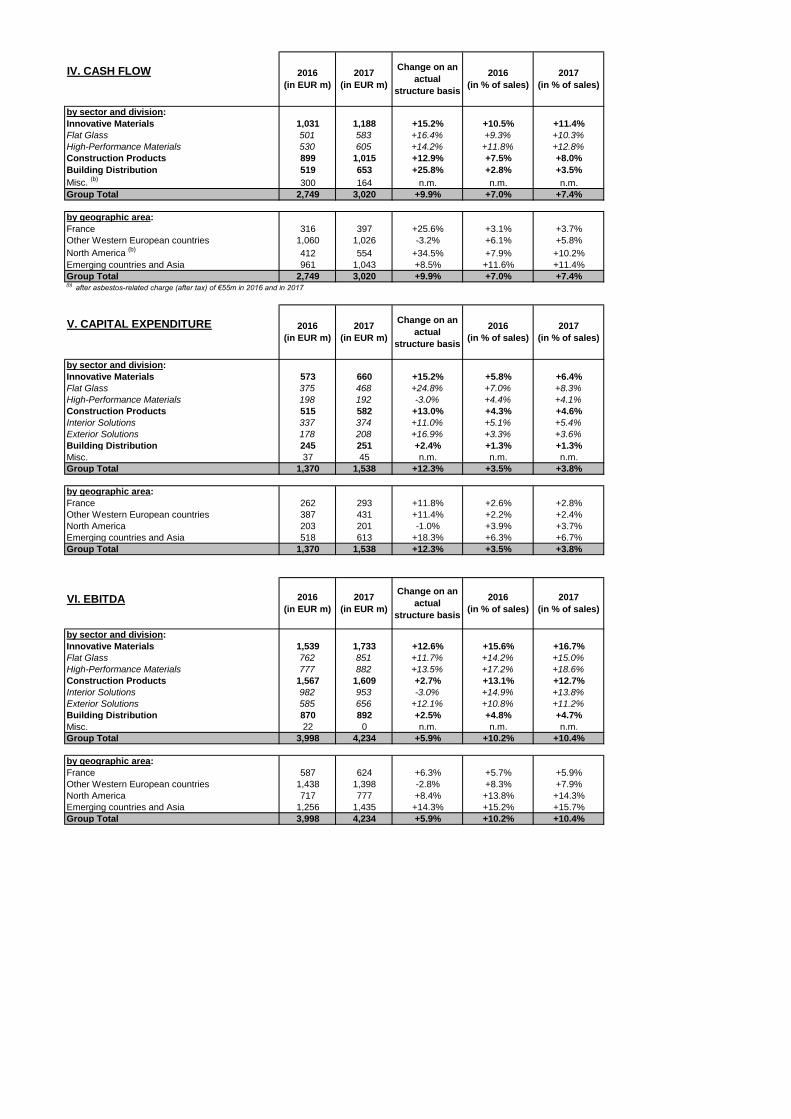
IV. CASH FLOW
by sector and division:
Innovative Materials 1,031 1,188 +15.2% +10.5% +11.4%
Flat Glass 501 583 +16.4% +9.3% +10.3%
High-Performance Materials 530 605 +14.2% +11.8% +12.8%
Construction Products 899 1,015 +12.9% +7.5% +8.0%
Building Distribution 519 653 +25.8% +2.8% +3.5%
Misc. (b)
300 164 n.m. n.m. n.m.
Group Total 2,749 3,020 +9.9% +7.0% +7.4%
by geographic area:
France 316 397 +25.6% +3.1% +3.7%
Other Western European countries 1,060 1,026 -3.2% +6.1% +5.8%
North America (b)
412 554 +34.5% +7.9% +10.2%
Emerging countries and Asia 961 1,043 +8.5% +11.6% +11.4%
Group Total 2,749 3,020 +9.9% +7.0% +7.4%(b)
after asbestos-related charge (after tax) of €55m in 2016 and in 2017
V. CAPITAL EXPENDITURE
by sector and division:
Innovative Materials 573 660 +15.2% +5.8% +6.4%
Flat Glass 375 468 +24.8% +7.0% +8.3%
High-Performance Materials 198 192 -3.0% +4.4% +4.1%
Construction Products 515 582 +13.0% +4.3% +4.6%
Interior Solutions 337 374 +11.0% +5.1% +5.4%
Exterior Solutions 178 208 +16.9% +3.3% +3.6%
Building Distribution 245 251 +2.4% +1.3% +1.3%
Misc. 37 45 n.m. n.m. n.m.
Group Total 1,370 1,538 +12.3% +3.5% +3.8%
by geographic area:
France 262 293 +11.8% +2.6% +2.8%
Other Western European countries 387 431 +11.4% +2.2% +2.4%
North America 203 201 -1.0% +3.9% +3.7%
Emerging countries and Asia 518 613 +18.3% +6.3% +6.7%
Group Total 1,370 1,538 +12.3% +3.5% +3.8%
VI. EBITDA
by sector and division:
Innovative Materials 1,539 1,733 +12.6% +15.6% +16.7%
Flat Glass 762 851 +11.7% +14.2% +15.0%
High-Performance Materials 777 882 +13.5% +17.2% +18.6%
Construction Products 1,567 1,609 +2.7% +13.1% +12.7%
Interior Solutions 982 953 -3.0% +14.9% +13.8%
Exterior Solutions 585 656 +12.1% +10.8% +11.2%
Building Distribution 870 892 +2.5% +4.8% +4.7%
Misc. 22 0 n.m. n.m. n.m.
Group Total 3,998 4,234 +5.9% +10.2% +10.4%
by geographic area:
France 587 624 +6.3% +5.7% +5.9%
Other Western European countries 1,438 1,398 -2.8% +8.3% +7.9%
North America 717 777 +8.4% +13.8% +14.3%
Emerging countries and Asia 1,256 1,435 +14.3% +15.2% +15.7%
Group Total 3,998 4,234 +5.9% +10.2% +10.4%
2017
(in EUR m)
2017
(in % of sales)
2017
(in % of sales)
Change on an
actual
structure basis
2016
(in EUR m)
Change on an
actual
structure basis
2016
(in % of sales)
2017
(in EUR m)
2016
(in EUR m)
2017
(in EUR m)
Change on an
actual
structure basis
2016
(in % of sales)
2017
(in % of sales)
2016
(in % of sales)
2016
(in EUR m)

I. SALES
by sector and division:
Innovative Materials1
4,945 5,141 +4.0% +2.9% +6.5%
Flat Glass 2,708 2,807 +3.7% +2.7% +4.7%
High-Performance Materials 2,243 2,351 +4.8% +3.8% +9.2%
Construction Products1
5,913 6,295 +6.5% +4.8% +8.8%
Interior Solutions 3,286 3,467 +5.5% +4.2% +7.6%
Exterior Solutions 2,670 2,876 +7.7% +5.5% +10.1%
Building Distribution 9,144 9,456 +3.4% +2.9% +4.1%
Internal sales and misc. -458 -491 n.m. n.m. n.m.
Group Total 19,544 20,401 +4.4% +3.4% +6.0%1 including inter-division eliminations.
by geographic area:
France 4,955 5,202 +5.0% +4.8% +4.8%
Other Western European countries 8,632 8,875 +2.8% +2.1% +3.6%
North America 2,524 2,594 +2.8% +2.5% +9.8%
Emerging countries and Asia 4,325 4,709 +8.9% +6.3% +11.4%
Internal sales -892 -979 n.m. n.m. n.m.
Group Total 19,544 20,401 +4.4% +3.4% +6.0%
II. OPERATING INCOME
by sector and division:
Innovative Materials 554 643 +16.1% +11.2% +12.5%
Flat Glass 256 287 +12.1% +9.5% +10.2%
High-Performance Materials 298 356 +19.5% +13.3% +15.1%
Construction Products 542 557 +2.8% +9.2% +8.8%
Interior Solutions 340 315 -7.4% +10.3% +9.1%
Exterior Solutions 202 242 +19.8% +7.6% +8.4%
Building Distribution 363 383 +5.5% +4.0% +4.1%
Misc. -9 -20 n.m. n.m. n.m.
Group Total 1,450 1,563 +7.8% +7.4% +7.7%
by geographic area:
France 177 198 +11.9% +3.6% +3.8%
Other Western European countries 559 513 -8.2% +6.5% +5.8%
North America 234 277 +18.4% +9.3% +10.7%
Emerging countries and Asia 480 575 +19.8% +11.1% +12.2%
Group Total 1,450 1,563 +7.8% +7.4% +7.7%
III. BUSINESS INCOME
by sector and division:
Innovative Materials 439 608 +38.5% +8.9% +11.8%
Flat Glass 249 308 +23.7% +9.2% +11.0%
High-Performance Materials 190 300 +57.9% +8.5% +12.8%
Construction Products 413 393 -4.8% +7.0% +6.2%
Interior Solutions 236 235 -0.4% +7.2% +6.8%
Exterior Solutions 177 158 -10.7% +6.6% +5.5%
Building Distribution 333 257 -22.8% +3.6% +2.7%
Misc. (a)
-37 -53 n.m. n.m. n.m.
Group Total 1,148 1,205 +5.0% +5.9% +5.9%
by geographic area:
France 162 69 -57.4% +3.3% +1.3%
Other Western European countries 515 394 -23.5% +6.0% +4.4%
North America (a)
23 146 +534.8% +0.9% +5.6%
Emerging countries and Asia 448 596 +33.0% +10.4% +12.7%
Group Total 1,148 1,205 +5.0% +5.9% +5.9%(a)
after asbestos-related charge (before tax) of €45m in H2-2016 and in H2-2017
Appendix 2: Results by business sector and geographic area - 2nd
Half
H2
2016
(in EUR m)
H2
2017
(in EUR m)
Change on an
actual
structure basis
Change on a
comparable
structure basis
Like-for-like
change
H2
2017
(in % of sales)
H2
2016
(in % of sales)
Change on an
actual
structure basis
H2
2016
(in EUR m)
H2
2016
(in EUR m)
Change on an
actual
structure basis
H2
2017
(in EUR m)
H2
2017
(in % of sales)
H2
2017
(in EUR m)
H2
2016
(in % of sales)

IV. CASH FLOW
by sector and division:
Innovative Materials 529 596 +12.7% +10.7% +11.6%
Flat Glass 247 259 +4.9% +9.1% +9.2%
High-Performance Materials 282 337 +19.5% +12.6% +14.3%
Construction Products 479 509 +6.3% +8.1% +8.1%
Building Distribution 328 410 +25.0% +3.6% +4.3%
Misc. (b)
153 98 n.m. n.m. n.m.
Group Total 1,489 1,613 +8.3% +7.6% +7.9%
by geographic area:
France 227 286 +26.0% +4.6% +5.5%
Other Western European countries 555 481 -13.3% +6.4% +5.4%
North America (b)
201 301 +49.8% +8.0% +11.6%
Emerging countries and Asia 506 545 +7.7% +11.7% +11.6%
Group Total 1,489 1,613 +8.3% +7.6% +7.9%(b)
after asbestos-related charge (after tax) of €28m in H2-2016 and in H2-2017
V. CAPITAL EXPENDITURE
by sector and division:
Innovative Materials 397 499 +25.7% +8.0% +9.7%
Flat Glass 273 366 +34.1% +10.1% +13.0%
High-Performance Materials 124 133 +7.3% +5.5% +5.7%
Construction Products 351 425 +21.1% +5.9% +6.8%
Interior Solutions 226 275 +21.7% +6.9% +7.9%
Exterior Solutions 125 150 +20.0% +4.7% +5.2%
Building Distribution 176 159 -9.7% +1.9% +1.7%
Misc. 18 28 n.m. n.m. n.m.
Group Total 942 1,111 +17.9% +4.8% +5.4%
by geographic area:
France 181 203 +12.2% +3.7% +3.9%
Other Western European countries 279 313 +12.2% +3.2% +3.5%
North America 122 136 +11.5% +4.8% +5.2%
Emerging countries and Asia 360 459 +27.5% +8.3% +9.7%
Group Total 942 1,111 +17.9% +4.8% +5.4%
VI. EBITDA
by sector and division:
Innovative Materials 771 864 +12.1% +15.6% +16.8%
Flat Glass 393 425 +8.1% +14.5% +15.1%
High-Performance Materials 378 439 +16.1% +16.9% +18.7%
Construction Products 772 791 +2.5% +13.1% +12.6%
Interior Solutions 491 465 -5.3% +14.9% +13.4%
Exterior Solutions 281 326 +16.0% +10.5% +11.3%
Building Distribution 490 514 +4.9% +5.4% +5.4%
Misc. 8 -6 n.m. n.m. n.m.
Group Total 2,041 2,163 +6.0% +10.4% +10.6%
by geographic area:
France 322 345 +7.1% +6.5% +6.6%
Other Western European countries 741 694 -6.3% +8.6% +7.8%
North America 318 357 +12.3% +12.6% +13.8%
Emerging countries and Asia 660 767 +16.2% +15.3% +16.3%
Group Total 2,041 2,163 +6.0% +10.4% +10.6%
Change on an
actual
structure basis
H2
2016
(in % of sales)
H2
2017
(in EUR m)
H2
2017
(in EUR m)
H2
2017
(in % of sales)
H2
2017
(in % of sales)
Change on an
actual
structure basis
H2
2016
(in EUR m)
H2
2016
(in EUR m)
H2
2017
(in EUR m)
Change on an
actual
structure basis
H2
2016
(in % of sales)
H2
2017
(in % of sales)
H2
2016
(in % of sales)
H2
2016
(in EUR m)

SALES
by sector and division:
Innovative Materials1
2,506 2,596 +3.6% +2.6% +6.8%
Flat Glass 1,377 1,425 +3.5% +2.7% +4.8%
High-Performance Materials 1,132 1,179 +4.2% +3.0% +9.8%
Construction Products1
2,886 3,112 +7.8% +5.4% +10.2%
Interior Solutions 1,646 1,771 +7.6% +5.1% +8.9%
Exterior Solutions 1,263 1,366 +8.2% +5.7% +11.8%
Building Distribution 4,625 4,781 +3.4% +2.9% +4.0%
Internal sales and misc. -230 -249 n.m. n.m. n.m.
Group Total 9,787 10,240 +4.6% +3.4% +6.5%1 including inter-division eliminations.
by geographic area:
France 2,565 2,725 +6.2% +6.0% +6.0%
Other Western European countries 4,240 4,395 +3.7% +2.4% +3.8%
North America 1,224 1,239 +1.2% +0.8% +10.3%
Emerging countries and Asia 2,190 2,375 +8.4% +5.9% +12.0%
Internal sales -432 -494 n.m. n.m. n.m.
Group Total 9,787 10,240 +4.6% +3.4% +6.5%
Appendix 3: Sales by business sector and geographic area - Fourth Quarter
Q4
2016
(in EUR m)
Q4
2017
(in EUR m)
Change on an
actual
structure basis
Change on a
comparable
structure basis
Like-for-like
change

Appendix 4: Consolidated balance sheet
in € million Dec. 31, 2016 Dec. 31, 2017
Assets
Goodwill 10,669 10,575
Other intangible assets 2,662 2,603
Property, plant and equipment 11,654 11,590
Investments in equity-accounted companies 376 379
Deferred tax assets 1,188 938
Other non-current assets 710 774
Non-current assets 27,259 26,859
Inventories 5,875 6,041
Trade accounts receivable 4,935 5,134
Current tax receivable 445 204
Other receivables 1,515 1,395
Cash and cash equivalents 3,738 3,284
Current assets 16,508 16,058
Total assets 43,767 42,917
Equity and Liabilities
Capital stock 2,221 2,214
Additional paid-in capital and legal reserve 6,090 5,944
Retained earnings and consolidated net income 11,078 12,167
Cumulative translation adjustments (743) (1,756)
Fair value reserves 191 22
Treasury stock (72) (123)
Shareholders' equity 18,765 18,468
Minority interests 375 384
Total equity 19,140 18,852
Non-current portion of long-term debt 6,959 7,655
Provisions for pensions and other employee benefits 3,615 2,927
Deferred tax liabilities 363 427
Other non-current liabilities and provisions 1,242 1,053
Non-current liabilities 12,179 12,062
Current portion of long-term debt 1,835 1,064
Current portion of other liabilities and provisions 436 412
Trade accounts payable 5,805 6,027
Current tax liabilities 148 157
Other payables 3,636 3,823
Short-term debt and bank overdrafts 588 520
Current liabilities 12,448 12,003
Total equity and liabilities 43,767 42,917

Appendix 5: Consolidated cash flow statement
(in € million) 2016 2017
Net income of operations attributable to equity holders of the parent 1,311 1,566
Minority interests in net income 41 59
Share in net income of associates, net of dividends received (20) (13)
Depreciation, amortization and impairment of assets 1,369 1,442
Gains and losses on disposals of assets 2 (46)
Unrealized gains and losses arising from changes in fair value and share-based payments 42 16
Changes in inventories (173) (348)
Changes in trade accounts receivable and payable, and other accounts receivable and payable 72 139
Changes in tax receivable and payable (135) 236
Changes in deferred taxes and provisions for other liabilities and charges (544) (286)
Net cash from operating activities 1,965 2,765
Purchases of property, plant and equipment [ in 2016: (1,370), in 2017: (1,538) ] and intangible assets (1,521) (1,722)
Acquisitions of property, plant and equipment in finance leases (21) (15)
Increase (decrease) in amounts due to suppliers of fixed assets 24 99
Acquisitions of shares in consolidated companies [ in 2016: (252), in 2017: (553) ], net of debt acquired (266) (588)
Acquisitions of other investments (110) (84)
Increase in investment-related liabilities 15 17
Decrease in investment-related liabilities (9) (42)
Investments (1,888) (2,335)
Disposals of property, plant and equipment and intangible assets 85 183
Disposals of shares in consolidated companies, net of net debt divested 39 4
Disposals of other investments and other divestments 1 1
Divestments 125 188
Increase in loans and deposits (144) (183)
Decrease in loans and deposits 150 186
Net cash from (used in) investment and divestment activities (1,757) (2,144)
Issues of capital stock 149 187
(Increase) decrease in treasury stock (418) (406)
Dividends paid (680) (693)
Minority interests' share in capital increases of subsidiaries 2 7
Increase (decrease) in investment-related liabilities (put on minority interests) (13) (36)
Acquisitions of minority interests (without gain of control) 0 (4)
Disposals of minority interests (without loss of control) 0 25
Dividends paid to minority shareholders of consolidated subsidiaries (31) (27)
Changes in dividends payable 0 (11)
Net cash from (used in) financing activities (991) (958)
Net effect of exchange rate changes on net debt 25 22
Net effect from changes in fair value on net debt (89) 4
Increase (decrease) in net debt (847) (311)
Net debt at beginning of period (4,797) (5,644)
Net debt at end of period (5,644) (5,955)

Amounts in €bn
Amount and structure of net debt €bn
Gross debt 9.3
Cash & cash equivalents 3.3
Net debt 6.0
Breakdown of gross debt 9.3
Bond debt and perpetual notes 7.8
March 2018 0.1 (NOK 0.8bn)
October 2018 0.7
September 2019 0.9
March 2020 1.0
June 2021 0.8
March 2022 0.9
October 2022 0.1
After June 2022 3.3
Other long-term debt 0.7
Short-term debt 0.8 (excluding bonds)
Negotiable European Commercial Paper (NEU CP) 0.0 Maximum amount of issuance program: EUR 3bn
Securitization of trade receivables 0.3 (EUR 0.2bn equivalent in USD + EUR 0.1bn)
Local debt and accrued interest 0.5
Credit lines, cash & cash equivalents 7.3
Cash and cash equivalents 3.3
Back-up credit-lines 4.0 See breakdown below
Breakdown of back-up credit lines 4.0
All lines are confirmed and undrawn, with no Material Adverse Change (MAC) clause
Expiry Financial Covenants
Syndicated line: €2.5bn December 2022 None
Syndicated line: €1.5bn December 2022 None
Comments
Frequent rollover; many different sources of financing
At end of December 2017
85% of gross debt was at fixed interest rates
and the average cost of gross debt was 2.8%
(including EUR 0.4bn long-term securitization)
Appendix 6: Debt at December 31, 2017

FY 2017, in % of total sales
Innovative
Materials
Construction
Products
Building
DistributionTotal
France 2.6% 3.1% 19.0% 24.7%
Germany - Austria 2.3% 2.1% 4.6% 9.0%
United Kingdom - Ireland 0.7% 2.2% 7.4% 10.3%
Nordics 0.6% 2.0% 10.1% 12.7%
Other Western European countries 2.9% 3.1% 3.4% 9.4%
North America 4.8% 8.0% - 12.8%
Latin America 3.5% 2.0% 1.1% 6.6%
Asia 4.9% 3.1% - 8.0%
Eastern Europe 2.5% 1.9% 0.5% 4.9%
Middle East & Africa 0.2% 1.4% - 1.6%
Total 25.0% 28.9% 46.1% 100.0%
Appendix 7: External sales by business sector and geographic area