pressure measurements on yacht sails: development...
TRANSCRIPT

Pressure Measurements on Yacht Sails:
Development of a New System for Wind Tunnel and Full Scale Testing
Fabio Fossati, Ilmas Bayati, Sara Muggiasca, Ambra Vandone, Department of Mechanical
Engineering, Politecnico di Milano, Milano, Italy.
Gabriele Campanardi, Department of Aerospace Science and Technology, Politecnico di Milano,
Milano, Italy
Thomas Burch, CSEM, Centre Suisse d’Electronique et de Microtechnique SA, Alpnach Dorf,
Switzerland
Michele Malandra, North Sails Group, Carasco, Italy
ABSTRACT
The paper presents an overview of a joint project
developed among Politecnico di Milano, CSEM and North
Sails, aiming at developing a new sail pressure measurement
system based on MEMS sensors (an excellent compromise
between size, performance, costs and operational
conditions) and pressure strips and pads technology. These
devices were designed and produced to give differential
measurement between the leeward and windward side of the
sails. The project has been developed within the Lecco
Innovation Hub Sailing Yacht Lab, a 10 m length sailing
dynamometer which intend to be the reference
contemporary full scale measurement device in the sailing
yacht engineering research field, to enhance the insight of
sail steady and unsteady aerodynamics [1].
The pressure system is described in details as well as the
data acquisition process and system metrological validation
is provided; furthermore, some results obtained during a
wind tunnel campaign carried out at Politecnico di Milano
Wind Tunnel, as a benchmark of the whole measuring
system for future full scale application, are reported and
discussed in details.
Moreover, the system configuration for full scale testing,
which is still under development, is also described.
NOTATION
ρ Density of air (kg/m^3)
Cp Pressure coefficient (-)
p Actual Measured Pressure (Pa)
𝑝0 Reference static pressure (Pa)
𝑉∞ Incoming/apparent wind speed (m/s)
LWL length water line (m)
INTRODUCTION
The possibility of knowing the effective pressure
distribution over the sail plan is of great interest for the
aerodynamic and structural design of sails and for the
selection and the optimal use of materials an production
techniques. Integral measurements alone may not be
sufficient in understanding how a sail plan can be optimized
on specific purposes, if any information about the complex
local fluid-structure interaction are provided.
In the last few years there has been a revival of pressure
measurements on yacht sails and recently several
contributions can be found in literature aiming to assess sail
pressure distribution detection ([2-9]).
The present paper presents an overview of an ongoing
joint project developed among Politecnico di Milano, CSEM
and North Sails aiming at assessing a new sail pressure
measurement system based on MEMS pressure transducers,
connected to strips and pads. These devices were designed
and produced with the scope to provide differential
measurements between the leeward and windward side of
the sails.
The project has been developed within the Lecco
Innovation Hub Sailing Yacht Laboratory project, a 10 m
length sailing dynamometer which longs for being the
modern reference full scale measurement setup in the sailing
yacht engineering research field, in order to enhance the
insight of sail steady and unsteady aerodynamics.
An overview of the Sailing Yacht Lab project is provided
in [1]: a brief summary of the origin and building steps of
the vessel’s design are given, along with a description of
principal design and performance criteria. Also the project
management and commissioning are described, as well as
the measurement capabilities and data acquisition
procedure.
THE 22ND CHESAPEAKE SAILING YACHT SYMPOSIUM ANNAPOLIS, MARYLAND, MARCH 2016
84

Furthermore, an important feature of this project is the
availability of measurement systems for pressure
distribution acting on the sails at full scale.
In the following, the pressure measurement system is
described in details, as well as the data acquisition process
and system metrological validation is provided.
The pressure measurement system has also been tested in
the wind tunnel using a scale model of sailing yacht and
compared with a different pressure measurement system
already available at Politecnico di Milano Wind Tunnel. For
wind tunnel tests were realized strips and pads adequate for
the model sails.
Some results obtained during a wind tunnel campaign
carried out during an Offshore Racing Congress project
aimed at revising sails aerodynamic coefficients and ORC
VPP aerodynamic model are reported and discussed in
details.
In conclusion the pressure measurement system designed
for full scale testing is described.
PRESSURE MEASUREMENT SYSTEM
The pressure distribution on the sails is carried out by
means of MEMS sensors (an excellent compromise between
size, performance, costs and operational conditions) and
dedicated pressure strips and pads which have been designed
and produced aiming to provide the differential
measurement between the sail leeward and windward side.
The pressure sensors are designed and built to provide the
differential measurement between the measurement point
and a reference pressure value which can be supplied by the
user.
In the following a detailed description of the pressure
scanners will be provided, as well as of the other main
components of the system.
Pressure strips scanner description
The scanner CSEM C16 is a miniaturized electronic
pressure scanner in a slim, lightweight and waterproof
package (Figure 1). It provides 16 differential pressure
sensors and a CAN bus interface for the communication.
High attention was given to dimensions and shape of the
scanner box. The scanner height, of only 6 mm, has minimal
impact on the airflow, which makes it possible to place the
scanner directly in a custom built sleeve close to the actual
measurement section on the sails. Each of the 16 sensors has
its own reference input which makes the scanner especially
suited for measuring the pressure difference between
leeward and windward side on dedicated spots on the sails.
The commercial MEMS pressure dies, integrated in the
scanner, are a new generation of piezo-resistive differential
low-pressure dies to reach very low full scale ranges below
1000 Pa. Despite the die size of only 2 x 2 x 0.5 mm, that is
much smaller than traditional low-pressure dies, it provides
improved zero-stability, reduced g-sensitivity and reduced
sensitivity to humidity. This added stability permits use with
added amplification to achieve accurate performance in
ranges much lower than its nominal 1000 Pa rating. The key
specification of the scanner is given in Table 1.
The MEMS sensors are cost efficiently bonded to a FR4
substrate using innovative die bonding techniques based on
elastic adhesives (Figure 5). The sensors are packaged in a
sensor array with minimal air cavity to ensure optimal
performance in combination with the micro-channels of the
pressure strips.
Figure 1 - Pressure Scanner C16 with auxiliary parts. 1)
Scanner, 2) CAN Cable, 3) CAN connector, 4) Tube
Adapter
Parameter C16 Unit
FS pressure range ±1000 Pa
Number of pressure inputs 16
Number of reference inputs 16
Measurement resolution 0.01 % FS
Static accuracy after zeroing 0.25 % FS
Total thermal error 0.01 %FS/°C
Sample rate 1 - 100 Hz
Input voltage 12 V
Operation current 60 mA
Communication CAN Interface 1 Mbit / s
Maximal CAN cable length 40 m
Internal flash data memory size 8 Mbit
Operating temperature range -10 to 70 °C
Size 65x55x6 mm
Weight 50 gram
Table 1 - Pressure Scanner Specification
A dedicated pressure flange system makes the scanner
compatible with either the pressure strips or with standard
tubing. Three different pressure adapters have been
developed, which can be screwed to the scanner. The first
adapter provides 32 tubes (2 per pressure sensor, one facing
to the front side and one to the reference side of the sensor).
A second adapter combines all reference inputs to a single
tube, in order to connect all MEMS sensors to the same
reference (Figure 2 and Figure 3). Finally, the third adapter
provides direct access to the pressure strips without the need
of any tubes.
①
④
③
②
85

Figure 2 - Pressure tube adapter 2 x 16 tubes (left) and
1 + 16 tubes (right)
Figure 3 - Pressure flange with gasket and threads to
connect and seal pressure tube- or strip-adapters
The scanner C16 supports a standard CAN interface
(CAN 2.0A) with a proprietary CAN protocol, allowing
remote access to the essential commands required when
integrating the unit into an instrumentation system. The
serial CAN bus topology (Figure 4) allows for up to 128
scanners in a single network. In practice, the number of
scanners per network should be below 16 (i.e. 256 pressure
sensors) in order to reduce the data traffic on the bus and to
guarantee synchronized data sampling.
The CAN interface has been preferred over a wireless
solution due to its robust data transmission capability, the
guaranteed data rate of 1 Mbit per second and the possibility
to directly supply electrical power to the scanners via the flat
CAN cable. Thus, no battery is required in the scanner which
reduces both, the dimensions and the overall weight of the
scanners. All measurement data and configuration
commands are sent over the CAN interface. A correctly
received command is always acknowledged by the scanner
with the transmission of a response message.
Two basic data sampling approaches are supported either
autonomous sampling or master sampling. The desired
option can be configured and stored in the configuration
flash. In auto sampling mode each scanner in the network
generates its own sample timing according to a programmed
sample rate and transmits the measurement data of each
sample to the CAN bus autonomously. The measurement
data can be collected on-line or can be stored in the internal
flash of the scanner and downloaded off-line after the
measurement session.
In master sampling mode the user programmed
instrumentation system (SW running on PC or Laptop) acts
as sample master and broadcasts each sample start with a
SINGLE_SHOT sample command. All scanners in the
network receive the sample command at the same time and
start the measurement immediately and synchronously. Each
scanner writes the measurement data to the CAN bus
following a bus collision avoidance protocol. The master
collects the response messages of all active scanners in the
CAN network, and initiates the next sample according to the
desired sample rate. The master sampling mode has the
advantage that all scanners connected to the CAN bus are
synchronized by the master, even over a long sample period
of several hours. The 16 sensors of each scanner are sampled
sequentially with an internal scan rate of up to 4 kHz. Hence
in master sampling mode all sensors in the CAN network
can be sampled nearly synchronous within 4 ms.
Figure 4 – CAN bus topology
Figure 5 - Pressure scanner electronics with MEMS
sensors bonded to FR4 substrate
86
Pressure strips technology
The pressure strip system is suited for aerodynamics
testing on full scale objects in their natural environment but
also for models in a wind tunnel (Figure 6). Its main
advantage is the light weight and thin, flexible foil
appearance which allows non-invasive application to the test
surface. The pressure strips are made of thin polymer films
and the strip geometry can be customized for nearly
seamless fitting to the test object (Figure 7). Tiny micro-
channels in the pressure strip propagate the pressure from
the tap to the connected pressure scanner. Manufacturing
processes have been developed successfully using laser and
micro-milling to produce strips with comparatively deep
channels. Laser fabrication has the advantage that it can
produce channels in soft materials such as silicone or soft
PVC, thus increasing the flexibility of the strip significantly
without having to reduce the thickness of the strip. On the
other hand, channels can be manufactured approximately 5
times faster using micro-milling (Figure 6).
The base material with milled or laser ablated channels is
laminated with transparent adhesive tape in order to obtain
sealed channels.
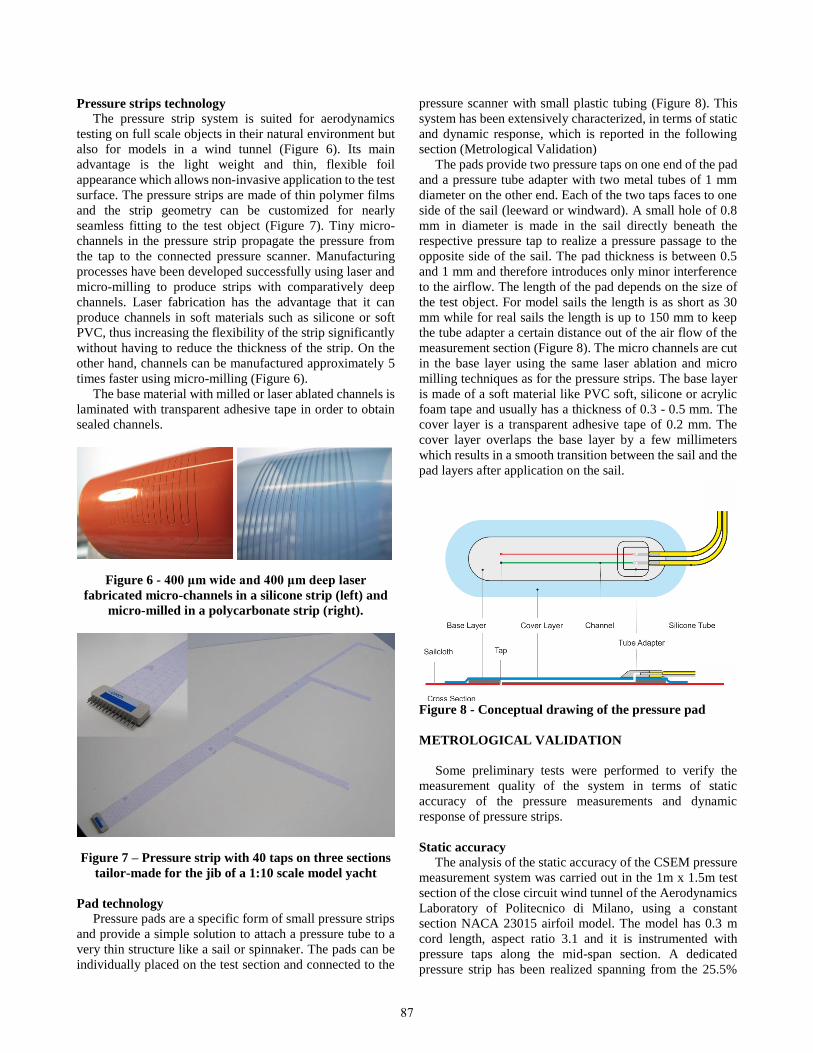
Figure 6 - 400 μm wide and 400 μm deep laser
fabricated micro-channels in a silicone strip (left) and
micro-milled in a polycarbonate strip (right).
Figure 7 – Pressure strip with 40 taps on three sections
tailor-made for the jib of a 1:10 scale model yacht
Pad technology Pressure pads are a specific form of small pressure strips
and provide a simple solution to attach a pressure tube to a
very thin structure like a sail or spinnaker. The pads can be
individually placed on the test section and connected to the
pressure scanner with small plastic tubing (Figure 8). This
system has been extensively characterized, in terms of static
and dynamic response, which is reported in the following
section (Metrological Validation)
The pads provide two pressure taps on one end of the pad
and a pressure tube adapter with two metal tubes of 1 mm
diameter on the other end. Each of the two taps faces to one
side of the sail (leeward or windward). A small hole of 0.8
mm in diameter is made in the sail directly beneath the
respective pressure tap to realize a pressure passage to the
opposite side of the sail. The pad thickness is between 0.5
and 1 mm and therefore introduces only minor interference
to the airflow. The length of the pad depends on the size of
the test object. For model sails the length is as short as 30
mm while for real sails the length is up to 150 mm to keep
the tube adapter a certain distance out of the air flow of the
measurement section (Figure 8). The micro channels are cut
in the base layer using the same laser ablation and micro
milling techniques as for the pressure strips. The base layer
is made of a soft material like PVC soft, silicone or acrylic
foam tape and usually has a thickness of 0.3 - 0.5 mm. The
cover layer is a transparent adhesive tape of 0.2 mm. The
cover layer overlaps the base layer by a few millimeters
which results in a smooth transition between the sail and the
pad layers after application on the sail.
Figure 8 - Conceptual drawing of the pressure pad
METROLOGICAL VALIDATION
Some preliminary tests were performed to verify the
measurement quality of the system in terms of static
accuracy of the pressure measurements and dynamic
response of pressure strips.
Static accuracy
The analysis of the static accuracy of the CSEM pressure
measurement system was carried out in the 1m x 1.5m test
section of the close circuit wind tunnel of the Aerodynamics
Laboratory of Politecnico di Milano, using a constant
section NACA 23015 airfoil model. The model has 0.3 m
cord length, aspect ratio 3.1 and it is instrumented with
pressure taps along the mid-span section. A dedicated
pressure strip has been realized spanning from the 25.5%
87

chord position of the lower surface to the 87.5% chord
position of the upper surface of the model (Figure 9).
The strip is provided with a double series of pressure taps
(Figure 9): at the same chord position of each pressure tap
on the strip another hole through the strip was created to be
connected to proper tubes, so that comparative
measurements could be taken both for the novel pressure
system with strip micro-channels (CSEM) and the
consolidated high accuracy pressure scanner system (PSI)
(Figure 9). More specifically, the latter relies on an Esterline
Pressure Systems DTC ESP miniature pressure scanner with
1 PSI range, controlled by a Chell QUADdaq System.
Figure 9 - NACA23015 airfoil model instrumented with
pressure strip for static wind tunnel test
Static measurements were gathered for fixed incidence
angles, ranging from -2 degrees to 14 degrees, at
respectively 2.5 m/s, 5 m/s, 10 m/s, 15 m/s and 20 m/s wind
speed.
For clarity, in Figure 10, only the results for the wing
model at 6 degrees of incidence, are reported. The data
plotted in the graph are reduced in terms of pressure
coefficient, defined as
𝑪𝒑 =𝒑−𝒑𝟎𝟏
𝟐𝝆𝑽𝟐∞
(1)
where p is the pressure on pressure tap, 𝒑𝟎 the reference
pressure, 𝝆 the air density and 𝑽∞ the wind speed of the
incoming inflow.
It can be noticed that there is good agreement between
pressure taps data and the pressure strip data, except for a
few points near the airfoil leading edge, where the airfoil has
strong curvature. In this region the strip installation, even
though it was executed with particular accuracy, presents
some tiny surface deformations - visible as small air bubbles
around the pressure taps next to the leading edge - which are
the main source of the differences.
Dynamic response
Further experimental investigation was also carried out
to better understand the dynamic capabilities of the pressure
strips. A truck hooter has been utilized as pressure wave
generator, driven by a signal generator and an amplifier. The
pressure measurements were taken by the means of two
CSEM pressure scanners: one with a pressure port connected
directly to the pressure wave source by a very short tube
(Figure 11), the second with a pressure port connected to the
strip channel under test in the same way to be used during
the wind tunnel testing, Figure 7.
Figure 10 - Pressure distribution along the airfoil for an
angle of incidence of 6°
Figure 11 - Test setup for dynamic response
evaluation
A special attention was paid to the pressure connections to
the source. Two tubes of the same length were adopted to
connect the scanner and the strip channel to be tested, Figure
11. In such a way it can be reasonably assumed that the
pressure wave measured near the source has the same
amplitude and phase of the pressure wave reaching the
pressure tap on the strip. The connection and the sealing of
the tube on the strip was done by means of modeling clay.
Measurements were carried out on the pressure taps
connected with the longest channel of each pressure tap
array (bottom, middle, top) both on the mainsail and the jib
strip (red circles in Figure 12).
88

The tests were conducted generating single tone
sinusoidal pressure waves and sinusoidal sweeps in the
frequency range 0 - 3 Hz the expected frequency range for
this phenomenon. The pressure data acquisition was started
simultaneously on the two scanners. The choice behind the
characterization of the pressure system within this frequency
range, is consistent with the interest of investigating the
physics of slow varying aerodynamic phenomena connected
to the sailing yacht motion, due the combined wind and
wave loading. The full-scale cutoff frequency of this range
is approximately 2 Hz [10]. Frequencies higher than this
range (e.g. turbulence) are not expected to have any relevant
influence on the overall dynamics of the boat, in that it
represents a mechanical low pass filter.
For the sake of simplicity, only the results obtained for
the pressure tap on top array of the mainsail (left) are shown
in Figure 13.
Figure 12 – Positions of the pressure taps tested
Figure 13 - Dynamic response of the pressure tap on the
top array of the mainsail
The obtained results agree with the expected ones for
channels with a small section and comparable length. As it
can be noticed from Figure 13, the linear trend in the
output/input relative phase means a constant shift of the
signal in phase (i.e. angular coefficient of the straight line in
the frequency graph, Figure 13), so that the time history can
be easily and consistently corrected during the post-
processing procedures.
WIND TUNNEL TESTS
Test apparatus, program, and procedure A complete 1:10 scale model of a 48’ cruiser-racer,
consisting of yacht hull body (above the waterline) with
deck, mast, rigging and sails is mounted on a six component
balance, which is fitted on the turntable of the wind tunnel
(Figure 14). The turntable is automatically operated from the
control room enabling a 360° range of headings. This permit
to set desired AWA (apparent wind angle) during the tests.
The large size of the low speed test section enables yacht
models of quite large size to be used, so that the sails are
large enough to be made using normal sail making
techniques, the model can be rigged using standard model
yacht fittings and small dinghy fittings without the work
becoming too small to handle, commercially available
model yacht sheet winches can be used and, most
importantly, deck layout can be reproduced around the sheet
winch, allowing all the sails to be trimmed as in real
operating condition. Moreover, the model yacht drum type
sheets are operated through a 7 channel proportional radio
control system, except that the aerial is replaced by a hard
wire link and the usual joystick transmitter is replaced by a
console with a 7 multi-turn control knobs that allow winch
drum positions to be recorded and re-established if
necessary. The sheet trims are controlled by the sail trimmer
who operates from the wind tunnel control room.
Figure 14 shows the model mounted in the wind tunnel. Both
sides of the main sail and the jib are equipped with tailor-
made pressure strips, each providing three test sections and
a total of 40 pressure taps. An example of such pressure strip
is given in (Figure 7). Wind tunnel pressure set up was
realized to measure pressure distributions on both sides of
the sails, whereas in the full scale set up only differential
pressure could be measured, for the intrinsic difficulty in the
definition of a reference pressure signal in the real operating
environment: this set up permits to better investigate the
flow field around the sail, more in detail than it would be
possible for full scale measurements.
A high performance strain gauge dynamic conditioning
system is used for balance signal conditioning purposes.
The balance is placed inside the yacht hull in such a way that
x axis is always aligned with the yacht longitudinal axis, and
the model can be heeled with respect to the balance. The
wind tunnel is operated at a constant speed after the wind
speed profile and optionally wind twist can be properly
tuned considering the desired targets, which are previously
calculated considering the potential boat performance at
different true wind speeds and yacht courses. This allows to
reproduce apparent wind speed both in terms of wind
magnitude and profile [11]. As previously mentioned, the
velocity profile can be simulated by means of independent
89

control of the rotation speed of each fan joined to the
traditional spires & roughness technique, while the twist can
be simulated by twisting the flexible vanes by different
amounts over the height range. The wind tunnel speed is
most usually limited by the strength of the model mast and
rigging and the power of the sheet winches.
Figure 14 - Yacht model in the boundary layer test
section of Politecnico di Milano Wind Tunnel
The model is set at an apparent wind angle and at a fixed
heel. An important feature of wind testing procedure is that
the model should be easily visible during the tests so that the
sail tell-tales can be seen by the sail trimmer. For this
purposes some cameras placed in the wind tunnel as well as
onboard allow a view similar to the real life situation (Figure
16).
Flying Shape Detection During the present wind tunnel campaign, a novel sail
flying shape detection system, based on Time of Flight
technology (TOF), was adopted to perform shape
measurements along with pressure and force data, as in the
full scale final system [1]; therefore, a master software was
programmed to trigger synchronously the acquisition of all
devices. A thorough explanation of this TOF novel
technology can be found in [12]. Basically, a laser pulse is
emitted by the TOF sensor and by measuring the time the
pulse takes to hit the target surface and to come back to the
receiver, it is possible to estimate the target distance.
Figure 15 - The Flying Shape Detection (TOF) System
and its position for wind tunnel tests: one system per
sail
The device performs measurements in terms of spatial
coordinates of thousands of points belonging to the sail
surface without impairing its shape since no contact occurs
between object and sensor. These data, coming singularly
from two different laser scanners, one for main sail and the
other for jib (or gennaker), as in Figure 15, are then
processed together to reconstruct the 3D sail surfaces
(Figure 17), which can be sectioned in correspondence to the
pressure strip heights allowing to compare pressure
distribution against sail shape (Figure 21).
Figure 16 - Onboard camera view on jib during testing
90

Figure 17 - Example of a point cloud acquired for
mainsail (blue) and jib (green): 3D reconstruction sail
shapes and highlighted sections in correspondence of
the pressure strips
Upwind sails tests and results The usual way to analyze data of this type of measurements
is to compare non-dimensional coefficients [11], [13],
allowing to compare the efficiency of sails of different total
area at different conditions of dynamic pressure. The first
useful parameter to be analyzed is the variation of driving
force coefficient Cx versus heeling force coefficient Cy.
Figure 18 shows Cx Vs Cy curves for the 6 apparent wind
angles (AWA) tested in this campaign. It can be seen that
there are some settings at the highest values of heeling force
coefficients where the driving force is lower than the
maximum value (e.g. below the maximum efficiency curve,
isolated points in Figure 18). These non-optimum values
were due to an over-sheeting of the sails, such that the
mainsail generally had a tight leech and the airflow
separated in the head of the sail, [14]. After having
maximized the driving force, the sails were adjusted to
reduce the heeling force measuring the reduction of the
driving force. The reduction in heeling force was achieved
by initially easing the main sheet, to twist the mainsail and
minimize flow separation, then adjusting the traveller to
reduce the angle of attack of the wind on the main. Envelope
curves have been drawn through the test points with the
greatest driving force at a given heeling force (e.g. depower
curves, Figure 18).
The heeling moment is also measured during these wind
tunnel tests and it can be used to determine the center of
effort position of the rig. For close hauled configuration, the
sail plain center of effort height, Ceh, is obtained by dividing
the roll moment by the heeling force component in the yacht
body reference system and normalized over the height of the
of the mast.
A plot of center of effort height variation with heeling
force coefficients for tested apparent wind angles can be
seen in Figure 19, in terms of the ratio between center of
effort height from the boat deck and the fore-triangle height.
As it can be seen, the center of effort height tends to decrease
as the heeling force coefficients decrease. This is explained
by the way in which the sails are de-powered to reduce Cy:
increasing the twist reduces the loading in the head of the
sails and then depowering the mainsail leaving the same
genoa trim, which has a lower center of effort, tends to
reduce it.
Figure 18 - Driving force coefficient Cx versus lateral
force coefficient Cy
Analogously, also the center of effort longitudinal
position, Cea, is obtained by dividing the yaw moment by
the heeling force component in the yacht body reference
system and normalized over the LWL. Its variation with
heeling force for all angles can be seen in Figure 20, to be
interpreted with reference to the envelope of the points
corresponding to maximum driving force at each heeling
force are reported (Figure 18).
In Figure 20 Cea is measured from the origin of the
balance which is placed behind the mast. As can be seen Cea
moves forward as Cy reduces: this is again explained by the
way the sails are de-powered, as described above.
As depicted in Figure 18, the points laying on the de-
powering curve at maximum apparent wind angle AWA
(35°), were chosen for a more thorough investigation in
terms of pressure distributions and corresponding flying
shapes. More specifically, as it can be noticed in Figure 12,
three stations at different height, both on main sail and jib,
port/starboard sides, were chosen to put the pressure strips
on (Figure 12 and Figure 17). In Figure 12, L1, L2 and L3
stand respectively for the three levels at 25%, 50% and 75%
of the sail heights, so the corresponding pressures at the
points 1-4 are reported in Figure 28.
91

Figure 19 - Centre of effort height vs heeling force
coefficient
Figure 20 - Centre of effort longitudinal position vs
heeling force coefficient
Furthermore, in Figure 28, the pressure channels at the
L2 level of the main sail, were doubled to get the same
measurements with two different pressure systems to cross-
check again, during wind tunnel tests, the reliability of the
novel CSEM acquisition system (the empty markers are due
to the certified old system, PSI).
Figure 28 suggests a few interesting comments about the
aerodynamics behind: analyzing singularly the pressure
coefficients of the main sails, especially for L2 and L3, it can
be easily seen that the trend is of an increase in the pressure
coefficient Cp nearby the main sail’s leading edge, where
the mast is placed, associated to a separation bubble, which
has been documented in the past [14]. Furthermore, moving
along the airfoil chord, up to the trailing edge, another
greatly negative pressure coefficient is experienced, for
points of lower driving force coefficient Cx (i.e. 3-4 of
Figure 18), right after the reattachment behind the mast
separation, whereas for points with greater efficiency (i.e. 1-
2 of Figure 18) this bubble seems not to be occurring:
therefore, after the separation due to the mast, a monotonic
trend up to the trailing edge is evident, index of a gradually
and efficient reattachment of the flux on the leeward side of
the sail. Nevertheless, some considerations can be reported
when it comes to analyzing comparatively both jib and main
sails at the same time, for example at the level L2 (Figure
28). It is clear how moving to less efficient trims of the sail
plain (i.e. 3-4 of Figure 18), which were possible by sheeting
differently only the main sail, as thoroughly above
explained, has an important influence on the jib sail itself,
then modifying the overall driving force coefficient Cx.
More specifically, for worse trimming of the sail, the
aerodynamics of the jib is modified in the sense that the
suction effect of the main gets weaker (Figure 28, L2 – jib),
leading to a different lifting attitude of the jib as well.
Therefore, the higher (less negative) pressure coefficient on
the leeward side of the jib, visible in the L2 section of Figure
28, can be interpreted as a consequence of this phenomenon.
Moreover, in Figure 29, a comparative plot of two
different AWA (i.e. 20° and 35°), both from maximum
driving force coefficient configurations (see Figure 18), are
reported. Considering again the section L2 both for jib and
for main, without loss of generality for the other sectional
airfoils, the following explanations can be drawn: the
pressure distributions of the jib have basically the same
trends and values, since the related shape is due to the
maximum power trim; therefore, the main difference can be
noticed in the main sail, where the pressure distribution also
explains the lower driving force coefficients Cx AWA 20°
(Figure 18), associated to a center of effort that is located
upward (Figure 19) and slightly forward (Figure 20) with
respect to the higher angle of attack (AWA 35°). This trend
is also visible in the Figure 21, where it is clear that the
driving force, computed as the integral of the pressure
distribution on the corresponding section, is mainly given by
the jib. In Figure 21, the blue arrows correspond to positive
pressure coefficients (windward), whereas red ones to
negative (leeward). The pressure measurements of the whole
wind tunnel session reported were referenced to the wind
tunnel static pressure signal.
Comparing Figure 28 and Figure 29 is also interesting to
notice that a less efficient sail plan (e.g. pt.4 of AWA 35°,
Figure 28) is aerodynamically kind of equivalent to a sail
plain set to a smaller effective apparent wind angle (AWA
20°, Figure 29), which is something that is also known and
commonly experienced in sailing. As a matter of fact, great
similitude can be found in the results reported in Figure 28
and Figure 29, with the extensively investigated
aerodynamics of airfoils with external airfoil flaps [14].
The same considerations can be drawn analyzing
pressure distributions along with the sail shapes detected by
TOF system. More specifically, in Figure 22 a comparative
visualization of the pressure distributions on the effective
flying shape, at the corresponding section (L2), is reported
for the apparent wind angle AWA 35° and for maximum and
minimum efficiency (i.e. pt.1 and 4 of Figure 18).
92

Figure 21 - Visual pressure distribution on the sail plan
based on measurements at section L2, AWA 20°
The pressure distributions are the same that are also
reported in Figure 28: it is evident how basically the same
jib’s shape of the section, which was not modified along the
de-power curve of Figure 18, turns out in a different pressure
trends due to the different efficiency of the main sail, whose
suction effect on the jib is greatly lower in a de-powered
regulation. Also the different overall lateral forces Fy
depicted in Figure 21, computed from integrating the
pressures over the L2 section, confirm the integral
measurements reported in Figure 18. Furthermore, in Figure
23, the comparison of different AWA results, both in a
maximum power configuration, as reported in Figure 29, for
L2 section, are shown in terms pressure/shape
visualizations. It is easy to notice that the fairly similar
pressure distribution on the jib (Figure 29), due to the
maximum power based trimming, is associated to different
shape, leading to different driving forces on the jib and
comparable lateral forces on the main sail (i.e. Figure 18, for
approximately the same Cy, AWA 20° shows a lower
driving force coefficient Cx with respect to AWA 35°). Also
Figure 24, in which apparent wind directions are
highlighted, supports the consideration above reported:
more specifically, the less efficient sail plan at AWA 35°
shows similarities with lower AWA configurations in terms
of main sail pressure distribution. In fact, it is quite evident
a reattachment of the flow right behind the mast combined
with the co-alignment of the flow with the luff of the
mainsail.
It is worth mentioning that these tests represent,
according to author’s knowledge, one of the first systematic
wind tunnel set of measurements of the pressure
distributions on flexible sails, instead of rigid, which is a
testing condition closer to the real navigation (i.e. full scale),
whose measurements (forces, pressures and flying shapes)
on SYL, will be taking advantages from the present research.
Furthermore, the rationale behind the way the sails were
trimmed, corresponds to a procedure which is consistent to
the real sailing navigation. However, a systematic
investigation on the aerodynamics of sail plains, relying on
this experimental setup, could be based on different
depowering approaches, aiming at assessing the effect on
single trim parameters (involving also the jib) on the local
and integral efficiency of the sails.
Figure 22 - Pressure distributions for L2 section for
AWA 35°, maximum and minimum power
configurations
Figure 23 - Pressure distributions for L2 section,
maximum power configuration, AWA 20° and 35°
93

Figure 24 - Pressure distributions for various AWA and
power configurations
FULL SCALE PRESSURE SYSTEM LAYOUT
On the Sailing Yacht Lab, the pressure distribution on the
sails is carried out by means of specifically designed
pressure pads which have been designed and produced
aiming to provide the differential measurement between the
sail leeward and windward side. So that the above reported
metrological characterization on the strips and the wind
tunnel tests were mainly to assess the capabilities of the
measuring system, in advance with respect the final full
scale implementation with pads. However, during the wind
tunnel tests some tests on pads themselves were conducted
just to verify the expected functioning, Figure 25.
With reference to the SYL sail inventory, Figure 26 and
Figure 27 show the proposed sail pressure measurement
system, the sections considered and a relevant number of
pressure taps for the complete sail plane. The full scale
pressure system is being finalized at the time of writing this
paper.
Figure 25 - Example of the full scale pads on gennaker
sail for wind tunnel model
Figure 26 - Full scale mainsail and jib pressure taps
layout
Figure 27 - Full scale gennaker pressure taps layout
94

CONCLUSIONS
A joint project developed among Politecnico di Milano,
CSEM and North Sails, aiming at developing a new sail
pressure measurement system is presented in the paper. The
system was designed for the specific application of full scale
measurements on Politecnico di Milano Sailing Yacht
Laboratory.
The capabilities of this system were evaluated through a
metrological validation of the system alone (static and
dynamic tests) and through wind tunnel tests in upwind
configuration. The pressure system was integrated in the
existent set up, in particular together with the flying shape
detection based on Time of Flight (TOF) technology.
Wind tunnel tests allowed both to check the reliability of
the new system and to investigate thoroughly upwind soft
sails aerodynamics, with the possibility of carrying out
regulation as in real navigation. During wind tunnel test
session, each side of the sail pressure distributions were
measured with reference to a common static pressure, by
means of pressure strips, whereas for full scale
implementation, pressure pads for differential
measurements were developed.
Wind tunnel results give a promising sight of the
potentiality of the system described in explaining the
dependency of sail plan aerodynamics on the sails trimming,
relying on the combined measurements of forces, pressures
and flying shapes.
Furthermore, these measurements will represent a great
reference database for validation of CFD codes and can be
used to complete the interpretation of full scale results.
Further developments in the visualization techniques
(PIV) are expected to be combined with this methodology in
the near future.
ACKNOWLEDGEMENTS
The authors want to thank the master student Riccardo
Romagnoni for his help in performing the calibration tests.
REFERENCES
[1] Fossati F., Bayati I., Orlandini F., Muggiasca S, Vandone A.,
Mainetti G, Sala R., Bertorello, Begovic E: “A Novel Full
Scale Laboratory For Yacht Engineering Research”, Ocean
Engineering 104 (2015) 219-237.
[2] Viola, I.M., Flay, R.G.J., "On-water pressure measurements
on a modern asymmetric spinnaker", in 21st HISWA
Symposium on Yacht Design and Yacht Construction,
Amsterdam, 2010.
[3] Deparday, J., Bot, P., Hauville, F., Motta, D., Le Pelley, D.J.,
Flay, R.G.J., Dynamic measurements of pressures, sail shape
and forces on a full-scale spinnaker, in 23rd HISWA
Symposium on Yacht Design and Yacht Construction,
Amsterdam, 2014
[4] Motta, D., Flay, R.G.J., Richards, P., Le Pelley, D.J., Bot, P.,
Deparday, J., An investigation of the dynamic behavior of
asymmetric spinnakers at full-scale, in 5th High Performance
Yacht Design, Auckland, 2015
[5] Pot, P., Viola, I.M., Flay, R.G.J., Brett, J.S., Wind-tunnel
pressure measurements on model-scale rigid downwind sails,
Ocean Engineering, 90, pp. 84-92, 2014
[6] Viola, I.M., Flay, R.G.J., "Sail pressures from full-scale,
wind-tunnel and numerical investigations", Ocean
Engineering, 38 (16), pp.1733–1743, 2011.
[7] Lozej, M., Golob, D., Bokal, D., "Pressure distribution on sail
surfaces in real sailing conditions", in 4th High Performance
Yacht Design Conference, Auckland, pp. 242–251, 201,
2012.
[8] Le Pelley, D., Morris, D., Richards, P., "Aerodynamic force
deduction on yacht sails using pressure and shape
measurements in real time", in 4th High Performance Yacht
Design Conference, Auckland, pp. 28–37, 2012.
[9] Motta, D., Flay, R.G.J., Richards, P.J., Le Pelley, D.J.,
Deparday, J., Bot, P., "Experimental investigation of
asymmetric spinnaker aerodynamics using pressure and sail
shape measurements", Ocean Engineering, 90, pp. 104-118,
2014.
[10] Fossati, F., Muggiasca, S. Experimental investigation of sail
aerodynamic behavior in dynamic conditions (2013)
Transactions - Society of Naval Architects and Marine
Engineers, 120, pp. 327-367.
[11] Fossati, F., Muggiasca, S., Maria, I., Zasso, A. Wind tunnel
techniques for investigation and optimization of sailing
yachts aerodynamics (2006) 2nd High Performance Yacht
Design Conference 2006, pp. 105-113.
[12] Fossati F., Mainetti G., Sala R., Schito P., Vandone A., “
Offwind Sail Flying Shapes Detection, 5th, High performance
Yacht Design Conference, Auckland, 2015.
[13] Fossati, F., Muggiasca, S., Martina, F. Experimental database
of sails performance and flying shapes in upwind conditions,
in INNOVSAIL International Conference on Innovation in
High Performance Sailing Yachts, Lorient, RINA, pp. 99-
114, 2008.
[14] Abbott H., Doenhoff E., Theory of Wing Sections: Including
a Summary of Airfoil Data, Dover Publications, Inc. New
York, 1959.
[15] Viola I., Flay R., “Pressure Distributions on Sails
Investigated Using Three Methods: On-Water
Measurements, Wind-Tunnel” Measurements,and
Computational Fluid Dynamics”, 20th Chesapeake Sailing
Yacht Symposium, 2011.
95

Figure 28 - Pressure distributions on the three stations along the span of the sail plane: points on the maximum
power curve for an apparent wind angle AWA of 35°
96

Figure 29 - Comparison of the pressure distribution of two different apparent wind angles AWA (20° and 35°), both
considered at the maximum driving force coefficients
97