pressurized testing of solid oxide fuel cells library/events/2015/2015sofc/carreiro...pressurized...
TRANSCRIPT

1Distribution Statement A - Approved for public release; distribution is unlimited
Pressurized Testing of Solid Oxide Fuel Cells
Dr. Louis G. CarreiroDr. John R. Izzo Jr.Naval Undersea Warfare CenterEnergy and Propulsion Branch
16th Annual Solid Oxide Fuel Cell(SOFC) Workshop
July 16, 2015
Distribution Statement A - Approved for public release; distribution is unlimited

2Distribution Statement A - Approved for public release; distribution is unlimited
Naval Undersea Warfare CenterDivision Newport
Distribution Statement A - Approved for public release; distribution is unlimited

3Distribution Statement A - Approved for public release; distribution is unlimited
Mission Statement
A Navy Core Equity – A National Asset
The Naval Undersea Warfare Center is the United States Navy's full-spectrum research, development, test and evaluation, engineering, and fleet support center for submarines, autonomous underwater systems, and offensive and defensive weapon systems associated with Undersea Warfare. (SECNAVINST)

4Distribution Statement A - Approved for public release; distribution is unlimited
Outline
• Introduction• Unmanned Undersea Vehicles (UUVs)• Why Pressurized Operation?• Test Facilities
- Pressure Vessel (PV)- SOFC Test Stand
• Stack Test Results- Ambient- Pressure
• Summary
4

5Distribution Statement A - Approved for public release; distribution is unlimited
Introduction
• The Navy has a need for air-independent advanced electric power sources with high energy storage that will replace batteries in unmanned undersea vehicles (UUV) applications
• A typical UUV power source will consist of a planar SOFC stack(s), fuel processor, carbon dioxide scrubber, BoP components and fuel / oxidant storage vessels.
• SOFCs offer several distinct advantages over battery technology
- Greater specific energy
- Ability to utilize energy-dense fuels
- Self-sustaining operation
- “Gas and go” capability allows UUV to be quickly re-deployed
• Although planar SOFC stacks have demonstrated the highest efficiency and power density, concerns remain regarding their robustness, gas leakage, and long-term seal durability
• Pressurized operation should help mitigate these issues

6Distribution Statement A - Approved for public release; distribution is unlimited
Autonomous Undersea VehiclesDistribution Statement A - Approved for public release; distribution is unlimited

7Distribution Statement A - Approved for public release; distribution is unlimited
Conceptual 21-inch Diameter UUV
Propulsion Section
Ballast and Trim Section
Electronics and Control Section
Nose Section: Acoustic Communications System
Energy Section Volume: 189 LMass: 209 kg
Mission Payload Section
Forward Auxiliary Section

8Distribution Statement A - Approved for public release; distribution is unlimited
UUV Energy Section with Fuel Cell
• Longer UUV missions as a result of higher energy density
• Reduced down time between missions
• Decreased cost and increased safety versus lithium batteries
• Use of hydrocarbon fuels or even biodiesel
Potential Benefits: Fuel and Oxidizer Storage
EMS Auxiliaries
Control & Buffer Battery
Fuel Cell Stack

9Distribution Statement A - Approved for public release; distribution is unlimited
Fuel / Oxidizer Choices
Fuel
• Hydrogen - compressed gas- cryogenic liquid
• Hydrocarbons- light (C1 - C4) - liquid (JP-8, diesel)
• Hydrogen-containing cpds- LiAlH4 - NaBH4- Mg2Ni (intermetallic)
Oxidizer*
• Oxygen- compressed gas- cryogenic liquid
• Hydrogen peroxide (H2O2)
• Oxygen-containing cpds- KClO4- MnO2
* Air-independent operation

10Distribution Statement A - Approved for public release; distribution is unlimited
Increase system performance, reduce SOFC losses
• SOFC voltage increases at higher pressures
• Stack efficiency enhanced by ~ 3%, due primarily to Nernstian and kinetic effects
• System efficiency associated with system level energy storage improves an estimated 7%
- Lower parasitic power losses for recycling fuel and oxidant streams- Carbon dioxide sequestration is facilitated- Reduced plumbing requirements (e.g. circulation pump for anode recycle)
• Seal integrity maintained
- High differential pressures between anode and cathode or process gas and atmosphere can cause seal between cells to fail.
- Balance external stack pressure with process gas pressure to minimize drivingforce for gas leakage.
Why Pressurization?
Enhanced efficiency increases system reliability and mission duration

11Distribution Statement A - Approved for public release; distribution is unlimited
Increased Performance
12Distribution Statement A - Approved for public release; distribution is unlimited
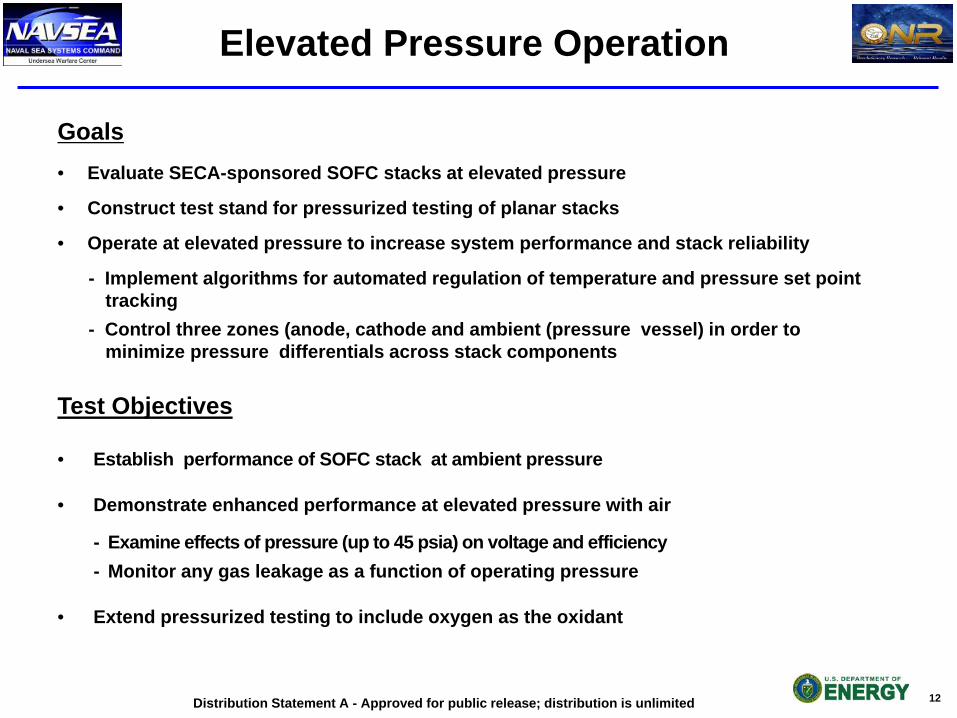
Goals• Evaluate SECA-sponsored SOFC stacks at elevated pressure
• Construct test stand for pressurized testing of planar stacks
• Operate at elevated pressure to increase system performance and stack reliability
- Implement algorithms for automated regulation of temperature and pressure set point tracking
- Control three zones (anode, cathode and ambient (pressure vessel) in order to minimize pressure differentials across stack components
Test Objectives
• Establish performance of SOFC stack at ambient pressure
• Demonstrate enhanced performance at elevated pressure with air
- Examine effects of pressure (up to 45 psia) on voltage and efficiency- Monitor any gas leakage as a function of operating pressure
• Extend pressurized testing to include oxygen as the oxidant
Elevated Pressure Operation

13Distribution Statement A - Approved for public release; distribution is unlimited
Test Facility
• Air Independent Propulsion (AIP) test facility at NUWCDIVNPT for long duration testing of electrical energy sections for UUVs
– High and low temperature fuel cells– Pressurized fuel cell testing– Motors/Power electronics– Engines/Power systems (Stirling)– Reactant delivery systems
Test Cells
Remote operation from central control room

14Distribution Statement A - Approved for public release; distribution is unlimited
Pressure Vessel
• Carbon steel pressure vessel (50-in ID) rated to 150 psig at 250oC
• ASME-rated relief valve (0.5-in ID )- Protects integrity of the pressure vessel (PV) - Will not re-close once it has opened
• Supplemental relief valves (0.25-in ID)- Installed on anode inlet, cathode inlet and PV- Pre-set for each specific test to prevent over-pressurization
• Equilibar® back pressure regulators - Installed on the exhaust of each pressurized zone (anode, cathode
and PV)- Automatically open in case of abort condition or power loss
• Gas flow - Capacity up to 700 SLPM total flow in- Gas composition sampled via mass spectrometer (MS)
• Temperature monitored in process lines and pressure vessel

15Distribution Statement A - Approved for public release; distribution is unlimited
Pressure Vessel Schematic
SOFC
Insulation
Pressure Vessel
150 psigrelief
Anode inCathode in
ASME
AnodeCondenser
PV in
PV exhaust
Back Pressure Regulator
Cathode exhaust
Anode exhaust
50 psig relief
Dome LoadRegulator
Key:

16Distribution Statement A - Approved for public release; distribution is unlimited
AnodeCondenser DAQ/
Control
Loadbank
Mass Spectrometer
HotZone
GasPreheater Exhaust
Lines
• 50” ID carbon steel pressure vessel rated to 150 psig at 250oC• Hot box consisting of four heating elements constructed around stack• Inline heaters for preheating anode and cathode reactant gases• Gas sampling at 7 locations via mass spectrometer
• Voltage monitoring of individual cells
Pressurized SOFC Test Stand

17Distribution Statement A - Approved for public release; distribution is unlimited
Mass Spectrometer Sampling
Capillaries for processes:
< 30 psi: 0.010” ID x 1/16” OD
30 psi < P < 50 psi: 0.007” ID x 1/16” OD
Capillary sampling lines:• anode in• anode out• cathode in• cathode out• pressure vessel
Gas sampling of up to 7 locations is possible

18Distribution Statement A - Approved for public release; distribution is unlimited
Delphi Gen IV Stack
• Number of cells: 10
• Individual cell area: 403 cm2
• Stack Assembly- Laser-welded cassette- Glass ceramic seals- Stainless steel manifold- Co-flow gas design
• Test conditions- Gases:
Anode xH2 = 0.5, xN2 = 0.5 (dry)Cathode air / oxygen
- Pressure: 1 to 3 atm
• Power output : 1.75 kW (240 A, 7.3 V) at 50% fuel utilization at 700oC with all zones at 45 psia

19Distribution Statement A - Approved for public release; distribution is unlimited
Ambient Test Results
• Tests performed by Delphi prior to stack delivery and data provided to NUWC
- Constant Current hold- Fuel utilization sweep- Polarization curve
• NUWC started operations by ramping current to 240 A, reaching an operating power level of 1.7 kW
• Current lowered and held at 140 A
• Stack temperature limited by inlet gas preheating
- Lower air flows used to keep higher inlet gas temperatures
- Lower stack temperature while under a load resulted in lower voltage
- Stack temperature largely dependent on internal heat generation from load
560 570 580 590 600 610 620 630 6407.8
7.9
8
8.1
8.2
8.3
8.4
8.5
Time (min)St
ack
Volta
ge (V
)
NUWCDelphiT1=742oCT1=741oC
T1=670oCT1=672oC
Constant Current hold at 140 A

20Distribution Statement A - Approved for public release; distribution is unlimited
Ambient Test Results
0.3 0.4 0.5 0.6 0.7 0.8 0.90.6
0.65
0.7
0.75
0.8
Fuel Utilization
Avg.
Cel
l Vol
tage
(V)
NUWCDelphi
T1=676oC
T1=659oC
T1=651oCT1=753oC
T1=745oCT1=740oC
0 50 100 150 2000.6
0.7
0.8
0.9
1
1.1
1.2
1.3
Stack Current (A)
Avg.
Cel
l Vol
tage
(V)
NUWCDelphi
T1=666oC
T1=661oC
T1=651oC
T1=743oCT1=731oC
T1=727oC
• 50% H2: 50% N2 flow lowered under constant 180 A load and constant air flow
- Results were comparable with offset due to lower operating temperature- Lower flow resulted in increase fuel utilization and stack heating
• Polarization curve collected from 240 A decreasing 10 A per 30 sec
- Temperature change is inherent in SOFC polarization, but larger changes than expected were due to lower inlet temperature and flows

21Distribution Statement A - Approved for public release; distribution is unlimited
Pressurized Test Results
0 20 40 60 80 100 120 1400.7
0.8
0.9
1
1.1
1.2
1.3
1.4
Stack Current (A)
Avg.
Cel
l Vol
tage
(V)
45 psia30 psia
0 20 40 60 80 100 120 1400.7
0.8
0.9
1
1.1
1.2
1.3
1.4
Stack Current (A)
Avg.
Cel
l Vol
tage
(V)
45 psia35 psia
Air Oxygen
Tavg=737oC
Tavg=728oC
Tavg=709oC
Tavg=742oCTavg=734oC
Tavg=719oC
Tavg=757oCTavg=750oC
Tavg=742oC
Tavg=743oC
Tavg=757oC
Tavg=753oC
• Pressurized polarization curves collected after pressurization to 45 psia while held at 140 A and constant fuel and oxidant flows
• Higher pressure resulted in higher voltage (efficiency), even with a lower stack temperatures
• Temperature decreased with increase in pressure due to increase in gas density and specific heat, resulting in an increased cooling effect from the reactant gases
Problem with Cell 6

22Distribution Statement A - Approved for public release; distribution is unlimited
15 20 25 30 35 40 45 500.77
0.775
0.78
0.785
0.79
0.795
0.8
0.805
0.81
Pressure (psia)
Avg.
Cel
l Vol
tage
(V)
Δ Tavg= -2Co
ΔTavg= -3Co
Tavg=753oC
Δ Tavg= -2Co
P (psia) 15-20 20-25 25-30 30-35 35-40 40-45 TotalΔε (%) 0.64 0.48 0.16 0.16 0.16 0.08 1.68
15 20 25 30 35 40 45 500.82
0.825
0.83
0.835
0.84
0.845
0.85
0.855
Pressure (psia)
Avg.
Cel
l Vol
tage
(V)
Δ Tavg= -1Co
ΔTavg= -5Co
Tavg=777oC
Δ Tavg= -2Co
ΔTavg= -10Co
P (psia) 15-20 20-25 25-30 30-35 35-40 40-45 TotalΔε (%) 0.136 0.984 0.328 0.336 0.32 0.288 2.392
Pressurized Test Results
OxygenAir
• Constant current steady state operation- 140 A load, constant gas flows- Pressurized at 0.5 psi / min
• Increase in voltage even with continuous decrease in stack temperature as pressure was increased (pre-heating of reactant gases insufficient)
• 30 minute hold every 5 psi resulted in further cooling and decrease in voltage
• Largest efficiency gains over first 10 psi increase, higher gain for oxygen

23Distribution Statement A - Approved for public release; distribution is unlimited
Summary
• Delphi Gen IV 10-cell stack was tested at pressures up to 45 psiawith both air and pure oxygen
• Efficiency gain of 2.4% and 1.7% demonstrated at 45 psia for oxygen and air, respectively
• Combined efficiency gain of almost 6% was observed for oxygen at 45 psia vs. air at 15 psia
• Limitations reaching and maintaining stack temperature due to insufficient capacity of inline gas heaters
• Fuel cell technology has the potential to greatly increase endurance of UUV missions over current battery technologies
• A minimum of 10-15 thermal cycles will make SOFCs economically competitive with Li-based battery systems

24Distribution Statement A - Approved for public release; distribution is unlimited
Acknowledgements
National Energy Technology Laboratory (NETL)
Office of Naval Research (ONR)
Delphi Corporation
Dr. A. Alan Burke (Chemours)

25Distribution Statement A - Approved for public release; distribution is unlimited
Efficiency = f (i, T, P, utilizations, reactant feeds, stack materials; significant increase in performance occurs at 3 to 4 atmRelative Efficiency Gain• Calculated by comparing operating voltage at elevated pressure vs. ambient pressure• Difficult to make comparisons of stacks with different designs and operating
conditionsAbsolute Efficiency Gain• Voltage gain vs. total fuel value entering the system• Equate voltage to Lower Heating Value (LHV) of hydrogen (-241.8 kJ/mol)
ELHV = -∆HLHV / nF = 1.25 V
• Gross SOFC efficiency (ε) with reference to LHV (H2) ε = Vcell / 1.25V * 100%
• Absolute efficiency gain (∆ε)∆ε = ∆Vcell / 1.25 V * 100%
where ∆Vcell is the pressure-induced voltage change
Efficiency Calculation