prevalence and associated factors of stunting and thinness
TRANSCRIPT

Kebede et al. J Health Popul Nutr (2021) 40:44 https://doi.org/10.1186/s41043-021-00269-4
RESEARCH ARTICLE
Prevalence and associated factors of stunting and thinness among adolescent students in Finote Selam Town, Northwest EthiopiaDamitie Kebede1,2* , Reddy P. C. J. Prasad1, Degnet Teferi Asres1, Hayat Aragaw1 and Eyerusalem Worku1
Abstract
Background: Undernutrition among adolescents is a major public health problem in developing nations including Ethiopia. Adolescents need to have good-quantity and good-quality nutrients to cope with this rapid growth and other health risks which increase nutritional demand. This study aimed to assess the prevalence and associated factors of stunting and thinness among school adolescents in Finote Selam Town, Northwest Ethiopia.
Methods: A school-based cross-sectional study among adolescent students aged 10–19 in public schools was car-ried out in Finote Selam Town from February 5 to March 27, 2018. A total of 397 school adolescents were included in this study. Stratified and simple random sampling techniques were employed to select study subjects. Pretested structured questionnaires were used to collect the data. Data were entered using Epi info version 7 and analyzed using SPSS version 20 and WHO AnthroPlus software. A multivariable logistic regression analysis was employed to identify factors associated with stunting and thinness. Crude and adjusted odds ratios with 95% level significance were used to measure the strength of association, and statistical significance was declared at a P value less than 0.05.
Results: The prevalence of stunting and thinness among school adolescents was 21.8% and 16.9%, respectively. About 9.7% of school adolescents experienced both stunting and thinness. Being male (P = 0.031), coming from rural area (P = 0.046), having a family monthly income of less than $28.37 (P = 0.044) and having less than four dietary diversity (P = 0.021) were significantly associated with stunting. Early adolescent stage (P = 0.034), being male ado-lescent students (P = 0.37), having a family monthly income of less than $28.37 (P = 0.016), having a family monthly income between $28.37 and $56.74 (P = 0.021) (35.25 Birr = 1 USD) and using well water (P = 0.045) were significantly associated with thinness.
Conclusion: Undernutrition was a predominant problem in the study area. Sex, age, place of residence, dietary diversity, sources of drinking water and family monthly income were important factors associated with stunting and thinness among the respondents. Strategies to improve the nutritional status of adolescent students should be given much attention.
Keywords: Adolescent students, Anthropometry, Stunting, Thinness, Ethiopia
© The Author(s) 2021. Open Access This article is licensed under a Creative Commons Attribution 4.0 International License, which permits use, sharing, adaptation, distribution and reproduction in any medium or format, as long as you give appropriate credit to the original author(s) and the source, provide a link to the Creative Commons licence, and indicate if changes were made. The images or other third party material in this article are included in the article’s Creative Commons licence, unless indicated otherwise in a credit line to the material. If material is not included in the article’s Creative Commons licence and your intended use is not permitted by statutory regulation or exceeds the permitted use, you will need to obtain permission directly from the copyright holder. To view a copy of this licence, visit http:// creat iveco mmons. org/ licen ses/ by/4. 0/. The Creative Commons Public Domain Dedication waiver (http:// creat iveco mmons. org/ publi cdoma in/ zero/1. 0/) applies to the data made available in this article, unless otherwise stated in a credit line to the data.
BackgroundMalnutrition is a major public health problem in both developed and developing nations. Adolescents resid-ing in developing nations, however, suffer more from
Open Access
*Correspondence: [email protected] Department of Applied Human Nutrition, Faculty of Chemical and Food Engineering, Bahir Dar Institute of Technology, Bahir Dar University, P O Box,79, Bahir Dar, EthiopiaFull list of author information is available at the end of the article

Page 2 of 12Kebede et al. J Health Popul Nutr (2021) 40:44
undernutrition [1]. In many developing countries, under- and over-nutrition occur simultaneously. This phenom-enon is referred to as the double burden of malnutrition [2]. Both UN and WHO define adolescence as a segment of the population group age from 10 to 19 years old; it is a transition from childhood to adulthood period that has intense physical, psychosocial and cognitive develop-ment. During this period, the final growth spurt occurs; particularly, early adolescence after the first year of life is the critical period of rapid physical growth and changes in body composition, physiology and endocrine. Up to 45% of skeletal growth takes place, and 15–25% of adult height is achieved during adolescence. During the growth spurt of adolescence, up to 37% of total bone mass may be accumulated. Regarding body composition change, girls begin to store fat around the breast, hips and upper arm, but boys start losing fat and develop muscle [3]. Adolescence is a time of changing lifestyles and food hab-its, changes that affect both nutrient needs and intake [4]. So, it is an opportunity to shape this new behavior adop-tion [5].
Our world is home to 1.8 billion (24.66%) young peo-ple between the ages of 10 and 24, and the youth popula-tion is growing fastest in the poorest nations; currently, adolescents make up roughly 20% of the global popula-tion [6]. In developing countries, adolescents have higher numbers, about 85% of the demographic age stage, for instance, roughly 26% in Salvador, compared to 14% in the USA [7]. Similarly, in Ethiopia, children and adoles-cents make up around 48% of the Ethiopian population with adolescents constituting 25% [8].
Pocket studies showed a prevalence of thinness among adolescents, ranging from 19.7% to 83% [9–11], stunting of 16% to 28.5% [11], and overweight or obesity of 2.0% to 16.7% [12, 13] 0.26–30. Gender, age, residence and edu-cational status of the adolescent as well as their parents, age of the child, household wealth index and family size were the most commonly reported socioeconomic deter-minants in the above studies [12, 14–16].
Most of the worst-performing zones in Ethiopia were found in Amhara region. This could be because the households lack knowledge, attitude and practices (KAP) on how to feed their children and themselves. In this region, it is a common practice to sell more nutritious food items such as legumes (beans, peas and chickpeas), sheep, goat, cattle, milk and milk products since they earn better income by selling these agricultural prod-ucts rather than feeding these nutritious food items to their children [17, 18]. West Gojjam zone has a high potential in agriculture production like irrigation, par-ticularly fruits and vegetables in addition to livestock and crop production [19, 20]. Finote Selam is the center of the market, and there is a surplus availability of fruits
and vegetables. However, there was no study report on nutritional status in the study area. This study will serve as a baseline for further study, important for designing an intervention, and guide policymakers and develop-ment planners. This study was mainly focused on assess-ing the prevalence and various determinants of stunting and thinness among school adolescents in Finote Selam Town, Northwest Ethiopia.
MethodsStudy design and areaThe study design was a school-based, cross-sectional study among adolescent students aged 10–19 in public primary and secondary schools. The study was carried out from February 5 to March 27, 2018, in Finote Selam Town, Ethiopia. There were six primary schools, six jun-ior schools, one high school and one preparatory school in Finote Selam Town. The total number of students from grades 5–12 was 12,289 [21].
The source and Study PopulationAll adolescent students (10–19) in Finote Selam Town schools were the source population. Randomly selected adolescent students (10–19) in Finote Selam Town schools were the study population.
Sample size and sampling procedureThe sample size was calculated using single population proportion formula with the assumptions of the preva-lence of thinness among school-going adolescents of Mekelle City, Northern Ethiopia, being 37.8% [22] at a 95% confidence level and 5% margin of error adding 10% as a contingency for non-response rate.
where n = sample size, Z = Z-score at 95%, CI = 1.96, p = 37.8%, d = marginal error = 0.05, n = (1.96)2 * 0.378(1–0.378) = 3.8416 * 0.378*0.622 = 361, (0.05)2(0.05)2.
By adding 10% non-response rate, the minimum sam-ple size required to estimate the prevalence of stunting and thinness and its associated factors among adolescent students was 361 + 10% (361 + 36) = 397.
To obtain the sample, a stratified random sampling technique was used. The schools were stratified into pri-mary schools, junior schools, high school and prepara-tory school. Three primary schools, namely Bata, Bakel and Efrata, and three junior schools, namely Edgetber, Bata and Bakel, were selected using simple random sam-pling from six primary schools and six junior schools, respectively, whereas a high school, namely Finote Selam Secondary School, and a preparatory school, namely
n =
( z
d
)2
xP(1− p)

Page 3 of 12Kebede et al. J Health Popul Nutr (2021) 40:44
Damot Preparatory School, were selected purposively since one high school and one preparatory school were present in Finote Selam Town. The total sample size was distributed proportionally to the schools. The sam-pling frame was the students’ identification number in their respective schools. The number of students to be included in the study was determined by a simple ran-dom sampling method.
Data collectionTo generate the data set used in this study, pretested structured questionnaires were used to collect data by trained data collectors. Explanatory variables were selected after conducting a detailed literature review from the related articles to collect data on the socio-demographic, nutritional and health-related variables [22–24]. Each student was interviewed to obtain infor-mation on socio-demographic, nutritional and health-related characteristics of the adolescents’ family.
Anthropometric data were collected by trained data collectors who were health extension workers, and the overall activity was coordinated by the investigator. The age of the adolescents was derived from the school reg-ister. Height and weight were measured using a stadiom-eter and Seca digital scale (Seca Germany), respectively. The weight was recorded to the nearest 0.1 kg. It was calibrated against known weight regularly. Before the real anthropometric data collection, a standardization exer-cise was performed during the training to capture the technical error of measurement. During the procedure, the subjects wore light clothes and took off their shoes. Height was measured in cm using a portable stadiometer. The height was recorded to the nearest 0.1 cm. The same measure was employed for a given anthropometric meas-urement to avoid variability.
Data quality control and managementTo ensure the reliability and validity of the study, training was given for the data collectors, the data collection was done by two health extension workers, and closed follow-up was done by the investigator during data collection. The data collectors and investigators participated in the pretesting and standardization of the questionnaires. Problems highlighted during the preliminary study were corrected before the start of the actual survey. Each ques-tion was properly coded; continuous supervision was done during the pretest and data collection period by the investigator. Completeness and consistency of recording on the questionnaire sheets were evaluated by the inves-tigator at the end of each working day so that correction measures were taken for the next time.
Data analysesSocio-demographic, anthropometric, nutrition and health-related data were entered into the EPI Info ver-sion 7 and checked for completeness and consistency, followed by data cleaning and editing on EPI Info. Then, the data were analyzed by using SPSS (Statisti-cal Package for Social Sciences), Version 20 software. WHO AnthroPlus software was used for assessing the growth of adolescents [25]. Descriptive statistics using frequencies and proportions were used to present the study results. For anthropometric data analysis, if the height-for-age Z-score is below minus two standard deviations (− 2 SD) from the median of the reference population, then the child is considered as stunted, and if the BMI-for-age Z-score is below minus two standard deviations (− 2 SD) from the median of the reference population, then the child is thin. Dietary Diversity Score was measured by counting the food items con-sumed within the previous 24 h and was categorized as poor (consumed < 4 food groups) and good dietary diversity scores (consumed ≥ 4 food groups) [26].
The odds ratio with a 95% confidence interval was used for checking the strength of associations between the outcome variables and independent variables. Bivariate logistic regression was performed, and a vari-able with a P value of less than 0.25 was transported into a multivariable binary logistic regression analysis to identify the determinants of undernutrition of school adolescents. Finally, variables with P values < 0.05 in the multivariable logistic regression model were taken as statistically significant [27].
ResultsSocio‑demographic characteristics of study participants and their FamilyFrom a total of 397 adolescent students who were selected as a sample, with a 100% response rate, 397 study participants were involved in this study. Among these, 47 (11.8%) were early adolescents, 151 (38.0%) were mid-adolescents and 199 (50.1%) were late ado-lescents. Males constituted 249 (62.7%), whereas females constituted 148 (37.3%). Of the participants, 108 (27.2%) were from primary schools, 132 (32.2%) were from junior schools, 116 (29.2%) were from high school and others 41(10.3%) were attending prepara-tory school. Of the total participants, 195 (49.1%) were from urban areas, whereas 202 (50.9%) were from rural areas. Regarding the family size, 173 (43.6%) and 224 (56.4%) were < 5 family members and ≥ 5 family mem-bers, respectively. From the total participants, 257 (64.7%) had functional latrine, whereas 140 (35.3%) did not have a functional latrine.

Page 4 of 12Kebede et al. J Health Popul Nutr (2021) 40:44
Anthropometric resultsThe minimum and maximum heights of study sub-jects were 127.50 cm and 186.70 cm, respectively. The mean ± SD overall height of the participants was 158 ± 10.67 cm. Similarly, the minimum and maximum weights of study participants were 20.5 kg and 68 kg, respectively. The mean ± SD overall weight of the par-ticipants was 45.99 ± 10.09 kg. The mean heights of boys and girls were 158.99 ± 12.24 cm and 156.31 ± 6.94 cm, respectively. Similarly, the mean weights of boy and girl adolescents were 45.1 ± 10.97 kg and 47.53 ± 8.17 kg, respectively. The mean age of the study participants was 15.54 years (15.54 ± 2.41 SD).
Prevalence of thinnessThe overall prevalence of stunting and thinness among school adolescents at Finote Selam Town was 21.8% and 16.9%, respectively. About 9.7% of school adolescents presented with both stunting and thinness.
The mean Z-score of height-for-age was − 1.02 which revealed the distribution of HAZ (Fig. 1).
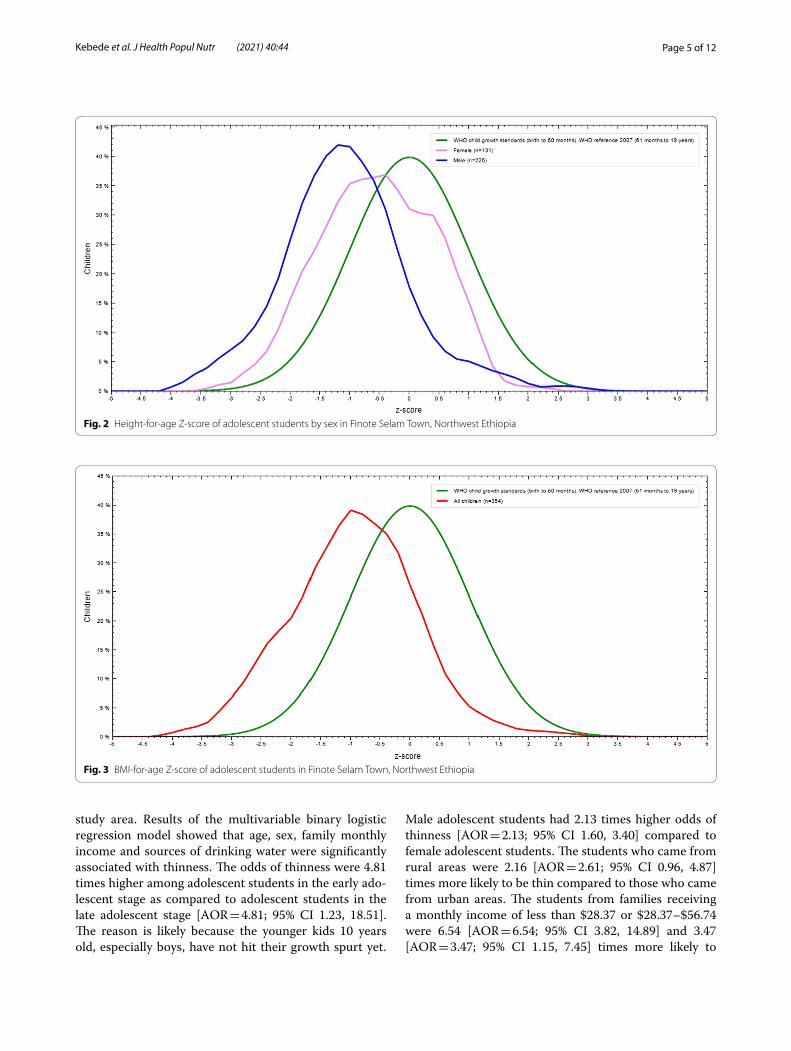
The mean Z-scores of height-for-age among boys and girls were -1.07 and -0.64 that showed the distribution of HAZ, respectively (Fig. 2).
The mean Z-score of BMI-for-age of all adolescents was -1.13 which revealed the distribution of BAZ (Fig. 3).
The mean Z-scores of BMI-for-age among boys and girls were -1.29 and -0.51 that showed the distribution of BAZ, respectively (Fig. 4).
Factors associated with stunting and thinnessAssociated factors of stuntingIdentifying determinants associated with stunting is important to take nutritional intervention in the study area. The results revealed that sex, place of residence, family monthly income and dietary diversity were sig-nificantly associated with stunting. The results of the adjusted analysis showed that students in the early and middle adolescence were 2.34 [AOR = 2.34; 95% CI 0.81, 6.78] and 2.01 [AOR = 2.01; 95% CI 0.87, 4.61] times more likely to be stunted as compared to late adolescent students, respectively. Male students were 2.27 times more likely to be stunted compared to female students [AOR = 2.66; 95% CI 1.32, 8.13]. The students who came from rural areas were 2.38 times more likely to be stunted compared to urban students [AOR = 2.38; 95% CI 109, 5.18]. The students from families receiving a monthly income of less than $28.37 or $28.37 -$56.74 were 2.61 [AOR = 2.61; 95% CI 1.04, 6.50] and 1.23 [AOR = 1.23; 95% CI 0.45, 3.38] times more likely to be stunted com-pared to families making over $56.74 per month, respec-tively. The students who had less than four dietary diversity were 2.61 [AOR = 2.61; 95% CI 1.04, 6.50] times more likely to be stunted compared to the students who had greater than four dietary diversity (Table 1).
Associated factors of thinnessExploring determinants associated with thinness is important to take nutritional intervention action in the
Fig. 1 Height-for-age Z-score of adolescent students in Finote Selam Town, Northwest Ethiopia
Page 5 of 12Kebede et al. J Health Popul Nutr (2021) 40:44
study area. Results of the multivariable binary logistic regression model showed that age, sex, family monthly income and sources of drinking water were significantly associated with thinness. The odds of thinness were 4.81 times higher among adolescent students in the early ado-lescent stage as compared to adolescent students in the late adolescent stage [AOR = 4.81; 95% CI 1.23, 18.51]. The reason is likely because the younger kids 10 years old, especially boys, have not hit their growth spurt yet.
Male adolescent students had 2.13 times higher odds of thinness [AOR = 2.13; 95% CI 1.60, 3.40] compared to female adolescent students. The students who came from rural areas were 2.16 [AOR = 2.61; 95% CI 0.96, 4.87] times more likely to be thin compared to those who came from urban areas. The students from families receiving a monthly income of less than $28.37 or $28.37–$56.74 were 6.54 [AOR = 6.54; 95% CI 3.82, 14.89] and 3.47 [AOR = 3.47; 95% CI 1.15, 7.45] times more likely to
Fig. 2 Height-for-age Z-score of adolescent students by sex in Finote Selam Town, Northwest Ethiopia
Fig. 3 BMI-for-age Z-score of adolescent students in Finote Selam Town, Northwest Ethiopia

Page 6 of 12Kebede et al. J Health Popul Nutr (2021) 40:44
be thin compared to families making over $56.74 per month, respectively. Students from households that used well water as their main source of water were 3.82 times more likely to be at risk of being thin than students from households that used tap water supply for human con-sumption [AOR = 3.82; 95% CI 1.46, 10.04] (Table 2).
DiscussionIn this study, the nutritional status and associated factors among school adolescents in Finote Selam Town, North-west Ethiopia, were assessed. This study revealed that the prevalence of stunting among adolescent students at Finote Selam Town was 21.8% which was higher than the results documented in Jimma Zone, Southwest Ethio-pia (16%) [27], in Tehuledere District, Northeast Ethio-pia (15.5%) [28], and Addis Ababa (7.2%) [13], but lower than the finding reported in Wukro, Northern Ethiopia (28.5%) [23]. This could be because the households lack knowledge, attitude and practices (KAP) on how to feed their children and themselves [29]. Several studies in other African countries including Burkina Faso (12%) [30] and Mongolia (15.6%) [31] had reported a lower prevalence of stunting. Although the feeding practices for children in Ethiopia are generally poor, the complemen-tary feeding practices are worse in Amhara region than in other parts of Ethiopia as a whole [32]..
The prevalence of thinness was 14.9% and lower than the studies in Mekelle City (37.8%) [9], Ambo City (27.5%) [33], Wukro District (26.1%) [23] and Jimma Zone (80.8%) [34], however, higher than the study con-ducted in Addis Ababa (6.2%) [9]. This divergence might
be due to differences in socioeconomic background, die-tary habits and type of meals among the cities. Findings in other African countries including Burkina Faso (13.7% [35], Asembo and Mumias, Kenya (15.6%) [36], Tunisia (13.0%) [37], and Tamale Metropolis, Ghana (10.0%) [38]. This divergence might be because in this region, it is a common practice to sell more nutritious food items such as legumes (beans, peas and chickpeas), sheep, goat, cat-tle, milk and milk products since they earn better income by selling these agricultural products rather than feeding these nutritious food items to their children [39].
Among the factors considered in this study, sex, place of residence, dietary diversity and family monthly income were associated with stunting. Male students were 2.27 times more likely to be stunted compared to female stu-dents, because male puberty hit later than female. Female puberty usually starts between ages 9 and 11. In males, puberty usually starts around age 11 [40]. This find-ing was supported by the result of similar studies con-ducted in Wukro, Northern Ethiopia [23] Chiro Town, West Hararge [41] and Tehuledere District, Northeast Ethiopia [28]. The increased risk for stunting seen among males in this study suggests that males may experience greater exposure to risks for chronic undernutrition. It appears possible that these earlier gender differences in stunting are persisting into adolescence. This compensa-tory growth may be occurring later in males since they undergo puberty later than females [42]. The students who came from rural areas were 2.38 times more likely to be stunted compared to urban students. This finding was similar to the finding in Wukro [23] and Adwa town,
Fig. 4 BMI-for-age Z-score of by sex of adolescent students in Finote Selam Town, Northwest Ethiopia

Page 7 of 12Kebede et al. J Health Popul Nutr (2021) 40:44
Table 1 Bivariate and multivariable logistic regression of factors associated with stunting among adolescent school students, Finote Selam Town, Amhara region, Ethiopia, 2018
Variables Stunting COR, 95% CI AOR, 95% CI P value
Yes No
Age‑‑groupEarly adolescent (10–13) 12 (20.7%) 46 (79.3%) 2.75 (1.12, 6.77) 2.34 (0.81, 6.78)
Mid-adolescent (14–16) 20 (11.8%) 150 (88.2%) 1.75 (0.85, 3.62) 2.01(0.87, 4.61)
Late adolescent (17–19) 13 (7.8%) 156 (86.7%) 1 1
SexFemale 31 (20.5%) 120 (79.5%) 1 1
Male 66 (26.8%) 180(73.2%) 2.67 (1.41, 7.58) 2.27 (1.32, 8.13)* 0.031
GradeGrade 5–6 17 (15.5%) 93 (84.5%) 1.96 (0.62, 6.14) 1.17 (0.39, 3.54)
Grade 7–8 23 (18.7%) 100 (81.3%) 1.63 (0.57, 4.68) 1.56 (0.44, 5.51)
Grade 9–10 12 (11.4%) 93 (88.6%) 0.70 (0.21, 2.36) 0.68 (0.21, 2.28)
Grade 11–12 11 (18.6%) 48 (81.4%) 1 1
ReligionMuslim 15 (37.5%) 25 (62.5%) 1 1
Orthodox 62 (17.4%) 295 (82.6%) 2.10 (0.66, 6.65) 2.54 (0.72, 8.94)
Place of residenceUrban 36 (18.3%) 161 (81.7%) 1 1
Rural 56 (28.0%) 144 (72.0%) 2.41 (1.21, 4.80) 2.38 (1.09, 5.18)* 0.046
Father’s educationIlliterate 16 (18.0%) 73 (82.0%) 3.19 (0.30, 3.66) 1.84 (0.61, 5.55)
Read and write 16 (16.0%) 84 (84.0%) 1.59 (0.53, 4.77) 1.48 (0.16, 13.79)
Primary school (1–8) 10 (20.0%) 40 (80.0%) 1.47 (0.40, 5.46) 1.31 (0.20, 8.41)
Secondary school (9–12) 12 (13.0%) 80 (87.0%) 1.35 (0.21, 8.83) 1.12 (0.35, 3.60)
College and above 9 (13.6%) 57 (86.4%) 1 1
Mother’s educationIlliterate 16 (16.8%) 79 (83.2%) 1.95 (0.22, 17.05) 1.50 (0.50, 4.54)
Read and write 17 (16.0%) 89 (84.0%) 1.88 (0.23, 15.56) 1.44 (0.48, 4.28)
Primary school (1–8) 9 (19.1%) 38 (80.9%) 1.84 (0.18, 18.91) 1.11 (0.28, 4.43)
Secondary school (9–12) 12 (13.5%) 77 (86.5%) 1.79 (0.19, 17.07) 1.03 (0.32, 3.34)
College and above 9 (15.0%) 51 (85.0) 1 1
Father’s occupationDaily laborer 13 (19.7%) 53 (80.3%) 1.35 (0.43, 4.27) 1.23 (0.46, 3.22)
Merchant 19 (15.7%) 102 (84.3%) 1.21 (0.53, 2.76) 1.13 (0.31, 4.05)
Farmer 14 (16.1%) 73 (83.9%) 1.11 (0.45, 2.79) 1.10 (0.36, 3.45)
Governmental/NGOemployee
17 (13.8%) 106 (86.2%) 1 1
Mother’s occupationDaily laborer 6 (46.2%) 7 (53.8%) 6.57 (0.93, 46.23) 8.16 (0.85, 78.30)
House wife 19 (23.0%) 68 (77.0%) 2.16 (0.82, 5.68) 2.48 (0.85, 7.27)
Farmer 17 (15.9%) 90 (84.1%) 1.49 (0.56, 3.94) 1.84 (0.54, 6.30)
Merchant 10 (9.4%) 96 (90.6%) 0.64 (0.21, 1.99) 0.67 (0.19, 2.30)
Governmental/NGOemployee
11 (13.1%) 73 (86.9%) 1 1
Family size < 5 30 (16.4%) 153 (83.6%) 1 1
≥ 5 56 (26.2%) 158 (73.8%) 1.38 (0.65, 2.92) 1.01 (0.53, 1.93)
Family monthly income < $28.37 29 (32.6%) 60 (67.4%) 4.07(1.92, 8.64) 2.61 (1.04, 6.50)* 0.044

Page 8 of 12Kebede et al. J Health Popul Nutr (2021) 40:44
Northern Ethiopia [43]. However, ample evidence docu-ments that urban children generally have better nutri-tional status than their rural children. The environment, choices and opportunities of urbanites differ greatly from those of rural dwellers’ from employment condi-tions to social and family networks to access healthcare and other services [44]. This association might also be related to differences in dietary practices, where rural diets are predominantly cereal-based, as well as lower literacy rates and limited access to water, sanitation and hygiene facilities in rural areas [45]. The students from families receiving a monthly income of less than $28.37 or $28.37–$56.74 were 2.61and 1.23 times more likely to be stunted compared to families making over $56.74 per month, respectively. This is due to underlying rea-son of less affordability of healthcare, quality nutrition and hygiene rather than rich families [46]. The possible reason is also due to the positive correlation between income level and nutrition status of adolescents; higher income could mean a stronger purchasing power for bet-ter-quality foods, while limited income restricts access to nutrient-dense foods [47]. The odds of stunting was 2.61 times higher among adolescent students who had a score of < 4 dietary diversity compared to adolescent students
who reported greater than or equal to four dietary diver-sity. This finding is supported by the study conducted in Adama City, Ethiopia [48]. This is because when the intake of dietary diversity is high, adolescents receive adequate energy and important nutrients that play an integral role in growth and development [49].
According to the multivariable logistic regression analysis, sex, age, sources of drinking water and family monthly income were significantly associated with thin-ness. The odds of thinness was 4.81 times higher among adolescent students in the early adolescent age stage as compared to adolescent students in the late adolescent age stage. This finding was in agreement with findings from Adwa Town, Northern Ethiopia [50], and commu-nity-based nutrition implementing districts, Amhara region, Ethiopia [51]. The possible reason is increased growth spurt in the early adolescent stage as compared to the late adolescent stage [43]. Also, the scarcity of information on nutritional status during middle child-hood and early adolescence is particularly remarkable [52]. On the other hand, as age increases, adolescents become more matured. Male adolescent students had 2.13 times higher odds of thinness compared to female adolescent students. This study was in line with the
Table 1 (continued)
Variables Stunting COR, 95% CI AOR, 95% CI P value
Yes No
$28.37 -$56.74 20 (18.3%) 89 (81.7%) 1.28 (0.53, 3.07) 1.23 (0.45, 3.38)
> $56.74 25 (12.6%) 174 (87.4%) 1 1
Dietary diversity < 4 44 (15.5%) 239 (84.5%) 4.07(1.92, 8.64) 2.61 (1.04, 6.50)* 0.021
≥ 4 19 (16.7%) 95 (83.3%) 1 1
Source of drinking waterSpring water 10 (30.3%) 23 (69.7%) 2.25 (0.59, 8.55) 2.63 (0.59, 11.65)
Well water 27 (15.1%) 152 (84.9%) 1.52 (0.62, 3.72) 2.12 (0.67, 6.67)
Public tap water 14 (14.4%) 83 (85.6%) 1.17 (0.41, 3.31) 1.21 (0.38, 3.83)
Tap water 12 (13.6%) 76 (86.4%) 1 1
Presence of functional latrineYes 36 (14.5%) 213 (85.5%) 1 1
No 27 (18.2%) 121 (81.8%) 1.13 (0.58, 2.19) 1.08 (0.55, 2.15)
Frequency of meals eaten per dayTwo times 29 (23.4%) 95 (76.6%) 2.02 (1.04, 3.91) 1.89 (0.94, 3.81)
Three times and above 34 (12.5%) 239 (87.5%) 1 1
Illness reported in the last one monthYes 26 (19.7%) 106 (80.3%) 1.26 (0.64, 2.48) 1.18 (0.59, 2.39)
No 37 (14.0%) 228 (86.0%) 1 1
Availability of home gardenYes 38 (18.5%) 167 (81.5%) 1 1
No 39 (20.3%) 153 (79.7%) 1.41 (1.00, 1.97) 1.06 (0.70, 1.61)
AOR: adjusted odds ratio; COR: crude odds ratio; CI: confidence interval; * significant P value < 0.05; 1 = reference

Page 9 of 12Kebede et al. J Health Popul Nutr (2021) 40:44
Table 2 Bivariate and multivariable logistic regression of factors associated with thinness among adolescent school students, Finote Selam Town, Ethiopia, 2018
Variables Thinness COR (95% CI) AOR (95% CI) P value
Yes No
Age‑groupEarly adolescent (10–13) 17 (36.2%) 30 (63.8%) 5.14 (2.39, 11.08)* 4.81 (1.23, 18.51)* 0.034
Mid-adolescent (14–16) 24 (15.9%) 127 (84.1%) 1.90 (0.99, 3.64) 1.68 (0.57, 4.93)
Late adolescent (17–19) 18 (9.0%) 181 (91.0%) 1 1
SexFemale 4 (2.7%) 144 (97.3%) 1 1
Male 55 (22.1%) 194 (77.9%) 2.68 (1.88, 3.84) 2.13 (1.60, 3.40)* 0.037
GradeGrade 5–6 23 (21.3%) 85 (78.7%) 2.57 (0.91, 7.24) 1.77 (0.40, 7.87)
Grade 7–8 22 (16.7%) 110 (83.3%) 2.08 (0.74, 5.86) 1.33 (0.22, 8.19)
Grade 9–10 10 (8.6%) 106 (91.4%) 1.01 (0.32, 3.15) 1.06 (0.20, 5.58)
Grade 11–12 4 (9.8%) 37 (90.2%) 1 1
ReligionMuslim 1 (4.5%) 21 (95.5%) 1
Orthodox 58 (15.5%) 317 (84.5%) 3.82 (0.50, 29.18) 3.90 (0.19, 81.94)
Place of residenceUrban 18 (9.2%) 177 (90.8%) 1 1
Rural 41 (20.3%) 161 (79.7%) 2.44 (1.35, 4.40)* 2.16 (0.96, 4.87)
Father’s educationIlliterate 15 (15.8%) 80 (84.2%) 2.79 (0.92, 8.45) 4.06 (0.23, 71.76)
Read and write 17 (16.8%) 84 (83.2%) 1.97 (0.71, 5.43) 2.73 (0.31, 24, 29)
Primary school (1–8) 10 (24.4%) 31 (75.6%) 1.96 (0.73, 5.32) 2.36 (0.26, 21.41)
Secondary school (9–12) 11 (12.0%) 81 (88.0%) 1.44 (0.51, 4.10) 0.80 (0.5, 12.90)
College and above 6 (8.8%) 62 (91.2%) 1 1
Mother’s educationIlliterate 17 (16.7%) 85 (83.3%) 2.38 (0.77, 7.39) 1.78 (0.86, 3.65)
Read and write 16 (14.7%) 93 (85.3%) 1.86 (0.68, 5.07) 1.40 (0.83, 2.34)
Primary school (1–8) 9 (26.5%) 25 (73.5%) 1.50 (0.55, 4.09) 1.29 (0.61, 2.71)
Secondary school (9–12) 11 (12.4%) 78 (87.6%) 1.33(0.47, 3.81) 1.15 (0.66, 1.97)
College and above 6 (9.5%) 57 (90.5%) 1 1
Father’s occupationDaily laborer 8 (14.0%) 49 (86.0%) 1.20 (0.47, 3.07) 1.1 (0.55, 21)
Farmer 26 (21.8%) 93 (78.2%) 2.27 (1.12, 4.61)* 1.55 (0.45, 5.29)
Merchant 11 (12.9%) 74 (87.1%) 1.18 (0.50, 2.75%) 1.52 (0.55, 4.26)
Governmental/NGOemployee
14 (10.3%) 122 (89.7%) 1 1
Mother’s occupationDaily laborer 1 (20.0%) 4 (80.0%) 1.86 (0.19, 18.55) 2.10 (0.11, 38.74)
Farmer 21 (24.4%) 65 (75.6%) 2.74 (1.16, 6.46)* 2.16 (0.62, 7.51)
House wife 15 (12.6%) 104 (87.4%) 1.33 (0.55, 3.23) 2.46 (0.58, 10.47)
Merchant 13 (12.1%) 94 (87.9%) 1.24 (0.51, 3.04) 1.52 (0.43, 5.36)
Governmental/NGO employee 9 (11.2%) 71 (88.8%) 1 1
Family size < 5 17 (9.8%) 156 (90.2%) 1 1
≥ 5 42 (18.8%) 182 (81.2%) 2.43 (1.32, 4.45)* 1.90 (0.80, 4.51)
Dietary diversity < 4 44 (15.5.9%) 240 (84.5%) 1.36 (0.71, 2.61) 1.15 (0.67, 1.97)

Page 10 of 12Kebede et al. J Health Popul Nutr (2021) 40:44
studies conducted in Mekelle City, Northern Ethiopia [9], Jimma Zone, Southwest Ethiopia [34] and Wukro, Northern Ethiopia [23], which confirmed that males were more affected due to thinness than girls. This might be due to variation of maturation time in boys and girls, for which girls reached maturation earlier than boys. The students from families surviving on less than $28.37, or $28.37–$56.74 monthly were 6.54 and 3.47 times more likely to be experiencing thinness compared to those with family monthly income greater than $56.74. This is likely due to the positive correla-tion between income level and the nutrition status of adolescents. As income rises, families are more likely able to afford more than two times of meals per day. Finally, students from households that used well water as a main source of water were 3.82 times more likely to be at risk of being thin than students from house-holds that used tap water for human consumption. This finding was in line with findings from Adwa Town, Northern Ethiopia [43]. This might be because impure water is a vehicle for intestinal parasites, which leads to loss of appetite, and this leads to poor nutritional sta-tus. The repeated infection causes depressed immunity, meaning that the outcome and duration of the disease
is more severe and contributing to the poor nutritional status of the adolescents.
ConclusionsThe study showed that undernutrition is a prevalent problem in the study area. Consistent with this result, the mean Z-scores of height-for-age were higher in boys than girls. Sex, age, place of residence, dietary diversity, sources of drinking water and family monthly income were found to be important factors associated with stunt-ing and thinness among the respondents. Strategies to improve the nutritional status of adolescent students should be given much attention.
Limitations of the studyA limitation was the use of a cross-sectional study design which could only generate a hypothesis regard-ing the role of independent variables on the nutritional status of adolescent students but not their cause-and-effect relationships; the age of the students obtained from school records might be underestimated; there may also be measurement bias during anthropomet-ric measurements. The research also failed to explore other parental socio-demographic and socioeconomic
Table 2 (continued)
Variables Thinness COR (95% CI) AOR (95% CI) P value
Yes No
≥ 4 18 (15.9%) 95 (84.1%) 1 1
Family monthly income < $28.37 29 (37.7%) 48 (62.3%) 6.10 (3.09, 12.04)* 11.54 (3.82, 34.89)* 0.016
$28.37 -$56.74 14 (13.1%) 93 (86.9%) 1.71 (0.80, 3.64) 3.47 (1.15, 10.45)* 0.021
> $56.74 16 (7.5%) 197 (92.5%) 1 1
Source of drinking waterWell water 39 (21.3%) 144 (78.7%) 4.53 (1.71, 11.98) 3.82 (1.46, 10.04)* 0.045
Spring water 13 (12.3%) 93 (87.7%) 3.37 (0.88, 12.89) 2.56 (0.87, 7.56)
Public tap water 2 (7.7%) 24 (92.3%) 1.88 (0.23, 15.49) 1.46 (0.26, 8.09)
Tap water 5 (6.1%) 77 (93.9%) 1 1
Presence of functional latrineYes 38 (14.8%) 219 (85.2%) 1 1
No 21 (15.0%) 119 (85.5%) 1.08 (0.49, 2.38) 1.05 (0.59, 1.87)
Frequency of meals eaten per dayTwo times 19 (16.0%) 100 (84.0%) 1.17 (0.64, 2.13) 1.01 (0.53, 1.91)
Three times and above 40 (14.4%) 238 (85.6%) 1 1
Illness reported in the last one monthYes 19 (14.5%) 112 (85.5%) 1.06 (0.57, 1.96) 1.03 (0.57, 1.87)
No 40 (15.0%) 226 (85.0%) 1 1
Availability of home gardenYes 50 (17.4%) 238 (82.6%) 1 1
No 9 (8.3%) 100 (91.7%) 1.60 (1.01, 2.54) 1.15 (0.66, 1.99)
AOR: adjusted odds ratio; COR: crude odds ratio; CI: confidence interval; * significant P value < 0.05; 1 = reference

Page 11 of 12Kebede et al. J Health Popul Nutr (2021) 40:44
characteristics. BMI alone cannot show whether a per-son’s weight is healthful, but using it in combination with other indicators can provide a more complete picture.
AbbreviationsAOR: Adjusted odds ratio; BAZ: BMI-for-age Z-score; BMI: Body Mass Index; CM: Centimeter; CV: Confidence interval; COR: Crude odds ratio; CSA: Central Statistics Agency; CV: Confidence interval; EDHS: Ethiopian Demography and Health Survey; HAZ: Height-for-age Z-score; HFA: Height-for-age; SD: Standard deviation; SPSS: Statistical Package for Social Sciences; UN: United Nations; WHO: World Health Organization.
AcknowledgementsWe are thankful to adolescent students, school directors, health officers and data collectors of this study.
Authors’ contributionsDM, HA and EW have designed the study and involved in data collection, supervision and data processing. DM has cleaned and analyzed the data, as well as interpreted the results, and drafted the manuscript. RP and DA partici-pated in cleaning, analyzing and interpreting the data. DM, RP, DA, HA and EW have critically reviewed the manuscript. All authors read and approved the final manuscript.
FundingFund was not obtained for this study.
Declarations
Ethics approval and consent to participateEthical clearance was obtained from the Institutional Ethical Review Board of Faculty of Chemical and Food Engineering, Bahir Dar University. Supportive letters were obtained from Amhara Public Health Institute that wrote a letter to the West Gojjam Zone Health Office, and then the West Gojjam Zone Health Office wrote a letter to Finote Selam Town Administration Health Office. Finally, Finote Selam Town Administration Health Office wrote a letter to target schools. The majorities of students were less than 18 years and were unable to give permission. Considering this and since the question-naire did not contain sensitive issues, thorough discussions were undertaken with the school directors regarding the purpose and the contents of the data collection tool, and permission was obtained to conduct the study. Respondents were given assurances about the privacy and confidentiality of their responses. Informed oral consent was obtained from each participant to ensure their willingness to participate, and all were informed that they had the right to not participate or could withdraw from the study at any time. Confidentiality of the data was assured and kept in secret; code number was assigned to the study participants without mentioning the name; the informa-tion that was collected by the study was kept in a file and locked with a key.
Consent for publicationNot applicable.
Availability of data and materialsData will be available upon request from the corresponding author via email [email protected].
Competing interestsThe authors declare that they have no competing interests.
Author details1 Department of Applied Human Nutrition, Faculty of Chemical and Food Engineering, Bahir Dar Institute of Technology, Bahir Dar University, P O Box,79, Bahir Dar, Ethiopia. 2 College of Agriculture and Environmental Sciences, Bahir Dar University, P O Box, 5501 Bahir Dar, Ethiopia.
Received: 21 March 2019 Accepted: 10 October 2021
References 1. De Onis M, Blössner M, Borghi E. Prevalence and trends of stunt-
ing among pre-school children, 1990–2020. Public Health Nutr. 2012;15(1):142–8.
2. Tsegaye B. Assessment of acute malnutrition using transthyretin levels in blood of children under five years of age in Tikur Anbessa Specialized Hospital and Yekatit 12 Hospital, Addis Ababa. 2015
3. Bogin B, et al. Human life course biology: a centennial perspective of scholarship on the human pattern of physical growth and its place in human biocultural evolution. Am J Phys Anthropol; 2018.
4. Staff U. The state of the world’s children 2011-executive summary: ado-lescence an age of opportunity; 2011.
5. Boyle MA, Holben DH. Community nutrition in action: an entrepreneurial approach; 2012.
6. Roelen K, et al. Putting children first: new frontiers in the fight against child poverty in Africa; 2019.
7. Lin HJ, Yusoff MSB. Psychological distress, sources of stress and coping strategy in high school students. Int Med Jl. 2013;20(6):672–6.
8. Tsutsumi J, Bendewald MJ. Urban environmental challenges in develop-ing cities: the case of Ethiopian capital Addis Ababa. Int J Environ Ecol Eng. 2010;4(6):164–9.
9. Gebremariam H, Seid O, Assefa H. Assessment of nutritional status and associated factors among school going adolescents of Mekelle City, Northern Ethiopia. Int J Nutr Food Sci. 2015;4(1):118–24.
10. Berbada DA, et al. Magnitude of double burden of malnutrition and its associated factors among selected in-school adolescents: evidence from South Ethiopia. Int J Nutr Metab. 2017;9(4):30–7.
11. Melaku YA, et al. Prevalence and factors associated with stunting and thinness among adolescent students in Northern Ethiopia: a com-parison to World Health Organization standards. Arch Public Health. 2015;73(1):1–11.
12. Alemu E, et al. Prevalence of overweight and/or obesity and associated factors among high school adolescents in Arada Sub city, Addis Ababa, Ethiopia. J Nutr Food Sci. 2014;4(2):1.
13. Gebreyohannes, Y., et al., Nutritional status of adolescents in selected government and private secondary schools of Addis Ababa, Ethiopia. Adolescence. 2014; 10(11).
14. Anteneh ZA, et al. Risk factors of overweight and obesity among high school students in Bahir Dar city, North West Ethiopia: school based cross-sectional study. Advances in Preventive Medicine. 2015.
15. Davis K, et al. In-depth assessment of the public agricultural extension system of Ethiopia and recommendations for improvement. Interna-tional Food Policy Research Institute (IFPRI) Discussion Paper. 2010; 1041: 193–201.
16. Assefa H, Belachew T, Negash L. Socioeconomic factors associated with underweight and stunting among adolescents of Jimma Zone, south west Ethiopia: a cross-sectional study. International Scholarly Research Notices. 2013.
17. Kumera G, Tsedal E, Ayana M. Dietary diversity and associated factors among children of Orthodox Christian mothers/caregivers during the fasting season in Dejen District, North West Ethiopia. Nutr Metab. 2018;15(1):16.
18. Bantamen G, Belaynew W, Dube J. Assessment of factors associated with malnutrition among under five years age children at Machakel Woreda, Northwest Ethiopia: a case control study. J Nutr Food Sci. 2014;4(1):1.
19. Tenagne A, Mekuriaw G, Kumar D. Phenotypic characterization of indigenous cattle populations in West Gojjam Administrative Zones, Amhara National Regional State, Ethiopia. J Life Sci Biomed (JLSB). 2016;6(6):127–38.
20. Motbainor A, Worku A, Kumie A. Level and determinants of food insecurity in East and West Gojjam zones of Amhara Region, Ethiopia: a community based comparative cross-sectional study. BMC Public Health. 2016;16(1):503.
21. FTEO. Finoteselam Education Office. 2017.

Page 12 of 12Kebede et al. J Health Popul Nutr (2021) 40:44
• fast, convenient online submission
•
thorough peer review by experienced researchers in your field
• rapid publication on acceptance
• support for research data, including large and complex data types
•
gold Open Access which fosters wider collaboration and increased citations
maximum visibility for your research: over 100M website views per year •
At BMC, research is always in progress.
Learn more biomedcentral.com/submissions
Ready to submit your researchReady to submit your research ? Choose BMC and benefit from: ? Choose BMC and benefit from:
22. Birru SM, Tariku A, Belew AK. Improved dietary diversity of school adoles-cent girls in the context of urban Northwest Ethiopia: 2017. Ital J Pediatr. 2018;44(1):48.
23. Melaku YA, et al. Prevalence and factors associated with stunting and thinness among adolescent students in Northern Ethiopia: a com-parison to World Health Organization standards. Arch Public Health. 2015;73(1):44.
24. Mohammed AY, Tefera TB. Nutritional status and associated risk factors among adolescent girls in Agarfa high school, Bale Zone, Oromia Region, South East Ethiopia. Int J Nutr Food Sci. 2015;4(4):445–52.
25. Organization WH. WHO AnthroPlus for personal computers manual. Geneva: World Health Organization; 2007.
26. Swindale A, Bilinsky P. Household dietary diversity score (HDDS) for meas-urement of household food access: indicator guide. Washington, DC: Food and Nutrition Technical Assistance Project, Academy for Educational Development; 2006.
27. Hosmer D, Lemeshow S. Applied logistic regression. 2nd ed. New York: Wiley; 2000.
28. Woday A, Menber Y, Tsegaye D. Prevalence of and associated factors of stunting among adolescents in Tehuledere District, North East Ethiopia, 2017. J Clin Cell Immunol. 2018;9(2):546.
29. Khan S, Zaheer S, Safdar NF. Determinants of stunting, underweight and wasting among children< 5 years of age: evidence from 2012–2013 Paki-stan demographic and health survey. BMC Public Health. 2019;19(1):1–15.
30. Daboné C, Delisle H, Receveur O. Predisposing, facilitating and reinforc-ing factors of healthy and unhealthy food consumption in schoolchil-dren: a study in Ouagadougou. Burkina Faso Global health promotion. 2013;20(1):68–77.
31. López MA, Martos FC. Iron availability: an updated review. Int J Food Sci Nutr. 2004;55(8):597–606.
32. Mgongo M, et al. Underweight, stunting and wasting among children in Kilimanjaro Region, Tanzania; a population-based cross-sectional study. Int J Environ Res Public Health. 2017;14(5):509.
33. Yetubie M, et al. Socioeconomic and demographic factors affecting body mass index of adolescents students aged 10–19 in Ambo (a rural town) in Ethiopia. Int J Biomed Sci: IJBS. 2010;6(4):321.
34. Assefa H, Belachew T, Negash L. Socioeconomic factors associated with underweight and stunting among adolescents of Jimma Zone, south west Ethiopia: a cross-sectional study. ISRN Public Health. 2013.
35. Daboné C, Delisle HF, Receveur O. Poor nutritional status of schoolchil-dren in urban and peri-urban areas of Ouagadougou (Burkina Faso). Nutr J. 2011;10(1):34.
36. Leenstra T, et al. Prevalence and severity of malnutrition and age at menarche; cross-sectional studies in adolescent schoolgirls in western Kenya. Eur J Clin Nutr. 2005;59(1):41–8.
37. Aounallah-Skhiri H, et al. Nutritional status of Tunisian adolescents: associ-ated gender, environmental and socio-economic factors. Public Health Nutr. 2008;11(12):1306–17.
38. Adamu A, Adjei G, Kubuga C. Effects of dietary patterns on the nutritional status of upper primary school children in Tamale metropolis. 2012.
39. Unicef, Levels and trends in child malnutrition; 2018. 40. Roberts C. Tanner’s Puberty Scale: exploring the historical entan-
glements of children, scientific photography and sex. Sexualities. 2016;19(3):328–46.
41. Damie TD, Wondafrash M, Teklehaymanot A. Nutritional status and associated factors among school adolescent in Chiro Town, West Hararge. Ethiopia Gaziantep Med J. 2015;21(1):32–42.
42. Darling AM, et al. Gender differences in nutritional status, diet and physi-cal activity among adolescents in eight countries in sub-Saharan Africa. Trop Med Health. 2020;25(1):33–43.
43. Gebregyorgis T, Tadesse T, Atenafu A. Prevalence of thinness and stunting and associated factors among adolescent school girls in Adwa town, North Ethiopia. International journal of food science. 2016.
44. Tekile AK, Woya AA, Basha GW. Prevalence of malnutrition and associated factors among under-five children in Ethiopia: evidence from the 2016 Ethiopia Demographic and Health Survey. BMC Res Notes. 2019;12(1):1–6.
45. Roba AC, et al. A low pulse food intake may contribute to the poor nutri-tional status and low dietary intakes of adolescent girls in rural southern Ethiopia. Ecol Food Nutr. 2015;54(3):240–54.
46. Ahmad D, Afzal M, Imtiaz A. Effect of socioeconomic factors on malnutri-tion among children in Pakistan. Future Bus J. 2020;6(1):1–11.
47. Darmon N, Drewnowski A. Does social class predict diet quality? Am J Clin Nutr. 2008;87(5):1107–17.
48. Roba K, Abdo M, Wakayo T. Nutritional status and its associated factors among school adolescent girls in Adama City, Central Ethiopia. J Nutr Food Sci. 2016;6(3):2.
49. Organization WH. Guideline: implementing effective actions for improv-ing adolescent nutrition; 2018.
50. Mengesha DK, Prasad RP, Asres DT. Prevalence and Associated factors of thinness among adolescent students in Finote Selam Town, Northwest Ethiopia. Sci World J. 2020
51. Yemaneh Y, et al. Under nutrition and its associated factors among adolescent girls in rural community of Aseko district, Eastern Arsi Zone, Oromia region, Eastern Ethiopia. World health. 2012; 2.
52. Bundy DA, et al. Child and adolescent health and development: realizing neglected potential; 2017.
Publisher’s NoteSpringer Nature remains neutral with regard to jurisdictional claims in pub-lished maps and institutional affiliations.