price effects of wool marketing innovations: some empirical evidence
TRANSCRIPT

Australian Journal of Agricultural Economics, Vol. 26, No. 1 (April 1982), pp. 14-22.
PRICE EFFECTS OF WOOL MARKETING INNOVATIONS: SOME EMPIRICAL
EVIDENCE BRENDA JACKSON AND MURRAY SPINKS*
A ustrafian Woof Corporation, Melbourne, Vic. 3001
Conflicting claims are often made about the price effects of specific wool marketing innovations. In this paper, a regression model is used to estimate the price effects of two innovations, namely, computerised selling by separation and pre-sale, dense packaging of wool. The results are indicative of aggregate price differentials between wool sold via the ‘normal’ system and via an innovative system for the particular wool types and sale dates analysed. The extent to which price effects may be offset by differences in selling charges is also considered. In addition, some underlying reasons for price differences, where they exist, are proposed.
Introduction The adoption phase of specific wool marketing innovations is usually
accompanied by conflicting claims about their advantages and disadvan- tages to the wool industry. Traditionally, those promoting the innova- tion claim that there are, or will be, premiums for wool marketed in the new manner as a result of improved operational and/or pricing efficiency. On the other hand, sections of the industry committed to the traditional marketing system claim that there are disadvantages associated with marketing wool via the new option which may result in a lower return to growers.
Innovations in the wool marketing system, to some extent, result in a differentiated product. Since buyers are able to express their preferences with respect to particular innovations through the price mechanism, premiums or discounts may result for wool marketed via the new method. In the past, participants in the debate about wool marketing in- novations have tended to use data on ‘average’ wool prices to support their claims. To the extent that wool prices reflect a number of factors other than method of offering, and that these claims often lack any firm statistical analysis, there is a risk that the extent and rate of adoption of innovations in wool marketing may be distorted from that which would prevail with more objective information.
In this paper, a regression model is used to estimate the price effects of two wool marketing innovations, namely, computerised selling by separation and pre-sale, dense packaging of wool. The latter innovation, introduced commercially in 1977, is probably now in the adoption phase. Computerised selling was introduced almost a decade ago, The results of the analysis are interpreted with respect to their implications for validating various claims regarding the price effects of the two innova- tions. The extent to which price effects may be offset by differences in selling charges is also considered, in order to provide an estimate of the
* Murray Spinks is now in private business. The authors would like t o thank, without im- plication, Bob Richardson and anonymous referees for helpful comments. The views ex- pressed in this paper do not necessarily reflect those of the Australian Wool Corporation.
14

1982 WOOL MARKETING INNOVATIONS 15
impact on the net return to wool growers. In addition, some considera- tion is given to the underlying reasons for price differences where they exist.
Background Pre-sale packaging of wool into high density bales (450 kg) became
commercially feasible with the adoption of sale by sample. This meant that bales did not have to be physically opened and inspected prior to auction, since buyers could bid on the basis of objective measurement and inspection of a mechancially drawn representative (‘grab’) sample. The pre-sale, dense-packaging concept was introduced commercially in 1977 and promoted on the basis that i t would result in cost savings in the areas of handling and freight. In anticipation of such developments, wool growers were offered a cash rebate for each farm bale converted to a high-density package prior to auction. Approximately 200 000 conven- tional bales were converted pre-sale to high-density form in 1980-81, compared with about 83 000 bales in 1977-78. Competing firms have claimed that, compared with wool packaged in conventional bales, wool sold in pre-sale, high-density form attracts a price discount of up to 20c/kg clean. In counter claims, the promoters of the pre-sale, high- density concept have argued that these price discounts have been overstated and, in any event, net prices received by growers would be comparable with returns for the same wool packaged in conventional bales. In addition to the handling rebate, growers marketing their wool in pre-sale, dense-packaged form receive higher display sample rebates and pay lower wool pack charges.
Similar conflicts have emerged since the introduction of computerised sale by separation in 1971. Under this selling system, wool is sold through a computerised tender system and is offered to buyers on the basis of a display sample and an Australian Wool Testing Authority (AWTA) test certificate. Wool sold through this system is stored in various centres around Australia. Since both the computerised tender and sale by separation aspects of the innovative selling method were in- troduced simultaneously, it is difficult to analyse their separate effects.
Against this background, the principle objective in this study is to determine the price effects associated with wool marketed via the com- puterised selling system or in pre-sale, dense-packaged form, compared to that marketed via the ‘normal’ method.2 Specific objectives are as follows:
(a) determine whether prices paid by buyers for wool sold via the two marketing innovations are significantly different from those paid for wool marketed via the ‘normal’ method;
(b) estimate the extent to which any differences in prices paid by buyers are offset by lower selling charges for wool offered via the innovative methods; and
I Metcalfe (1975) provides a useful description of the initial experience of sale of wool by tender in Australia.
The ‘normal’ system is defined as the offer of wool which has been objectively measured and is, therefore, sold by sample in a major auction centre. Melbourne sales were used as a comparison in the computerised sales analysis while, in the case of the pre-sale dense baling analysis, the comparison was made with farm bales sold in the same selling centre as the dense bales, that is, Melbourne and Sydney.

16 AUSTRALIAN JOURNAL OF AGRICULTURAL ECONOMICS APR.
(c) attempt to explain the underlying reasons for any differences in prices.
A nalytical Framework The method of analysis involved selecting two sample series in which
as many price explanators as possible were held constant3 and then for- mulating a regression model to estimate the price effects of the innova- tion, taking into account explicitly the influence of other explanatory variables. This approach involves an attempt to reproduce a split-lot trial through ex post selection of data.
A preferable method of estimating the price effects of an innovation would be to devise an ex ante split-lot trial, such as that used by Tier and Shepherd (1972), in which the only price determining characteristic which varied was the method of offering. In practice, this method is ex- pensive and time consuming if an adequate sample is to be obtained. Also, with an increasing number of options available to growers with respect to method of offering, such an approach would not be suitable for evaluating all options, or for frequent use. It was decided, therefore, to adopt an approach which can be repeated at different periods in time, for example, at different stages of the adoption phase for an innovation, since it could be expected that the magnitude of price differentials will vary over the adoption phase.
The general functional form of the model was4: (1) WP;=b,+blXl,+ . .+ bnXnt+bn+lD1,+ - . a + b n + m Dm;+ei,
where b, = a constant; Xi = quantifiable variables representing wool characteristics
4; = dummy variables representing discrete exogenous factors (i'l, . . . , n);
G = n + l , . . . , n+rn); and ei = error term.
It is assumed that buyers value wool on the basis of the objective infor- mation contained in the auction catalogue5, supplemented by visual ap- praisal of the sample, in order to make an assessment of such factors as length, strength and colour. Thus, the important factors in determining the greasy price a buyer is prepared to pay for a particular lot, at any given point in time, are the objective micrometre measurement, wool yield, vegetable matter content and other visually appraised charac- teristics. The two hypotheses tested in this paper were that the form of packaging (pre-sale, high-density bales) and the method of selling (com-
3 Wool type was held constant by using data for single Australian Wool Corporation ap- praised types. All data related to wool sold under growers' brands thus excluding the effects of interlotting and bulkclassing on prices paid. Where possible, equations relate to data from individual sale days. However, in some equations i t was necessary to include a dummy variable to account for potential price differences between sales. An analysis of the relation- ship between lot size and price was conducted. Briefly, results indicated that, in general, there was no significant relationship between lot size and price for lot sizes above three bales. This result is similar to that outlined in McMahon and Shaw (1978). Therefore, no lot size variable was included in the model.
This method is similar to that used bv Ladd and Martin (1976) and Ladd and . I
Suvannunt (1976). Only lots of wool sold by sample were included in the model, since all wool sold in
high-density bales and by computer is marketed in this manner
1982 WOOL MARKETING INNOVATIONS 17
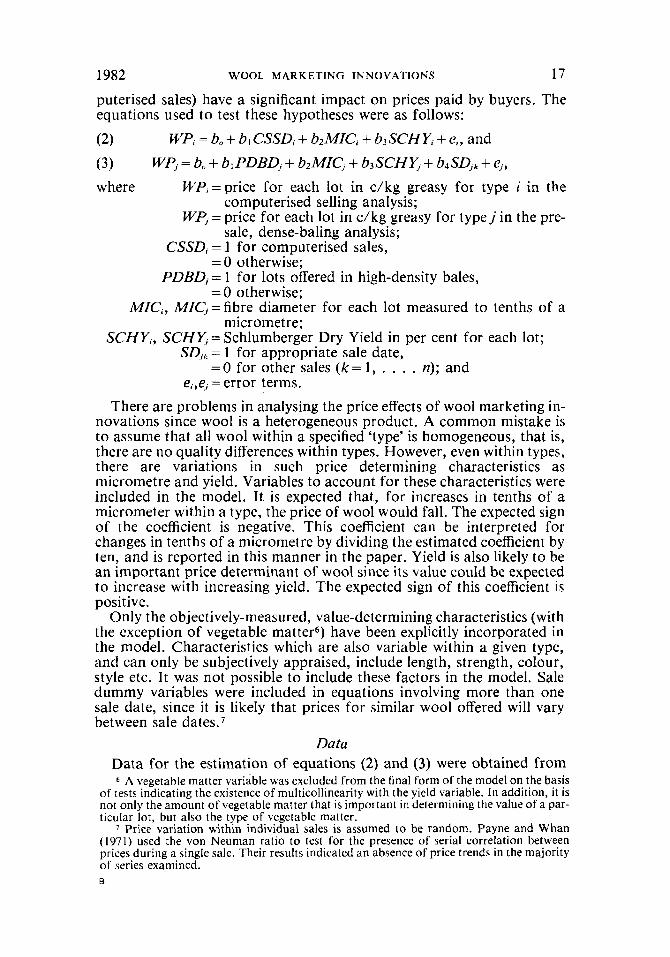
puterised sales) have a significant impact on prices paid by buyers. The equations used to test these hypotheses were as follows:
(2) WP, = b,, + b I CSSD, + b2MICi + b3 SCH yi + e,, and (3) WP, = b, + 6, PDBD, + b2 MIC, + bj SCH Yj + b4 SOj, + e, , where WP,=price for each lot in c/kg greasy for type i in the
WP, = price for each lot in c/kg greasy for t ype j in the pre- computerised selling analysis;
sale, dense-baling analysis; CSSD, = 1 for computerised sales,
PDBDj= 1 for lots offered in high-density bales, = 0 otherwise;
= 0 otherwise;
micrometre; M K i , MIC, = fibre diameter for each lot measured to tenths of a
SCHY,, SCHY, = Schlumberger Dry Yield in per cent for each lot; SO,, = 1 for appropriate sale date,
ei,ei = error terms. = O for other sales ( k = 1, . . . . n); and
There are problems in analysing the price effects of wool marketing in- novations since wool is a heterogeneous product. A common mistake is to assume that all wool within a specified ‘type’ is homogeneous, that is, there are no quality differences within types. However, even within types, there are variations in such price determining characteristics as micrometre and yield. Variables to account for these characteristics were included in the model. It is expected that, for increases in tenths of a micrometer within a type, the price of wool would fall. The expected sign of the coefficient is negative. This coefficient can be interpreted for changes in tenths of a micrometre by dividing the estimated coefficient by ten, and is reported in this manner in the paper. Yield is also likely to be an important price determinant of wool since its value could be expected to increase with increasing yield. The expected sign of this coefficient is positive.
Only the objectively-measured, value-determining characteristics (with the exception of vegetable matter6) have been explicitly incorporated in the model. Characteristics which are also variable within a given type, and can only be subjectively appraised, include length, strength, colour, style etc. It was not possible to include these factors in the model. Sale dummy variables were included in equations involving more than one sale date, since it is likely that prices for similar wool offered will vary between sale dates.’
Data Data for the estimation of equations (2) and (3) were obtained from 6 A vegetable matter variable was excluded from the final form of the model on the basis
of tests indicating the existence of multicollinearity with the yield variable. In addition, i t is not only the amount of vegetable matter that is important in determining the value of a par- ticular lot, but also the type of vegetable matter.
7 Price variation within individual sales is assumed to be random. Payne and Whan (1971) used the von Neuman ratio to test for the presence of serial correlation between prices during a single sale, Their results indicated a n absence of price trends in the majority of series examined. B

18 AUSTRALIAN JOURNAL OF AGRICULTURAL ECONOMICS APR . auction catalogues for the 1978-79, 1979-80 and 1980-81 seasons. In- itially, the wool types most commonly sold in pre-sale, high-density bales and via computerised sales were identified and the catalogue records ex- amined to ensure that sufficient degrees of freedom remained for statistical analysis. The types for which there were sufficient observations were 61 and 283C for the computerised sales and 63,80B and 435 for pre- sale dense packaging.8
Equation (2) was estimated using data from computerised and Melbourne sales for the following types and sale dates:
Type 61 7.2.79; and Type 283C 24.10.79.
Equation (3) was estimated using data for wool offered in pre-sale, dense- packaging and conventional packaging for the following types and sale dates: 1979-80 Season
Type 63 (Melbourne) Type 80B (Sydney) 22.8.79; and Type 435 (Melbourne) 23.10.79.
Type 63 (Melbourne) Type 80B (Sydney) Type 435 (Melbourne)
22.8.79 and 23.10.79;
1980-81 Season 8.10.80 and 27.10.80; 28.5.80 and 18.6.80; and 8.10.80 and 9.12.80.
Results and Discussion All equations were estimated using OLS. The results for the com-
puterised sales and pre-sale, dense-bale equations are reported in Tables 1 and 2, respectively.
Computerised selling system results The results of equations for type 61 and type 283C are given in Table
I . The overall explanatory power of both equations is high, as indicated by R2 values of 0.96 and 0.92. In each equation the coefficient on CSSD is significant at the five per cent level and has a negative sign indicating that, for the sales in question, the sample mean computerised sale prices for type 61 and type 283C were significantly lower than those at the com- parable Melbourne sale. The estimated discounts are 2.3c/kg greasy for type 61 and 9.5c/kg greasy for type 283C.
The coefficient of .the fibre diameter variable is significant in the equa- tion for type 61 and indicates an average discount of 0.42c/kg greasy for increases in one-tenth of a micrometre. In the case of type 283C, the coefficient on the fibre diameter variable is not significant at the five per cent level. The coefficient on the yield variable is significant in both equa- tions and indicates an average premium of 3.6 and 2.9c/kg greasy for a unit increase in yield for types 61 and 283C, respectively.
Type 61 is a best topmaking merino wool of 20p diameter. Type 63 is a best topmaking merino wool of 22p diameter. Type 80B is a good topmaking merino wool with light vegetable fault and of 23p diameter. Type 283C is medium merino locks of light carbonis- ing quality. Type 435 is a good style crossbred fleece of 30p diameter.

1982 WOOL MARKETING INNOVATIONS 19
TABLE 1 Regression Results for Computerised Salesa
Wool type Constant MIC, SCHY, CSSD, R 2 SEE
61 97.25 -4.22 3.56 -2.33 0.96 1.37
283C 0.99 0.31 2.89 -9.54 0.92 4.71 (3.76) (-2.73) (15.23) (-3.02)
(0.02) (0.13) (9.73) ( - 3.69)
a R2 =Coefficient of determination adjusted for degrees of freedom. SEE = Standard error of the regression.
Figures in parentheses are t-statistics.
Pre-sale dense baling results Results of the estimated equation for the 1979-80 and 1980-81 seasons
are reported in Table 2. The model performedjeasonably well for most individual equations. The estimated value for R 2 indicated that approxi- mately 90 per cent of the variation in prices was accounted for by the specified model, with the exception of type 435 (1980-81) in which the R2 was 0.53. The signs of all estimated coefficients were as expected.
In equations for types 80B and 435, the coefficients on the PDBD dummy are significant at the five per cent level. This means that, for these particular types within sales and on average for the sample as a whole, buyers paid Iess for wool packed in pre-sale, high-density bales in corn- parison to that in conventional bales. In nominal terms, the estimated discount ranged from 5.7c/kg greasy for type 80B to 10.8c/kg greasy for type 435. However, in both equations for type 63, the coefficient on PDBD was insignificant implying that the form of packaging did not affect prices paid by buyers at auction for this type.
TABLE 2 Regression Results for Pre-sale Dense Packaging"
Wool type Constant MIC, SCHY, PDBD, SO, R 2 SEE
1979-80 Season equations 63 676.78 - 33.67
(7.53) (-8.33) SOB 80.99 -4.47
(1.29) ( - 1.64) 43 5 193.24 -5.84
(4.58) ( - 4.06)
I98M I Season equations 63 342.2 - 15.61
(5.42) (-6.49)
(6.39) ( - 6.38)
(2.81) (- 2.54)
SOB 449.04 - 19.62
435 317.18 -8.37
5.08 (11.58)
4.09 ( 1 7.50)
3.46 (14.31)
4.43 (11.34)
4.19 (17.09)
2.39 (2.87)
-1.74 13.94 0.92 5.31 ( - 0.72) (4.19) - 5.65 0.92 4.07
- 7.07 0.92 3.33 ( - 3.60)
( - 4.80)
0.95 2.64 0.92 1.39
-5.81 -0.08 0.92 1.53 (0.68) (1.79)
(-3.51) (-0.04) -10.78 -0.98 0.53 3.38 (-3.20) (-0.26)
See footnotes to Table 1.

20 AUSTRALIAN JOURNAL OF AGRICULTURAL ECONOMICS APR.
The micrometre coefficient was negative in sign and significant at the five per cent level for five of the six equations. The average discount for increases in one-tenth of a micrometre ranges from 0.45c/kg greasy for type 80B in 1979-80, to 3.4c/kg greasy for type 63 in 1979-80. The coeffi- cient on the yield variable was positive and significant in all equations, and the average premium for a unit increase in yield ranged from 2.4 to S.lc/kg greasy. The coefficient on the sale dummy variable is positive and significant for type 63 in the equation for 1979-80 and 1980-81. In the remaining equations for 1980-81 the sale dummy is insignificant. For each equation the estimated price change between sales is consistent with actual market price movements over the sample period.
Implications for net returns to growers Evidence of lower prices paid by buyers for wool marketed in an in-
novative manner compared to the normal method of offering is not necessarily indicative of a lower than normal price received by growers. This is because the impact of selling and delivery charges must be taken into account in assessing the net return to the grower.
Bennett (1979) conducted a survey of marketing costs associated with a variety of wool marketing options including conventional marketing, pre-sale, dense-packaging and computerised selling. The survey period corresponded to that used in the present analysis of prices paid by buyers and can, therefore, be used as a guide to selling charges for the purposes of this paper. O
Selling charges for wool offered through the computerised selling system were 1.7c/kg lower than those for the auction system." Hence, these lower charges only partially offset the estimated price discounts. Selling charges for dense-packaged wool were 3. I d k g lower than for the auction system.12 Thus, for types 80B and 435, the lower charges would only partially offset the estimated price discounts, but for type 63, the estimated price discounts would have been more than offset.
On balance, the results of the preceding analysis indicate that, for those wool types examined, growers marketing their wool via either of the two innovative methods probably received lower returns than if the wool had been sold at auction during the period of analysis. However, i t should be emphasised that these results are not indicative of the situation for individual growers, whose net return will depend on the unique set of factors pertaining to their enterprise. Further, the estimated results are only representative of the wool types and time periods considered. It is likely that price differences will vary over time, particularly in the case of a relatively recent innovation such as pre-sale, dense-bale packaging, which may still be in the adoption phase.
The issue of differences in selling charges associated with alternative wool marketing options is also discussed in Anon. (1980) and Whan (1979).
Bennett's study does not take into account the impact of differences in timing of pay- ment. Further, differences in services provided by brokers and other firms may also be im- portant, but cannot be explicitly accounted for in cost comparisons.
I I Bennett's estimate of selling charges in Sydney was used since the largest proportion of wool offered through the computerised selling system was stored in Sydney during the period of analysis.
l 2 Based on Bennett's estimate, but also taking into account the savings from the re- usable wool packs.

1982 WOOL MARKETING INNOVATIONS 21
Possible reasons for price differences Whan and Richardson (1969) suggest that the price paid by buyers is
related to the degree of competition at auction in the form of the number of bidders. However, the underlying cause for lack of price competition, and hence price differences, must relate to the sum of the value determin- ing attributes of the method of offering, ceterisparibus. The reasons for lower prices paid for computerised selling and pre-sale, dense-packaging are not obvious and probably involve a number of interrelated factors. However, some possible reasons for the estimated price differences are outlined below. It should be emphasised that the reasons given are ap- plicable to the period of analysis, but may not be relevant in subsequent periods, particularly if the problems outlined can be overcome. Also, price differences may vary over the adoption phase as the volume offered in the innovative manner increases.
In the case of computerised selling, buyers have less flexibility with respect to revision of price limits and re-offer of lots during a sale. This means there is a greater risk of purchasing insufficient or excess quan- tities of wool. In the conventional auction system, buyers can con- tinuously adjust their limits during the sale according to market trends and purchasing pattern and, therefore, there is less uncertainty about filling orders. A related factor is that limits have to be compiled much earlier for computerised selling than those for normal auction sales. This means that it may not be possible to take into account fully information from the previous day on exchange rate movements and the futures quotations, when setting price limits.
For pre-sale dense packaging the estimated price discounts were prob- ably due to a number of factors. In some countries (e.g. India), handling facilities were inappropriate to cope with the high-density packages. Some Eastern European countries have also expressed dissatisfaction with the high-density package because of problems with pilfering and contamination, Also, there are problems in thawing high-density bales arriving in Northern Hemisphere destinations during the winter. High- density packages take longer to thaw and there is some uncertainty with respect to subsequent processing performances. Finally, if high-density packages are re-converted post-sale, the cost to buyers is significant.
Conclusions Wool marketing innovations are generally introduced to reduce costs.
However, cost savings cannot be considered in isolation from the price effects of an innovation. The magnitude of such price effects is likely to vary during the adoption phase. It is the net revenue effects of an innova- tion which determine the rate of adoption and, ultimately, the extent of industry acceptance.
In this paper, a regression model has been used to estimate the price effects of two innovations. The approach adopted involves an expost at- tempt to reproduce a split-lot trial. Potential price explanators, which could not be held constant in the data sample, were explicitly taken into account in the model.
The results indicate that, for the wool types and sales in question, sample mean prices paid by buyers for wool offered via computerised

22 AUSTRALIAN JOURNAL OF AGRICULTURAL ECONOMICS APR.
sales were, on average, lower than those for wool marketed in the ‘nor- mal’ manner, and there was some evidence 6f lower prices paid for dense- packaged wool. Further, lower selling charges associated with the innovative marketing methods would not have been sufficient to offset the lower prices paid by buyers, except in the case of type 63 wool offered in pre-sale, dense-packaged form. It should be noted, however, that the magnitude of estimated price discounts is substantially lower than the level claimed by opponents of pre-sale, dense packaging,
Several features of the results which should be appreciated in their in- terpretation are as follows. The results reported are representative only of the range of types and sale dates concerned. It is possible that the magnitude and sign of price effects estimated in this paper could change if other types were selected for analysis and/or data relating to different periods of the adoption phase were used.
Finally, it should be noted that the results of this model are aggregate results and cannot be interpreted as repesentative of the likely net return for any individual grower. Despite the existence of price discounts in ag- gregate, there may be individual growers for whom the price effects of computerised selling or pre-sale, dense packaging will be positive in com- parison to the conventional system. Individual growers must make com- mercial decisions using the most recent information available on wool prices, wool marketing charges and other relevant non-price factors.
References Anon. (1980), ‘There’s little difference in wool selling costs’, Farm 1(2), 24-26. Bennett, N. W. (1979), ‘Wool marketing options’, Wool Technology and Sheep Breeding
Ladd, G. W. and Martin, M. B. (1976), ‘Prices and demands for input characteristics’, American Journal of Agricultural Economics 58( l), 21-30.
and Suvannunt, V. (1976), ‘A model of consumer goods characteristics’, American Journal of Agricultural Economics 58(3), 504-10.
McMahon, P. J . and Shaw, D. G. (1978), ‘An analysis of marketing small classed lines of wool‘, Quarterly Review of Agricultural Economics 3 I ( l ) , 51-9.
Metcalfe, J. S. (1975), ‘Some observations on initial experience of sale of wool by tender in Australia’, Quarterly Review of Agricultural Economics 28(2), 97-108.
Payne, R. A. and Whan, R. B. (1971), ‘The nature of price movements during single sales for three individual wool types sold in Sydney’, Australian Journal of Agricultural Economics 15(2), 95-102.
Tier, T. J . and Shepherd, M.A. (1972), ‘An analysis of the price premium paid for pre-sale tested greasy wool’, Quarterly Review of Agricultural Economics 25(1), 50-5.
Whan, I. F. (1979), ‘Wool marketing in Queensland’, Queensland Department of Primary Industries, Economic Services Branch, Extension Series No. 19.
Whan, R. B. and Richardson, R. A. (1969), ‘A simulated study of an auction market’, Australian Journal of Agricultural Economics 13(2), 91 -100.
27(3), 9-13.