principle of atomic absorption /emission...
TRANSCRIPT
Principle of Atomic Absorption /Emission Spectroscopy
15.1 ATOMIC EMISSION-THE FLAME TEST
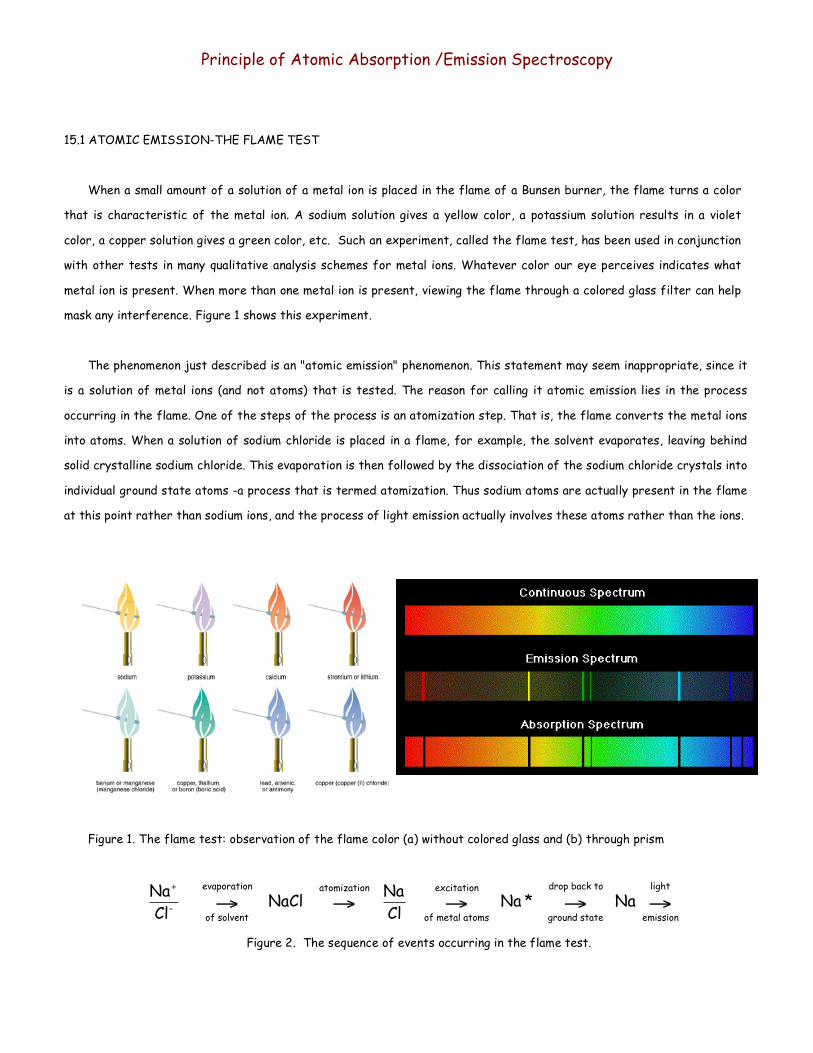
When a small amount of a solution of a metal ion is placed in the flame of a Bunsen burner, the flame turns a color
that is characteristic of the metal ion. A sodium solution gives a yellow color, a potassium solution results in a violet
color, a copper solution gives a green color, etc. Such an experiment, called the flame test, has been used in conjunction
with other tests in many qualitative analysis schemes for metal ions. Whatever color our eye perceives indicates what
metal ion is present. When more than one metal ion is present, viewing the flame through a colored glass filter can help
mask any interference. Figure 1 shows this experiment.
The phenomenon just described is an "atomic emission" phenomenon. This statement may seem inappropriate, since it
is a solution of metal ions (and not atoms) that is tested. The reason for calling it atomic emission lies in the process
occurring in the flame. One of the steps of the process is an atomization step. That is, the flame converts the metal ions
into atoms. When a solution of sodium chloride is placed in a flame, for example, the solvent evaporates, leaving behind
solid crystalline sodium chloride. This evaporation is then followed by the dissociation of the sodium chloride crystals into
individual ground state atoms -a process that is termed atomization. Thus sodium atoms are actually present in the flame
at this point rather than sodium ions, and the process of light emission actually involves these atoms rather than the ions.
Figure 1. The flame test: observation of the flame color (a) without colored glass and (b) through prism
!
Na+
Cl-
of solvent
evaporation
" NaCl atomization
" Na
Cl
of metal atoms
excitation
" Na * ground state
drop back to
" Na emission
light
"
Figure 2. The sequence of events occurring in the flame test.
As with fluorescence, the atomic emission is a result of electrons dropping from an excited state to lower states.
The difference is that (1) atoms are involved here, rather than molecules, and (2) light is not absorbed prior to this
atomic emission. Following atomization, a small percentage of the atoms absorb sufficient energy from the flame (as
opposed to a light beam) so as to be promoted to an excited state. As with molecules in fluorescence, these atoms quickly
return to a lower state, and light corresponding to the energy that is lost in the process is generated. It is this light that
our eye perceives. The complete sequence of events is depicted in Figures 2 and 3.
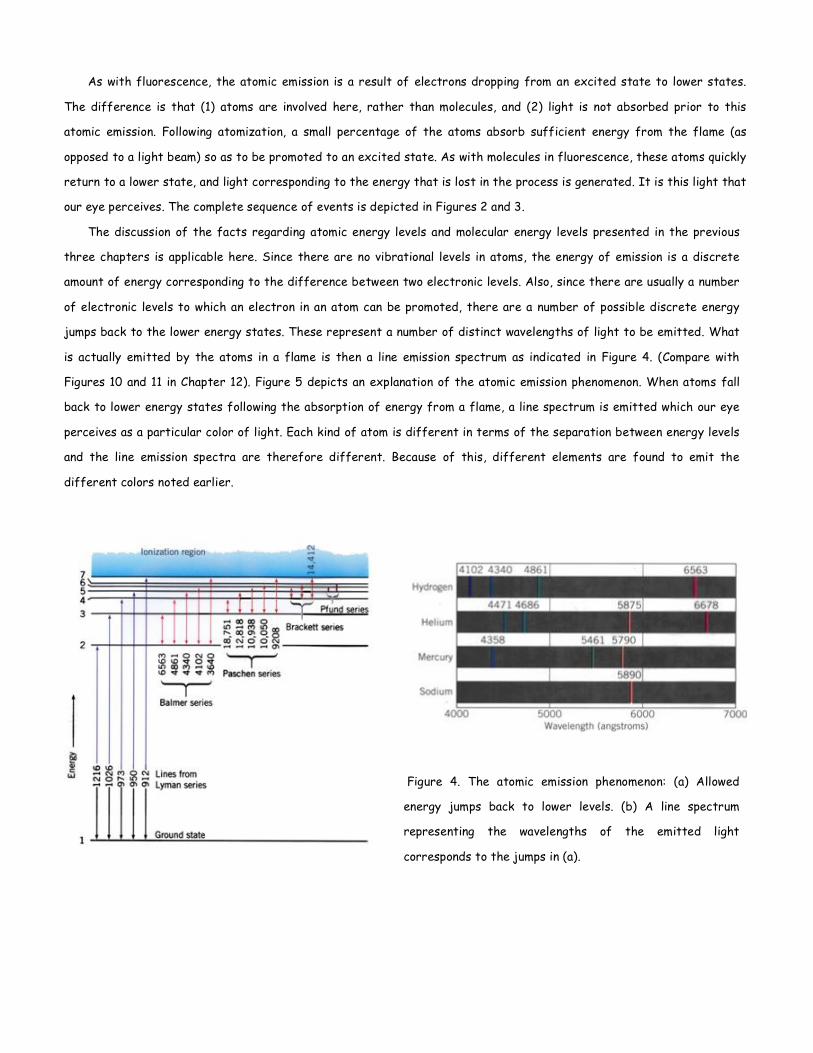
The discussion of the facts regarding atomic energy levels and molecular energy levels presented in the previous
three chapters is applicable here. Since there are no vibrational levels in atoms, the energy of emission is a discrete
amount of energy corresponding to the difference between two electronic levels. Also, since there are usually a number
of electronic levels to which an electron in an atom can be promoted, there are a number of possible discrete energy
jumps back to the lower energy states. These represent a number of distinct wavelengths of light to be emitted. What
is actually emitted by the atoms in a flame is then a line emission spectrum as indicated in Figure 4. (Compare with
Figures 10 and 11 in Chapter 12). Figure 5 depicts an explanation of the atomic emission phenomenon. When atoms fall
back to lower energy states following the absorption of energy from a flame, a line spectrum is emitted which our eye
perceives as a particular color of light. Each kind of atom is different in terms of the separation between energy levels
and the line emission spectra are therefore different. Because of this, different elements are found to emit the
different colors noted earlier.
Figure 4. The atomic emission phenomenon: (a) Allowed
energy jumps back to lower levels. (b) A line spectrum
representing the wavelengths of the emitted light
corresponds to the jumps in (a).
15.2 FLAME PHOTOMETRY
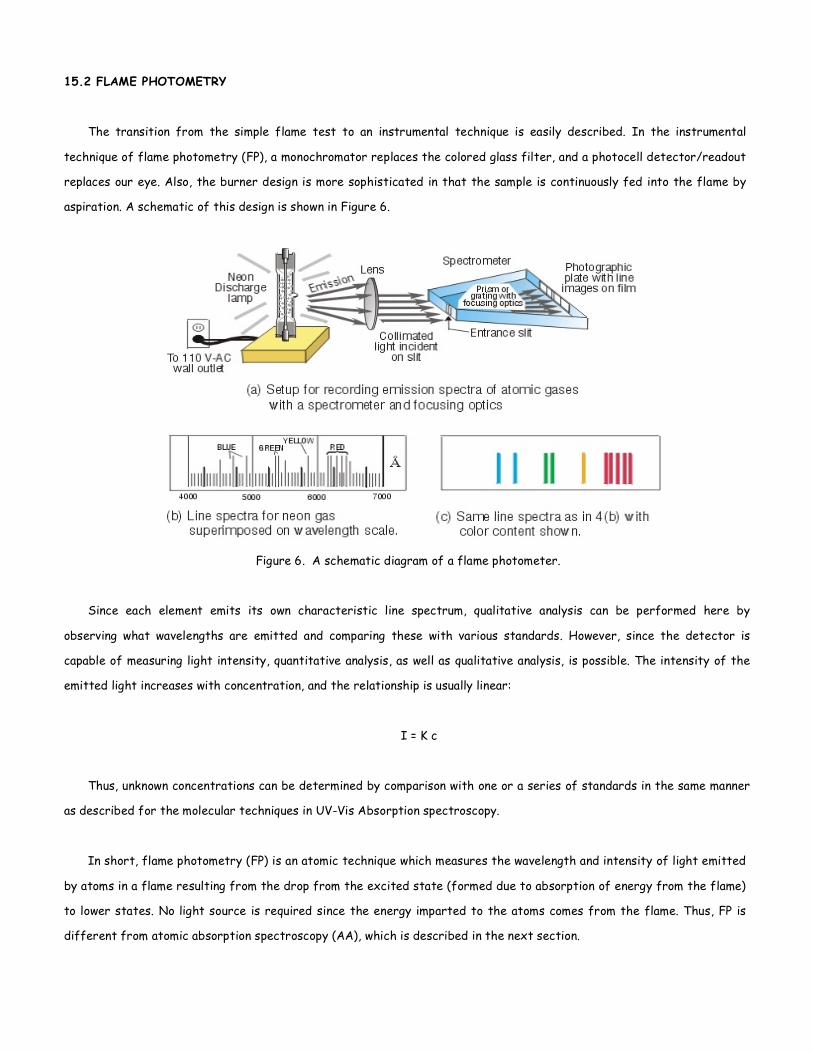
The transition from the simple flame test to an instrumental technique is easily described. In the instrumental
technique of flame photometry (FP), a monochromator replaces the colored glass filter, and a photocell detector/readout
replaces our eye. Also, the burner design is more sophisticated in that the sample is continuously fed into the flame by
aspiration. A schematic of this design is shown in Figure 6.
Figure 6. A schematic diagram of a flame photometer.
Since each element emits its own characteristic line spectrum, qualitative analysis can be performed here by
observing what wavelengths are emitted and comparing these with various standards. However, since the detector is
capable of measuring light intensity, quantitative analysis, as well as qualitative analysis, is possible. The intensity of the
emitted light increases with concentration, and the relationship is usually linear:
I = K c
Thus, unknown concentrations can be determined by comparison with one or a series of standards in the same manner
as described for the molecular techniques in UV-Vis Absorption spectroscopy.
In short, flame photometry (FP) is an atomic technique which measures the wavelength and intensity of light emitted
by atoms in a flame resulting from the drop from the excited state (formed due to absorption of energy from the flame)
to lower states. No light source is required since the energy imparted to the atoms comes from the flame. Thus, FP is
different from atomic absorption spectroscopy (AA), which is described in the next section.
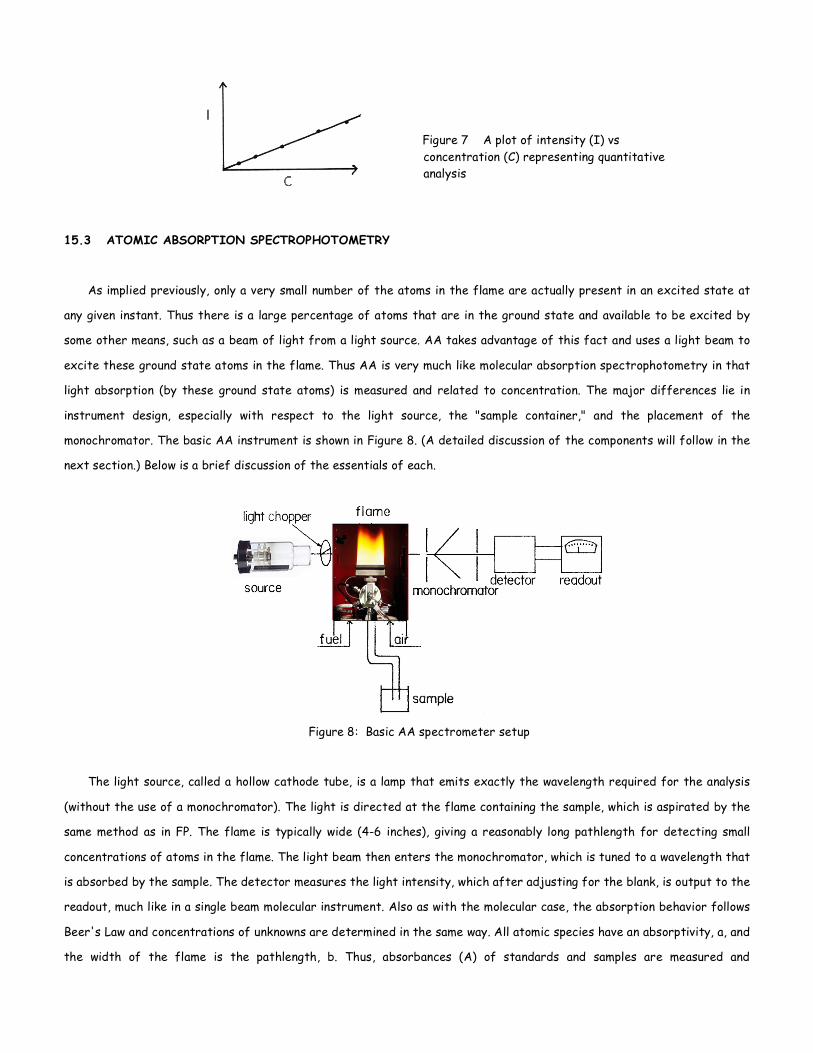
Figure 7 A plot of intensity (I) vs concentration (C) representing quantitative analysis
15.3 ATOMIC ABSORPTION SPECTROPHOTOMETRY
As implied previously, only a very small number of the atoms in the flame are actually present in an excited state at
any given instant. Thus there is a large percentage of atoms that are in the ground state and available to be excited by
some other means, such as a beam of light from a light source. AA takes advantage of this fact and uses a light beam to
excite these ground state atoms in the flame. Thus AA is very much like molecular absorption spectrophotometry in that
light absorption (by these ground state atoms) is measured and related to concentration. The major differences lie in
instrument design, especially with respect to the light source, the "sample container," and the placement of the
monochromator. The basic AA instrument is shown in Figure 8. (A detailed discussion of the components will follow in the
next section.) Below is a brief discussion of the essentials of each.
Figure 8: Basic AA spectrometer setup
The light source, called a hollow cathode tube, is a lamp that emits exactly the wavelength required for the analysis
(without the use of a monochromator). The light is directed at the flame containing the sample, which is aspirated by the
same method as in FP. The flame is typically wide (4-6 inches), giving a reasonably long pathlength for detecting small
concentrations of atoms in the flame. The light beam then enters the monochromator, which is tuned to a wavelength that
is absorbed by the sample. The detector measures the light intensity, which after adjusting for the blank, is output to the
readout, much like in a single beam molecular instrument. Also as with the molecular case, the absorption behavior follows
Beer's Law and concentrations of unknowns are determined in the same way. All atomic species have an absorptivity, a, and
the width of the flame is the pathlength, b. Thus, absorbances (A) of standards and samples are measured and
concentrations determined as with previously presented procedures, with the use of Beer's Law (A = abc).
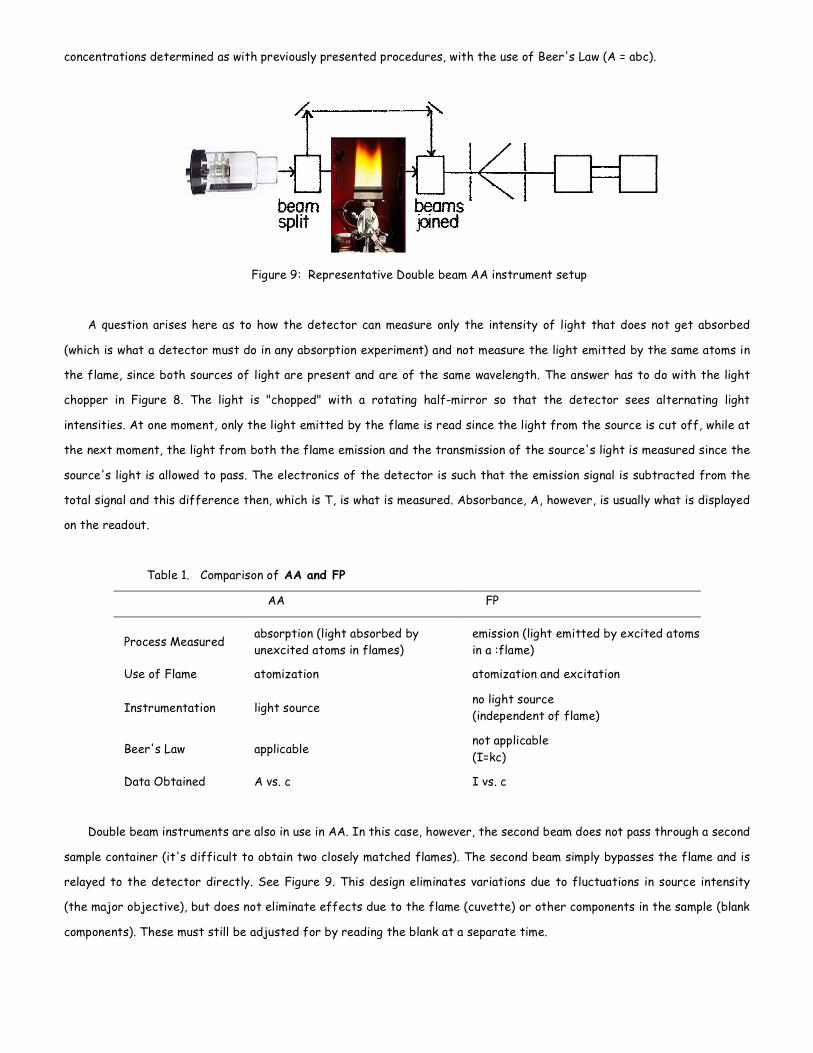
Figure 9: Representative Double beam AA instrument setup
A question arises here as to how the detector can measure only the intensity of light that does not get absorbed
(which is what a detector must do in any absorption experiment) and not measure the light emitted by the same atoms in
the flame, since both sources of light are present and are of the same wavelength. The answer has to do with the light
chopper in Figure 8. The light is "chopped" with a rotating half-mirror so that the detector sees alternating light
intensities. At one moment, only the light emitted by the flame is read since the light from the source is cut off, while at
the next moment, the light from both the flame emission and the transmission of the source's light is measured since the
source's light is allowed to pass. The electronics of the detector is such that the emission signal is subtracted from the
total signal and this difference then, which is T, is what is measured. Absorbance, A, however, is usually what is displayed
on the readout.
Table 1. Comparison of AA and FP
AA FP
Process Measured absorption (light absorbed by unexcited atoms in flames)
emission (light emitted by excited atoms in a :flame)
Use of Flame atomization atomization and excitation
Instrumentation light source no light source (independent of flame)
Beer's Law applicable not applicable (I=kc)
Data Obtained A vs. c I vs. c
Double beam instruments are also in use in AA. In this case, however, the second beam does not pass through a second
sample container (it's difficult to obtain two closely matched flames). The second beam simply bypasses the flame and is
relayed to the detector directly. See Figure 9. This design eliminates variations due to fluctuations in source intensity
(the major objective), but does not eliminate effects due to the flame (cuvette) or other components in the sample (blank
components). These must still be adjusted for by reading the blank at a separate time.
15.4 INSTRUMENT COMPONENTS
Hollow Cathode Lamp
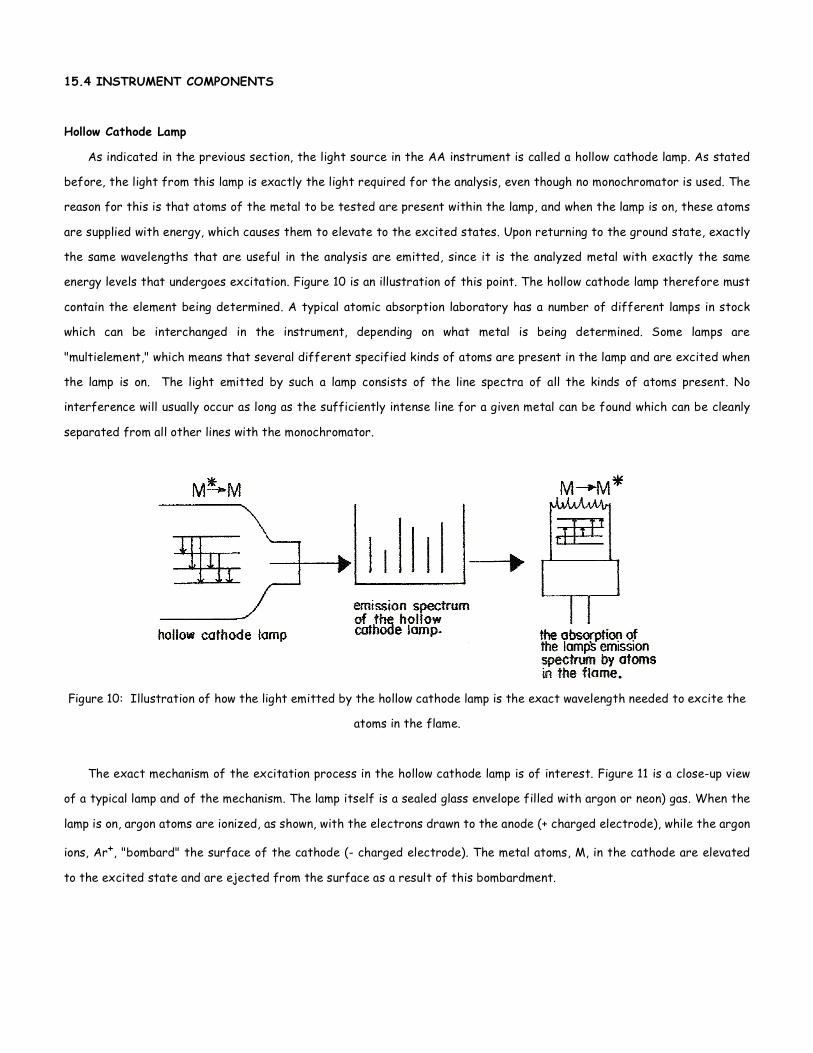
As indicated in the previous section, the light source in the AA instrument is called a hollow cathode lamp. As stated
before, the light from this lamp is exactly the light required for the analysis, even though no monochromator is used. The
reason for this is that atoms of the metal to be tested are present within the lamp, and when the lamp is on, these atoms
are supplied with energy, which causes them to elevate to the excited states. Upon returning to the ground state, exactly
the same wavelengths that are useful in the analysis are emitted, since it is the analyzed metal with exactly the same
energy levels that undergoes excitation. Figure 10 is an illustration of this point. The hollow cathode lamp therefore must
contain the element being determined. A typical atomic absorption laboratory has a number of different lamps in stock
which can be interchanged in the instrument, depending on what metal is being determined. Some lamps are
"multielement," which means that several different specified kinds of atoms are present in the lamp and are excited when
the lamp is on. The light emitted by such a lamp consists of the line spectra of all the kinds of atoms present. No
interference will usually occur as long as the sufficiently intense line for a given metal can be found which can be cleanly
separated from all other lines with the monochromator.
Figure 10: Illustration of how the light emitted by the hollow cathode lamp is the exact wavelength needed to excite the
atoms in the flame.
The exact mechanism of the excitation process in the hollow cathode lamp is of interest. Figure 11 is a close-up view
of a typical lamp and of the mechanism. The lamp itself is a sealed glass envelope filled with argon or neon) gas. When the
lamp is on, argon atoms are ionized, as shown, with the electrons drawn to the anode (+ charged electrode), while the argon
ions, Ar+, "bombard" the surface of the cathode (- charged electrode). The metal atoms, M, in the cathode are elevated
to the excited state and are ejected from the surface as a result of this bombardment.
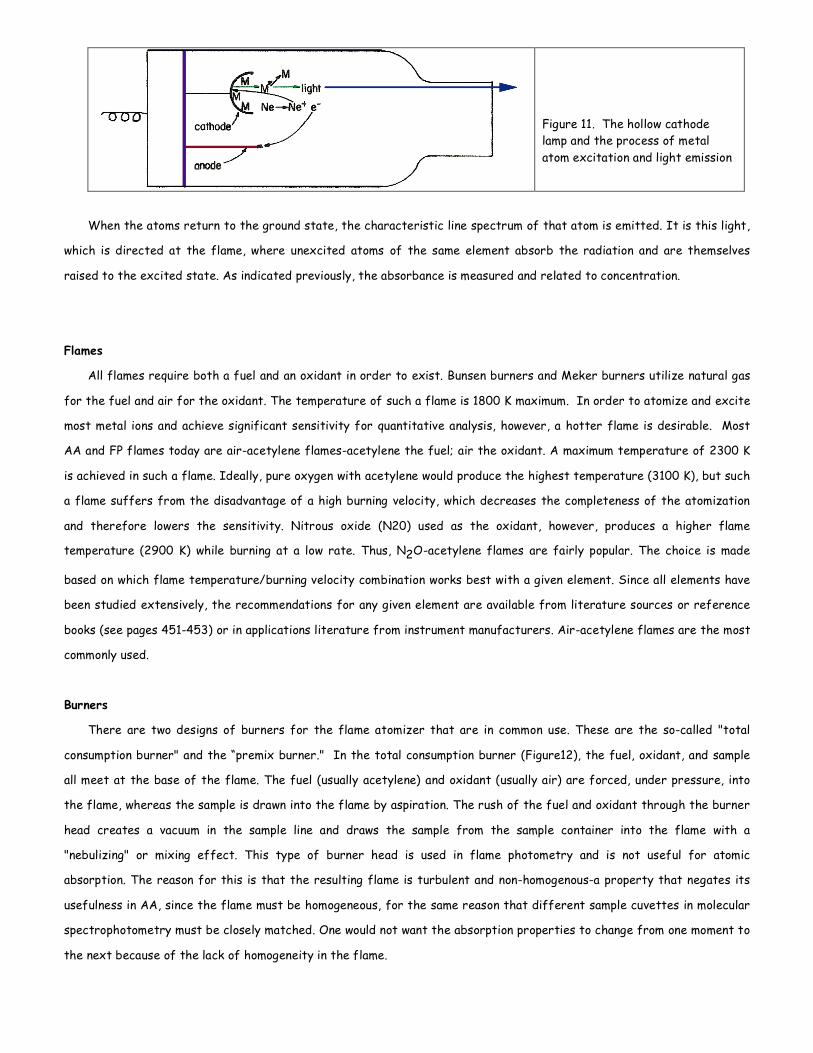
Figure 11. The hollow cathode lamp and the process of metal atom excitation and light emission
When the atoms return to the ground state, the characteristic line spectrum of that atom is emitted. It is this light,
which is directed at the flame, where unexcited atoms of the same element absorb the radiation and are themselves
raised to the excited state. As indicated previously, the absorbance is measured and related to concentration.
Flames
All flames require both a fuel and an oxidant in order to exist. Bunsen burners and Meker burners utilize natural gas
for the fuel and air for the oxidant. The temperature of such a flame is 1800 K maximum. In order to atomize and excite
most metal ions and achieve significant sensitivity for quantitative analysis, however, a hotter flame is desirable. Most
AA and FP flames today are air-acetylene flames-acetylene the fuel; air the oxidant. A maximum temperature of 2300 K
is achieved in such a flame. Ideally, pure oxygen with acetylene would produce the highest temperature (3100 K), but such
a flame suffers from the disadvantage of a high burning velocity, which decreases the completeness of the atomization
and therefore lowers the sensitivity. Nitrous oxide (N20) used as the oxidant, however, produces a higher flame
temperature (2900 K) while burning at a low rate. Thus, N2O-acetylene flames are fairly popular. The choice is made
based on which flame temperature/burning velocity combination works best with a given element. Since all elements have
been studied extensively, the recommendations for any given element are available from literature sources or reference
books (see pages 451-453) or in applications literature from instrument manufacturers. Air-acetylene flames are the most
commonly used.
Burners
There are two designs of burners for the flame atomizer that are in common use. These are the so-called "total
consumption burner" and the “premix burner." In the total consumption burner (Figure12), the fuel, oxidant, and sample
all meet at the base of the flame. The fuel (usually acetylene) and oxidant (usually air) are forced, under pressure, into
the flame, whereas the sample is drawn into the flame by aspiration. The rush of the fuel and oxidant through the burner
head creates a vacuum in the sample line and draws the sample from the sample container into the flame with a
"nebulizing" or mixing effect. This type of burner head is used in flame photometry and is not useful for atomic
absorption. The reason for this is that the resulting flame is turbulent and non-homogenous-a property that negates its
usefulness in AA, since the flame must be homogeneous, for the same reason that different sample cuvettes in molecular
spectrophotometry must be closely matched. One would not want the absorption properties to change from one moment to
the next because of the lack of homogeneity in the flame.

Figure 12. The cross-sectional view of a total consumption burner (nebulizer). The fuel, oxidant and sample all meet at the base of the flame.
The premix burner does away with this difficulty and is the burner typically used in AA. The sample is nebulized and
mixed with the fuel and oxidant prior to introduction into the flame, with the use of a series of baffles. Figure 13 is a
diagram of this design. Here also the sample is drawn from the sample container via the vacuum created by the rushing
fuel and oxidant (aspiration). A drain line is required in this design in order to remove sample solution droplets that do not
make it all the way to the flame. See the section entitled "Important Experimental Considerations" for a discussion of a
potential safety hazard associated with this.
Figure 13. The cross-sectional view the premix burner (nebulizer). The fuel, oxidant and sample all meet at the base of the flame and is premixed prior to entering the flame.
Most instruments are equipped to accept a variety of fuels and oxidants. As the gas combinations are varied (see
previous discussion), it is usually necessary to change the burner head to one suitable for the particular combination
chosen. A faster burning mixture would require a burner head with a smaller slot so as to discourage burning (explosion!)
inside the head of a premix burner.
Readout Components
As with molecular spectrophotometry, the readout of the absorbance and transmittance data can consist of either a
meter, a recorder or digital readout. The meter can be calibrated in either % transmittance (or % absorption 100 %T) or
absorbance, or possibly both. If %T or % absorption are displayed, these of course must first be converted to absorbance
(-log T) before plotting.
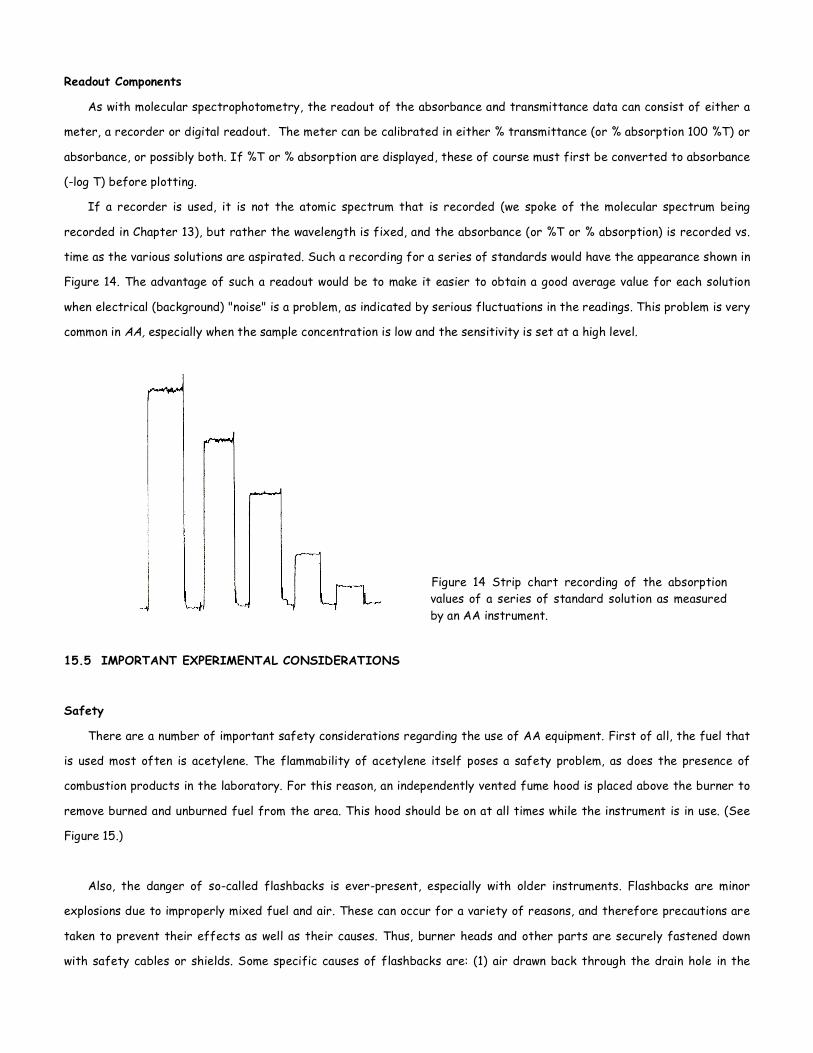
If a recorder is used, it is not the atomic spectrum that is recorded (we spoke of the molecular spectrum being
recorded in Chapter 13), but rather the wavelength is fixed, and the absorbance (or %T or % absorption) is recorded vs.
time as the various solutions are aspirated. Such a recording for a series of standards would have the appearance shown in
Figure 14. The advantage of such a readout would be to make it easier to obtain a good average value for each solution
when electrical (background) "noise" is a problem, as indicated by serious fluctuations in the readings. This problem is very
common in AA, especially when the sample concentration is low and the sensitivity is set at a high level.
Figure 14 Strip chart recording of the absorption values of a series of standard solution as measured by an AA instrument.
15.5 IMPORTANT EXPERIMENTAL CONSIDERATIONS
Safety
There are a number of important safety considerations regarding the use of AA equipment. First of all, the fuel that
is used most often is acetylene. The flammability of acetylene itself poses a safety problem, as does the presence of
combustion products in the laboratory. For this reason, an independently vented fume hood is placed above the burner to
remove burned and unburned fuel from the area. This hood should be on at all times while the instrument is in use. (See
Figure 15.)
Also, the danger of so-called flashbacks is ever-present, especially with older instruments. Flashbacks are minor
explosions due to improperly mixed fuel and air. These can occur for a variety of reasons, and therefore precautions are
taken to prevent their effects as well as their causes. Thus, burner heads and other parts are securely fastened down
with safety cables or shields. Some specific causes of flashbacks are: (1) air drawn back through the drain hole in the
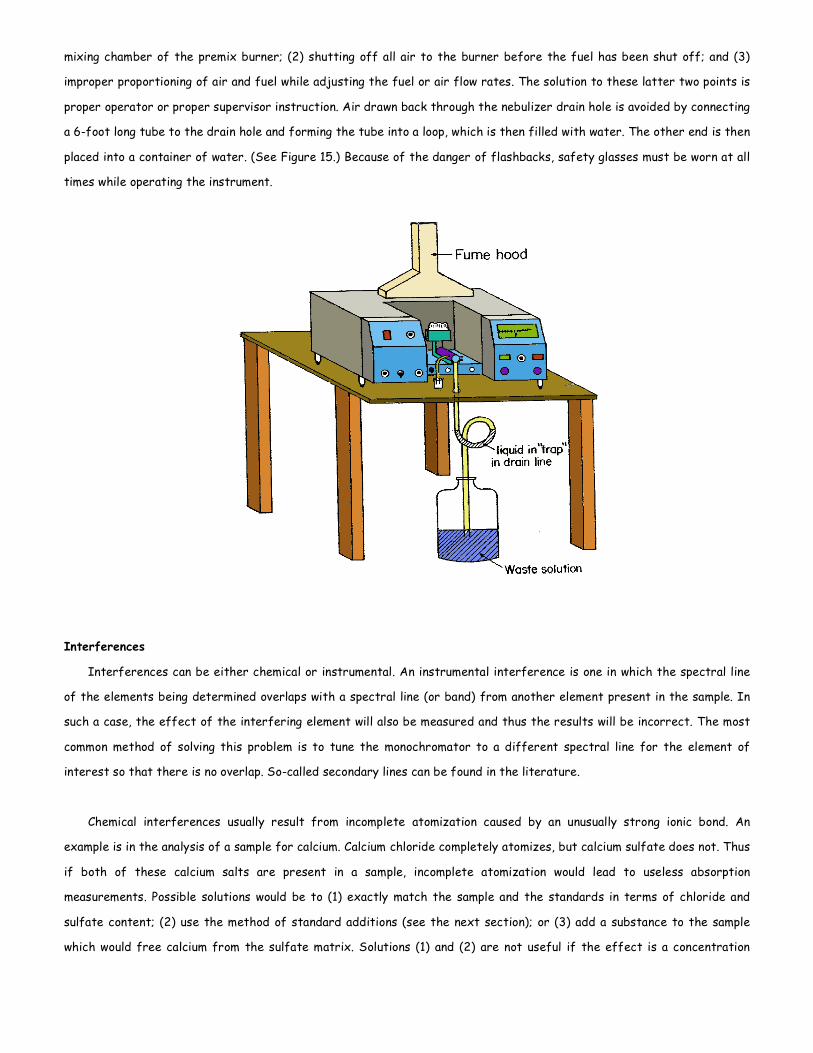
mixing chamber of the premix burner; (2) shutting off all air to the burner before the fuel has been shut off; and (3)
improper proportioning of air and fuel while adjusting the fuel or air flow rates. The solution to these latter two points is
proper operator or proper supervisor instruction. Air drawn back through the nebulizer drain hole is avoided by connecting
a 6-foot long tube to the drain hole and forming the tube into a loop, which is then filled with water. The other end is then
placed into a container of water. (See Figure 15.) Because of the danger of flashbacks, safety glasses must be worn at all
times while operating the instrument.
Interferences
Interferences can be either chemical or instrumental. An instrumental interference is one in which the spectral line
of the elements being determined overlaps with a spectral line (or band) from another element present in the sample. In
such a case, the effect of the interfering element will also be measured and thus the results will be incorrect. The most
common method of solving this problem is to tune the monochromator to a different spectral line for the element of
interest so that there is no overlap. So-called secondary lines can be found in the literature.
Chemical interferences usually result from incomplete atomization caused by an unusually strong ionic bond. An
example is in the analysis of a sample for calcium. Calcium chloride completely atomizes, but calcium sulfate does not. Thus
if both of these calcium salts are present in a sample, incomplete atomization would lead to useless absorption
measurements. Possible solutions would be to (1) exactly match the sample and the standards in terms of chloride and
sulfate content; (2) use the method of standard additions (see the next section); or (3) add a substance to the sample
which would free calcium from the sulfate matrix. Solutions (1) and (2) are not useful if the effect is a concentration
effect i.e., if the problem increases with increasing calcium concentration. The Beer's Law plot would not be linear in that
case. In addition, the sensitivity is lessened due to the fact that that not all the calcium present is being measured.
Alternative (3), however, is useful, and entirely possible. The perfect example of this added substance is the element
lanthanum. It may seem an unusual application of this inner-transition metal, but lanthanum sulfates are more stable than
calcium sulfates, and thus with lanthanum ions present in the solution, the sulfate binds with the lanthanum and calcium
ions are free to atomize. Lanthanum is used in a significant number of determinations for this very reason.
Method of Standard Additions
Due to the effects of other constituents in a sample, such as we have just noted in the previous section and in
previous chapters, it is always desirable to match the blank and standards to the sample as much as possible. With AA, the
sample preparation is frequently so simple that samples to be tested are aspirated directly into the flame and measured.
One can imagine, for example, an environmental water sample (from a well, creek, pond, etc.) being brought into the lab
and aspirated directly into the flame. In a case such as this, one may have no quantitative idea as to what the total, or
even partial matrix composition might be, and thus blank and standards compositions which do not match the sample
matrix are prepared, and the analysis results cannot be considered reliable.
The solution to this problem is to use the method of standard additions. In this method, small amounts of a standard
solution of the element being determined are added to the sample and the absorbance measured after each addition. In
this way, the sample matrix is always present, and interfering sample components affect the observance equally with each
measurement. Therefore there is no effect on the outcome and the total sample composition need not be known.
The plotting procedure and the use of the graph for obtaining the sample concentration is altered somewhat,
however, The Beer's Law plot is a graph of A vs. concentration added. Since the element being determined is present in
the sample from the start, a bona fide absorbance reading is measured for the sample to which nothing has been added.
As more and more analyte is added, the absorbance reading simply increases (linearly) so that a graph, which does not
intersect zero (at zero added concentration) is plotted. (See Figure 16.) Extrapolation of the graph to zero absorbance, as
shown, results in a length of x-axis, on the negative side of zero added, which represents the concentration in the
unknown.

Figure16. Sample data and graph for a “standard addition” experiment in AA.
This method can be used in cases in which there is some sample preparation as well; for example, in cases in which
lanthanum needs to be added. Once the pretreatment establishes the sample matrix, the standard additions can be
performed and data obtained and graphed.
Since some sample is consumed by the instrument during each aspiration, and since there can be a significant dilution
effect when making the additions, the standard addition method could result in an error due to concentration changes
that result. One way to partially compensate is to prepare a series of standard solutions using the sample matrix as the
diluent. With either method, volumes of the highly concentrated solution of the analyte (e.g. 1000 ppm) can be quite small
(on the order of microliters) so that the dilution effect is negligible. A correction factor for the dilution can also be
calculated.
A wide variety of sample matrices are acceptable to AA equipment. These include high concentration of acids as well
as organic solvents. The method of standard additions aids in the nullification of any problems associated with such
matrices, such as high viscosity or the highly efficient burning of organic compounds. If the method of standard additions
is not used, the importance of matching the sample to the standards in terms of organic solvents is paramount.
Maintenance
Finally, periodic cleaning of the burner head and nebulizer is needed to ensure minimal noise level due to impurities in
the flame. Scraping the slot in the burner head with a sharp knife to remove carbon deposits and/or removing the burner
head for the purpose of cleaning in an ultrasonic bath are two commonplace maintenance chores.
The nebulizer should be disassembled and inspected and cleaned periodically to remove impurities that may be
collecting there.
15.6 VARIATIONS OF BASIC AA AND FP
The Graphite Furnace Atomizer
A non-flame type of atomizer has been found acceptable for AA units and indeed offers some advantages. This is a
small high-temperature furnace known as a graphite furnace. There are several different designs, but basically this
furnace is a small cylindrically shaped furnace with a sample injection port at the top. The light to be absorbed enters one
end of the cylinder and emerges through the other end. The sample solution (from 1-100 uL) is syringe-injected into the
furnace through the injection port. The high temperature of the furnace (about 2500oC) is reached in stages, ultimately
resulting in atomization as in the flame. The atomized metal species then absorbs the light, and the absorption is
measured.
One obvious difference between the furnace and the flame is that, contrary to the flame, the sample is not
continuously fed into the furnace and the sample distribution is neither homogeneous nor reproducible. Thus, a furnace
offers greater sensitivity (because more atoms can be placed in the path of the light) and requires less sample, but
sometimes suffers from lack of accuracy and precision. Thus, the graphite furnace should be used only when the sample
size is small and/or when the greater sensitivity is needed.
Inductively Coupled Plasma (ICP)
One atomic emission method that has received a great deal of attention recently is the Inductively Coupled Plasma
method, better known as the ICP. As the name implies, an inductively coupled plasma is the source of the emission. This
source consists of an induction coil and a plasma.
An induction coil is a coil of wire that has an alternating (oscillating) current flowing through it. Quite simply, this
current induces a magnetic field around and especially inside the coil, which can be quite strong under the right conditions,
coupling a great deal of energy to charged particles inside the coil.
In the ICP source, this coil is wrapped around a quartz tube through which flows a "plasma." A plasma is a collection
of charged particles capable, by virtue of their charge, of interacting with a magnetic field.
Specifically, in this case, the plasma consists of a stream of argon gas that has been partially ionized by a "Tesla" coil
prior to entering the tube. The interaction of the induced magnetic field with the argon plasma produces more argon
ionizations and an extremely hot flame-like emission that is the ICP. With respect to the measurement of sample
solutions, the procedure is an aspiration procedure, similar to FP and flame AA, in which the solution is aspirated into the
flowing argon prior to entering the quartz tube. The net result is an extremely high temperature (9,000-10,000 K) "flame"
that is capable of producing very intense emissions from atomized and excited atoms from the sample solution.
Being an emission technique, it is very useful for qualitative analysis, especially given the greater intensity of emission
lines compared to FP. However, its major advantages lie in quantitative analysis. The linear range for I vs. c plots is much
greater and thus sample solutions can be analyzed accurately over broader concentration ranges. In addition, given the
increase in the emission intensity at the higher temperature, the sensitivity is much greater. Finally, simultaneous
"multielement" analysis of one sample is possible. A disadvantage, perhaps, is the high cost of the equipment compared to
AA and FP.
Atomic Fluorescence
When atoms that have been elevated to higher energy levels return to the ground state, the pathway could take them
to some intermediate electronic states prior to the final drop. Such a series of drops back to the ground state, if
accompanied by light emission, is a form of fluorescence. We can it atomic fluorescence. As with molecular fluorescence,
the intensity of this emitted light is measured at right angles to the incident light and related to concentration.
Are or Spark Emission Spectrography
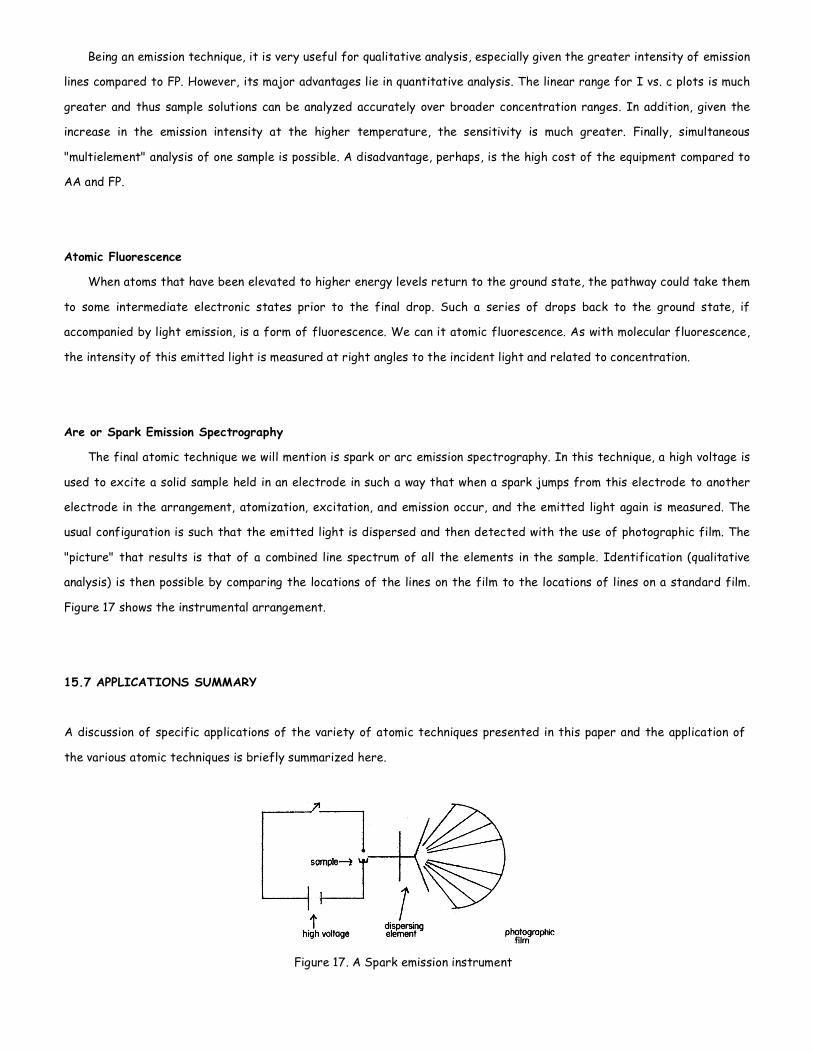
The final atomic technique we will mention is spark or arc emission spectrography. In this technique, a high voltage is
used to excite a solid sample held in an electrode in such a way that when a spark jumps from this electrode to another
electrode in the arrangement, atomization, excitation, and emission occur, and the emitted light again is measured. The
usual configuration is such that the emitted light is dispersed and then detected with the use of photographic film. The
"picture" that results is that of a combined line spectrum of all the elements in the sample. Identification (qualitative
analysis) is then possible by comparing the locations of the lines on the film to the locations of lines on a standard film.
Figure 17 shows the instrumental arrangement.
15.7 APPLICATIONS SUMMARY
A discussion of specific applications of the variety of atomic techniques presented in this paper and the application of
the various atomic techniques is briefly summarized here.
Figure 17. A Spark emission instrument
The most important and obvious point to be made is that these techniques are indeed atomic. This means that they
cannot be applied to analytes that are molecular in nature. Atomic techniques are limited to ions of metals-those species,
which can be atomized. Ions of nonmetals can be analyzed too, but only by an indirect method. An example would be the
determination of chloride by measuring the silver ion before and after precipitation of the chloride. Silver can be
measured directly; chloride cannot.
Flame AA
This technique has been the most popular of all atomic techniques over the last 20 years, and continues to be so,
given the expense of the improved techniques, such as ICP. The instrumentation technology has been in place for a long
time and advantages, disadvantages, and sensitivities for particular metals are well known.
Graphite Furnace AA
This technique should be used only when the sample size is small and/ or when a greater sensitivity is needed. It
should not be used when ordinary flame AA would do as well, since there are disadvantages relating to sample size and
precision.
Flame Photometry
There is no real clear-cut advantage or disadvantage of this technique. In terms of sensitivity, some metals are
better analyzed by FP than by AA. However, there is an equal number that are better analyzed by AA. Also, there are a
number of metals that are analyzed with about equal sensitivity.
ICP
As previously stated, this technique offers many advantages over the others. Increases in sensitivity and linear
range are the most important. The instruments, however, are more costly.
Atomic Fluorescence
This technique does offer some advantages, especially in terms of sensitivity, in a few cases but has not "caught on,"
since the other instruments are so available and popular.
Spark or Are Emission
This technique requires a solid sample and is very useful for qualitative analysis. Quantitative analysis procedures,
however, have been documented, but are less popular than the others, given the need for a solid sample and difficulties
in preparing homogeneous solid standards. Also, reproducing excitation conditions for a series of standards and the
samples is difficult.