printed on recycled paper -...
TRANSCRIPT

YEAR ENDED AUGUST 28, 2005
AnnualReport2005
2005
AnnualReport2005
PRINTED ON RECYCLED PAPER

THE COMPANY
Costco Wholesale Corporation (“Costco” or the “Company”) began operations in 1983 in Seattle, Wash-ington. In October 1993, Costco merged with The Price Company, which had pioneered the membership ware-house concept in 1976, to form Price/Costco, Inc., a Delaware corporation. In January 1997, after the spin-off ofmost of its non-warehouse assets to Price Enterprises, Inc., the Company changed its name to Costco Companies,Inc. On August 30, 1999, the Company reincorporated from Delaware to Washington and changed its name toCostco Wholesale Corporation, which trades on the NASDAQ under the symbol “COST”.
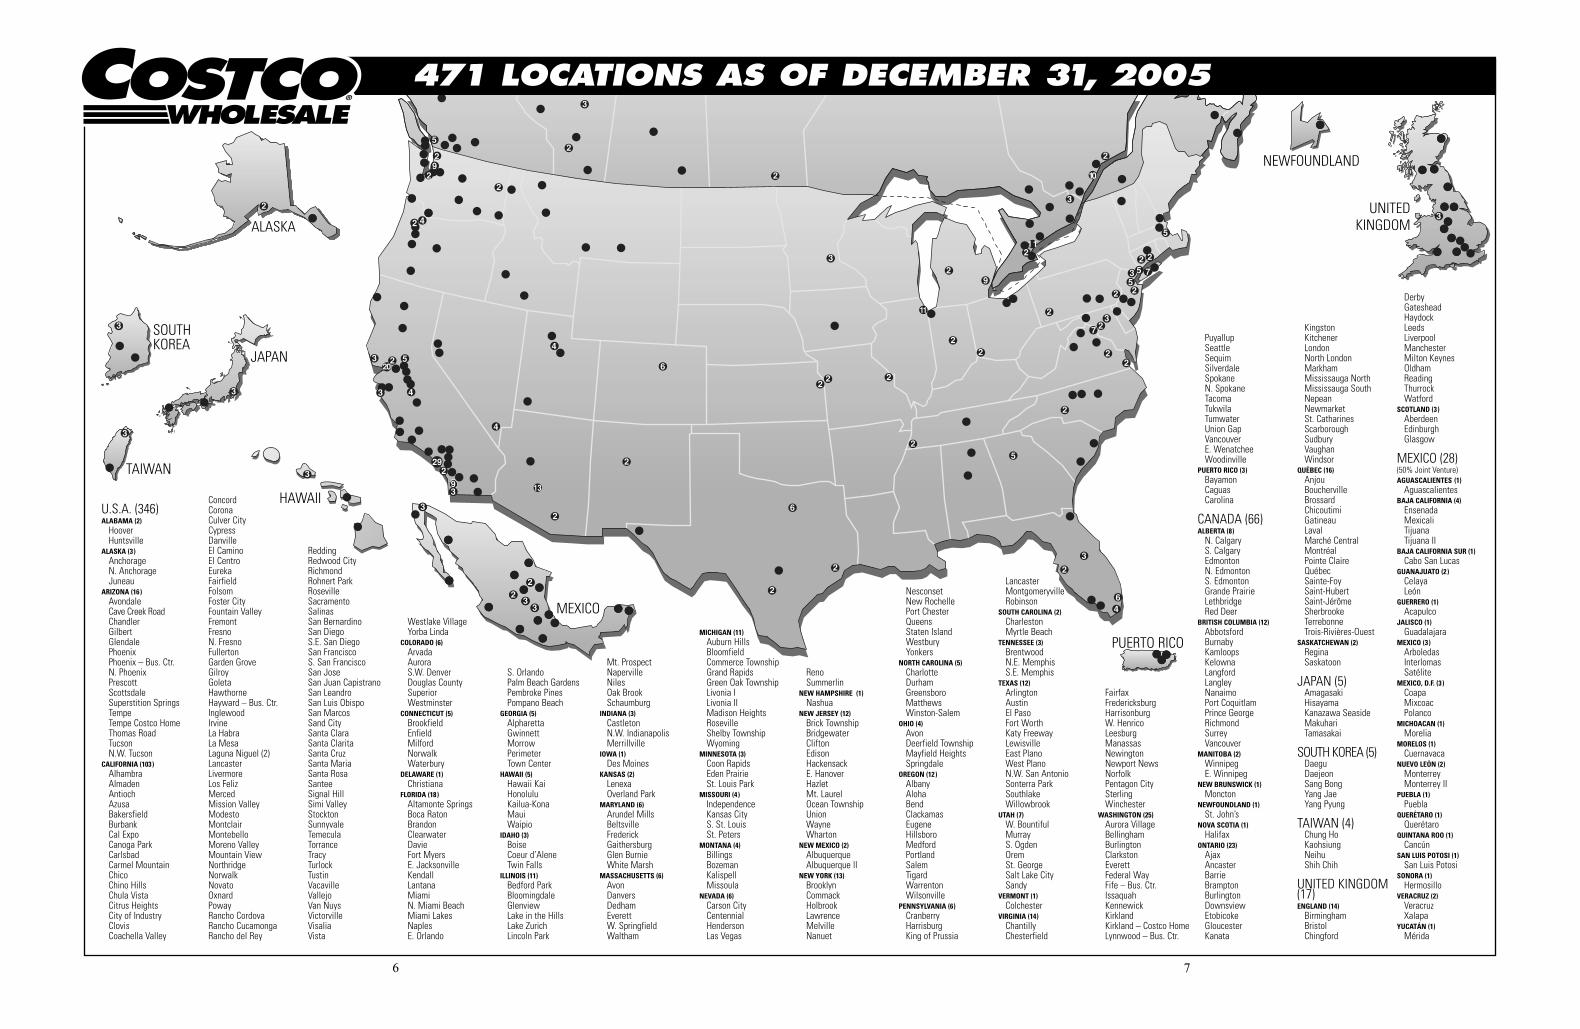
As of December 2005, the Company operated a chain of 471 warehouses in 37 states and Puerto Rico (346locations), nine Canadian provinces (66 locations), the United Kingdom (17 locations), Korea (five locations),Taiwan (four locations, through a 50%-owned subsidiary) and Japan (five locations), as well as 28 warehouses inMexico through a 50%-owned joint venture.
CONTENTS
Financial Highlights . . . . . . . . . . . . . . . . . . . . . . . . . . . . . . . . . . . . . . . . . . . . . . . . . . . . . . . . . . . . . . . . . . . . . . 1
Letter to Shareholders . . . . . . . . . . . . . . . . . . . . . . . . . . . . . . . . . . . . . . . . . . . . . . . . . . . . . . . . . . . . . . . . . . . . . 2
Map of Warehouse Locations . . . . . . . . . . . . . . . . . . . . . . . . . . . . . . . . . . . . . . . . . . . . . . . . . . . . . . . . . . . . . . . 6
Business Overview . . . . . . . . . . . . . . . . . . . . . . . . . . . . . . . . . . . . . . . . . . . . . . . . . . . . . . . . . . . . . . . . . . . . . . . 8
Number of Warehouses/Ancillary Businesses . . . . . . . . . . . . . . . . . . . . . . . . . . . . . . . . . . . . . . . . . . . . . . . . . . 11
Market for Costco Common Stock . . . . . . . . . . . . . . . . . . . . . . . . . . . . . . . . . . . . . . . . . . . . . . . . . . . . . . . . . . . 12
Dividend Policy . . . . . . . . . . . . . . . . . . . . . . . . . . . . . . . . . . . . . . . . . . . . . . . . . . . . . . . . . . . . . . . . . . . . . . . . . . 13
Ten Year Operating and Financial Highlights . . . . . . . . . . . . . . . . . . . . . . . . . . . . . . . . . . . . . . . . . . . . . . . . . . 14
Management’s Discussion and Analysis of Financial Condition and Results of Operations . . . . . . . . . . . . . . . 16
Management’s Report on the Financial Statements . . . . . . . . . . . . . . . . . . . . . . . . . . . . . . . . . . . . . . . . . . . . . . 30
Management’s Annual Report on Internal Control over Financial Reporting . . . . . . . . . . . . . . . . . . . . . . . . . . 30
Certifications of CEO and CFO . . . . . . . . . . . . . . . . . . . . . . . . . . . . . . . . . . . . . . . . . . . . . . . . . . . . . . . . . . . . . 32
Report of Independent Registered Public Accounting Firm . . . . . . . . . . . . . . . . . . . . . . . . . . . . . . . . . . . . . . . . 34
Consolidated Financial Statements . . . . . . . . . . . . . . . . . . . . . . . . . . . . . . . . . . . . . . . . . . . . . . . . . . . . . . . . . . . 36
Notes to Consolidated Financial Statements . . . . . . . . . . . . . . . . . . . . . . . . . . . . . . . . . . . . . . . . . . . . . . . . . . . . 40
Directors and Officers . . . . . . . . . . . . . . . . . . . . . . . . . . . . . . . . . . . . . . . . . . . . . . . . . . . . . . . . . . . . . . . . . . . . . 62
Additional Information . . . . . . . . . . . . . . . . . . . . . . . . . . . . . . . . . . . . . . . . . . . . . . . . . . . . . . . . . . . . . . . . . . . . 65

Warehouses in Operation
At Fiscal Year End
Num
ber
of W
areh
ouse
s
450
425
2001 2002 2004
400
375
345
397
(443 at 12/31/05)
350
02005
417
433
2003
374
Net Sales
Fiscal Year
$ M
illio
ns
2001 2002 2004 2005
34,137
37,99338,000
36,000
42,000
40,000
44,000
46,000
48,000
50,000
52,000
2003
41,693
47,146
51,862
34,000
0
Net Income
Fiscal Year
$ M
illio
ns
2001 2002 2004
1,100
0
1,000
1,050
850
900
950
600
800
650
700
750
602
721
2005
882
1,063
2003
700
Comparable Sales Growth
Fiscal Year
Perc
ent
Incr
ease
2001 2002 2004 2005
10%
0%
2%
4%
6%
8%
10%
12%
7%
2003
5%
6%
4%
Average Sales Per Warehouse *(Sales In Millions)
Fiscal Year*First year sales annualized.
112
106
86
77
65
$57
$101
108
99
77
72
$57
$101
98
85
$65
58
$94
90
70
$50
$87
84
$56
$83
$77
$77433Totals
2491996 & Before
1997 10
1998 17
1999 15
2000 21
2001 32
2002 29
2003 24
2004 20
162005
Whses*Opened# ofYear
117
113
97
82
77
63
$58
$103
121
115
105
86
85
72
62
$105
$67
132
124
120
91
98
84
77
$115
79
$72
2005
138
131
99
107
127
94
88
91
81
$63
Selling, General and Administrative Expenses
Fiscal Year
Perc
ent
of N
et S
ales
2001 2002 20030
10.0%
9.75%
9.50%
9.25%
9.41%
9.17%
2004
9.83%
2005
9.75% 9.73%
9.0%
Fiscal Year
2001 2002 2004
4.636
4.358
4.2
4.4
4.6
4.8
5.0
5.2
02005
4.810
5.050
2003
4.476
Business Members
Fiscal Year
Mill
ions
Mill
ions
2001 2002 2004
12.737
14.984
0
14
16
13
15
18
17
2005
15.018
16.233
2003
14.597
Gold Star Members
Membership
12
FINANCIAL HIGHLIGHTS
1
20042002 200320011999 200019981996 1997
$120

December 14, 2005
Dear Costco Shareholders,
Costco has now completed 22 years in business, and we are proud to have achieved several milestones dur-ing this past fiscal year. Our sales exceeded $50 billion ($51.9 billion in fiscal 2005), and our net profit toppedthe $1 billion mark ($1.063 billion), both historical records for our Company. Our comparable sales, sales forunits opened for more than twelve months, were a healthy 7% for the fiscal year, and in the first three months offiscal 2006 (September, October and November) our comparable sales continued at a strong pace of 9%. We areproud of the fact that in the 267 months we have been in business, Costco has never reported a negative “compsales” figure.
One of the drivers for our success continues to be our outstanding sales volumes per warehouse, which leadthe industry at nearly double those of our nearest club competitor. Our average sales for fiscal 2005 were $120million per building ($124 million at U.S. locations only); and we had twenty-five warehouses with sales exceed-ing $200 million, with one topping $300 million! There are many additional Costco warehouses nearing thesefigures, and we expect to see these numbers rise again next year.
Our gross margin remained strong in fiscal 2005 despite our on-going goal of bringing quality goods tomarket at the lowest possible prices. Control over our inventory is paramount to our success: exciting, high-quality merchandise, high inventory turns and low inventory shrinkage. Our shrink numbers, we believe, are notonly the lowest in our industry, but they were the lowest in Costco history, well below .20% for fiscal 2005. Inaddition, our continued emphasis on cost controls and expense reduction enabled us to reduce our selling, generaland administrative (SG&A) expenses as a percent of sales for the second year in a row—from 9.75% to 9.73%.
We remain committed to expansion, both domestically and abroad, and our success can be measured. Lastyear we were the fifth largest retailer in the United States and the eleventh largest in the world. This year we arethe fourth largest retailer in the U.S. and the ninth largest worldwide; and we are at number 29 in the Fortune500. Costco completed fiscal 2005 with 460 warehouses operating in 37 U.S. states, Puerto Rico and seven addi-tional countries, including 27 units in Mexico, where we operate with a joint venture partner. We opened 24buildings in fiscal 2005: fourteen were in the U.S., four in Canada, one each in the United Kingdom, Taiwan andJapan, and three in Mexico. Five were relocations, where we replaced an older building with a new, larger unit tobetter serve our members and increase sales. This gave us a net increase of nineteen new warehouses worldwidein fiscal 2005.
We have had a lot of success in increasing market share in existing communities where we operate. Ourmembership penetration is as high as two-thirds of the households in some key Costco markets; and we are con-vinced there is still a lot of room for increased membership growth and sales penetration. We currently have 45.3million loyal members, with an industry-leading 86% renewal rate. Our Executive Membership category con-tinues to expand and currently has 4.2 million members.
We continue to add buildings in our successful markets, and without exception we find that our new loca-tions help us grow our business and add significantly to our sales in the local area. When we open a warehousecloser to where people live and work, they shop more frequently; and we anticipate continued strong growth in“infill” markets in the years to come.
In the United States this past fiscal year, we opened infill buildings in Cypress, California; Mount Prospect,Illinois; Eden Prairie, Minnesota; Mount Laurel, New Jersey; Alpharetta, Georgia; Green Oak Township, Michi-gan; Woodinville, Washington; and a Costco Home in Tempe, Arizona. New U.S. market openings in 2005 wereWest Des Moines, Iowa; and Grand Rapids East and Wyoming, Michigan. We relocated older buildings to new,larger warehouses in Chula Vista and Fremont, California; but the relocation most dear to our hearts was the newSeattle #01 Costco which we opened in March, replacing our very first Costco unit, originally opened in Sep-tember 1983, near downtown Seattle.
2

In Canada, our infills were in Boucherville, Quebec and Langley, British Columbia; and we relocated ourSouth Edmonton and Mississauga, Ontario warehouses to newer, larger facilities. Overseas, we opened in a newmarket in Kanazawa Seaside, Japan, as well as added infill buildings in Chung Ho, Taiwan and Bristol, England.
Our goal is to open twenty-five to thirty new locations in fiscal 2006, and we are already well on our way.So far we have added eight new U.S. warehouses since the end of fiscal 2005 in August, all of which are infillbuildings except San Luis Obispo, California. They are in Pembroke Pines, Florida; Centennial, Nevada; Phoenixand Chandler, Arizona; Hillsboro, Oregon; West Bountiful, Utah; and San Luis Obispo and La Habra, California.We also replaced our Kalispell, Montana warehouse with a new unit, bringing our current fiscal 2006 U.S. open-ings to nine.
Internationally, we continue our expansion and are seeing increasing success in each of the countries wherewe do business. We started fiscal 2006 by opening warehouses in new markets in Milton Keynes, England andVeracruz, Mexico, and we plan to open five to seven more international locations before the end of fiscal 2006.
At the same time, we are mindful of growing our infrastructure to support our warehouse operations. Webuilt a new, state-of-the-art meat plant in Tracy, California last Spring, enabling us to meet and exceed the latestfederal regulations for meat safety and significantly increasing our production capacity and efficiency. The150,000 square-foot facility can hold up to three million pounds of frozen meat and enables us to process 20,000pounds an hour. This fall we opened two new depots—one in Langley, British Columbia and one in Salt LakeCity, Utah. Both are cross-docking facilities with the latest in high-tech systems to give us additional cost andtime efficiencies in shipping products to our warehouses.
We have built our business on the excitement generated by truly great merchandising. In simple terms, thatmeans we source the right products at the right prices, stock them at the right time in the right place in our build-ings, and ensure that they are of high quality and in good condition. Our members love the treasure-hunt atmos-phere we create in our warehouses, where they can come in for a roll of paper towels and leave with a cart full ofhigh-value goods, everything from fine diamonds to fine wines to the latest high-tech toys. Our suppliers are ourpartners in this process, and we are proud of the strong relationships we have developed with some of the finestorganizations in the world—companies like Canon, Casio, Coca Cola, Colgate-Palmolive, Dell, Fuji, HewlettPackard, Kimberly-Clark, Kodak, Lane, Levis, Michelin, Nestle, Olympus, Panasonic, Pepsi, Philips, Procter &Gamble, Toshiba and hundreds more. New supplier relationships include Adidas, Calvin Klein Home, CalvinKlein Sportswear, Carnegie Deli, Jones of New York, Kitchen Aid, Le Creuset, Lexington, Pioneer, Samsungand Sony TV.
Certainly, one of the exciting sales trends in consumer electronics today is the rapid transition to high-definition television, and we believe Costco is one of the best merchants in North America in this business. Ourfiscal 2005 sales in this product category were up 169%, and this growth increased our average sell price in theTV category by 63%. We sold over 1.5 million TVs in fiscal 2005. Costco is also capitalizing on the rapid emer-gence of digital photography, which is resulting in a host of new products and applications. Teaming our E-commerce site with our warehouses, we now have the Costco Photo Center, accessible through costco.com,where members can upload their images online and pick up prints at their local warehouse in as little as an hour.This partnership helped our 1-Hour Photo sales increase by over 10% in 2005, in a year when the industry overallshowed negative sales growth.
Our E-commerce business, costco.com, continues to grow dramatically. Fiscal 2005 sales were $534 mil-lion, a 42% increase over 2004. Costco.com has a high potential for significant growth, and we believe it canbecome a leader in the E-commerce industry. We have established ambitious goals for this business over the nextfive years, and we should see sales approaching $1 billion in the coming year. Current top sellers on costco.cominclude computers, digital cameras and furniture, and we have added other very exciting new products, includingfine art pieces such as Picasso originals, musical instruments and Suzuki pianos, wedding flowers and flowers in
3
bulk, and gourmet food items including live lobsters, prime steaks, caviar and champagne. Another way weare linking our brick and mortar buildings with our web business is through costco.com special-order kiosks,which we are installing in many of our warehouses this fall. We are seeing increasing sales of non-warehouseitems via the kiosks, such as Xbox presales, special-order tires and Dell computers. We also opened anE-commerce site in Canada in February 2005, costco.ca, which is generating a lot of enthusiasm in this veryimportant Costco market.
All of Costco’s ancillary businesses continue to draw members into our warehouses for more frequentshops, generating increasing revenue for the company. Our warehouse ancillary sales increased by more than20% in fiscal 2005 to more than $6.5 billion. Because of our excellent service, pricing and safety standards, wereceive a lot of positive media response. Our pharmacies have been featured in primetime news programs innearly every major U.S. market where we operate, showcasing that our prices on prescription drugs, particularlygeneric drugs, are always the best in the market place, often by as much as 80% to 90% less than at other stores.With 331 pharmacy locations, we filled over 21 million prescriptions in fiscal 2005 and our sales rose nearly12%. Our signature fresh foods departments are favorites in all the locations around the world where we do busi-ness, because we offer the highest quality and greatest value on our total product selection, presented in an envi-ronment where we demand high standards of food safety. We sold almost twenty-five million rotisserie chickensin the U.S. alone this past fiscal year—that’s nearly 500,000 chickens a week! Our whole pizza sales were up13%, and our Caesar salad sales were up 28%. And, of course, our $1.50 hot dog/soda pop combo is legendary;we sold over one million of these each week in fiscal 2005.
Costco Home, the Company’s free-standing, high-end furniture warehouse business, opened its second fa-cility this year in Tempe, Arizona. Opening day sales were the eighth largest first-day sales results in Costco his-tory. Sales from the two buildings represent a 132% increase over 2004 sales, and profits are up significantly,showing a strong growth potential for this venture. The Company plans to open a third Costco Home unit in late2006.
At the end of fiscal 2005, we had 225 gas stations pumping out the lowest-priced gasoline in virtually everymarket where we operate. Members are willing to wait in line to get gas, knowing that Costco will give them thebest value in town. We had gasoline sales of more than $3 billion in fiscal 2005, an increase of 32% over fiscal2004, and we made a profit despite the turbulent market.
The Company’s private label Kirkland Signature products have earned brand name status around the worldand provide unparalleled value to our members, where we strive to provide a minimum of 20% savings comparedto Costco’s price on the leading national brand. We currently have nearly 400 Kirkland Signature items and be-lieve we can add several hundred more in the next five years. New and upcoming items include Kirkland Sig-nature cosmetics, co-branded with the upscale Borghese brand, as well as diapers, beauty bars, organic peanutbutter, and numerous other items.
As founders of this Company, our greatest sense of satisfaction and pride is with the management team wehave assembled that is completely capable of operating our business. Costco is led by one of the most stable andskilled management teams in the retail industry. Many of our executives have been with us for twenty or moreyears (our senior officers, thirty-four in number, average nearly twenty years with Costco; and our 460 ware-house managers average fifteen and one-half years). They are well compensated and highly sought after, and theystay with our Company. In fact, employee loyalty is strong at all levels of our company, and the turnover rate ofour 115,000 employees is the lowest in big retail. We are constantly recognized for having a highly motivatedand skilled workforce that exceeds our members expectations. We are thankful for and proud of them all.
This year we spent considerable time and effort evaluating and upgrading our internal controls to be in com-pliance with regulations such as Sarbanes-Oxley 404 Internal Controls. We are pleased with our performance andwere able to enhance and streamline many of our policies and procedures as we met the extensive requirementsof these regulations.
4

We remain committed to running our Company and living conscientiously by our Code of Ethics every day:to obey the law; take care of our members; take care of our employees; respect our suppliers; and reward you, ourshareholders. You are our partners in business, and we appreciate the support and confidence that you haveplaced in all of us. As Costco’s founders, we want you to know that our ongoing goal is to reward our share-holders, and we personally join our fellow employees in striving for excellence day in and day out, in every as-pect of our business. The results speak for themselves. Our stock has grown at a compounded annual rate of 17percent a year over the past 10 years, and we increased our dividends to our shareholders by 15% in 2005—from$.10 per quarter to $.115 per quarter—paying out $200 million in fiscal 2005. Additionally, over the past sevenmonths, we have repurchased approximately 16.7 million shares of Costco stock at an aggregate purchase priceof $772.6 million, or $46.37 per share. We believe this will have positive shareholder value implications, partic-ularly given our strong cash and cash flow positions, which can more than accommodate our planned expansionplans.
We are in business not for the short term, but for the long haul. Our strategy aims at expanding our oper-ations and increasing our sales and profits over the succeeding years. As our partners, you can be certain that weare committed to operating our Company with integrity and the highest standards of fiduciary responsibility. Ourcash flow is strong, and we added to our cash balances even after spending $1 billion in capital expenditures(primarily for new warehouse and depot openings), retiring $300 million in debt, and buying back $413 millionworth of stock in fiscal 2005.
We are never satisfied with the status quo, and recognize that we have many opportunities for improvement.We are constantly working toward improving our existing business, while creating new avenues to expand ourbusiness for long-term growth and success. We look forward to seeing many of you, discussing our results forfiscal 2005 and sharing our vision for the future of Costco, at our Annual Meeting of Shareholders on January 25,2006 in Bellevue, Washington.
Finally, while we recognize that fiscal 2005 was a great year in so many ways for our Company, we mustalso acknowledge that the past twelve months were filled with many tragedies and challenges throughout theworld. From the tsunami in Southeast Asia last December, to hurricanes Katrina, Rita and Wilma, to thedevastating earthquakes that hit Pakistan in October, we share in the grief that has befallen so many. In additionto the Company’s scheduled fiscal 2005 charitable giving of nearly $14 million, an additional $2.4 million ($2million in cash and over $400,000 in products such as water, wipes and diapers) was contributed to relief agen-cies working on the front lines of these terrible tragedies. Further, we are most proud that an additional $11.7million was collected at our warehouse registers, representing contributions from many of our members and em-ployees. These contributions, together with so many more contributions from companies and individualsthroughout the world, should make us all be thankful for what we have and be hopeful that each and every con-tribution can help those less fortunate.
Many thanks for your ongoing support and confidence, and best wishes for a wonderful Holiday Season anda prosperous, happy and healthy New Year.
Warm Regards,
Jeff BrotmanChairman of the Board
Jim SinegalPresident & CEO
5
42
4
6
4
9
2
3
2
2
11
3
5
3
2
3
2
3 5
3
7
3
2
2
3
5
7 2
2
23
3
3
2
2
3
33
5
2
5
5
3
4
9
9
2
6
2
2
2
22
2
2 22
3
2
2 2
2
2
46
29
20
13
11
2
2 2
3
2
10
2
U.S.A. (346)ALABAMA (2)
HooverHuntsville
ALASKA (3)AnchorageN. AnchorageJuneau
ARIZONA (16)Avondale
ChandlerGilbertGlendalePhoenix Phoenix – Bus. Ctr.N. PhoenixPrescottScottsdaleSuperstition SpringsTempeTempe Costco HomeThomas RoadTucsonN.W. Tucson
CALIFORNIA (103)AlhambraAlmadenAntioch AzusaBakersfieldBurbankCal Expo Canoga ParkCarlsbadCarmel MountainChico Chino Hills Chula VistaCitrus HeightsCity of IndustryClovisCoachella Valley
ConcordCoronaCulver CityCypressDanvilleEl CaminoEl CentroEureka FairfieldFolsomFoster CityFountain ValleyFremontFresnoN. FresnoFullertonGarden GroveGilroyGoletaHawthorneHayward – Bus. Ctr.InglewoodIrvineLa HabraLa MesaLaguna Niguel (2)LancasterLivermoreLos Feliz MercedMission ValleyModestoMontclairMontebelloMoreno ValleyMountain ViewNorthridgeNorwalkNovatoOxnardPowayRancho CordovaRancho CucamongaRancho del Rey
ReddingRedwood CityRichmond Rohnert ParkRosevilleSacramentoSalinasSan BernardinoSan DiegoS.E. San DiegoSan FranciscoS. San FranciscoSan Jose San Juan CapistranoSan LeandroSan Luis ObispoSan MarcosSand CitySanta ClaraSanta ClaritaSanta Cruz Santa Maria Santa RosaSanteeSignal HillSimi ValleyStocktonSunnyvaleTemeculaTorranceTracyTurlockTustinVacavilleVallejoVan Nuys VictorvilleVisaliaVista
Westlake VillageYorba Linda
COLORADO (6)ArvadaAuroraS.W. DenverDouglas CountySuperiorWestminster
CONNECTICUT (5)BrookfieldEnfieldMilford Norwalk Waterbury
DELAWARE (1)Christiana
FLORIDA (18)Altamonte SpringsBoca RatonBrandonClearwaterDavieFort MyersE. JacksonvilleKendallLantanaMiamiN. Miami Beach Miami LakesNaples E. Orlando
S. OrlandoPalm Beach Gardens Pembroke PinesPompano Beach
GEORGIA (5)AlpharettaGwinnett MorrowPerimeterTown Center
HAWAII (5)Hawaii Kai Honolulu Kailua-KonaMauiWaipio
IDAHO (3)BoiseCoeur d’AleneTwin Falls
ILLINOIS (11)Bedford ParkBloomingdaleGlenviewLake in the HillsLake ZurichLincoln Park
Mt. ProspectNapervilleNilesOak BrookSchaumburg
INDIANA (3)CastletonN.W. IndianapolisMerrillville
IOWA (1)Des Moines
KANSAS (2)LenexaOverland Park
MARYLAND (6)Arundel MillsBeltsvilleFrederickGaithersburgGlen BurnieWhite Marsh
MASSACHUSETTS (6)Avon DanversDedhamEverettW. SpringfieldWaltham
MICHIGAN (11)Auburn Hills Bloomfield Commerce TownshipGrand RapidsGreen Oak TownshipLivonia ILivonia IIMadison HeightsRosevilleShelby TownshipWyoming
MINNESOTA (3)Coon RapidsEden PrairieSt. Louis Park
MISSOURI (4)Independence Kansas CityS. St. LouisSt. Peters
MONTANA (4)Billings BozemanKalispellMissoula
NEVADA (6)Carson CityCentennialHendersonLas Vegas
RenoSummerlin
NEW HAMPSHIRE (1)Nashua
NEW JERSEY (12)Brick TownshipBridgewaterCliftonEdisonHackensackE. HanoverHazletMt. LaurelOcean TownshipUnionWayneWharton
NEW MEXICO (2)AlbuquerqueAlbuquerque ll
NEW YORK (13)Brooklyn Commack HolbrookLawrence MelvilleNanuet
NesconsetNew RochellePort ChesterQueens Staten IslandWestburyYonkers
NORTH CAROLINA (5)CharlotteDurhamGreensboroMatthewsWinston-Salem
OHIO (4)AvonDeerfield TownshipMayfield HeightsSpringdale
OREGON (12)AlbanyAlohaBendClackamasEugeneHillsboroMedfordPortlandSalemTigardWarrentonWilsonville
PENNSYLVANIA (6)CranberryHarrisburgKing of Prussia
LancasterMontgomeryvilleRobinson
SOUTH CAROLINA (2)CharlestonMyrtle Beach
TENNESSEE (3)BrentwoodN.E. MemphisS.E. Memphis
TEXAS (12)ArlingtonAustinEl PasoFort WorthKaty FreewayLewisvilleEast PlanoWest PlanoN.W. San AntonioSonterra ParkSouthlakeWillowbrook
UTAH (7)
MurrayS. OgdenOremSt. GeorgeSalt Lake CitySandy
VERMONT (1)Colchester
VIRGINIA (14)ChantillyChesterfield
FairfaxFredericksburgHarrisonburgW. HenricoLeesburgManassasNewingtonNewport NewsNorfolkPentagon CitySterlingWinchester
WASHINGTON (25)Aurora VillageBellingham Burlington ClarkstonEverett Federal WayFife – Bus. Ctr.Issaquah KennewickKirklandKirkland – Costco HomeLynnwood – Bus. Ctr.
PuyallupSeattleSequimSilverdaleSpokaneN. SpokaneTacomaTukwilaTumwater Union GapVancouverE. WenatcheeWoodinville
PUERTO RICO (3)BayamonCaguasCarolina
CANADA (66)ALBERTA (8)
N. CalgaryS. CalgaryEdmonton N. EdmontonS. EdmontonGrande Prairie LethbridgeRed Deer
BRITISH COLUMBIA (12)AbbotsfordBurnabyKamloops KelownaLangfordLangley Nanaimo Port Coquitlam Prince George RichmondSurreyVancouver
MANITOBA (2)WinnipegE. Winnipeg
NEW BRUNSWICK (1)Moncton
NEWFOUNDLAND (1)St. John’s
NOVA SCOTIA (1)Halifax
ONTARIO (23)AjaxAncasterBarrieBrampton BurlingtonDownsviewEtobicokeGloucesterKanata
Kingston KitchenerLondonNorth LondonMarkham Mississauga NorthMississauga SouthNepeanNewmarketSt. Catharines ScarboroughSudburyVaughanWindsor
QUÉBEC (16)AnjouBouchervilleBrossardChicoutimiGatineauLavalMarché CentralMontréalPointe Claire QuébecSainte-FoySaint-HubertSaint-JérômeSherbrookeTerrebonneTrois-Rivières-Ouest
SASKATCHEWAN (2)ReginaSaskatoon
JAPAN (5)AmagasakiHisayama Kanazawa SeasideMakuhari Tamasakai
SOUTH KOREA (5)Daegu Daejeon Sang Bong Yang Jae Yang Pyung
TAIWAN (4)Chung HoKaohsiung Neihu Shih Chih
UNITED KINGDOM(17)ENGLAND (14)
BirminghamBristolChingford
DerbyGatesheadHaydockLeedsLiverpoolManchesterMilton KeynesOldhamReadingThurrockWatford
SCOTLAND (3)AberdeenEdinburghGlasgow
MEXICO (28)(50% Joint Venture)AGUASCALIENTES (1)
AguascalientesBAJA CALIFORNIA (4)
EnsenadaMexicaliTijuanaTijuana II
BAJA CALIFORNIA SUR (1)Cabo San Lucas
GUANAJUATO (2)CelayaLeón
GUERRERO (1)Acapulco
JALISCO (1)Guadalajara
MEXICO (3)ArboledasInterlomasSatélite
MEXICO, D.F. (3)CoapaMixcoac Polanco
MICHOACAN (1)Morelia
MORELOS (1)Cuernavaca
NUEVO LEÓN (2)MonterreyMonterrey II
PUEBLA (1)Puebla
QUERÉTARO (1)Querétaro
QUINTANA ROO (1)Cancún
SAN LUIS POTOSI (1)San Luis Potosi
SONORA (1)Hermosillo
VERACRUZ (2)VeracruzXalapa
YUCATÁN (1)Mérida
NEWFOUNDLAND
471 LOCATIONS AS OF DECEMBER 31, 2005
ALASKA
TAIWAN
HAWAII
MEXICO
SOUTH KOREA
JAPAN
PUERTO RICO
UNITEDKINGDOM
76
W. Bountiful
Cave Creek Road

BUSINESS OVERVIEW
Costco operates membership warehouses based on the concept that offering members very low prices on alimited selection of nationally branded and selected private label products in a wide range of merchandisecategories will produce high sales volumes and rapid inventory turnover. This rapid inventory turnover, whencombined with the operating efficiencies achieved by volume purchasing, efficient distribution and reduced han-dling of merchandise in no-frills, self-service warehouse facilities, enables Costco to operate profitably at sig-nificantly lower gross margins than traditional wholesalers, discount retailers and supermarkets.
Costco buys the majority of its merchandise directly from manufacturers for shipment either directly to Cost-co’s selling warehouses or to a consolidation point (“depot”) where various shipments are combined so as tominimize freight and handling costs. As a result, Costco eliminates many of the costs associated with multiplestep distribution channels, which include purchasing from distributors as opposed to manufacturers, use of cen-tral receiving, storing and distributing warehouses, and storage of merchandise in locations off the sales floor. Byproviding this more cost-effective means of distributing goods, Costco meets the needs of business customerswho otherwise would pay a premium for small purchases and for the distribution services of traditional whole-salers, and who cannot otherwise obtain the full range of their product requirements from any single source. Inaddition, these business members will often combine personal shopping with their business purchases. The costsavings on brand name and selected private label merchandise are the primary motivation for individuals shop-ping for their personal needs. Costco’s merchandise selection is designed to appeal to both the business and con-sumer requirements of its members by offering a wide range of nationally branded and selected private labelproducts, often in case, carton or multiple-pack quantities, at attractively low prices.
Because of its high sales volume and rapid inventory turnover, Costco generally has the opportunity to re-ceive cash from the sale of a substantial portion of its inventory at mature warehouses before it is required to payall its merchandise vendors, even though Costco takes advantage of early payment terms to obtain payment dis-counts. As sales in a given warehouse increase and inventory turnover becomes more rapid, a greater percentageof the inventory is financed through payment terms provided by vendors rather than by working capital.
Costco’s typical warehouse format averages approximately 139,000 square feet. Floor plans are designed foreconomy and efficiency in the use of selling space, in the handling of merchandise and in the control of in-ventory. Because shoppers are attracted principally by the availability of low prices on brand name and selectedprivate label goods, Costco’s warehouses need not be located on prime commercial real estate sites or haveelaborate facilities.
By strictly controlling the entrances and exits of its warehouses and using a membership format, Costco hasbeen able to limit inventory losses to less than two-tenths of one percent of net sales—well below those of typicaldiscount retail operations. Losses associated with dishonored checks have also been minimal and bank in-formation from business members is verified prior to establishing a check purchase limit. Members are identifiedand prevented from cashing checks at the point of sale when they have presented dishonored checks to Costco.
Costco’s policy is generally to limit marketing and promotional expenses to new warehouse openings, occa-sional direct mail marketing to prospective new members and direct marketing programs to existing memberspromoting selected merchandise. These practices result in lower marketing expenses as compared to typical dis-count retailers and supermarkets. In connection with new warehouse openings, Costco’s marketing teamspersonally contact businesses in the area that are potential wholesale members. These contacts are supported bydirect mailings during the period immediately prior to opening. Potential Gold Star (individual) members arecontacted by direct mail or by providing such mailings to be distributed through employee associations and otherentities. After a membership base is established in an area, most new memberships result from word-of-mouthadvertising, follow-up contact by direct mail distributed through regular payroll or other organizationalcommunications to employee groups and ongoing direct solicitations to prospective wholesale members.
8

Costco’s warehouses generally operate on a seven-day, 69-hour week, and are open somewhat longer duringthe holiday season. Generally, warehouses are open weekdays between 10:00 a.m. and 8:30 p.m., with earlierclosing hours on the weekend. Gasoline operations generally have extended hours. Because the hours of oper-ation are shorter than those of traditional wholesalers, discount grocery retailers and supermarkets and due toother operational efficiencies inherent in a warehouse-type operation, labor costs are lower relative to the volumeof sales. Merchandise is generally stored on racks above the sales floor and displayed on pallets containing largequantities of each item, thereby reducing labor required for handling and stocking. In addition, sales are proc-essed through centralized, automated check-out stands. Most items are not individually price-marked; rather,each item is bar-coded so it can be scanned into electronic cash registers. This allows price changes without re-marking merchandise. Substantially all manufacturers provide merchandise pre-marked with the item numbersand bar codes and many provide special, larger package sizes.
Costco’s merchandising strategy is to provide the customer with a broad range of high quality merchandise atprices consistently lower than could be obtained through traditional wholesalers, discount retailers or supermarkets.An important element of this strategy is to carry only those products on which Costco can provide its members sig-nificant cost savings. Items that members may request but that cannot be purchased at prices low enough to passalong meaningful cost savings are often not carried. Costco seeks to limit specific items in each product line to fastselling models, sizes and colors. Therefore, the Company carries an average of approximately 4,000 active stock-keeping units (“SKU’s”) per warehouse in its core warehouse business, as opposed to discount retailers and super-markets that normally stock 40,000 to 60,000 SKU’s or more. These practices are consistent with Costco’smembership policies of satisfying both the business and personal shopping needs of its wholesale members, therebyencouraging high volume shopping. Many consumable products are offered for sale in case, carton or multiple-packquantities only. Appliances, equipment and tools often feature commercial and professional models. In keeping withits policy of customer satisfaction, Costco’s policy is to accept returns of merchandise.
The following table indicates the approximate percentage of net sales accounted for by each major categoryof items sold by Costco during fiscal 2005, 2004 and 2003:
2005 2004 2003
Food (including dry and fresh foods and institutionally packaged foods) . . . . 31% 31% 30%Sundries (including candy, snack foods, health and beauty aids, tobacco,
alcoholic beverages, soft drinks and cleaning and institutional supplies) . . . 29% 29% 30%Hardlines (including major appliances, electronics, hardware, office
supplies, garden and patio, sporting goods, furniture, cameras andautomotive supplies) . . . . . . . . . . . . . . . . . . . . . . . . . . . . . . . . . . . . . . . . . . . 16% 16% 16%
Softlines (including apparel, domestics, jewelry, housewares, media, homefurnishings and small appliances) . . . . . . . . . . . . . . . . . . . . . . . . . . . . . . . . . 12% 13% 14%
Other (including gas stations, pharmacy, food court, optical, one-hour photo,hearing aid and print shop) . . . . . . . . . . . . . . . . . . . . . . . . . . . . . . . . . . . . . . . 12% 11% 10%
100% 100% 100%
Costco has direct buying relationships with many producers of national brand name merchandise. No sig-nificant portion of merchandise is obtained by Costco from any one of these or any other single supplier. Costcohas not experienced difficulty in obtaining sufficient quantities of merchandise, and believes that if any of itscurrent sources of supply became unavailable, it would be able to obtain alternative sources without experiencinga substantial disruption of its business. Costco may also purchase selected private label merchandise of the sameproduct, as long as quality and customer demand are comparable and the savings to its members are greater.
Financial information of the Company’s segments and geographic areas is included in Note 9, SegmentReporting, to the accompanying consolidated financial statements.
Costco reports on a 52/53-week fiscal year, consisting of thirteen four-week periods and ending on the Sun-day nearest the end of August. The first, second and third quarters consist of three periods each, and the fourthquarter consists of four periods (five weeks in the thirteenth period in a 53-week year). There is no material sea-
9

sonal impact on Costco’s operations, except an increased level of sales and earnings during the Christmas holidayseason. Fiscal years 2005, 2004 and 2003 all consisted of 52 weeks.
Membership Policy
Costco’s membership format is designed to reinforce customer loyalty and provide a continuing source ofmembership fee revenue. Costco has two primary types of members: Business and Gold Star (individual) mem-bers. The Company also offers an Executive Membership program to both Business and Gold Star members.
Businesses, including individuals with a business license, retail sales license or other evidence of businessexistence, may become Business members. Costco promotes Business membership through its merchandise se-lection and its membership marketing programs. Business members generally pay an annual membership fee of$45 for the primary and spouse membership card with add-on membership cards available for an annual fee of$35 (including a free spouse card).
Individual memberships (Gold Star memberships) are available to employees of federal, state and local gov-ernments, financial institutions, corporations, utility and transportation companies, public and private educationalinstitutions, other organizations and to other persons. Individual members generally pay an annual membershipfee of $45, which includes a spouse card.
Executive memberships are available to all members for an annual fee of $100. The Executive Membershipprogram offers members additional savings and benefits on various business and consumer services offered byCostco, such as merchant credit card processing, small business loans, auto and home insurance, long-distancetelephone service, check printing, and real estate and mortgage services. The services offered are generally pro-vided by third-party providers and vary by state. In addition, Executive members qualify for a 2% reward(redeemable at Costco warehouses), up to a maximum of $500 per year, on all qualified purchases made at Costco.
As of August 28, 2005, Costco had approximately 5.0 million primary Business memberships and approx-imately 16.2 million Gold Star memberships. Included within this membership base are approximately4.2 million members that have upgraded to the Executive Membership program. Members can utilize their mem-berships at any Costco warehouse location.
Labor
As of August 28, 2005, Costco had approximately 118,000 employees, including approximately 8,000 in-dividuals who were employed by Costco Mexico (a 50%-owned joint venture), which is not consolidated. Ap-proximately forty-five percent of the employee base is part-time. Approximately 13,500 hourly employees incertain of the Company’s locations in California, Maryland, New Jersey, New York and one warehouse inVirginia are represented by the International Brotherhood of Teamsters. All remaining employees are non-union.Costco considers its employee relations to be good.
Competition
The Company operates in the rapidly changing and highly competitive merchandising industry. When ThePrice Company pioneered the membership warehouse club concept in 1976, the dominant companies sellingcomparable lines of merchandise were department stores, grocery stores and traditional wholesalers. Since then,new merchandising concepts and aggressive marketing techniques have led to a more intense and focused com-petitive environment. Wal-Mart has become the largest retailer in the United States (and the world) and has ex-panded further into various food merchandising formats. Target and Kohl’s have also emerged as significantretail competitors. Over 1,100 warehouse club locations exist across the U.S. and Canada, including the 403warehouses operated by the Company in North America; and every major metropolitan area has one, if not sev-eral, club operations. Low-cost operators selling a single category or narrow range of merchandise, such as
10

Lowe’s, Home Depot, Office Depot, PetSmart, Staples, Best Buy and Barnes & Noble, have significant marketshare in their categories. New forms of retailing involving modern technology are boosting sales in certain stores,while home shopping and electronic commerce over the Internet is becoming increasingly popular.
Regulation
Certain state laws require that the Company apply minimum markups to its selling prices for specific goods,such as tobacco products and alcoholic beverages. While compliance with such laws may cause the Company tocharge somewhat higher prices than it otherwise would charge, other retailers are also typically governed by thesame restrictions, and the Company believes that compliance with such laws does not have a material adverseeffect on its operations.
It is Company policy to sell at lower than manufacturers’ suggested retail prices. Some manufacturers at-tempt to maintain the resale price of their products by refusing to sell to the Company or to other purchasers thatdo not adhere to suggested retail prices or that otherwise sell at discounted prices. To date, the Company believesthat it has not been materially affected by its inability to purchase directly from such manufacturers. Both federaland state legislation is proposed from time to time which, if enacted, would restrict the Company’s ability to pur-chase goods or extend the application of laws enabling the establishment of minimum prices. The Company can-not predict the effect on its business of the enactment of such federal or state legislation.
Certain states, counties and municipalities have enacted or proposed laws and regulations that would preventor restrict the operations or expansion plans of certain large retailers and warehouse clubs, including the Com-pany, within their jurisdictions. The Company believes that, if enacted, such laws and regulations could have amaterial adverse effect on the Company’s operations.
NUMBER OF WAREHOUSES AT FISCAL YEAR END
Own Land andBuilding
Lease Land and/orBuilding Total
UNITED STATES . . . . . . . . . . . . . . . . . . . . . . . . . . . . . . . . . . . . . . . . . . 257 81 338CANADA . . . . . . . . . . . . . . . . . . . . . . . . . . . . . . . . . . . . . . . . . . . . . . . . . 57 8 65UNITED KINGDOM . . . . . . . . . . . . . . . . . . . . . . . . . . . . . . . . . . . . . . . 14 2 16KOREA . . . . . . . . . . . . . . . . . . . . . . . . . . . . . . . . . . . . . . . . . . . . . . . . . . 2 3 5TAIWAN . . . . . . . . . . . . . . . . . . . . . . . . . . . . . . . . . . . . . . . . . . . . . . . . . — 4 4JAPAN . . . . . . . . . . . . . . . . . . . . . . . . . . . . . . . . . . . . . . . . . . . . . . . . . . . 1 4 5
Total . . . . . . . . . . . . . . . . . . . . . . . . . . . . . . . . . . . . . . . . . . . . . . . . . 331 102 433
The following schedule shows warehouse openings (net of warehouse closings) by region for the past fivefiscal years and openings (net of closings) through December 31, 2005:
Openings by Fiscal Year United States CanadaOther
International Total
TotalWarehousesin Operation
2001 and prior . . . . . . . . . . . . . . . . . . . . . . . . . . . . . . . . . 264 60 21 345 3452002 . . . . . . . . . . . . . . . . . . . . . . . . . . . . . . . . . . . . . . . . . 26 — 3 29 3742003 . . . . . . . . . . . . . . . . . . . . . . . . . . . . . . . . . . . . . . . . . 19 1 3 23 3972004 . . . . . . . . . . . . . . . . . . . . . . . . . . . . . . . . . . . . . . . . . 18 2 — 20 4172005 . . . . . . . . . . . . . . . . . . . . . . . . . . . . . . . . . . . . . . . . . 11 2 3 16 4332006 (through 12/31/05) . . . . . . . . . . . . . . . . . . . . . . . . . 8 1 1 10 443
Total . . . . . . . . . . . . . . . . . . . . . . . . . . . . . . . . . . . . . 346 66 31 443
At August 28, 2005, the Company operated 27 warehouses in Mexico (through a 50%-owned joint venture).These warehouses are not included in the number of warehouses open in any period because the joint venture isaccounted for using the equity method and, therefore, its operations are not consolidated in the Company’sfinancial statements.
11
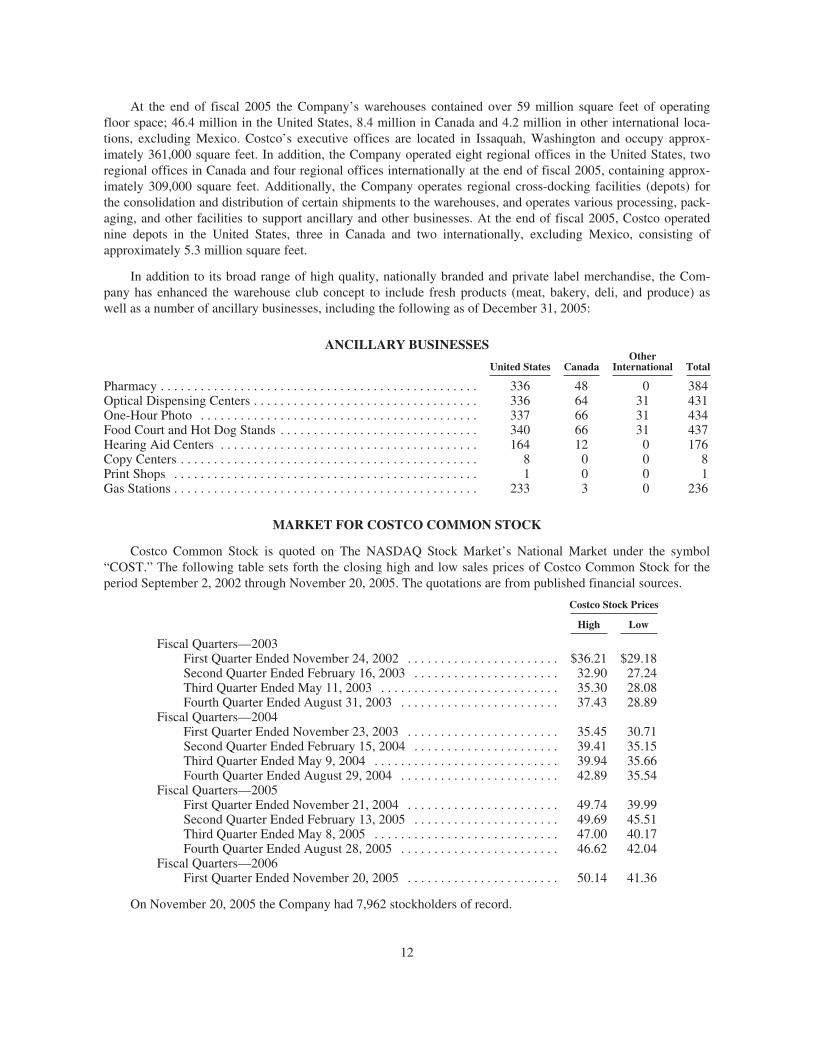
At the end of fiscal 2005 the Company’s warehouses contained over 59 million square feet of operatingfloor space; 46.4 million in the United States, 8.4 million in Canada and 4.2 million in other international loca-tions, excluding Mexico. Costco’s executive offices are located in Issaquah, Washington and occupy approx-imately 361,000 square feet. In addition, the Company operated eight regional offices in the United States, tworegional offices in Canada and four regional offices internationally at the end of fiscal 2005, containing approx-imately 309,000 square feet. Additionally, the Company operates regional cross-docking facilities (depots) forthe consolidation and distribution of certain shipments to the warehouses, and operates various processing, pack-aging, and other facilities to support ancillary and other businesses. At the end of fiscal 2005, Costco operatednine depots in the United States, three in Canada and two internationally, excluding Mexico, consisting ofapproximately 5.3 million square feet.
In addition to its broad range of high quality, nationally branded and private label merchandise, the Com-pany has enhanced the warehouse club concept to include fresh products (meat, bakery, deli, and produce) aswell as a number of ancillary businesses, including the following as of December 31, 2005:
ANCILLARY BUSINESSES
United States CanadaOther
International Total
Pharmacy . . . . . . . . . . . . . . . . . . . . . . . . . . . . . . . . . . . . . . . . . . . . . . . . 336 48 0 384Optical Dispensing Centers . . . . . . . . . . . . . . . . . . . . . . . . . . . . . . . . . . 336 64 31 431One-Hour Photo . . . . . . . . . . . . . . . . . . . . . . . . . . . . . . . . . . . . . . . . . . 337 66 31 434Food Court and Hot Dog Stands . . . . . . . . . . . . . . . . . . . . . . . . . . . . . . 340 66 31 437Hearing Aid Centers . . . . . . . . . . . . . . . . . . . . . . . . . . . . . . . . . . . . . . . 164 12 0 176Copy Centers . . . . . . . . . . . . . . . . . . . . . . . . . . . . . . . . . . . . . . . . . . . . . 8 0 0 8Print Shops . . . . . . . . . . . . . . . . . . . . . . . . . . . . . . . . . . . . . . . . . . . . . . 1 0 0 1Gas Stations . . . . . . . . . . . . . . . . . . . . . . . . . . . . . . . . . . . . . . . . . . . . . . 233 3 0 236
MARKET FOR COSTCO COMMON STOCK
Costco Common Stock is quoted on The NASDAQ Stock Market’s National Market under the symbol“COST.” The following table sets forth the closing high and low sales prices of Costco Common Stock for theperiod September 2, 2002 through November 20, 2005. The quotations are from published financial sources.
Costco Stock Prices
High Low
Fiscal Quarters—2003First Quarter Ended November 24, 2002 . . . . . . . . . . . . . . . . . . . . . . . $36.21 $29.18Second Quarter Ended February 16, 2003 . . . . . . . . . . . . . . . . . . . . . . 32.90 27.24Third Quarter Ended May 11, 2003 . . . . . . . . . . . . . . . . . . . . . . . . . . . 35.30 28.08Fourth Quarter Ended August 31, 2003 . . . . . . . . . . . . . . . . . . . . . . . . 37.43 28.89
Fiscal Quarters—2004First Quarter Ended November 23, 2003 . . . . . . . . . . . . . . . . . . . . . . . 35.45 30.71Second Quarter Ended February 15, 2004 . . . . . . . . . . . . . . . . . . . . . . 39.41 35.15Third Quarter Ended May 9, 2004 . . . . . . . . . . . . . . . . . . . . . . . . . . . . 39.94 35.66Fourth Quarter Ended August 29, 2004 . . . . . . . . . . . . . . . . . . . . . . . . 42.89 35.54
Fiscal Quarters—2005First Quarter Ended November 21, 2004 . . . . . . . . . . . . . . . . . . . . . . . 49.74 39.99Second Quarter Ended February 13, 2005 . . . . . . . . . . . . . . . . . . . . . . 49.69 45.51Third Quarter Ended May 8, 2005 . . . . . . . . . . . . . . . . . . . . . . . . . . . . 47.00 40.17Fourth Quarter Ended August 28, 2005 . . . . . . . . . . . . . . . . . . . . . . . . 46.62 42.04
Fiscal Quarters—2006First Quarter Ended November 20, 2005 . . . . . . . . . . . . . . . . . . . . . . . 50.14 41.36
On November 20, 2005 the Company had 7,962 stockholders of record.
12

During fiscal 2005 the Company purchased shares of Costco common stock under a $500 million share re-purchase program authorized by the Board of Directors in October 2004. Shares purchased under this programare retired. Subsequent to fiscal 2005 year-end the Board of Directors authorized an additional stock repurchaseprogram of up to $1 billion. Under the programs the Company may purchase shares at any time in the open mar-ket or in private transactions as market conditions warrant. The $1 billion stock purchase program authorized bythe Board of Directors on August 29, 2005, contains no expiration date.
The following table sets forth information on the Company’s common stock repurchase program activity forthe year ended August 28, 2005. (Amounts in thousands, except per share data):
Period
TotalNumberof Shares
Purchased
AveragePrice Paidper Share
Total Number ofShares Purchasedas Part of Publicly
AnnouncedProgram
Maximum DollarValue of Sharesthat May Yet be
Purchased Underthe Program
June 7 – June 30, 2005 . . . . . . . . . . . . . . . . . . . . . . . . . . 3,446 $45.73 3,446 $342,391July 1 – July 31, 2005 . . . . . . . . . . . . . . . . . . . . . . . . . . 2,777 $45.49 2,777 $216,090August 1 – August 28, 2005 . . . . . . . . . . . . . . . . . . . . . 2,982 $43.37 2,982 $ 86,750
Total Fourth Quarter . . . . . . . . . . . . . . . . . . . . . . . 9,205 $44.89 9,205 $ 86,750
Subsequent to the Company’s fiscal 2005 year end and through November 20, 2005, the Company pur-chased an additional 4,352 shares at a average price of $47.50, fully utilizing the amount approved by the Boardof Directors in October 2004 and reducing the amount of share value available to be purchased under the planapproved in fiscal 2006 by $119,960. (Amounts in thousands, except per share data.)
Participants in the Company’s 401(k) plan may have purchased more shares of the Company’s commonstock in their plan accounts than were registered with the Securities and Exchange Commission. The Companyreceived no proceeds from any of these sales. The Company has made a rescission offer to plan participants whopurchased the Company’s common stock in 401(k) plan accounts from November 16, 2003 through No-vember 15, 2004. The rescission offer expired October 27, 2005. The offer will have no material effect on theCompany’s consolidated results of operations, financial position or cash flows.
DIVIDEND POLICY
Under its two revolving credit agreements, Costco is permitted to pay dividends in any fiscal year up to anamount equal to fifty percent of its consolidated net income for that fiscal year. Costco’s Board of Directors de-clared four quarterly cash dividends during fiscal year 2005. The first two dividends of $0.10 per share were paidNovember 26, 2004 and February 25, 2005, to shareholders of record at the close of business on November 5,2004 and February 8, 2005, respectively. The third and fourth dividends of $0.115 per share were paid May 27,2005 and August 26, 2005 to shareholders of record at the close of business on May 6, 2005 and August 5, 2005,respectively. In fiscal 2004 the Company paid dividends of $0.10 per share in the third and fourth quarters.
Payment of future dividends is subject to declaration by the Board of Directors. Factors considered in de-termining the size of the dividends are profitability and expected capital needs of the Company. Subject to qual-ifications stated above, the Company presently expects to pay dividends on a quarterly basis.
EQUITY COMPENSATION PLANS
Information related to the Company’s equity compensation plans is incorporated herein by reference to theProxy Statement. The Proxy Statement will be filed with the Securities and Exchange Commission within 120days of the end of the Company’s fiscal year.
13

TEN YEAR OPERATING AND FINANCIAL HIGHLIGHTS(dollars in millions, except per share data)
WAREHOUSES IN OPERATIONS 2005 2004 2003 2002
Beginning of year . . . . . . . . . . . . . . . . . . . . . . . . . . . . 417 397 374 345Openings . . . . . . . . . . . . . . . . . . . . . . . . . . . . . . . . . . . 21 20 29 35Closings . . . . . . . . . . . . . . . . . . . . . . . . . . . . . . . . . . . . (5) — (6) (6)
End of year . . . . . . . . . . . . . . . . . . . . . . . . . . . . . . . . . 433 417 397 374
OPERATING RESULTSRevenue
Net Sales . . . . . . . . . . . . . . . . . . . . . . . . . . . . . . . . . . . . . $51,862 100.0% $47,146 100.0% $41,693 100.0% $37,993 100.0%Membership fees and other . . . . . . . . . . . . . . . . . . . . . . . 1,073 2.1 961 2.0 853 2.0 769 2.0
Total revenue . . . . . . . . . . . . . . . . . . . . . . . . . . . . . . . 52,935 102.1 48,107 102.0 42,546 102.0 38,762 102.0
Operating expensesMerchandise costs . . . . . . . . . . . . . . . . . . . . . . . . . . . . . . 46,347 89.4 42,092 89.3 37,235 89.3 33,983 89.4Selling, general and administrative expenses . . . . . . . . . 5,045 9.7 4,598 9.7 4,097 9.8 3,576 9.4Preopening expenses . . . . . . . . . . . . . . . . . . . . . . . . . . . . 53 0.1 30 0.1 37 0.1 51 0.1Provision for impaired assets and closing costs . . . . . . . 16 0.0 1 0.0 20 0.0 21 0.1
Operating expenses . . . . . . . . . . . . . . . . . . . . . . . . . . . 51,461 99.2 46,721 99.1 41,389 99.2 37,631 99.0
Operating income . . . . . . . . . . . . . . . . . . . . . . . . . . . . . . 1,474 2.8 1,386 2.9 1,157 2.8 1,131 3.0
Other income (expense)Interest expense . . . . . . . . . . . . . . . . . . . . . . . . . . . . . . . . (34) (0.0) (37) (0.0) (37) (0.1) (29) (0.1)Interest income and other . . . . . . . . . . . . . . . . . . . . . . . . 109 0.2 51 0.1 38 0.1 36 0.1
Income before income taxes and cumulative effect ofaccounting change . . . . . . . . . . . . . . . . . . . . . . . . . . . . . . 1,549 3.0 1,400 3.0 1,158 2.8 1,138 3.0
Provision for income taxes . . . . . . . . . . . . . . . . . . . . . 486 1.0 518 1.1 437 1.1 438 1.2
Income before cumulative effect of accounting change . . . 1,063 2.0 882 1.9 721 1.7 700 1.8Cumulative effect of accounting change, net of tax . . . . . . — — — — — — — —
Net income . . . . . . . . . . . . . . . . . . . . . . . . . . . . . . . . . . . . . $ 1,063 2.0 $ 882 1.9 $ 721 1.7 $ 700 1.8
Per Share Data—DilutedIncome before cumulative effect of accounting
change . . . . . . . . . . . . . . . . . . . . . . . . . . . . . . . . . . . $ 2.18 $ 1.85 $ 1.53 $ 1.48Cumulative effect of accounting change, net of tax . . — — — —
Net Income . . . . . . . . . . . . . . . . . . . . . . . . . . . . . . . . . $ 2.18 $ 1.85 $ 1.53 $ 1.48
Shares used in calculation (000’s) . . . . . . . . . . . . . . . 492,035 485,459 479,326 479,262Dividends per share . . . . . . . . . . . . . . . . . . . . . . . . . . . $ 0.43 $ 0.20 $ — $ —
Balance Sheet DataWorking capital (deficit) . . . . . . . . . . . . . . . . . . . . . . . $ 1,477 $ 1,099 $ 700 $ 181Property and equipment, net . . . . . . . . . . . . . . . . . . . . 7,790 7,264 6,960 6,524Total assets . . . . . . . . . . . . . . . . . . . . . . . . . . . . . . . . . 16,514 15,093 13,192 11,620Short-term debt . . . . . . . . . . . . . . . . . . . . . . . . . . . . . . 54 22 47 104Long-term debt and capital lease obligations . . . . . . . 711 994 1,290 1,211Stockholders’ equity . . . . . . . . . . . . . . . . . . . . . . . . . . 8,881 7,625 6,555 5,694
SALES INCREASE FROM PRIOR YEARTotal . . . . . . . . . . . . . . . . . . . . . . . . . . . . . . . . . . . . . . 10% 13% 10% 11%Comparable units . . . . . . . . . . . . . . . . . . . . . . . . . . . . 7% 10% 5% 6%
MEMBERS AT YEAR END (000’S)Business (primary cardholders) . . . . . . . . . . . . . . . . . 5,050 4,810 4,636 4,476Gold Star . . . . . . . . . . . . . . . . . . . . . . . . . . . . . . . . . . . 16,233 15,018 14,984 14,597
(a) Includes the effect of adopting SFAS 121, a $65 pre-tax ($39 after-tax or $0.09 pre diluted share) provision for asset impairment.(b) Represents a one-time non-cash charge reflecting the cumulative effect of the Company’s change in accounting for membership fees
from a cash to a deferred method.
14

2001 2000 1999 1998 1997 1996
313 292 278 261 252 24039 25 21 18 17 20(7) (4) (7) (1) (8) (8)
345 313 292 278 261 252
$34,137 100.0% $31,621 100.0% $26,976 100.0% $23,830 100.0% $21,484 100.0% $19,214 100.0%660 1.9 543 1.7 480 1.8 440 1.8 390 1.8 352 1.8
34,797 101.9 32,164 101.7 27,456 101.8 24,270 101.8 21,874 101.8 19,566 101.8
30,598 89.6 28,322 89.6 24,170 89.6 21,380 89.7 19,314 89.9 17,345 90.33,129 9.2 2,756 8.7 2,338 8.7 2,070 8.7 1,877 8.7 1,691 8.8
60 0.2 42 0.1 31 0.1 27 0.1 27 0.1 29 0.118 — 7 — 57 0.2 6 — 75(a) 0.4 10 —
33,805 99.0 31,127 98.4 26,596 98.6 23,483 98.5 21,293 99.1 19,075 99.2
992 2.9 1,037 3.3 860 3.2 787 3.3 581 2.7 491 2.6
(32) (0.1) (39) (0.1) (45) (0.2) (48) (0.2) (76) (0.4) (78) (0.4)43 0.1 54 0.2 44 0.2 27 0.1 15 0.1 11 —
1,003 2.9 1,052 3.3 859 3.2 766 3.2 520 2.4 424 2.2401 1.1 421 1.3 344 1.3 306 1.3 208 0.9 175 0.9
602 1.8 631 2.0 515 1.9 460 1.9 312 1.5 249 1.3— — — — (118)(b) (0.4) — — — — — —
$ 602 1.8 $ 631 $ 2.0 $ 397 1.5 $ 460 1.9 $ 312 1.5 $ 249 1.3
$ 1.29 $ 1.35 $ 1.11 $ 1.01 $ 0.73 $ 0.61— — (0.25) — — —
$ 1.29 $ 1.35 $ 0.86 $ 1.01 $ 0.73 $ 0.61
475,827 475,737 471,120 463,371 449,336 435,781$ — $ — $ — $ — $ — $ —
$ (230) $ 66 $ 450 $ 431 $ 146 $ 575,827 4,834 3,907 3,395 3,155 2,888
10,090 8,634 7,505 6,260 5,476 4,912195 10 — — 25 60859 790 919 930 917 1,229
4,883 4,240 3,532 2,966 2468 1,778
8% 17% 13% 11% 12% 7%4% 11% 10% 8% 9% 5%
4,358 4,170 3,887 3,676 3,537 3,43512,737 10,521 9,555 8,654 7,845 7,076
15
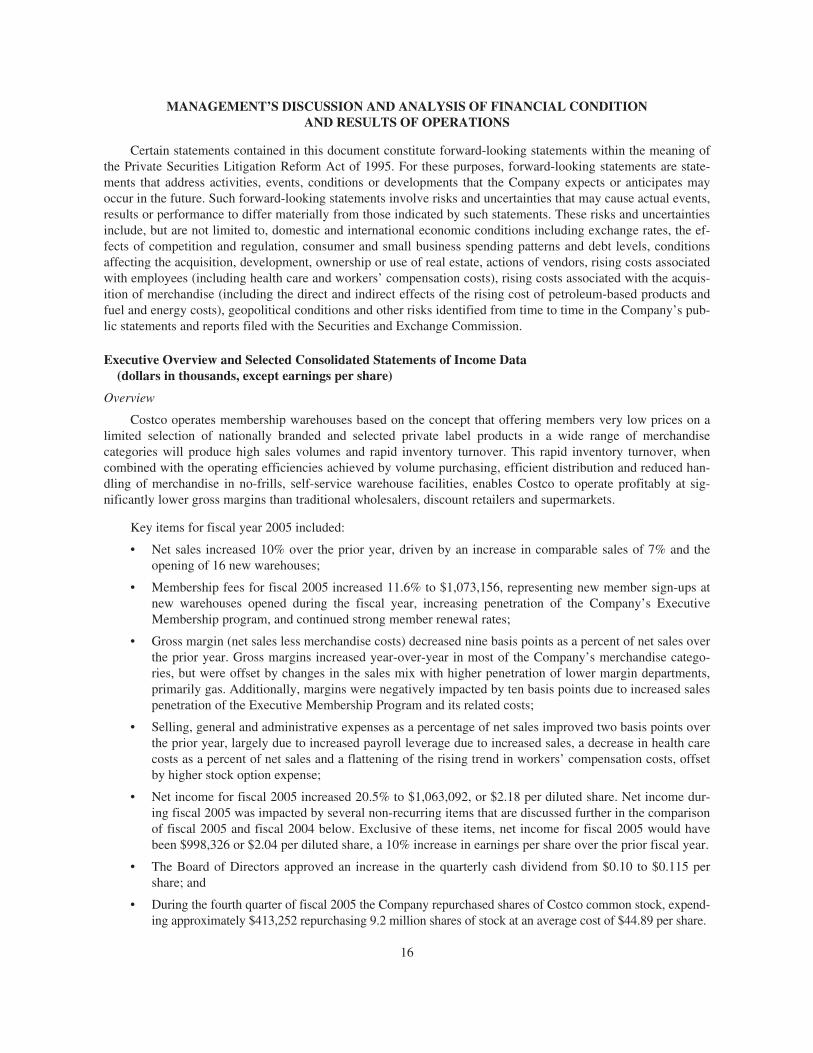
MANAGEMENT’S DISCUSSION AND ANALYSIS OF FINANCIAL CONDITIONAND RESULTS OF OPERATIONS
Certain statements contained in this document constitute forward-looking statements within the meaning ofthe Private Securities Litigation Reform Act of 1995. For these purposes, forward-looking statements are state-ments that address activities, events, conditions or developments that the Company expects or anticipates mayoccur in the future. Such forward-looking statements involve risks and uncertainties that may cause actual events,results or performance to differ materially from those indicated by such statements. These risks and uncertaintiesinclude, but are not limited to, domestic and international economic conditions including exchange rates, the ef-fects of competition and regulation, consumer and small business spending patterns and debt levels, conditionsaffecting the acquisition, development, ownership or use of real estate, actions of vendors, rising costs associatedwith employees (including health care and workers’ compensation costs), rising costs associated with the acquis-ition of merchandise (including the direct and indirect effects of the rising cost of petroleum-based products andfuel and energy costs), geopolitical conditions and other risks identified from time to time in the Company’s pub-lic statements and reports filed with the Securities and Exchange Commission.
Executive Overview and Selected Consolidated Statements of Income Data(dollars in thousands, except earnings per share)
Overview
Costco operates membership warehouses based on the concept that offering members very low prices on alimited selection of nationally branded and selected private label products in a wide range of merchandisecategories will produce high sales volumes and rapid inventory turnover. This rapid inventory turnover, whencombined with the operating efficiencies achieved by volume purchasing, efficient distribution and reduced han-dling of merchandise in no-frills, self-service warehouse facilities, enables Costco to operate profitably at sig-nificantly lower gross margins than traditional wholesalers, discount retailers and supermarkets.
Key items for fiscal year 2005 included:
• Net sales increased 10% over the prior year, driven by an increase in comparable sales of 7% and theopening of 16 new warehouses;
• Membership fees for fiscal 2005 increased 11.6% to $1,073,156, representing new member sign-ups atnew warehouses opened during the fiscal year, increasing penetration of the Company’s ExecutiveMembership program, and continued strong member renewal rates;
• Gross margin (net sales less merchandise costs) decreased nine basis points as a percent of net sales overthe prior year. Gross margins increased year-over-year in most of the Company’s merchandise catego-ries, but were offset by changes in the sales mix with higher penetration of lower margin departments,primarily gas. Additionally, margins were negatively impacted by ten basis points due to increased salespenetration of the Executive Membership Program and its related costs;
• Selling, general and administrative expenses as a percentage of net sales improved two basis points overthe prior year, largely due to increased payroll leverage due to increased sales, a decrease in health carecosts as a percent of net sales and a flattening of the rising trend in workers’ compensation costs, offsetby higher stock option expense;
• Net income for fiscal 2005 increased 20.5% to $1,063,092, or $2.18 per diluted share. Net income dur-ing fiscal 2005 was impacted by several non-recurring items that are discussed further in the comparisonof fiscal 2005 and fiscal 2004 below. Exclusive of these items, net income for fiscal 2005 would havebeen $998,326 or $2.04 per diluted share, a 10% increase in earnings per share over the prior fiscal year.
• The Board of Directors approved an increase in the quarterly cash dividend from $0.10 to $0.115 pershare; and
• During the fourth quarter of fiscal 2005 the Company repurchased shares of Costco common stock, expend-ing approximately $413,252 repurchasing 9.2 million shares of stock at an average cost of $44.89 per share.
16

SELECTED CONSOLIDATED STATEMENTS OF INCOME DATA
The table below presents selected operational data, the percentage relationship between net sales andmajor categories in the Consolidated Statements of Income and the percentage change in the dollar amountsof each of the items.
Percent of Net SalesPercentage Increase/(Decrease)
(of dollar amounts)
Fiscal 2005 Fiscal 2004 Fiscal 2003Fiscal 2005
vs. Fiscal 2004Fiscal 2004
vs. Fiscal 2003
Net sales . . . . . . . . . . . . . . . . . . . . . . . . . . . . . . . 100.00% 100.00% 100.00% 10.0% 13.1%Membership fees . . . . . . . . . . . . . . . . . . . . . . . . 2.07 2.04 2.05 11.6 12.7Gross margin(a) . . . . . . . . . . . . . . . . . . . . . . . . . 10.63 10.72 10.69 9.1 13.4Selling, general and administrative expenses . . . 9.73 9.75 9.83 9.7 12.2Preopening expenses . . . . . . . . . . . . . . . . . . . . . 0.10 0.07 0.09 74.8 (16.9)Provision for impaired assets and closing costs,
net . . . . . . . . . . . . . . . . . . . . . . . . . . . . . . . . . . 0.03 — 0.05 1539.3 (94.9)
Operating income . . . . . . . . . . . . . . . . . . . . 2.84 2.94 2.77 6.4 19.8
Interest expense . . . . . . . . . . . . . . . . . . . . . . . . . (0.06) (0.08) (0.08) (6.0) (0.7)Interest income and other . . . . . . . . . . . . . . . . . . 0.21 0.11 0.09 111.3 34.0
Income before income taxes . . . . . . . . . . . . 2.99 2.97 2.78 10.6 20.9Provision for income taxes . . . . . . . . . . . . . 0.94 1.10 1.05 (6.2) 18.5
Net Income . . . . . . . . . . . . . . . . . . . . . 2.05% 1.87% 1.73% 20.5% 22.4%
(a) Defined as net sales less merchandise costs.
Comparison of Fiscal 2005 (52 weeks) and Fiscal 2004 (52 weeks):(dollars in thousands, except earnings per share)
Net Income
Net income for fiscal 2005 increased 20.5% to $1,063,092, or $2.18 per diluted share, from $882,393, or$1.85 per diluted share, during fiscal year 2004. Net income during fiscal 2005 was impacted by the following: a$54,155 (approximately $.11 per diluted share) income tax benefit resulting primarily from the settlement of atransfer pricing dispute between the United States and Canada (covering the years 1996-2003); a cumulativepre-tax, non-cash charge to preopening expenses of $15,999 (approximately $.02 per diluted share) related to acorrection to the Company’s method of accounting for ground leases (entered into over the past twenty years)that did not require rental payments during the period of construction; and a net tax benefit with respect to excessforeign tax credits on unremitted foreign earnings recorded in the fourth quarter of $20,592 (approximately $.04per diluted share). Exclusive of these items, net income for fiscal 2005 would have been $998,326 or $2.04 perdiluted share, a 10% increase in earnings per share over the prior fiscal year.
Net Sales
Net sales increased 10.0% to $51,862,072 in fiscal 2005 from $47,145,712 in fiscal 2004. Approximately71% of the increase was due to an increase in comparable warehouse sales, that is sales in warehouses open for atleast a year. The balance of the increase was due to opening 16 new warehouses during fiscal 2005 and 20 newwarehouses during fiscal 2004, a portion of which is not included in comparable warehouse sales. Net sales werereduced by the implementation of Emerging Issues Task Force (EITF) Issue No. 03-10, “Application of IssueNo. 02-16, “Accounting by a Customer (Including a Reseller) for Certain Consideration Received from a
17
Vendor,” by Resellers to Sales Incentives Offered to Consumers by Manufacturers,” which was effective at thebeginning of the Company’s fiscal 2004 third quarter. EITF 03-10, which primarily impacts the Company’s ven-dor coupon programs, reduces net sales and merchandise costs by an equal amount and does not affect the Com-pany’s consolidated gross margin or net income. Had EITF 03-10 been in effect for the comparable periods infiscal 2004, the net sales increase in fiscal 2005 would have been 10.4%. (See Recently Issued Accounting Pro-nouncements, EITF 03-10.)
For fiscal 2005, comparable sales increased 7% from fiscal 2004. Had EITF 03-10 been in effect for thecomparable periods in fiscal 2004, the comparable sales increase for fiscal 2005 would have been 8%.
Changes in prices of merchandise did not materially affect the sales increases, with the exception of gaso-line, where price increases accounted for approximately 89 basis points of the sales increase. In addition, trans-lation of foreign sales into U.S. dollars contributed to the increase in sales due to stronger foreign currencies,accounting for approximately 134 basis points year-over-year of the comparable sales increase.
Membership Fees
Membership fees increased 11.6% to $1,073,156, or 2.07% of net sales, in fiscal 2005 from $961,280, or2.04% of net sales, in fiscal 2004. This increase was primarily due to additional membership sign-ups at the 16new warehouses opened in fiscal 2005, increased penetration of the Company’s Executive membership and highoverall member renewal rates consistent with recent years, currently 86%.
Gross Margin
Gross margin increased 9.1% to $5,515,111, or 10.63% of net sales, in fiscal 2005 from $5,053,696, or10.72% of net sales, in fiscal 2004. The nine basis point decrease in gross margin as a percentage of net sales re-flected a decrease of three basis points in gross margin in the Company’s merchandise departments. The threebasis point decrease in merchandising is largely due to changes in the sales mix, with higher penetration of lowermargin departments. This effect was offset by gross margin gains in most of the Company’s merchandisedepartments, as well as the international operations. Gross margin as a percentage of net sales was positivelyimpacted by five basis points due to the implementation of EITF 03-10, whereby net sales and merchandise costswere reduced equally. The gross margin percentage was reduced by 10 basis points due to the increased pene-tration of the Executive Member program, increased spending by Executive Members and the resulting increasesin the related costs.
The gross margin figures reflect accounting for most U.S. merchandise inventories on the last-in, first-out(LIFO) method. Fiscal 2005 included a $13,410 LIFO charge (increase in merchandise costs), while fiscal 2004included a $6,090 LIFO charge. The impact of the LIFO adjustment on a year-over-year basis negatively im-pacted gross margin, as a percentage of sales, by one additional basis point.
Selling, General and Administrative Expenses
Selling, general and administrative (SG&A) expenses increased 9.7% to $5,044,341, or 9.73% of net sales,in fiscal 2005, from $4,597,877, or 9.75% of net sales, in fiscal 2004. Had EITF 03-10 been in effect for all offiscal 2004, SG&A expenses as a percent to net sales would have shown additional improvement of four basispoints in fiscal 2005.
For fiscal 2005, warehouse and central operating costs positively impacted SG&A comparisons year-over-year by approximately 13 basis points, primarily due to improved payroll utilization at the warehouse level, in-cluding increased leverage from increased comparable sales and cost control measures employed in employeebenefits, primarily health care. This improvement was partially offset by the implementation of EITF 03-10,
18

which negatively impacted SG&A as a percentage of net sales by five basis points and an increase in stock-basedcompensation costs approximating six basis points year-over-year.
Preopening Expenses
Preopening expenses totaled $53,230, or 0.10% of net sales, during fiscal 2005 compared to $30,451, or0.07% of net sales, during fiscal 2004. During the second quarter of fiscal 2005, in response to the Securities andExchange Commission’s February 7, 2005 letter related to leases, the Company adjusted its method of account-ing for leases (entered into over the past twenty years), primarily related to ground leases at certain warehouselocations that did not require rental payments during the period of construction. As a result, the Company re-corded a cumulative pre-tax, non-cash charge of $15,999 to preopening expense in the second quarter of fiscal2005 to effect this accounting adjustment. Prior periods’ financial results have not been restated due to the imma-teriality of this amount to the consolidated financial statements. Twenty-one warehouses (including five re-locations) were opened in fiscal 2005 compared to the opening of 20 warehouses in fiscal 2004. Pre-openingexpenses also include costs related to remodels and expanded ancillary operations at existing warehouses.
Provision for Impaired Assets and Closing Costs, net
The net provision for impaired assets and closing costs was $16,393 in fiscal 2005, compared to $1,000 infiscal 2004. The provision includes costs related to impairment of long-lived assets, future lease obligations ofwarehouses that have been relocated to new facilities, and any losses or gains resulting from the sale of realproperty. The provision for fiscal 2005 included charges of $3,893 for impairment of long-lived assets, $11,619for warehouse closing expenses and $881 for net losses on the sale of real property. The provision for fiscal 2004included charges of $16,548 for warehouse closing expenses that were offset by gains of $15,548 on the sale ofreal property.
At August 28, 2005, the reserve for warehouse closing costs was $9,556, of which $9,118 related to futurelease obligations. This compares to a reserve for warehouse closing costs of $10,367 at August 29, 2004, ofwhich $9,184 related to future lease obligations.
Interest Expense
Interest expense totaled $34,437 in fiscal 2005, compared to $36,651 in fiscal 2004. Interest expense in bothfiscal 2005 and 2004 includes interest on the 31⁄2% Zero Coupon Notes, 71⁄8% and 51⁄2% Senior Notes and onbalances outstanding under the Company’s bank credit facilities and promissory notes. The decrease was primar-ily a result of a decrease in interest on the Company’s 31⁄2% Zero Coupon Notes as note holders converted ap-proximately $280,811 in principle amount of the Notes into common stock during fiscal 2005. Additionally,capitalized interest increased year-over-year as interest rates and construction costs increased in fiscal 2005 overfiscal 2004. These decreases were partially offset by increases in interest on the Senior Notes as these fixed rateinstruments were swapped into variable rate debt in November 2001 and March 2002, which was mitigated bythe fact that the 71⁄8% Senior Notes matured and were repaid on June 15, 2005.
Interest Income and Other
Interest income and other totaled $109,096 in fiscal 2005, compared to $51,627 in fiscal 2004. The increaseprimarily reflects increased interest income resulting from higher cash and cash equivalents balances and short-term investments on hand throughout fiscal 2005, as well as higher interest rates earned on the balances as com-pared to fiscal 2004.
Provision for Income Taxes
The effective income tax rate on earnings was 31.4% in fiscal 2005 and 37% in fiscal 2004. The decrease inthe effective income tax rate is attributable to a one-time $54,155 income tax benefit resulting primarily from the
19

settlement of a transfer pricing dispute between the United States and Canada (covering the years 1996-2003)and a net tax benefit on excess foreign tax credits on unremitted foreign earnings of $20,592. Excluding thesebenefits the effective income tax rate on earnings in fiscal 2005 was 36.2%.
For the fourth quarter of fiscal 2005 and 2004, the effective tax rate was 28.9% and 37.0%, respectively.The decrease in the fourth quarter tax rate for fiscal 2005 is primarily attributable to the net tax benefit of$20,592, noted above, and a tax benefit of $13,895 primarily associated with lower state taxes. The state taxbenefit recorded in the fourth quarter was primarily due to a reduction in the estimated effective state tax rate uti-lized in the first through third quarters of fiscal 2005. Excluding the benefit of these two items, the fourth quartertax rate for fiscal 2005 would be 35.8%.
Comparison of Fiscal 2004 (52 weeks) and Fiscal 2003 (52 weeks):(dollars in thousands, except earnings per share)
Net Income
Net income for fiscal 2004 increased 22.4% to $882,393, or $1.85 per diluted share, from $721,000, or$1.53 per diluted share during fiscal year 2003.
Net Sales
Net sales increased 13.1% to $47,145,712 in fiscal 2004 from $41,692,699 in fiscal 2003. Approximately78% of the increase was due to an increase in comparable warehouse sales, that is sales in warehouses open for atleast a year. The balance of the increase was due to opening 20 new warehouses during fiscal 2004 and a net of23 new warehouses (29 opened, 6 closed) during fiscal 2003, a portion of which is not included in comparablewarehouse sales. Net sales were reduced by the implementation of Emerging Issues Task Force (EITF) IssueNo. 03-10, “Application of Issue No. 02-16, “Accounting by a Customer (Including a Reseller) for Certain Con-sideration Received from a Vendor,” by Resellers to Sales Incentives Offered to Consumers by Manufacturers,”which was effective at the beginning of the Company’s fiscal 2004 third quarter. EITF 03-10, which primarilyimpacts the Company’s vendor coupon programs, reduces net sales and merchandise costs by an equal amountand does not affect the Company’s consolidated gross margin or net income. Had EITF 03-10 been in effect forthe comparable periods in fiscal 2003, the net sales increase in fiscal 2004 would have been 13.8%. (See Re-cently Issued Accounting Pronouncements, EITF 03-10.)
For fiscal 2004, comparable sales increased 10% from fiscal 2003. Had EITF 03-10 been in effect for thecomparable periods in fiscal 2003, the comparable sales increase for fiscal 2004 would have been 11%.
Changes in prices of merchandise did not materially affect the sales increases, with the exception of gaso-line, where price increases accounted for a sales increase of approximately 70 basis points. In addition, due to theweaker U.S. dollar throughout fiscal 2004 as compared to fiscal 2003, translation of foreign sales into U.S. dol-lars contributed to the increase in sales, accounting for a comparable sales increase of approximately 190 basispoints year-over-year. Sales were also positively impacted by the supermarket strikes in Southern California dur-ing the first half of the Company’s 2004 fiscal year. The positive impact to sales for the entire fiscal year wasestimated to be 35 to 50 basis points.
Membership Fees
Membership fees increased 12.7% to $961,280, or 2.04% of net sales, in fiscal 2004 from $852,853, or2.05% of net sales, in fiscal 2003. This increase was primarily due to additional membership sign-ups at the 20new warehouses opened in fiscal 2004; increased penetration of the Company’s Executive membership, includ-ing the rollout of the program into Canada, which began in the first quarter of fiscal 2004; and high overallmember renewal rates consistent with recent years, currently at 86%.
20

Gross Margin
Gross margin increased 13.4% to $5,053,696, or 10.72% of net sales, in fiscal 2004 from $4,457,316, or10.69% of net sales, in fiscal 2003. The three basis point increase, as a percent of net sales, reflected a 14 basispoint increase in gross margin in the Company’s merchandise departments, helped by strong year-over-year grossmargin gains in the Company’s ancillary business operations, particularly gasoline and pharmacy. Year-over-year gross margin, as a percentage of net sales, was also positively impacted by the implementation of EITF03-10, whereby net sales and merchandise costs were reduced, resulting in an eight basis point increase. Theyear-over-year gross margin percentage was reduced by 12 basis points due to the increased rewards related tothe Executive Membership Two-Percent Reward Program, resulting from an increase in the penetration of theExecutive Member program.
The gross margin figures reflect accounting for most U.S. merchandise inventories on the LIFO method.Fiscal 2004 included a $6,090 LIFO charge (increase in merchandise costs), while fiscal 2003 included a $19,650LIFO credit (reduction in merchandise costs). The impact of the LIFO adjustment on a year-over-year basis neg-atively impacted margin by an additional six basis points.
Selling, General and Administrative Expenses
Selling, general and administrative (SG&A) expenses as a percent of net sales decreased to 9.75% duringfiscal 2004 from 9.83% during fiscal 2003. Had EITF 03-10 been in effect in fiscal 2003, SG&A expenses as apercent to net sales would have shown additional improvement of seven basis points in fiscal 2004.
For fiscal 2004, warehouse and central operating costs positively impacted SG&A comparisons year-over-year by approximately 21 basis points, primarily due to increased expense leverage of warehouse payroll, bene-fits (primarily health care), utility and workers’ compensation costs. During the latter half of fiscal 2004, theCompany implemented changes to its employee healthcare plans that reduced its overall healthcare costs, primar-ily in the fourth quarter. This improvement was partially offset by the seven basis point increase resulting fromthe adoption of EITF 03-10, a two basis point increase in expense related to the establishment of additional in-surance liabilities resulting from financial difficulties being experienced by one of the Company’s third-partyinsurance providers, and an increase in stock-based compensation costs following the Company’s prospectiveadoption of Statement of Financial Accounting Standards (SFAS) No. 123, “Accounting for Stock BasedCompensation,” at the beginning of fiscal 2003, of four basis points.
Preopening Expenses
Preopening expenses totaled $30,451, or 0.07% of net sales, during fiscal 2004 compared to $36,643, or0.09% of net sales, during fiscal 2003. This reduction was due to fewer warehouse openings. During fiscal 2004,the Company opened 20 new warehouses compared to 29 new warehouses (including 5 relocations) during fiscal2003. Pre-opening expenses also include costs related to remodels and expanded ancillary operations at existingwarehouses.
Provision for Impaired Assets and Closing Costs, net
The net provision for impaired assets and closing costs was $1,000 in fiscal 2004, compared to $19,500 infiscal 2003. The provision includes costs related to impairment of long-lived assets, future lease obligations ofwarehouses that have been relocated to new facilities, and losses or gains resulting from the sale of real property.The provision for fiscal 2004 included charges of $16,548 for warehouse closing expenses that were offset bygains of $15,548 on the sale of real property. The provision for fiscal 2003 included charges of $11,836 forwarehouse closing expenses, $4,697 for impairment of long-lived assets and $2,967 for net losses on the sale ofreal property. At August 29, 2004, the reserve for warehouse closing costs was $10,367, of which $9,184 relatedto future lease obligations. This compares to a reserve for warehouse closing costs of $8,609 at August 31, 2003,of which $7,833 related to future lease obligations.
21

Interest Expense
Interest expense totaled $36,651 in fiscal 2004, compared to $36,920 in fiscal 2003. Interest expense in bothfiscal 2004 and 2003 includes interest on the 31⁄2% Zero Coupon Notes, 71⁄8% and 51⁄2% Senior Notes and onbalances outstanding under the Company’s bank credit facilities and promissory notes. The decrease was primar-ily a result of the Company’s reduction in short-term borrowings, principally related to its foreign subsidiaries.This decrease was substantially offset by increases in interest rates on the Senior Notes due to interest rate swapagreements converting the interest rate from fixed to floating.
Interest Income and Other
Interest income and other totaled $51,627 in fiscal 2004, compared to $38,525 in fiscal 2003. The increaseprimarily reflects greater interest earned on higher cash and cash equivalents balances and short-term invest-ments. In addition, a reduction in the expense to record minority interest in the earnings of foreign subsidiarieswas reported in fiscal 2004 as the Company increased its ownership in Costco Wholesale UK Limited to 100%.
Provision for Income Taxes
The effective income tax rate on earnings was 37% in fiscal 2004 and 37.75% in fiscal 2003. The decreasein the effective income tax rate is primarily attributable to lower statutory income tax rates for foreign operationsand one-time benefits associated with certain tax planning strategies.
Liquidity and Capital Resources (dollars in thousands, except per share amounts)
Cash Flows
The Company’s primary sources of liquidity are cash flows generated from warehouse operations and ourexisting cash and cash equivalents and short-term investments balances, which were $3,459,857 and $3,129,882at August 28, 2005 and August 29, 2004, respectively. Net cash provided by operating activities totaled$1,783,177 in fiscal 2005 compared to $2,098,783 in fiscal 2004, a decrease of $315,606. Higher net income anda decrease in net merchandise inventories (merchandise inventory less accounts payable) year-over-year in-creased cash flow from operating activities by $391,571. This increase was offset by decreases in cash flow fromoperating assets and liabilities of $706,855, primarily relating to the timing in the collection of certain receivablesand in payments of income taxes in fiscal 2005 as compared to fiscal 2004.
A significant component of net cash used in investing activities continues to be the purchase of property andequipment related to the Company’s warehouse expansion and remodel projects. Net cash used in investing activ-ities totaled $2,058,729 in fiscal 2005 compared to $1,048,481 in fiscal 2004, an increase of $1,010,248. The in-crease in investing activities primarily relates to an increase in the net investment in short-term investments of$768,596 and an increase in additions to property and equipment of $289,811 in fiscal 2005 over fiscal 2004.
Net cash used in financing activities totaled $518,651 in fiscal 2005 compared to $209,569 provided by fi-nancing activities in fiscal 2004. The decrease of $728,220 primarily resulted from an increase in the repaymentof debt of $297,275 primarily relating to the repayment of the 71⁄8% Senior Notes, which matured on June 15,2005, and repurchases of common stock of $413,252 under the Company’s $500,000 share repurchase program.
Dividends
Costco’s Board of Directors declared four quarterly cash dividends during fiscal year 2005. The first twodividends of $0.10 per share were paid November 26, 2004 and February 25, 2005, to shareholders of record atthe close of business on November 5, 2004 and February 8, 2005, respectively. The third and fourth dividends of
22

$0.115 per share were paid May 27, 2005 and August 26, 2005 to shareholders of record at the close of businesson May 6, 2005 and August 5, 2005, respectively. In fiscal 2004 the Company paid dividends of $0.10 per sharein the third and fourth quarters.
Contractual Obligations
The Company’s commitment to make future payments under contractual obligations was as follows, as ofAugust 28, 2005.
Payments Due by Period
Contractual obligations TotalLess than
1 year1 to 3years
4 to 5years
After5 years
Long-term debt(1)(2) . . . . . . . . . . . . . . . . . . . . $ 879,520 $ 18,064 $379,466 $ 65,437 $ 416,553Capital lease obligations . . . . . . . . . . . . . . . . . . 6,591 3,225 1,305 927 1,134Operating leases(3) . . . . . . . . . . . . . . . . . . . . . . 1,562,267 114,682 219,402 189,188 1,038,995Purchase obligations (merchandise)(4) . . . . . . 3,049,398 3,048,785 613 — —Purchase obligations (building, equipment,
services and other)(5) . . . . . . . . . . . . . . . . . . 242,361 230,086 12,275 — —Other(6) . . . . . . . . . . . . . . . . . . . . . . . . . . . . . . 8,591 1,354 1,692 1,362 4,183
Total . . . . . . . . . . . . . . . . . . . . . . . . . . . . . $5,748,728 $3,416,196 $614,753 $256,914 $1,460,865
(1) Amounts include contractual interest payments.
(2) The amount includes interest accreted to maturity for the Company’s Zero Coupon 31⁄2% Convertible Sub-ordinated Notes due August 2017, totaling $415,246. The consolidated balance sheet as of August 28, 2005reflects a balance outstanding of $274,071.
(3) Operating lease obligations have been reduced by $168,742 to reflect sub-lease income.
(4) Includes open merchandise purchase orders at fiscal year end.
(5) The amounts exclude minor outsourced services negotiated at the individual warehouse level that are notsignificant and generally contain clauses allowing for cancellation without significant penalty.
(6) Consists of asset retirement and deferred compensation obligations.
Expansion Plans
Costco’s primary requirement for capital is the financing of the land, building and equipment costs for newwarehouses plus the costs of initial warehouse operations and working capital requirements, as well as additionalcapital for international expansion.
While there can be no assurance that current expectations will be realized, and plans are subject to changeupon further review, it is management’s current intention to spend approximately $1,100,000 to $1,250,000 dur-ing fiscal 2006 in the United States and Canada for real estate, construction, remodeling and equipment forwarehouse clubs and related operations; and approximately $100,000 to $150,000 for international expansion,including the United Kingdom, Asia, Mexico and other potential ventures. These expenditures are expected to befinanced with a combination of cash provided from operations and the use of cash and cash equivalents andshort-term investments.
Expansion plans for the United States and Canada during fiscal 2006 are to open approximately 28-30 newwarehouse clubs on a net basis, inclusive of two to three relocations to larger and better-located warehouses. TheCompany expects to continue its review of expansion plans in its international operations, including the UnitedKingdom and Asia, along with other international markets. At present, the Company is planning to open threeadditional warehouses in the U.K during fiscal 2006. Costco Mexico plans to open two to three new warehouseclubs during fiscal 2006.
23
Additional Equity Investments in Subsidiaries and Joint Ventures
On June 30, 2005, the Company acquired the remaining 4% interest in CWC Travel Inc for $3,961, bringingCostco’s ownership in this entity to 100%. In addition, during fiscal 2005 the Company contributed an additional$15,000 to its investment in Costco Mexico (a 50%-owned joint venture), which did not impact its percentageownership of this entity as the joint venture partner contributed a like amount. On October 3, 2003, the Companyacquired from Carrefour Nederland B.V. its 20% equity interest in Costco Wholesale UK Limited for cash of$95,153, bringing Costco’s ownership in Costco Wholesale UK Limited to 100%.
Bank Credit Facilities and Commercial Paper Programs (all amounts stated in thousands of US dollars)
The Company has a $500,000 commercial paper program supported by a $150,000 bank credit facility($300,000 at August 29, 2004) with a group of nine banks, which expires on November 15, 2005, and is not ex-pected to be renewed. At August 28, 2005 and August 29, 2004, no amounts were outstanding under thecommercial paper program and no amounts were outstanding under the credit facility. Applicable interest rateson the credit facility at August 28, 2005 and August 29, 2004, were 3.92% and 1.90%, respectively.
A wholly-owned Canadian subsidiary has a $167,000 commercial paper program ($152,000 at August 29,2004) supported by a $50,000 bank credit facility ($46,000 at August 29, 2004) with a Canadian bank, which isguaranteed by the Company and expires in March 2006. At August 28, 2005 and August 29, 2004, no amountswere outstanding under the Canadian commercial paper program or the bank credit facility. Applicable interestrates on the credit facility at August 28, 2005 and August 29, 2004, were 4.25% and 3.75%, respectively. AtAugust 28, 2005, standby letters of credit totaling $23,000 issued under the bank credit facility left $27,000available for commercial paper support. At August 29, 2004, standby letters of credit totaling $21,000 issuedunder the bank credit facility left $25,000 available for commercial paper support.
The Company has agreed to limit the combined amount outstanding under the U.S. and Canadian commer-cial paper programs to the combined amounts of the supporting bank credit facilities, which are $177,000 atAugust 28, 2005, decreasing to $27,000 on November 15, 2005. At August 29, 2004, the combined amount ofsupporting bank credit facilities was $325,000.
The Company’s wholly-owned Japanese subsidiary has a short-term $13,694 bank line of credit that expiresin February 2006. At August 28, 2005 and August 29, 2004, $5,477 and $0, respectively, were borrowed underthe line of credit, and $3,652 and $2,576, respectively, were used to support standby letters of credit. A second$13,694 bank line of credit was entered into in February 2005 that expires in February 2006. At August 28, 2005,$9,129 was borrowed under the second facility; this bank line was not in place at August 29, 2004. Applicableinterest rates on the credit facilities at both August 28, 2005 and August 29, 2004, were .84%.
The Company’s Korean subsidiary has a short-term $11,665 bank line of credit, which expires in January2006. At August 28, 2005 and August 29, 2004, no amounts were borrowed under the line of credit and $1,668and $0, respectively, were used to support standby letters of credit. Applicable interest rates on the credit facilityat August 28, 2005 and August 29, 2004, were 4.51% and 4.52%, respectively.
The Company’s Taiwan subsidiary has a $7,439 bank revolving credit facility that expires in January 2006.At August 28, 2005 and August 29, 2004, no amounts were borrowed under the credit facility and $2,495 and$1,165, respectively, were used to support standby letters of credit. A second $15,499 bank revolving credit fa-cility is in place, which expires in July 2006. At August 28, 2005 and August 29, 2004, no amounts were bor-rowed under the second credit facility and $790 and $738, respectively were used to support standby letters ofcredit. Applicable interest rates on the credit facilities at August 28, 2005 and August 29, 2004, were 3.75% and3.50%, respectively.
The Company’s wholly-owned United Kingdom subsidiary has a $108,408 bank revolving credit facilityexpiring in February 2007 and a $63,238 bank overdraft facility renewable on a yearly basis in March 2006. At
24

August 28, 2005, $39,750 was outstanding under the revolving credit facility with an applicable interest rate of5.30% and no amounts were outstanding under the bank overdraft facility. At August 29, 2004, $21,595 was out-standing under the revolving credit facility with an applicable interest rate of 5.285% and no amounts were out-standing under the bank overdraft facility.
Letters of Credit
The Company has letter of credit facilities (for commercial and standby letters of credit), totaling approx-imately $401,933. The outstanding commitments under these facilities at August 28, 2005 and August 29, 2004totaled approximately $131,169 and $166,800, respectively, including approximately $64,532 and $52,900, re-spectively, in standby letters of credit.
Financing Activities
The Company’s 71⁄8% Senior Notes, carried at $304,350 at August 29, 2004, matured and were repaid onJune 15, 2005 from its cash and cash equivalents.
In April 2003, the Company’s wholly-owned Japanese subsidiary issued promissory notes bearing interest at0.92% in the aggregate amount of $36,516, through a private placement. Interest is payable semi-annually andprincipal is due on April 26, 2010.
In March 2002, the Company issued $300,000 of 51⁄2% Senior Notes carried at $307,688 due March 15,2007. Interest is payable semi-annually. Simultaneous with the issuance of the Senior Notes, the Company en-tered into interest rate swap agreements converting the interest from fixed to floating.
In February 1996, the Company filed with the Securities and Exchange Commission a shelf registrationstatement for $500,000 of senior debt securities. On October 23, 2001, additional debt securities of $100,000were registered. The $300,000 of 51⁄2% Senior Notes issued in March 2002 reduced the amount of registeredsecurities available for future issuance to $300,000.
During fiscal 2005, $280,811 in principal amount of the Company’s 31⁄2% Zero Coupon Convertible Sub-ordinated Notes were converted by note holders into 9,910,011 shares of common stock.
Derivatives
The Company has limited involvement with derivative financial instruments and uses them only to managewell-defined interest rate and foreign exchange risks. Forward foreign exchange contracts are used to hedge theimpact of fluctuations of foreign exchange on inventory purchases and typically have very short terms. The ag-gregate amount of foreign exchange contracts outstanding at August 28, 2005 and August 29, 2004, was $42,466and $30,495, respectively. The majority of the forward foreign exchange contracts were entered into by theCompany’s wholly-owned United Kingdom subsidiary, primarily to hedge U.S. dollar merchandise inventorypurchases. The Company monitors its foreign currency exchange exposures to ensure the overall effectiveness ofits foreign currency hedge positions. The only other derivative instruments the Company holds are interest rateswaps, which the Company uses to manage the interest rate risk associated with its borrowings and to manage theCompany’s mix of fixed-rate and variable-rate debt. As of August 28, 2005, the Company had “fixed-to-floating”interest rate swaps with an aggregate notional amount of $300,000 and an aggregate fair value of $7,688, whichis recorded in other assets on the Company’s consolidated balance sheet. These swaps were entered into effectiveMarch 25, 2002, and are designated and qualify as fair value hedges of the Company’s $300,000 51⁄2% SeniorNotes. As the terms of the swaps match those of the underlying hedged debt, the changes in the fair value ofthese swaps are offset by corresponding changes in the carrying amount of the hedged debt and result in no netearnings impact. As of August 29, 2004, the Company had “fixed-to-floating” interest rate swaps with an ag-
25

gregate notional amount of $600,000 and an aggregate fair value of $25,754. In addition to the Company’s swapon the 51⁄2% Senior Notes noted above, the Company had entered into a swap on its $300,000 71⁄8% SeniorNotes effective November 13, 2001, which was designated and qualified as a fair value hedge. The $300,00071⁄8% Senior Notes matured and were repaid on June 15, 2005. Concurrent to this transaction, the related swapagreement expired.
Off-Balance Sheet Arrangements
With the exception of its operating leases, the Company has no off-balance sheet arrangements that havehad or are reasonably likely to have a material current or future effect on the Company’s financial condition orconsolidated financial statements.
Stock Repurchase Program
On November 30, 2001, the Company’s Board of Directors approved a stock repurchase program, authoriz-ing the repurchase of up to $500,000 of Costco Common Stock through November 30, 2004. Under the program,the Company could repurchase shares at any time in the open market or in private transactions as market con-ditions warrant. The repurchased shares would be retired. On October 25, 2004, the Board of Directors renewedthe program for another three years. On June 7, 2005 the Company began repurchasing shares on the open mar-ket. Through August 28, 2005 the Company has repurchased 9,205,100 shares of common stock at an averageprice of $44.89, totaling approximately $413,252, including commissions.
Subsequent to the Company’s fiscal 2005 year end, August 29, 2005, the Board of Directors of Costco au-thorized an additional stock repurchase program of up to $1,000,000 of Costco common stock. Under the pro-gram, which contains no expiration date, the Company may repurchase shares at any time in the open market orin private transactions as market conditions warrant.
Critical Accounting Policies
The preparation of the Company’s financial statements requires that management make estimates and judg-ments that affect the financial position and results of operations. Management continues to review its accountingpolicies and evaluate its estimates, including those related to revenue recognition, merchandise inventory,impairment of long-lived assets and warehouse closing costs and insurance/self-insurance liabilities. The Com-pany bases its estimates on historical experience and on other assumptions that management believes to bereasonable under the present circumstances.
Revenue Recognition
The Company recognizes sales, net of estimated returns, at the time customers take possession of merchan-dise or receive services. When the Company collects payment from customers prior to the transfer of ownershipof merchandise or the performance of services, the amount received is recorded as deferred revenue on the con-solidated balance sheets until the sale or service is completed. The Company provides for estimated sales returnsbased on historical returns levels.
The Company evaluates the criteria of the Financial Accounting Standards Board (FASB) Emerging IssuesTask Force (EITF) 99-19, “Reporting Revenue Gross as a Principal Versus Net as an Agent,” in determiningwhether it is appropriate to record the gross amount of merchandise sales and related costs or the net amountearned as commissions. Generally, when Costco is the primary obligor, is subject to inventory risk, has latitudein establishing prices and selecting suppliers, influence product or service specifications, or has several but notall of these indicators, revenue is recorded on a gross basis. If the Company is not the primary obligor and doesnot possess other indicators of gross reporting as noted above, Costco records the net amounts as commissionsearned.
26

Merchandise Inventories
Merchandise inventories are valued at the lower of cost or market as determined primarily by the retailmethod of accounting and are stated using the last-in, first-out (LIFO) method for substantially all U.S. merchan-dise inventories. Merchandise inventories for all foreign operations are primarily valued by the retail method ofaccounting and are stated using the first-in, first-out (FIFO) method. The Company believes the LIFO methodmore fairly presents the results of operations by more closely matching current costs with current revenues. TheCompany records an adjustment each quarter, if necessary, for the expected annual effect of inflation, and theseestimates are adjusted to actual results determined at year-end. At August 28, 2005, merchandise inventories val-ued at LIFO approximated FIFO after considering the lower of cost or market principle. At August 29, 2004,merchandise inventories valued using LIFO exceeded the comparable FIFO value by approximately $13,410 dueto the aggregate effects of deflation.
The Company provides for estimated inventory losses between physical inventory counts on the basis of apercentage of sales. The provision is adjusted periodically to reflect the trend of the actual physical inventorycount results, which generally occur in the second and fourth fiscal quarters of the Company’s fiscal year.
Inventory cost, where appropriate, is reduced by estimates of vendor rebates when earned or as the Com-pany progresses towards earning those rebates provided they are probable and reasonably estimable. Otherconsideration received from vendors is generally recorded as a reduction of merchandise costs upon completionof contractual milestones, terms of agreement, or other systematic and rational approach.
Impairment of long-lived assets and warehouse closing costs
The Company periodically evaluates its long-lived assets for indicators of impairment. Management’s judg-ments are based on market and operational conditions at the present time. Future events could cause managementto conclude that impairment factors exist, requiring an adjustment of these assets to their then-current fair marketvalue.
The Company provides estimates for warehouse closing costs, based on the applicable accounting principlesgenerally accepted in the United States. Future circumstances may result in the Company’s actual future closingcosts or the amount recognized upon the sale of the property to differ substantially from the original estimates.
Insurance/Self Insurance Liabilities
The Company uses a combination of insurance and self-insurance mechanisms to provide for the potentialliabilities for workers’ compensation, general liability, property damage, director and officers’ liability, vehicleliability and employee health care benefits. Liabilities associated with the risks that are retained by the Companyare not discounted and are estimated, in part, by considering historical claims experience and outside expertise,demographic factors, severity factors and other actuarial assumptions. The estimated accruals for these liabilitiescould be significantly affected if future occurrences and claims differ from these assumptions and historicaltrends.
Recent Accounting Pronouncements
In May 2005, the FASB issued Statement of Financial Accounting Standards (SFAS) No. 154, “AccountingChanges and Error Corrections, a Replacement of Accounting Principles Board (APB) Opinion No. 20 andFASB Statement No. 3.” SFAS 154 requires retrospective application to prior periods’ financial statements forchanges in accounting principles, unless it is impracticable to determine either the period-specific effects or thecumulative effect of the change. SFAS 154 also requires that retrospective application of a change in accountingprinciple be limited to the direct effects of the change. Indirect effects of a change in accounting principle, such
27

as a change in non-discretionary profit-sharing payments resulting from an accounting change, should be recog-nized in the period of the accounting change. SFAS 154 also requires that a change in depreciation, amortization,or depletion method for long-lived, non-financial assets be accounted for as a change in accounting estimate ef-fected by a change in accounting principle. SFAS 154 is effective for accounting changes and corrections of er-rors made in fiscal years beginning after December 15, 2005. Early adoption is permitted for accounting changesand corrections of errors made in fiscal years beginning after the date this Statement is issued. The Company isrequired to adopt the provisions of SFAS 154, as applicable, beginning in fiscal 2007. The Company does notbelieve the adoption of SFAS 154 will have a significant effect on its future consolidated financial statements.
In March 2005, the FASB issued FASB Interpretation (FIN) No. 47, “Accounting for Conditional Asset Re-tirement Obligations, An Interpretation of FASB Statement No. 143,” which requires an entity to recognize a li-ability for the fair value of a conditional asset retirement obligation when incurred if the liability’s fair value canbe reasonably estimated. The Company adopted the provisions of FIN 47 in the fourth quarter of fiscal 2005. Theadoption of this Interpretation did not have a material impact on the Company’s consolidated financial position,results of operations or cash flows.
In December 2004, the FASB issued SFAS No. 123R, “Share-based Payments.” SFAS 123R revises SFAS123, “Accounting for Stock-Based Compensation,” which the Company adopted as of the beginning of its fiscal2003, and supersedes APB Opinion No. 25, “Accounting for Stock Issued to Employees.” SFAS 123R applies totransactions in which an entity exchanges its equity instruments for goods or services and also applies to li-abilities an entity may incur for goods or services that are based on the fair value of those equity instruments. Allemployee stock option grants made by the Company since the beginning of fiscal 2003 have been expensed overthe related option vesting period based on the fair value at the date the options are granted using the Black-Scholes model. Under SFAS 123R, the Company will be required to select a valuation technique or option-pricing model that meets the criteria as stated in the standard. Allowable valuation models include a binomialmodel and the Black-Scholes model. The Company is required to adopt the provisions of SFAS 123R in the firstquarter of its fiscal 2006. The Company is in the process of assessing the impact on the Company’s results ofoperations from the adoption of SFAS 123R for its effect on prospective option grants. The adoption of SFAS123R requires the Company to value stock options granted prior to its adoption of SFAS 123 under the fair valuemethod and expense these amounts in the income statement over the stock option’s remaining vesting period.This will result in the Company expensing $13,043 in fiscal 2006, which would previously have been presentedin a proforma footnote disclosure. In addition, SFAS 123R will require the Company to reflect the tax savingsresulting from tax deductions in excess of expense reflected in its financial statements as a financing cash flow,which will impact the Company’s future reported cash flows from operating activities.
In November 2004, the FASB issued SFAS No. 151, “Inventory Costs—An Amendment of AccountingResearch Bulletin (ARB) No. 43, Chapter 4.” SFAS 151 clarifies that abnormal amounts of idle facility expense,freight, handling costs and spoilage should be expensed as incurred and not included in overhead. Further, SFAS151 requires that allocation of fixed and production facilities overheads to conversion costs should be based onnormal capacity of the production facilities. The provisions in this statement are effective for inventory costs in-curred during fiscal periods beginning after June 15, 2005. The Company does not believe that the adoption ofSFAS 151 will have a significant effect on its future consolidated financial statements.
In November 2004, the FASB issued SFAS No. 153, “Exchanges of Non-monetary Assets—An Amend-ment of APB No. 29.” The provisions of this statement are effective for non-monetary asset exchanges occurringin fiscal periods beginning after June 15, 2005. This statement eliminates the exception to fair value for ex-changes of similar productive assets and replaces it with a general exception for exchange transactions that donot have commercial substance—that is, transactions that are not expected to result in significant changes in thecash flows of the reporting entity. The Company does not believe that the adoption of SFAS 153 will have a sig-nificant effect on its future consolidated financial statements.
28

In March 2004, the FASB EITF reached a consensus on EITF Issue No. 03-1, “The Meaning of Other-Than-Temporary Impairment and Its Application to Certain Investments,” (EITF 03-1). The guidance prescribes a three-step model for determining whether an investment is other-than-temporarily impaired and requires disclosures aboutunrealized losses on investments. The accounting guidance became effective for reporting periods beginning afterJune 15, 2004, while the disclosure requirements became effective for annual reporting periods ending afterJune 15, 2004. In September 2004, the FASB issued FASB Staff Position (FSP) EITF 03-1-1, “Effective Date ofParagraphs 10-20 of EITF Issue No. 03-1 ‘The Meaning of Other-Than-Temporary Impairment and Its Applicationto Certain Investments,” (FSP EITF 03-1-1). FSP EITF 03-1-1 delayed the effective date for the measurement andrecognition guidance contained in paragraphs 10-20 of EITF Issue 03-1. In November 2005, the FASB issued FSPFAS 115-1 and FAS 124-1, “The Meaning of Other-Than-Temporary Impairment and its Application to CertainInvestments.” This FSP addresses the determination as to when an investment is considered impaired, whether theimpairment is other than temporary and the measurement of an impairment loss. This statement specifically nullifiesthe requirements of paragraph 10-18 of EITF 03-1 and references existing other-than-temporary impairment guid-ance. The guidance under this FSP is effective for reporting periods beginning after December 15, 2005 and theCompany continued to apply relevant “other-than-temporary” guidance as provided for in FSP EITF 03-1-1 duringfiscal 2005. The Company does not believe that the adoption of the guidance of FSP FAS 115-1 and FAS 124-1 willhave a significant effect on its future consolidated financial statements.
In November 2003, the EITF reached consensus on Issue No. 03-10, “Application of Issue No. 02-16 byResellers to Sales Incentives Offered to Consumers by Manufacturers,” with respect to determining if consid-eration received by a reseller from a vendor that is reimbursed by the vendor for honoring the vendor’s sale in-centives offered directly to consumers should be recorded as a reduction in sales. These rules apply totransactions entered into by consumers in fiscal periods beginning after November 25, 2003 and, therefore, applyto such transactions starting with the Company’s fiscal third quarter of 2004, which began February 16, 2004.The adoption of EITF 03-10 did not affect the Company’s consolidated gross profit or net income, but did resultin a reduction of both net sales and merchandise costs by an equal amount. Had the first half of fiscal 2004 andall of fiscal 2003 been reported under EITF 03-10 guidance, the sales and cost of sales would have been reducedby approximately $186,900 and $282,300, respectively.
Quantitative and Qualitative Disclosures About Market Risk
The Company is exposed to financial market risk resulting from changes in interest and foreign currencyrates. As a policy, the Company does not engage in speculative or leveraged transactions, nor hold or issuefinancial instruments for trading purposes.
The nature and amount of the Company’s long and short-term debt can be expected to vary as a result offuture business requirements, market conditions and other factors. As of August 28, 2005, the Company’s fixedrate long-term debt includes its $415,246 principal amount at maturity Zero Coupon Subordinated Notes carriedat $274,071 and additional notes and capital lease obligations totaling $132,141. The Company’s debt also in-cludes $300,000 51⁄2% Senior Notes carried at $307,688. The Company has entered into “fixed-to-floating”interest rate swaps on the Senior Notes, effectively converting these fixed interest rate securities to variable ratesecurities. As of August 28, 2005 and August 29, 2004, the Company had “fixed-to-floating” interest rate swapswith an aggregate notional amount of $300,000 and $600,000, respectively, and an aggregate fair value of $7,688and $25,754, respectively. Fluctuations in interest rates may affect the fair value of the fixed rate debt and mayaffect the interest expense related to the variable rate debt.
The Company holds interest-bearing instruments that are classified as cash and cash equivalents and short-term investments. The Company’s investment policy is to manage its total cash and cash equivalents and short-term investments balances to preserve principal and liquidity while maximizing the return on the investmentportfolio through the full investment of available funds. The Company diversifies its investment portfolio by in-vesting in multiple types of investment-grade securities and through internal management and the use of
29

third-party investment managers. Short-term investments generally have a maturity of three months to five yearsfrom the purchase date. Investments with maturities beyond one year may be classified as short-term based ontheir highly liquid nature and because such marketable securities represent the investment of cash that is avail-able for current operations. As the majority of these instruments are of a short-term nature, if interest rates wereto increase or decrease immediately, there is no material risk of a valuation adjustment related to these instru-ments. For those instruments that are classified as available for sale, the unrealized gains or losses related to fluc-tuations in interest rates are reflected in other accumulated comprehensive income or loss. Based on theCompany’s cash and cash equivalents and short-term investments balances at August 28, 2005, a 100 basis pointincrease or decrease in interest rates would result in an increase or decrease of approximately $15,000 to interestincome (pre-tax) on an annual basis.
Most foreign currency transactions have been conducted in local currencies, limiting the Company’s ex-posure to changes in currency rates. The Company periodically enters into short-term forward foreign exchangecontracts to hedge the impact of fluctuations in foreign currency rates on inventory purchases. The fair value offoreign exchange contracts outstanding at August 28, 2005 was $42,901.
MANAGEMENT REPORTS
Management’s Report on the Financial Statements
Our management is responsible for the preparation, integrity and objectivity of the accompanying con-solidated financial statements and the related financial information. The financial statements have been preparedin conformity with accounting principles generally accepted in the United States of America and necessarily in-clude certain amounts that are based on estimates and informed judgments. Our management also prepared therelated financial information included in this Annual Report on Form 10-K and is responsible for its accuracy andconsistency with the financial statements.
The consolidated financial statements have been audited by KPMG LLP, an independent registered publicaccounting firm, who conducted their audit in accordance with the standards of the Public Company AccountingOversight Board (United States). The independent registered public accounting firm’s responsibility is to expressan opinion as to the fairness with which such financial statements present our financial position, results of oper-ations and cash flows in accordance with accounting principles generally accepted in the United States.
Management’s Annual Report on Internal Control over Financial Reporting
Our management is responsible for establishing and maintaining adequate internal control over financial report-ing as defined in Rule 13a-15(f) under the Securities Exchange Act of 1934. Our internal control over financialreporting is designed to provide reasonable assurance regarding the reliability of financial reporting and the prepara-tion of financial statements for external purposes in accordance with generally accepted accounting principles andinclude those policies and procedures that: (1) pertain to the maintenance of records that in reasonable detail accu-rately and fairly reflect our transactions and the dispositions of our assets; (2) provide reasonable assurance that ourtransactions are recorded as necessary to permit preparation of financial statements in accordance with generally ac-cepted accounting principles, and that our receipts and expenditures are being made only in accordance with appro-priate authorizations; and (3) provide reasonable assurance regarding prevention or timely detection of unauthorizedacquisition, use or disposition of our assets that could have a material effect on our financial statements.
30

Because of its inherent limitations, internal control over financial reporting may not prevent or detect mis-statements. Therefore, even those systems determined to be effective can provide only reasonable assurance withrespect to financial statement preparation and presentation.
Under the supervision and with the participation of our management, we assessed the effectiveness of ourinternal control over financial reporting as of August 28, 2005, using the criteria set forth by the Committee ofSponsoring Organizations of the Treadway Commission (COSO) in Internal Control—Integrated Framework.Based on its assessment, management has concluded that our internal control over financial reporting was effec-tive as of August 28, 2005.
KPMG LLP, an independent registered public accounting firm, has audited management’s assessment of theeffectiveness of our internal control over financial reporting as of August 28, 2005, as stated in their audit reportherein.
Controls and Procedures
Our management, including the Chief Executive Officer (principal executive officer) and Chief FinancialOfficer (principal financial officer), evaluated the effectiveness of our disclosure controls and procedures pur-suant to Rule 13a-15(b) under the Exchange Act, as of August 28, 2005. Based on that evaluation, our ChiefExecutive Officer and Chief Financial Officer concluded that our disclosure controls and procedures are effectivein ensuring that information required to be disclosed by us in the reports we file or submit under the ExchangeAct is recorded, processed, summarized and reported within the time periods specified in the SEC’s rules andforms.
There were no changes in internal control over financial reporting during the fiscal fourth quarter endedAugust 28, 2005, that have materially affected, or are reasonably likely to materially affect, our internal controlover financial reporting.
James D. SinegalPresident,Chief Executive Officer
Richard A. GalantiExecutive Vice President,Chief Financial Officer
31
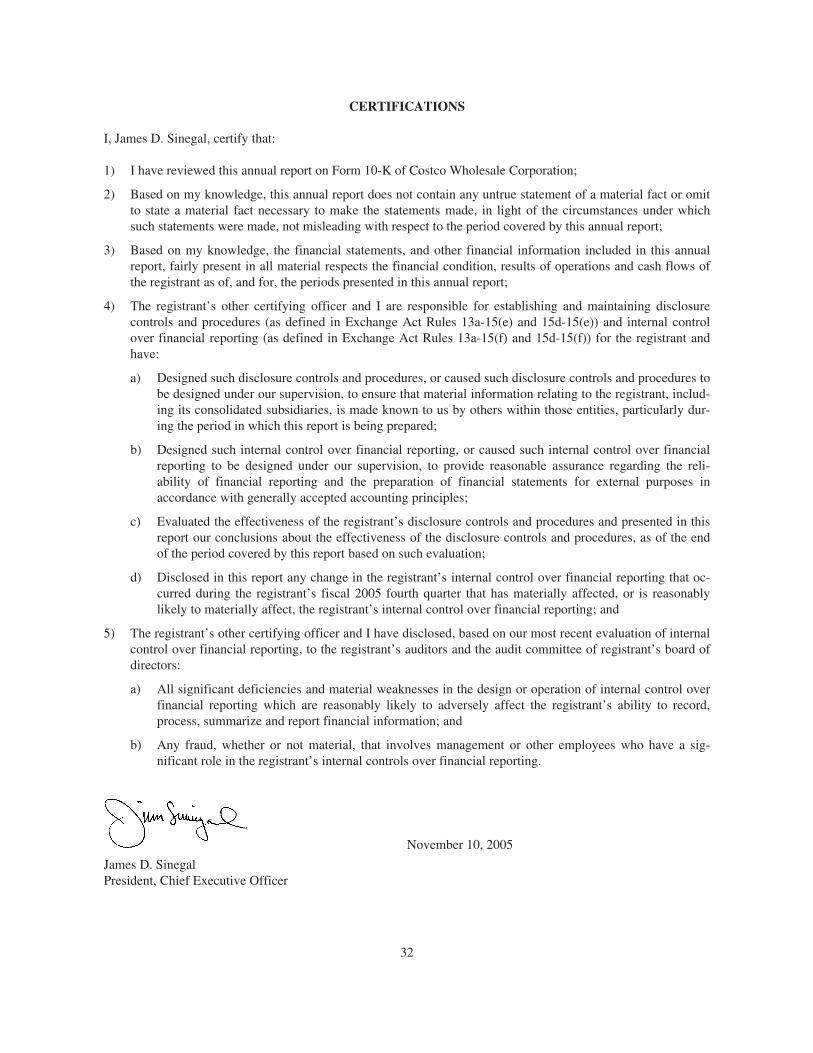
CERTIFICATIONS
I, James D. Sinegal, certify that:
1) I have reviewed this annual report on Form 10-K of Costco Wholesale Corporation;
2) Based on my knowledge, this annual report does not contain any untrue statement of a material fact or omitto state a material fact necessary to make the statements made, in light of the circumstances under whichsuch statements were made, not misleading with respect to the period covered by this annual report;
3) Based on my knowledge, the financial statements, and other financial information included in this annualreport, fairly present in all material respects the financial condition, results of operations and cash flows ofthe registrant as of, and for, the periods presented in this annual report;
4) The registrant’s other certifying officer and I are responsible for establishing and maintaining disclosurecontrols and procedures (as defined in Exchange Act Rules 13a-15(e) and 15d-15(e)) and internal controlover financial reporting (as defined in Exchange Act Rules 13a-15(f) and 15d-15(f)) for the registrant andhave:
a) Designed such disclosure controls and procedures, or caused such disclosure controls and procedures tobe designed under our supervision, to ensure that material information relating to the registrant, includ-ing its consolidated subsidiaries, is made known to us by others within those entities, particularly dur-ing the period in which this report is being prepared;
b) Designed such internal control over financial reporting, or caused such internal control over financialreporting to be designed under our supervision, to provide reasonable assurance regarding the reli-ability of financial reporting and the preparation of financial statements for external purposes inaccordance with generally accepted accounting principles;
c) Evaluated the effectiveness of the registrant’s disclosure controls and procedures and presented in thisreport our conclusions about the effectiveness of the disclosure controls and procedures, as of the endof the period covered by this report based on such evaluation;
d) Disclosed in this report any change in the registrant’s internal control over financial reporting that oc-curred during the registrant’s fiscal 2005 fourth quarter that has materially affected, or is reasonablylikely to materially affect, the registrant’s internal control over financial reporting; and
5) The registrant’s other certifying officer and I have disclosed, based on our most recent evaluation of internalcontrol over financial reporting, to the registrant’s auditors and the audit committee of registrant’s board ofdirectors:
a) All significant deficiencies and material weaknesses in the design or operation of internal control overfinancial reporting which are reasonably likely to adversely affect the registrant’s ability to record,process, summarize and report financial information; and
b) Any fraud, whether or not material, that involves management or other employees who have a sig-nificant role in the registrant’s internal controls over financial reporting.
November 10, 2005
James D. SinegalPresident, Chief Executive Officer
32

CERTIFICATIONS
I, Richard A. Galanti, certify that:
1) I have reviewed this annual report on Form 10-K of Costco Wholesale Corporation;
2) Based on my knowledge, this annual report does not contain any untrue statement of a material fact or omitto state a material fact necessary to make the statements made, in light of the circumstances under whichsuch statements were made, not misleading with respect to the period covered by this annual report;
3) Based on my knowledge, the financial statements, and other financial information included in this annualreport, fairly present in all material respects the financial condition, results of operations and cash flows ofthe registrant as of, and for, the periods presented in this annual report;
4) The registrant’s other certifying officer and I are responsible for establishing and maintaining disclosurecontrols and procedures (as defined in Exchange Act Rules 13a-15(e) and 15d-15(e)) and internal controlover financial reporting (as defined in Exchange Act Rules 13a-15(f) and 15d-15(f)) for the registrant andhave:
a) Designed such disclosure controls and procedures, or caused such disclosure controls and procedures tobe designed under our supervision, to ensure that material information relating to the registrant, includ-ing its consolidated subsidiaries, is made known to us by others within those entities, particularly dur-ing the period in which this report is being prepared;
b) Designed such internal control over financial reporting, or caused such internal control over financialreporting to be designed under our supervision, to provide reasonable assurance regarding the reli-ability of financial reporting and the preparation of financial statements for external purposes inaccordance with generally accepted accounting principles;
c) Evaluated the effectiveness of the registrant’s disclosure controls and procedures and presented in thisreport our conclusions about the effectiveness of the disclosure controls and procedures, as of the endof the period covered by this report based on such evaluation;
d) Disclosed in this report any change in the registrant’s internal control over financial reporting that oc-curred during the registrant’s fiscal 2005 fourth quarter that has materially affected, or is reasonablylikely to materially affect, the registrant’s internal control over financial reporting; and
5) The registrant’s other certifying officer and I have disclosed, based on our most recent evaluation of internalcontrol over financial reporting, to the registrant’s auditors and the audit committee of registrant’s board ofdirectors:
a) All significant deficiencies and material weaknesses in the design or operation of internal control overfinancial reporting which are reasonably likely to adversely affect the registrant’s ability to record,process, summarize and report financial information; and
b) Any fraud, whether or not material, that involves management or other employees who have a sig-nificant role in the registrant’s internal controls over financial reporting.
November 10, 2005
Richard A. GalantiExecutive Vice President, Chief Financial Officer
33

REPORT OF INDEPENDENT REGISTERED PUBLIC ACCOUNTING FIRM
The Board of Directors and ShareholdersCostco Wholesale Corporation:
We have audited the accompanying consolidated balance sheets of Costco Wholesale Corporation and sub-sidiaries as of August 28, 2005 and August 29, 2004 and the related consolidated statements of income, stock-holders’ equity and comprehensive income and cash flows for the 52 weeks ended August 28, 2005, August 29,2004, and August 31, 2003. These consolidated financial statements are the responsibility of the Company’smanagement. Our responsibility is to express an opinion on these consolidated financial statements based on ouraudits.
We conducted our audits in accordance with the standards of the Public Company Accounting OversightBoard (United States). Those standards require that we plan and perform the audit to obtain reasonable assuranceabout whether the consolidated financial statements are free of material misstatement. An audit includes examin-ing, on a test basis, evidence supporting the amounts and disclosures in the consolidated financial statements. Anaudit also includes assessing the accounting principles used and significant estimates made by management, aswell as evaluating the overall consolidated financial statement presentation. We believe that our audits provide areasonable basis for our opinion.
In our opinion, the consolidated financial statements referred to above present fairly, in all material respects,the consolidated financial position of Costco Wholesale Corporation and subsidiaries as of August 28, 2005 andAugust 29, 2004, and the results of their operations and their cash flows for the 52 weeks ended August 28,2005, August 29, 2004, and August 31, 2003, in conformity with U.S. generally accepted accounting principles.
Effective February 16, 2004, the Company adopted Emerging Issues Task Force Issue No. 03-10,“Application of Issue No. 02-16 by Resellers to Sales Incentives Offered to Consumers by Manufacturers.”Additionally, during the fiscal year ended August 31, 2003, the Company adopted Emerging Issues Task ForceIssue No. 02-16, “Accounting by a Customer (Including a Reseller) for Certain Consideration Received from aVendor,” based on the specific transition guidance.
We also have audited, in accordance with the standards of the Public Company Accounting Oversight Board(United States), the effectiveness of the Company’s internal control over financial reporting as of August 28,2005, based on criteria established in Internal Control—Integrated Framework issued by the Committee of Spon-soring Organizations of the Treadway Commission (COSO), and our report dated November 9, 2005 expressedan unqualified opinion on management’s assessment of, and the effective operation of, internal control overfinancial reporting. Our report refers to the Company’s change in method of accounting for cash considerationreceived from a vendor to conform to the requirements of Emerging Issues Task Force No. 03-10, effectiveFebruary 16, 2004 and Issue No. 02-16 effective during the year ended August 31, 2003.
Seattle, WashingtonNovember 9, 2005
34

REPORT OF INDEPENDENT REGISTERED PUBLIC ACCOUNTING FIRM
The Board of Directors and ShareholdersCostco Wholesale Corporation:
We have audited management’s assessment, included in the accompanying Management’s Annual Reporton Internal Control over Financial Reporting appearing under Item 8, that Costco Wholesale Corporation andsubsidiaries (the Company) maintained effective internal control over financial reporting as of August 28, 2005,based on criteria established in Internal Control—Integrated Framework issued by the Committee of SponsoringOrganizations of the Treadway Commission (COSO). The Company’s management is responsible for maintain-ing effective internal control over financial reporting and for its assessment of the effectiveness of internal con-trol over financial reporting. Our responsibility is to express an opinion on management’s assessment and anopinion on the effectiveness of the Company’s internal control over financial reporting based on our audit.
We conducted our audit in accordance with the standards of the Public Company Accounting OversightBoard (United States). Those standards require that we plan and perform the audit to obtain reasonable assuranceabout whether effective internal control over financial reporting was maintained in all material respects. Our au-dit included obtaining an understanding of internal control over financial reporting, evaluating management’sassessment, testing and evaluating the design and operating effectiveness of internal control, and performing suchother procedures as we considered necessary in the circumstances. We believe that our audit provides a reason-able basis for our opinion.
A company’s internal control over financial reporting is a process designed to provide reasonable assuranceregarding the reliability of financial reporting and the preparation of financial statements for external purposes inaccordance with generally accepted accounting principles. A company’s internal control over financial reportingincludes those policies and procedures that (1) pertain to the maintenance of records that, in reasonable detail,accurately and fairly reflect the transactions and dispositions of the assets of the company; (2) provide reasonableassurance that transactions are recorded as necessary to permit preparation of financial statements in accordancewith generally accepted accounting principles, and that receipts and expenditures of the company are being madeonly in accordance with authorizations of management and directors of the company; and (3) provide reasonableassurance regarding prevention or timely detection of unauthorized acquisition, use, or disposition of the compa-ny’s assets that could have a material effect on the financial statements.
Because of its inherent limitations, internal control over financial reporting may not prevent or detect mis-statements. Also, projections of any evaluation of effectiveness to future periods are subject to the risk that con-trols may become inadequate because of changes in conditions, or that the degree of compliance with the policiesor procedures may deteriorate.
In our opinion, management’s assessment that the Company maintained effective internal control over finan-cial reporting as of August 28, 2005, is fairly stated, in all material respects, based on criteria established in In-ternal Control—Integrated Framework issued by the Committee of Sponsoring Organizations of the TreadwayCommission. Also, in our opinion, the Company maintained, in all material respects, effective internal controlover financial reporting as of August 28, 2005, based on criteria established in Internal Control—IntegratedFramework issued by the Committee of Sponsoring Organizations of the Treadway Commission.
We also have audited, in accordance with the standards of the Public Company Accounting Oversight Board(United States), the consolidated balance sheets of the Company as of August 28, 2005 and August 29 2004, andthe related consolidated statements of income, stockholders’ equity and comprehensive income, and cash flowsfor the 52 weeks ended August 28, 2005, August 29, 2004 and August 31, 2003 and our report dated No-vember 9, 2005 expressed an unqualified opinion on those consolidated financial statements. Our report refers tothe Company’s change in method of accounting for cash consideration received from a vendor to conform to therequirements of Emerging Issues Task Force No. 03-10, effective February 16, 2004 and Issue No. 02-16 effec-tive during the year ended August 31, 2003.
Seattle, WashingtonNovember 9, 2005
35

COSTCO WHOLESALE CORPORATION
CONSOLIDATED BALANCE SHEETS(dollars in thousands, except par value)
August 28,2005
August 29,2004
ASSETSCURRENT ASSETS
Cash and cash equivalents . . . . . . . . . . . . . . . . . . . . . . . . . . . . . . . . . . . . . . . . . . $ 2,062,585 $ 2,823,135Short-term investments . . . . . . . . . . . . . . . . . . . . . . . . . . . . . . . . . . . . . . . . . . . . 1,397,272 306,747Receivables, net . . . . . . . . . . . . . . . . . . . . . . . . . . . . . . . . . . . . . . . . . . . . . . . . . . 399,974 335,175Merchandise inventories . . . . . . . . . . . . . . . . . . . . . . . . . . . . . . . . . . . . . . . . . . . 4,014,699 3,643,585Other current assets . . . . . . . . . . . . . . . . . . . . . . . . . . . . . . . . . . . . . . . . . . . . . . . 211,908 160,457
Total current assets . . . . . . . . . . . . . . . . . . . . . . . . . . . . . . . . . . . . . . . . . . . 8,086,438 7,269,099
PROPERTY AND EQUIPMENTLand . . . . . . . . . . . . . . . . . . . . . . . . . . . . . . . . . . . . . . . . . . . . . . . . . . . . . . . . . . . 2,502,247 2,269,543Buildings, leaseholds and land improvements . . . . . . . . . . . . . . . . . . . . . . . . . . 5,622,439 5,164,658Equipment and fixtures . . . . . . . . . . . . . . . . . . . . . . . . . . . . . . . . . . . . . . . . . . . . 2,181,740 1,974,995Construction in progress . . . . . . . . . . . . . . . . . . . . . . . . . . . . . . . . . . . . . . . . . . . 180,604 132,180
10,487,030 9,541,376Less accumulated depreciation and amortization . . . . . . . . . . . . . . . . . . . . . . . . (2,696,838) (2,321,547)
Net property and equipment . . . . . . . . . . . . . . . . . . . . . . . . . . . . . . . . . . . . 7,790,192 7,219,829
OTHER ASSETS . . . . . . . . . . . . . . . . . . . . . . . . . . . . . . . . . . . . . . . . . . . . . . . . . . . . 637,012 603,620
$16,513,642 $15,092,548
LIABILITIES AND STOCKHOLDERS’ EQUITY
CURRENT LIABILITIESShort-term borrowings . . . . . . . . . . . . . . . . . . . . . . . . . . . . . . . . . . . . . . . . . . . . $ 54,356 $ 21,595Accounts payable . . . . . . . . . . . . . . . . . . . . . . . . . . . . . . . . . . . . . . . . . . . . . . . . 4,213,724 3,600,200Accrued salaries and benefits . . . . . . . . . . . . . . . . . . . . . . . . . . . . . . . . . . . . . . . 1,025,181 904,209Accrued sales and other taxes . . . . . . . . . . . . . . . . . . . . . . . . . . . . . . . . . . . . . . . 263,899 223,009Deferred membership income . . . . . . . . . . . . . . . . . . . . . . . . . . . . . . . . . . . . . . . 500,558 453,881Current portion long-term debt . . . . . . . . . . . . . . . . . . . . . . . . . . . . . . . . . . . . . . 3,225 305,594Other current liabilities . . . . . . . . . . . . . . . . . . . . . . . . . . . . . . . . . . . . . . . . . . . . 548,031 662,062
Total current liabilities . . . . . . . . . . . . . . . . . . . . . . . . . . . . . . . . . . . . . . . . 6,608,974 6,170,550LONG-TERM DEBT, excluding current portion . . . . . . . . . . . . . . . . . . . . . . . . . 710,675 993,746DEFERRED INCOME TAXES AND OTHER LIABILITIES . . . . . . . . . . . . . . 254,270 244,176
Total liabilities . . . . . . . . . . . . . . . . . . . . . . . . . . . . . . . . . . . . . . . . . . . . . . 7,573,919 7,408,472
COMMITMENTS AND CONTINGENCIESMINORITY INTEREST . . . . . . . . . . . . . . . . . . . . . . . . . . . . . . . . . . . . . . . . . . . . . 58,614 59,266
STOCKHOLDERS’ EQUITYPreferred stock $.005 par value; 100,000,000 shares authorized; no shares
issued and outstanding . . . . . . . . . . . . . . . . . . . . . . . . . . . . . . . . . . . . . . . . . . — —Common stock $.005 par value; 900,000,000 shares authorized; 472,480,000
and 462,637,000 shares issued and outstanding . . . . . . . . . . . . . . . . . . . . . . . 2,362 2,313Additional paid-in capital . . . . . . . . . . . . . . . . . . . . . . . . . . . . . . . . . . . . . . . . . . 2,096,554 1,466,366Other accumulated comprehensive income . . . . . . . . . . . . . . . . . . . . . . . . . . . . 158,039 16,144Retained earnings . . . . . . . . . . . . . . . . . . . . . . . . . . . . . . . . . . . . . . . . . . . . . . . . 6,624,154 6,139,987
Total stockholders’ equity . . . . . . . . . . . . . . . . . . . . . . . . . . . . . . . . . . . . . . 8,881,109 7,624,810
$16,513,642 $15,092,548
The accompanying notes are an integral part of these consolidated financial statements.
36

COSTCO WHOLESALE CORPORATION
CONSOLIDATED STATEMENTS OF INCOME(dollars in thousands, except per share data)
52 WeeksEnded
August 28,2005
52 WeeksEnded
August 29,2004
52 WeeksEnded
August 31,2003
REVENUENet sales . . . . . . . . . . . . . . . . . . . . . . . . . . . . . . . . . . . . . . . . . . . . . $51,862,072 $47,145,712 $41,692,699Membership fees . . . . . . . . . . . . . . . . . . . . . . . . . . . . . . . . . . . . . . . 1,073,156 961,280 852,853
Total revenue . . . . . . . . . . . . . . . . . . . . . . . . . . . . . . . . . . . . . . 52,935,228 48,106,992 42,545,552OPERATING EXPENSES
Merchandise costs . . . . . . . . . . . . . . . . . . . . . . . . . . . . . . . . . . . . . . 46,346,961 42,092,016 37,235,383Selling, general and administrative . . . . . . . . . . . . . . . . . . . . . . . . . 5,044,341 4,597,877 4,097,398Preopening expenses . . . . . . . . . . . . . . . . . . . . . . . . . . . . . . . . . . . . 53,230 30,451 36,643Provision for impaired assets and closing costs, net . . . . . . . . . . . . 16,393 1,000 19,500
Operating income . . . . . . . . . . . . . . . . . . . . . . . . . . . . . . . . . . 1,474,303 1,385,648 1,156,628OTHER INCOME (EXPENSE)
Interest expense . . . . . . . . . . . . . . . . . . . . . . . . . . . . . . . . . . . . . . . . (34,437) (36,651) (36,920)Interest income and other . . . . . . . . . . . . . . . . . . . . . . . . . . . . . . . . 109,096 51,627 38,525
INCOME BEFORE INCOME TAXES . . . . . . . . . . . . . . . . . . . . . 1,548,962 1,400,624 1,158,233Provision for income taxes . . . . . . . . . . . . . . . . . . . . . . . . . . . . . . . 485,870 518,231 437,233
NET INCOME . . . . . . . . . . . . . . . . . . . . . . . . . . . . . . . . . . . . . . . . . . $ 1,063,092 $ 882,393 $ 721,000
NET INCOME PER COMMON SHARE:Basic . . . . . . . . . . . . . . . . . . . . . . . . . . . . . . . . . . . . . . . . . . . . . . . . $ 2.24 $ 1.92 $ 1.58
Diluted . . . . . . . . . . . . . . . . . . . . . . . . . . . . . . . . . . . . . . . . . . . . . . . $ 2.18 $ 1.85 $ 1.53
Shares used in calculation (000’s) . . . . . . . . . . . . . . . . . . . . . . . . . .Basic . . . . . . . . . . . . . . . . . . . . . . . . . . . . . . . . . . . . . . . . . . . . 473,945 459,223 456,335Diluted . . . . . . . . . . . . . . . . . . . . . . . . . . . . . . . . . . . . . . . . . . . 492,035 482,459 479,326
Dividends per share . . . . . . . . . . . . . . . . . . . . . . . . . . . . . . . . . . . . . $ 0.43 $ 0.20 $ —
The accompanying notes are an integral part of these consolidated financial statements.
37

COSTCO WHOLESALE CORPORATION
CONSOLIDATED STATEMENTS OF STOCKHOLDERS’ EQUITYAND COMPREHENSIVE INCOME
For the 52 weeks ended August 28, 2005, August 29, 2004 and August 31, 2003(in thousands)
Common Stock AdditionalPaid-InCapital
OtherAccumulated
ComprehensiveIncome/(Loss)
RetainedEarnings TotalShares Amount
BALANCE AT SEPTEMBER 1, 2002 . . . . . 455,325 $2,277 $1,220,954 $(157,725) $4,628,731 $5,694,237Comprehensive Income
Net Income . . . . . . . . . . . . . . . . . . . . . . . . . — — — — 721,000 721,000Other accumulated comprehensive income
Foreign currency translationadjustment . . . . . . . . . . . . . . . . . . . . . . . — — — 79,745 — 79,745
Total comprehensive income . . . . . . . . . — — — 79,745 721,000 800,745Stock options exercised including income tax
benefits and other . . . . . . . . . . . . . . . . . . . . 2,154 10 47,919 — — 47,929Stock-based compensation . . . . . . . . . . . . . . . — — 12,069 — — 12,069
BALANCE AT AUGUST 31, 2003 . . . . . . . 457,479 2,287 1,280,942 (77,980) 5,349,731 6,554,980Comprehensive Income
Net Income . . . . . . . . . . . . . . . . . . . . . . . . . — — — — 882,393 882,393Other accumulated comprehensive income
Foreign currency translation adjustmentand other . . . . . . . . . . . . . . . . . . . . . . . . — — — 94,124 — 94,124
Total comprehensive income . . . . . . . . . — — — 94,124 882,393 976,517Stock options exercised including income tax
benefits and other . . . . . . . . . . . . . . . . . . . . 5,153 26 148,785 — — 148,811Conversion of convertible debentures . . . . . . 5 — 131 — — 131Stock-based compensation . . . . . . . . . . . . . . . — — 36,508 — — 36,508Cash dividends . . . . . . . . . . . . . . . . . . . . . . . . — — — — (92,137) (92,137)
BALANCE AT AUGUST 29, 2004 . . . . . . . 462,637 2,313 1,466,366 16,144 6,139,987 7,624,810Comprehensive Income
Net Income . . . . . . . . . . . . . . . . . . . . . . . . . — — — — 1,063,092 1,063,092Other accumulated comprehensive income
Foreign currency translation adjustmentand other . . . . . . . . . . . . . . . . . . . . . . . . — — — 141,895 — 141,895
Total comprehensive income . . . . . . . . . — — — 141,895 1,063,092 1,204,987Stock options exercised including income tax
benefits and other . . . . . . . . . . . . . . . . . . . . 9,138 46 323,545 — — 323,591Conversion of convertible debentures . . . . . . 9,910 49 277,554 — — 277,603Stock repurchase . . . . . . . . . . . . . . . . . . . . . . (9,205) (46) (38,848) — (374,358) (413,252)Stock-based compensation . . . . . . . . . . . . . . . — — 67,937 — — 67,937Cash dividends . . . . . . . . . . . . . . . . . . . . . . . . — — — — (204,567) (204,567)
BALANCE AT AUGUST 28, 2005 . . . . . . . 472,480 $2,362 $2,096,554 $ 158,039 $6,624,154 $8,881,109
The accompanying notes are an integral part of these consolidated financial statements.
38
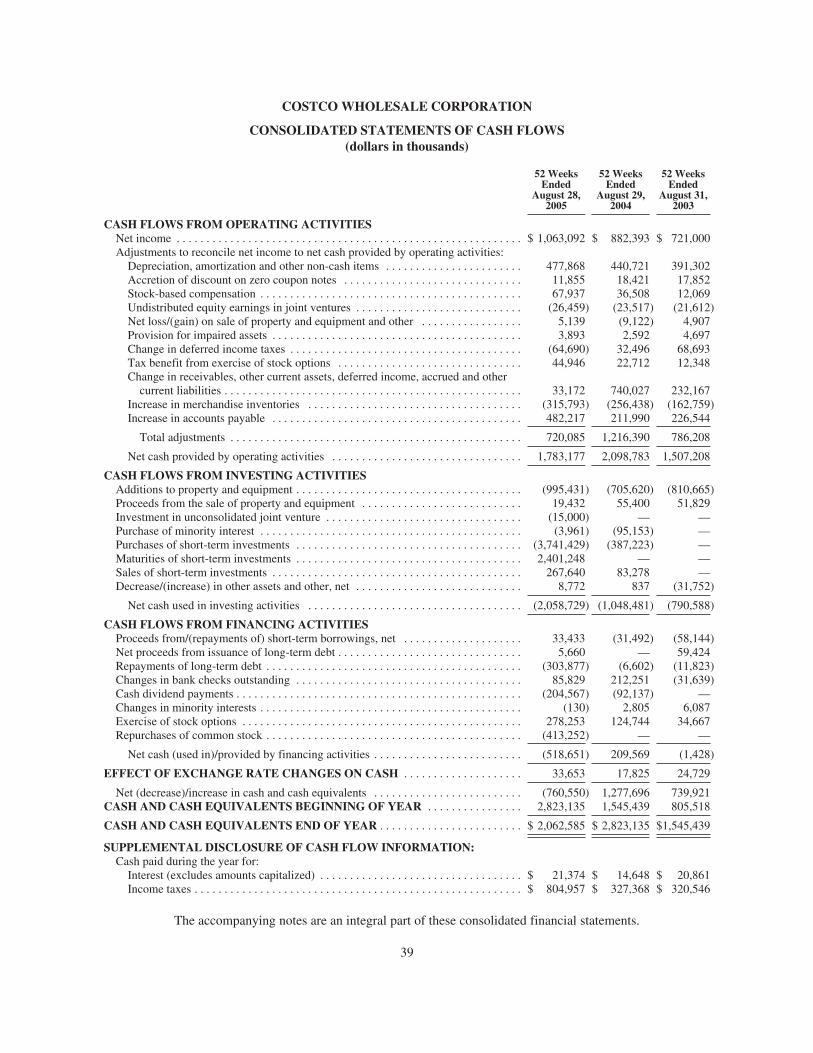
COSTCO WHOLESALE CORPORATION
CONSOLIDATED STATEMENTS OF CASH FLOWS(dollars in thousands)
52 WeeksEnded
August 28,2005
52 WeeksEnded
August 29,2004
52 WeeksEnded
August 31,2003
CASH FLOWS FROM OPERATING ACTIVITIESNet income . . . . . . . . . . . . . . . . . . . . . . . . . . . . . . . . . . . . . . . . . . . . . . . . . . . . . . . . . . $ 1,063,092 $ 882,393 $ 721,000Adjustments to reconcile net income to net cash provided by operating activities:
Depreciation, amortization and other non-cash items . . . . . . . . . . . . . . . . . . . . . . . 477,868 440,721 391,302Accretion of discount on zero coupon notes . . . . . . . . . . . . . . . . . . . . . . . . . . . . . . 11,855 18,421 17,852Stock-based compensation . . . . . . . . . . . . . . . . . . . . . . . . . . . . . . . . . . . . . . . . . . . . 67,937 36,508 12,069Undistributed equity earnings in joint ventures . . . . . . . . . . . . . . . . . . . . . . . . . . . . (26,459) (23,517) (21,612)Net loss/(gain) on sale of property and equipment and other . . . . . . . . . . . . . . . . . 5,139 (9,122) 4,907Provision for impaired assets . . . . . . . . . . . . . . . . . . . . . . . . . . . . . . . . . . . . . . . . . . 3,893 2,592 4,697Change in deferred income taxes . . . . . . . . . . . . . . . . . . . . . . . . . . . . . . . . . . . . . . . (64,690) 32,496 68,693Tax benefit from exercise of stock options . . . . . . . . . . . . . . . . . . . . . . . . . . . . . . . 44,946 22,712 12,348Change in receivables, other current assets, deferred income, accrued and other
current liabilities . . . . . . . . . . . . . . . . . . . . . . . . . . . . . . . . . . . . . . . . . . . . . . . . . . 33,172 740,027 232,167Increase in merchandise inventories . . . . . . . . . . . . . . . . . . . . . . . . . . . . . . . . . . . . (315,793) (256,438) (162,759)Increase in accounts payable . . . . . . . . . . . . . . . . . . . . . . . . . . . . . . . . . . . . . . . . . . 482,217 211,990 226,544
Total adjustments . . . . . . . . . . . . . . . . . . . . . . . . . . . . . . . . . . . . . . . . . . . . . . . . . 720,085 1,216,390 786,208
Net cash provided by operating activities . . . . . . . . . . . . . . . . . . . . . . . . . . . . . . . . 1,783,177 2,098,783 1,507,208
CASH FLOWS FROM INVESTING ACTIVITIESAdditions to property and equipment . . . . . . . . . . . . . . . . . . . . . . . . . . . . . . . . . . . . . . (995,431) (705,620) (810,665)Proceeds from the sale of property and equipment . . . . . . . . . . . . . . . . . . . . . . . . . . . 19,432 55,400 51,829Investment in unconsolidated joint venture . . . . . . . . . . . . . . . . . . . . . . . . . . . . . . . . . (15,000) — —Purchase of minority interest . . . . . . . . . . . . . . . . . . . . . . . . . . . . . . . . . . . . . . . . . . . . (3,961) (95,153) —Purchases of short-term investments . . . . . . . . . . . . . . . . . . . . . . . . . . . . . . . . . . . . . . (3,741,429) (387,223) —Maturities of short-term investments . . . . . . . . . . . . . . . . . . . . . . . . . . . . . . . . . . . . . . 2,401,248 — —Sales of short-term investments . . . . . . . . . . . . . . . . . . . . . . . . . . . . . . . . . . . . . . . . . . 267,640 83,278 —Decrease/(increase) in other assets and other, net . . . . . . . . . . . . . . . . . . . . . . . . . . . . 8,772 837 (31,752)
Net cash used in investing activities . . . . . . . . . . . . . . . . . . . . . . . . . . . . . . . . . . . . (2,058,729) (1,048,481) (790,588)
CASH FLOWS FROM FINANCING ACTIVITIESProceeds from/(repayments of) short-term borrowings, net . . . . . . . . . . . . . . . . . . . . 33,433 (31,492) (58,144)Net proceeds from issuance of long-term debt . . . . . . . . . . . . . . . . . . . . . . . . . . . . . . . 5,660 — 59,424Repayments of long-term debt . . . . . . . . . . . . . . . . . . . . . . . . . . . . . . . . . . . . . . . . . . . (303,877) (6,602) (11,823)Changes in bank checks outstanding . . . . . . . . . . . . . . . . . . . . . . . . . . . . . . . . . . . . . . 85,829 212,251 (31,639)Cash dividend payments . . . . . . . . . . . . . . . . . . . . . . . . . . . . . . . . . . . . . . . . . . . . . . . . (204,567) (92,137) —Changes in minority interests . . . . . . . . . . . . . . . . . . . . . . . . . . . . . . . . . . . . . . . . . . . . (130) 2,805 6,087Exercise of stock options . . . . . . . . . . . . . . . . . . . . . . . . . . . . . . . . . . . . . . . . . . . . . . . 278,253 124,744 34,667Repurchases of common stock . . . . . . . . . . . . . . . . . . . . . . . . . . . . . . . . . . . . . . . . . . . (413,252) — —
Net cash (used in)/provided by financing activities . . . . . . . . . . . . . . . . . . . . . . . . . (518,651) 209,569 (1,428)
EFFECT OF EXCHANGE RATE CHANGES ON CASH . . . . . . . . . . . . . . . . . . . . 33,653 17,825 24,729
Net (decrease)/increase in cash and cash equivalents . . . . . . . . . . . . . . . . . . . . . . . . . (760,550) 1,277,696 739,921CASH AND CASH EQUIVALENTS BEGINNING OF YEAR . . . . . . . . . . . . . . . . 2,823,135 1,545,439 805,518
CASH AND CASH EQUIVALENTS END OF YEAR . . . . . . . . . . . . . . . . . . . . . . . . $ 2,062,585 $ 2,823,135 $1,545,439
SUPPLEMENTAL DISCLOSURE OF CASH FLOW INFORMATION:Cash paid during the year for:
Interest (excludes amounts capitalized) . . . . . . . . . . . . . . . . . . . . . . . . . . . . . . . . . . $ 21,374 $ 14,648 $ 20,861Income taxes . . . . . . . . . . . . . . . . . . . . . . . . . . . . . . . . . . . . . . . . . . . . . . . . . . . . . . . $ 804,957 $ 327,368 $ 320,546
The accompanying notes are an integral part of these consolidated financial statements.
39

COSTCO WHOLESALE CORPORATION
NOTES TO CONSOLIDATED FINANCIAL STATEMENTS(dollars in thousands, except per share data)
Note 1—Summary of Significant Accounting Policies
Basis of Presentation
The consolidated financial statements include the accounts of Costco Wholesale Corporation, a Washingtoncorporation, and its subsidiaries (“Costco” or the “Company”). All material inter-company transactions betweenthe Company and its subsidiaries have been eliminated in consolidation.
Costco operates membership warehouses that offer low prices on a limited selection of nationally brandedand selected private label products in a wide range of merchandise categories in no-frills, self-service warehousefacilities. At August 28, 2005, Costco operated 460 warehouse clubs: 335 in the United States and three in PuertoRico; 65 in Canada; 16 in the United Kingdom; five in Korea; four in Taiwan; five in Japan; and 27 warehousesin Mexico (through a 50%-owned joint venture).
The Company’s investments in the Costco Mexico joint venture and in other unconsolidated joint venturesthat are less than majority owned, and for which the Company does not control, are accounted for under theequity method. The investment in Costco Mexico is included in other assets and was $232,402 at August 28,2005 and $178,997 at August 29, 2004. The equity in earnings of Costco Mexico is included in interest incomeand other in the accompanying consolidated statements of income, and for fiscal 2005, 2004 and 2003, was$24,949, $22,208 and $21,400, respectively. The amount of retained earnings that represents undistributed earn-ings of Costco Mexico was $133,231 and $108,282 at August 28, 2005 and August 29, 2004, respectively.
Fiscal Years
The Company reports on a 52/53-week fiscal year basis, which ends on the Sunday nearest August 31st.Fiscal years 2005, 2004 and 2003 were 52-week years.
Cash Equivalents
The Company considers all highly liquid investments with a maturity of three months or less at the date ofpurchase and proceeds due from credit and debit card transactions with settlement terms of less than five days tobe cash equivalents. Of the total cash and cash equivalents of $2,062,585 at August 28, 2005 and $2,823,135 atAugust 29, 2004, credit and debit card receivables were $521,634 and $441,244, respectively.
Short-term Investments
Short-term investments have a maturity of three months to five years at the date of purchase. Investmentswith maturities beyond one year may be classified as short-term based on their highly liquid nature and becausesuch marketable securities represent the investment of cash that is available for current operations. Short-terminvestments classified as available for sale are recorded at market value using the specific identification methodwith the unrealized gains and losses reflected in other accumulated comprehensive income or loss until realized.Realized gains and losses from the sale of available for sale securities, if any, are determined on a specific identi-fication basis. Certificates of deposit and $215,525 and $171,179 of corporate notes and bonds at August 28,2005 and August 29, 2004, respectively, have been designated as “hold to maturity securities” and are recordedat cost. At August 28, 2005 and August 29, 2004, the cost of these securities approximated market value.
40

Note 1—Summary of Significant Accounting Policies (Continued)
Short-term investments at August 28, 2005 and August 29, 2004, were as follows:
Fiscal 2005
CostBasis
UnrealizedGains
UnrealizedLosses
RecordedBasis
Certificates of deposit . . . . . . . . . . . . . . . . . . . . . . . . . . . . . . . . $ 43,719 $ — $ — $ 43,719U.S. government and agency securities . . . . . . . . . . . . . . . . . . . 562,370 25 (4,629) 557,766Money market mutual funds . . . . . . . . . . . . . . . . . . . . . . . . . . . 49,372 — — 49,372Corporate notes and bonds . . . . . . . . . . . . . . . . . . . . . . . . . . . . 696,267 66 (2,289) 694,044Asset and mortgage backed securities . . . . . . . . . . . . . . . . . . . . 52,782 21 (432) 52,371
Total short-term investments . . . . . . . . . . . . . . . . . . . . . . . $1,404,510 $112 $(7,350) $1,397,272
Fiscal 2004
CostBasis
UnrealizedGains
UnrealizedLosses
RecordedBasis
Certificates of deposit . . . . . . . . . . . . . . . . . . . . . . . . . . . . . . . . $ 23,450 $ — $ — $ 23,450U.S. government and agency securities . . . . . . . . . . . . . . . . . . . 46,060 102 (107) 46,055Money market mutual funds . . . . . . . . . . . . . . . . . . . . . . . . . . . 1,662 — — 1,662Corporate notes and bonds . . . . . . . . . . . . . . . . . . . . . . . . . . . . 216,271 95 (149) 216,217Asset and mortgage backed securities . . . . . . . . . . . . . . . . . . . . 19,444 34 (115) 19,363
Total short-term investments . . . . . . . . . . . . . . . . . . . . . . . $ 306,887 $231 $ (371) $ 306,747
Unrealized losses from fixed income securities are primarily attributable to changes in interest rates. Of theunrealized losses of $7,350 and $371 at August 28, 2005 and August 29, 2004, respectively, $222 and $0 haveholding periods exceeding twelve months. Management does not believe any unrealized losses represent another-than-temporary impairment based on our evaluation of available evidence as of August 28, 2005. TheCompany currently has the financial ability to hold short-term investments with an unrealized loss until maturityand not incur any recognized losses.
The estimate of fair value is based on publicly available market information or other estimates determinedby management. The maturities of short-term investments at August 28, 2005, were as follows:
Cost BasisEstimatedFair Value
Due in one year or less . . . . . . . . . . . . . . . . . . . . . . . . . . . . . . . . . . $ 736,390 $ 735,075Due after one year through five years . . . . . . . . . . . . . . . . . . . . . . . 648,079 642,249Due after five years . . . . . . . . . . . . . . . . . . . . . . . . . . . . . . . . . . . . . 20,041 19,948
Total . . . . . . . . . . . . . . . . . . . . . . . . . . . . . . . . . . . . . . . . . . . . . . . . $1,404,510 $1,397,272
Short-term investments include fixed maturity securities.
Receivables, net
Receivables consist primarily of vendor rebates and promotional allowances, receivables from governmenttax authorities and other miscellaneous amounts due to the Company, and are net of an allowance for doubtfulaccounts of $1,416 at August 28, 2005 and $1,139 at August 29, 2004. Management determines the allowance fordoubtful accounts based on known troubled accounts and historical experience applied to an aging of accounts.
Vendor Rebates and Allowances
Periodic payments from vendors in the form of volume rebates or other purchase discounts that are evi-denced by signed agreements are reflected in the carrying value of the inventory when earned or as the Company
41

NOTES TO CONSOLIDATED FINANCIAL STATEMENTS(dollars in thousands, except per share data) (Continued)
Note 1—Summary of Significant Accounting Policies (Continued)
progresses towards earning the rebate or discount and as a component of cost of sales as the merchandise is sold.Other consideration received from vendors is generally recorded as a reduction of merchandise costs upon com-pletion of contractual milestones, terms of the related agreement, or by other systematic and rational approach.
Merchandise Inventories
Merchandise inventories are valued at the lower of cost or market as determined primarily by the retail in-ventory method, and are stated using the last-in, first-out (LIFO) method for substantially all U.S. merchandiseinventories. Merchandise inventories for all foreign operations are primarily valued by the retail method of ac-counting, and are stated using the first-in, first-out (FIFO) method. The Company believes the LIFO methodmore fairly presents the results of operations by more closely matching current costs with current revenues. TheCompany records an adjustment each quarter if necessary, for the expected annual effect of inflation and theseestimates are adjusted to actual results determined at year-end. At August 28, 2005, merchandise inventories val-ued at LIFO approximated FIFO after considering the lower of cost or market principle. At August 29, 2004,merchandise inventories valued using LIFO exceeded the comparable FIFO value by approximately $13,410 dueto the aggregate effects of deflation.
August 28,2005
August 29,2004
Merchandise inventories consist of:United States (primarily LIFO) . . . . . . . . . . . . . . . . . . . . . . . . $3,155,462 $2,903,551Foreign (FIFO) . . . . . . . . . . . . . . . . . . . . . . . . . . . . . . . . . . . . 859,237 740,034
Total . . . . . . . . . . . . . . . . . . . . . . . . . . . . . . . . . . . . . . . . $4,014,699 $3,643,585
The Company provides for estimated inventory losses between physical inventory counts on the basis of astandard percentage of sales. This provision is adjusted periodically to reflect the actual shrinkage results of thephysical inventory counts, which generally occur in the second and fourth quarters of the Company’s fiscal year.
Property and Equipment
Property and equipment are stated at cost. Depreciation and amortization expenses are computed using thestraight-line method for financial reporting purposes. Buildings are generally depreciated over twenty-five tothirty-five years; equipment and fixtures are depreciated over three to ten years; leasehold improvements areamortized over the initial term of the lease or the useful lives of the assets if shorter. The Company capitalizescertain costs related to the acquisition and development of software and amortizes those costs using the straight-line method over their estimated useful lives, which range from three to five years.
Interest costs incurred on property during the construction period are capitalized. The amount of interestcosts capitalized was $7,226 in fiscal 2005, $4,155 in fiscal 2004, and $3,272 in fiscal 2003.
Impairment of Long-Lived Assets
The Company periodically evaluates the realizability of long-lived assets for impairment when managementmakes the decision to relocate or close a warehouse or when events or changes in circumstances occur, whichmay indicate the carrying amount of the asset may not be recoverable. The Company evaluates the carrying valueof the asset by comparing the estimated future undiscounted cash flows generated from the use of the asset and
42

Note 1—Summary of Significant Accounting Policies (Continued)
its eventual disposition with the asset’s reported net carrying value. The Company recorded pre-tax, non-cashcharges of $3,893, $2,592 and $4,697 in fiscal 2005, 2004 and 2003, respectively, reflecting its estimate of im-pairment relating to real property. The charge reflects the difference between the carrying value and fair value,which was based on estimated market valuations for those assets whose carrying value is not currently antici-pated to be recoverable through future cash flows.
Goodwill
Goodwill, net of accumulated amortization, resulting from certain business combinations is included inother assets, and totaled $71,848 at August 28, 2005 and $65,721 at August 29, 2004. The increase in goodwillwas primarily due to the Company acquiring the remaining 4% interest in CWC Travel Inc, bringing Costco’sownership in this entity to 100% in the fourth quarter of fiscal 2005. The Company follows Statement of Finan-cial Accounting Standards (SFAS) No. 142, “Accounting for Goodwill and Other Intangibles,” which specifiesthat goodwill and some intangible assets should no longer be amortized, but instead will be subject to periodicimpairment testing. Accordingly, the Company reviews previously reported goodwill for impairment on anannual basis, or more frequently if circumstances dictate. No impairment of goodwill has been incurred to date.
Accounts Payable
The Company’s banking system provides for the daily replenishment of major bank accounts as checks arepresented. Accordingly, included in accounts payable at August 28, 2005 and August 29, 2004 are $527,920 and$438,025, respectively, representing the excess of outstanding checks over cash on deposit at the banks on whichthe checks were drawn.
Insurance/Self Insurance Liabilities
The Company uses a combination of insurance and self-insurance mechanisms to provide for workers’compensation, general liability, property damage, director and officers’ liability, vehicle liability and employeehealth care benefits. Liabilities associated with the risks that are retained by the Company are not discounted andare estimated, in part, by considering historical claims experience and outside expertise, demographic factors,severity factors and other actuarial assumptions. The estimated accruals for these liabilities could be significantlyaffected if future occurrences and claims differ from these assumptions and historical trends.
Derivatives
The Company has limited involvement with derivative financial instruments and uses them only to managewell-defined interest rate and foreign exchange risks. Forward foreign exchange contracts are used to hedge theimpact of fluctuations of foreign exchange on inventory purchases and typically have very short terms. The ag-gregate amount of foreign exchange contracts outstanding at August 28, 2005 and August 29, 2004, was $42,466and $30,495, respectively. The majority of the forward foreign exchange contracts were entered into by the Com-pany’s wholly-owned United Kingdom subsidiary primarily to hedge U.S. dollar merchandise inventory pur-chases. The Company monitors its foreign currency exposures to ensure the overall effectiveness of its foreigncurrency hedge positions. The only other derivative instruments the Company holds are interest rate swaps, whichthe Company uses to manage the interest rate risk associated with its borrowings and to manage the Company’smix of fixed-rate and variable-rate debt. As of August 28, 2005, the Company had “fixed-to-floating” interest rateswaps with an aggregate notional amount of $300,000 and an aggregate fair value of $7,688, which is recorded inother assets on the Company’s consolidated balance sheet. These swaps were entered into effective March 25,2002, and are designated and qualify as fair value hedges of the Company’s $300,000 51⁄2% Senior Notes. As theterms of the swaps match those of the underlying hedged debt, the changes in the fair value of these swaps are off-set by corresponding changes in the carrying amount of the hedged debt and result in no net earnings impact. As
43

NOTES TO CONSOLIDATED FINANCIAL STATEMENTS(dollars in thousands, except per share data) (Continued)
Note 1—Summary of Significant Accounting Policies (Continued)
of August 29, 2004, the Company had “fixed-to-floating” interest rate swaps with an aggregate notional amount of$600,000 and an aggregate fair value of $25,754. In addition to the Company’s swap on the 51⁄2% Senior Notesnoted above, the Company had entered into a swap on its $300,000 71⁄8% Senior Notes effective November 13,2001, which was designated and qualified as a fair value hedge. The $300,000 71⁄8% Senior Notes matured andwere repaid on June 15, 2005. Concurrent to this transaction, the related swap agreement expired.
Equity Investments in Subsidiary and Joint Ventures
On June 30, 2005, the Company acquired the remaining 4% equity interest in CWC Travel Inc for cash of$3,961, bringing Costco’s ownership in this entity to 100%. In conjunction with this purchase the Company re-corded goodwill of $3,440. In addition, during fiscal 2005 the Company contributed an additional $15,000 to itsinvestment in Costco Mexico (a 50%-owned joint venture), which did not impact its percentage ownership as thejoint venture partner made a like investment. On October 3, 2003, the Company acquired from Carrefour Neder-land B.V. its 20% equity interest in Costco Wholesale UK Limited for cash of $95,153, bringing Costco’sownership in Costco Wholesale UK Limited to 100%. In conjunction with this purchase the Company increasedthe carrying value of the land and buildings of Costco Wholesale UK Limited by $12,808 and recorded goodwillof $16,719.
Foreign Currency Translations
The functional currencies of the Company’s international subsidiaries are the local currency of the countryin which the subsidiary is located. Assets and liabilities recorded in foreign currencies, as well as the Company’sinvestment in the Costco Mexico joint venture, are translated at the exchange rate on the balance sheet date.Translation adjustments resulting from this process are charged or credited to other accumulated comprehensiveincome (loss). Revenue and expenses of the Company’s consolidated foreign operations are translated at averagerates of exchange prevailing during the year. Gains and losses on foreign currency transactions are included inexpenses and were not significant in fiscal 2005, 2004, or 2003.
Revenue Recognition
The Company recognizes sales, net of estimated returns, at the time the customer takes possession of mer-chandise or receives services. When the Company collects payment from customers prior to the transfer ofownership of merchandise or the performance of services, the amount received is recorded as deferred revenueon the consolidated balance sheets until the sale or service is completed. The Company provides for estimatedsales returns based on historical returns levels. The allowance for sales returns (sales returns net of merchandisecosts) was $8,240 and $5,524 at August 28, 2005 and August 29, 2004, respectively.
The Company evaluates the criteria of the Financial Accounting Standards Board (FASB) Emerging IssuesTask Force (EITF) 99-19, “Reporting Revenue Gross as a Principal Versus Net as an Agent,” in determiningwhether it is appropriate to record the gross amount of merchandise sales and related costs or the net amountearned as commissions. Generally, when the Company is the primary obligor, is subject to inventory risk, has lat-itude in establishing prices and selecting suppliers, influence product or service specifications, or has several butnot all of these indicators, revenue is recorded gross. If the Company is not the primary obligor and does not pos-sess other indicators of gross reporting as noted above, it records the net amounts as commissions earned.
Membership fee revenue represents annual membership fees paid by substantially all of the Company’smembers. The Company accounts for membership fee revenue on a “deferred basis,” whereby membership fee
44
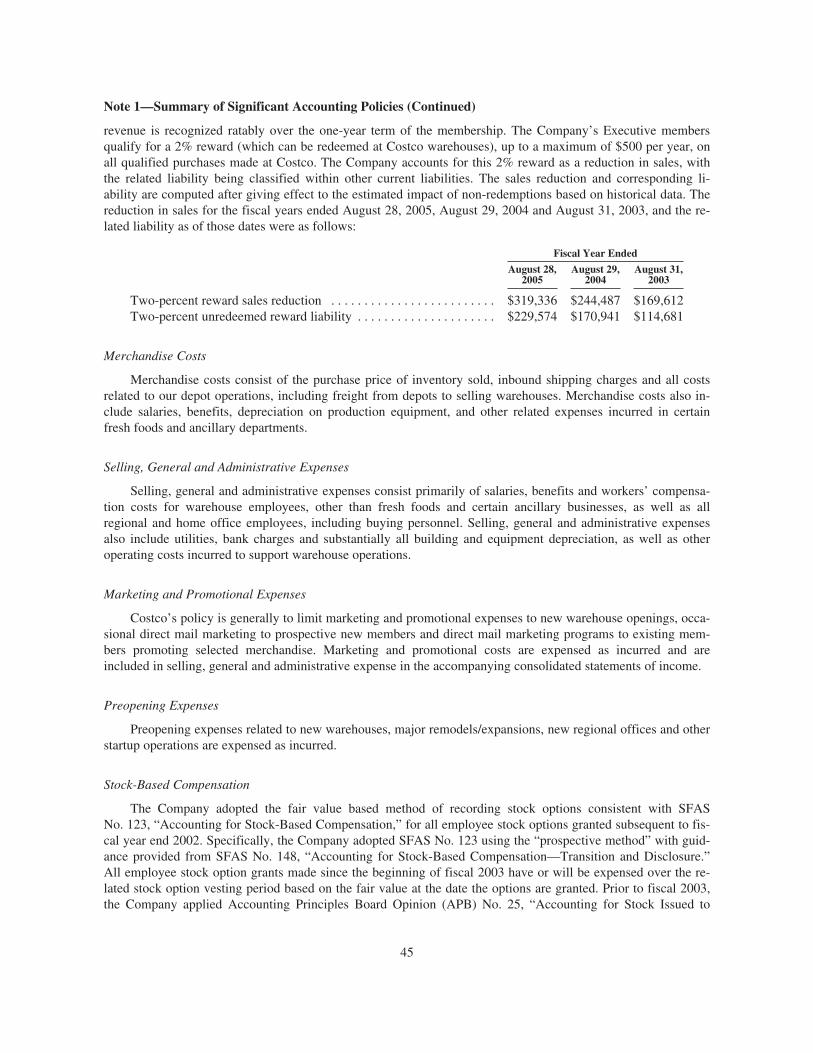
Note 1—Summary of Significant Accounting Policies (Continued)
revenue is recognized ratably over the one-year term of the membership. The Company’s Executive membersqualify for a 2% reward (which can be redeemed at Costco warehouses), up to a maximum of $500 per year, onall qualified purchases made at Costco. The Company accounts for this 2% reward as a reduction in sales, withthe related liability being classified within other current liabilities. The sales reduction and corresponding li-ability are computed after giving effect to the estimated impact of non-redemptions based on historical data. Thereduction in sales for the fiscal years ended August 28, 2005, August 29, 2004 and August 31, 2003, and the re-lated liability as of those dates were as follows:
Fiscal Year Ended
August 28,2005
August 29,2004
August 31,2003
Two-percent reward sales reduction . . . . . . . . . . . . . . . . . . . . . . . . . $319,336 $244,487 $169,612Two-percent unredeemed reward liability . . . . . . . . . . . . . . . . . . . . . $229,574 $170,941 $114,681
Merchandise Costs
Merchandise costs consist of the purchase price of inventory sold, inbound shipping charges and all costsrelated to our depot operations, including freight from depots to selling warehouses. Merchandise costs also in-clude salaries, benefits, depreciation on production equipment, and other related expenses incurred in certainfresh foods and ancillary departments.
Selling, General and Administrative Expenses
Selling, general and administrative expenses consist primarily of salaries, benefits and workers’ compensa-tion costs for warehouse employees, other than fresh foods and certain ancillary businesses, as well as allregional and home office employees, including buying personnel. Selling, general and administrative expensesalso include utilities, bank charges and substantially all building and equipment depreciation, as well as otheroperating costs incurred to support warehouse operations.
Marketing and Promotional Expenses
Costco’s policy is generally to limit marketing and promotional expenses to new warehouse openings, occa-sional direct mail marketing to prospective new members and direct mail marketing programs to existing mem-bers promoting selected merchandise. Marketing and promotional costs are expensed as incurred and areincluded in selling, general and administrative expense in the accompanying consolidated statements of income.
Preopening Expenses
Preopening expenses related to new warehouses, major remodels/expansions, new regional offices and otherstartup operations are expensed as incurred.
Stock-Based Compensation
The Company adopted the fair value based method of recording stock options consistent with SFASNo. 123, “Accounting for Stock-Based Compensation,” for all employee stock options granted subsequent to fis-cal year end 2002. Specifically, the Company adopted SFAS No. 123 using the “prospective method” with guid-ance provided from SFAS No. 148, “Accounting for Stock-Based Compensation—Transition and Disclosure.”All employee stock option grants made since the beginning of fiscal 2003 have or will be expensed over the re-lated stock option vesting period based on the fair value at the date the options are granted. Prior to fiscal 2003,the Company applied Accounting Principles Board Opinion (APB) No. 25, “Accounting for Stock Issued to
45

NOTES TO CONSOLIDATED FINANCIAL STATEMENTS(dollars in thousands, except per share data) (Continued)
Note 1—Summary of Significant Accounting Policies (Continued)
Employees,” and related interpretations in accounting for stock options. Because the Company granted stock op-tions to employees at exercise prices equal to fair market value on the date of grant prior to fiscal 2003, no com-pensation cost was recognized for these option grants.
Had compensation costs for the Company’s stock-based compensation plans been determined based on thefair value at the grant dates for awards made prior to fiscal 2003, under those plans and consistent with SFASNo. 123, the Company’s net income and net income per share would have been reduced to the pro forma amountsindicated below:
Fiscal Year Ended
August 28,2005
August 29,2004
August 31,2003
Net income, as reported . . . . . . . . . . . . . . . . . . . . . . . . . . . . . . . . . . . . . . . . . . $1,063,092 $882,393 $721,000Add: Stock-based employee compensation expense included in
reported net income, net of related tax effects . . . . . . . . . . . . . . . . . . 43,344 23,000 7,513Deduct: Total stock-based employee compensation expense
determined under fair value based methods for all awards, net ofrelated tax effects . . . . . . . . . . . . . . . . . . . . . . . . . . . . . . . . . . . . . . . . (63,012) (58,388) (70,257)
Pro-forma net income . . . . . . . . . . . . . . . . . . . . . . . . . . . . . . . . . . . . . . . . . . . $1,043,424 $847,005 $658,256
Net Income per share:Basic—as reported . . . . . . . . . . . . . . . . . . . . . . . . . . . . . . . . . . . . . . . . . $ 2.24 $ 1.92 $ 1.58
Basic—pro-forma . . . . . . . . . . . . . . . . . . . . . . . . . . . . . . . . . . . . . . . . . . $ 2.20 $ 1.84 $ 1.44
Diluted—as reported . . . . . . . . . . . . . . . . . . . . . . . . . . . . . . . . . . . . . . . . $ 2.18 $ 1.85 $ 1.53
Diluted—pro-forma . . . . . . . . . . . . . . . . . . . . . . . . . . . . . . . . . . . . . . . . . $ 2.12 $ 1.78 $ 1.40
Fair Value of Financial Instruments
The carrying value of the Company’s financial instruments, including cash and cash equivalents, receivablesand accounts payable approximate fair value due to their short-term nature or variable interest rates. Short-terminvestments classified as available for sale are recorded at market value with unrealized gains or losses reflectedin other accumulated comprehensive income or loss. Short-term investments designated as “hold-to-maturity”securities are recorded at cost and approximated market value at August 28, 2005 and August 29, 2004. The fairvalue of fixed rate debt at August 28, 2005 and August 29, 2004 was $841,399 and $1,581,368, respectively, in-cluding the senior debt that the Company entered into “fixed-to-floating” interest rate swap agreements.
Closing Costs
Warehouse closing costs incurred relate principally to the Company’s efforts to relocate certain warehousesthat were not otherwise impaired to larger and better-located facilities. The provision for fiscal 2005 includedcharges of $11,619 for warehouse closing expenses and net losses of $881 related to the sale of real property. Thefiscal 2004 provision included charges of $16,548 for warehouse closing expenses offset by net gains of $15,548related to the sale of real property. As of August 28, 2005, the Company’s reserve for warehouse closing costswas $9,556, of which $9,118 related to future lease obligations. This compares to a reserve for warehouse closingcosts of $10,367 at August 29, 2004, of which $9,184 related to future lease obligations.
46
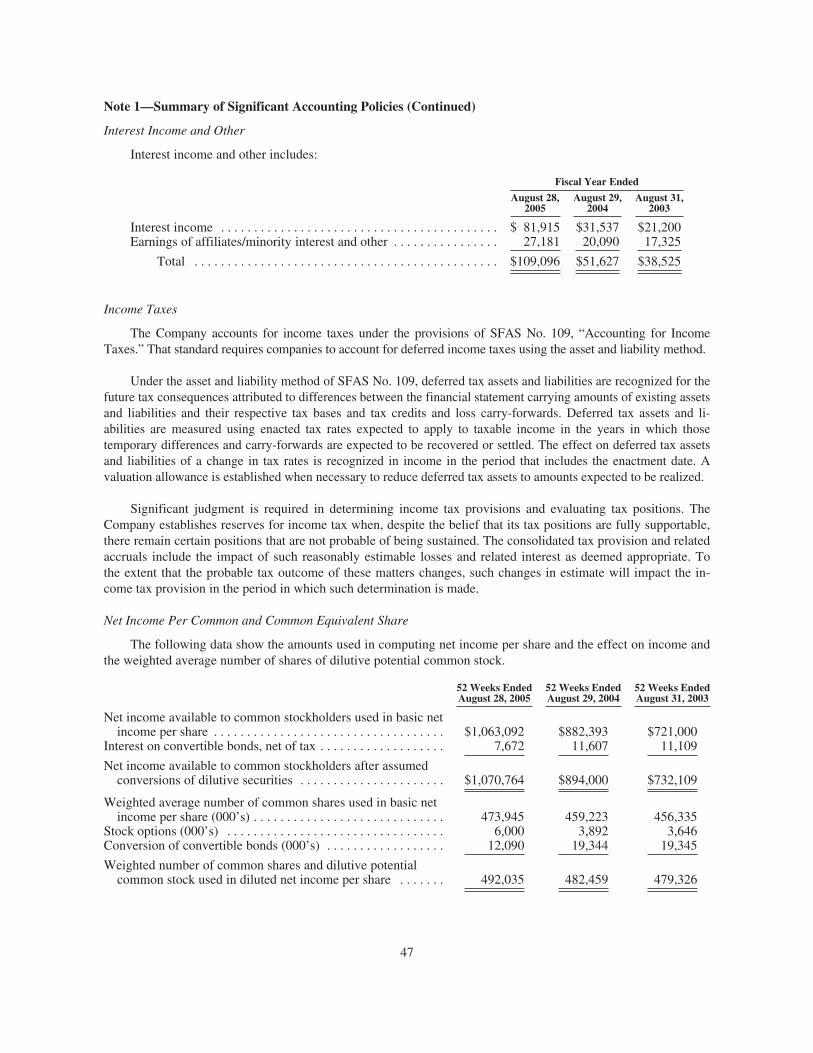
Note 1—Summary of Significant Accounting Policies (Continued)
Interest Income and Other
Interest income and other includes:
Fiscal Year Ended
August 28,2005
August 29,2004
August 31,2003
Interest income . . . . . . . . . . . . . . . . . . . . . . . . . . . . . . . . . . . . . . . . . . $ 81,915 $31,537 $21,200Earnings of affiliates/minority interest and other . . . . . . . . . . . . . . . . 27,181 20,090 17,325
Total . . . . . . . . . . . . . . . . . . . . . . . . . . . . . . . . . . . . . . . . . . . . . . $109,096 $51,627 $38,525
Income Taxes
The Company accounts for income taxes under the provisions of SFAS No. 109, “Accounting for IncomeTaxes.” That standard requires companies to account for deferred income taxes using the asset and liability method.
Under the asset and liability method of SFAS No. 109, deferred tax assets and liabilities are recognized for thefuture tax consequences attributed to differences between the financial statement carrying amounts of existing assetsand liabilities and their respective tax bases and tax credits and loss carry-forwards. Deferred tax assets and li-abilities are measured using enacted tax rates expected to apply to taxable income in the years in which thosetemporary differences and carry-forwards are expected to be recovered or settled. The effect on deferred tax assetsand liabilities of a change in tax rates is recognized in income in the period that includes the enactment date. Avaluation allowance is established when necessary to reduce deferred tax assets to amounts expected to be realized.
Significant judgment is required in determining income tax provisions and evaluating tax positions. TheCompany establishes reserves for income tax when, despite the belief that its tax positions are fully supportable,there remain certain positions that are not probable of being sustained. The consolidated tax provision and relatedaccruals include the impact of such reasonably estimable losses and related interest as deemed appropriate. Tothe extent that the probable tax outcome of these matters changes, such changes in estimate will impact the in-come tax provision in the period in which such determination is made.
Net Income Per Common and Common Equivalent Share
The following data show the amounts used in computing net income per share and the effect on income andthe weighted average number of shares of dilutive potential common stock.
52 Weeks EndedAugust 28, 2005
52 Weeks EndedAugust 29, 2004
52 Weeks EndedAugust 31, 2003
Net income available to common stockholders used in basic netincome per share . . . . . . . . . . . . . . . . . . . . . . . . . . . . . . . . . . . $1,063,092 $882,393 $721,000
Interest on convertible bonds, net of tax . . . . . . . . . . . . . . . . . . . 7,672 11,607 11,109
Net income available to common stockholders after assumedconversions of dilutive securities . . . . . . . . . . . . . . . . . . . . . . $1,070,764 $894,000 $732,109
Weighted average number of common shares used in basic netincome per share (000’s) . . . . . . . . . . . . . . . . . . . . . . . . . . . . . 473,945 459,223 456,335
Stock options (000’s) . . . . . . . . . . . . . . . . . . . . . . . . . . . . . . . . . 6,000 3,892 3,646Conversion of convertible bonds (000’s) . . . . . . . . . . . . . . . . . . 12,090 19,344 19,345
Weighted number of common shares and dilutive potentialcommon stock used in diluted net income per share . . . . . . . 492,035 482,459 479,326
47

NOTES TO CONSOLIDATED FINANCIAL STATEMENTS(dollars in thousands, except per share data) (Continued)
Note 1—Summary of Significant Accounting Policies (Continued)
The diluted share base calculation for fiscal years ended August 28, 2005, August 29, 2004 and August 31,2003, excludes 12,575,000, 24,748,000 and 33,362,000 stock options outstanding, respectively. These options areexcluded due to their anti-dilutive effect.
Dividends
Costco’s Board of Directors declared four quarterly cash dividends during fiscal year 2005. The first twodividends of $0.10 per share were paid November 26, 2004 and February 25, 2005, to shareholders of record atthe close of business on November 5, 2004 and February 8, 2005, respectively. The remaining two dividends of$0.115 per share were paid May 27, 2005 and August 26, 2005 to shareholders of record at the close of businesson May 6, 2005 and August 5, 2005, respectively. The Company paid a dividend of $0.10 per share in the thirdand fourth quarters of fiscal 2004.
Payment of future dividends is subject to declaration by the Board of Directors. Factors considered in de-termining the size of the dividends are profitability and expected capital needs of the Company. Subject to qual-ifications stated above, the Company presently expects to pay dividends on a quarterly basis.
Stock Repurchase Program
On November 30, 2001, the Company’s Board of Directors approved a stock repurchase program, authoriz-ing the repurchase of up to $500,000 of Costco Common Stock through November 30, 2004. Under the program,the Company could repurchase shares at any time in the open market or in private transactions as market con-ditions warrant. The repurchased shares would be retired. On October 25, 2004, the Board of Directors renewedthe program for another three years. On June 7, 2005 the Company began repurchasing shares on the open mar-ket and through August 28, 2005 the Company has repurchased 9,205,100 shares of common stock at an averageprice of $44.89, totaling approximately $413,252, including commissions.
Subsequent to the Company’s fiscal 2005 year end, on August 29, 2005, the Board of Directors of Costcoauthorized an additional stock repurchase program of up to $1,000,000. Under the program, which has no expira-tion date, the Company may repurchase shares at any time in the open market or in private transactions as marketconditions warrant. Subsequent to the Company’s fiscal 2005 year end and through October 28, 2005, the Com-pany purchased an additional 2,247,000 shares at an average price of $45.83, fully utilizing the amount approvedby the Board of Directors in October 2004 and reducing the amount of share value available to be purchasedunder the plan approved in fiscal 2006 by $16,240.
Significant Non-Cash Transactions
During fiscal 2005, $280,811 in principal amount of the Company’s 31⁄2% Zero Coupon SubordinatedNotes was converted by noteholders into 9,910,011 shares of common stock.
Recent Accounting Pronouncements
In May 2005, the FASB issued SFAS No. 154, “Accounting Changes and Error Corrections, A Replacementof APB Opinion No. 20 and FASB Statement No. 3.” SFAS 154 requires retrospective application to prior peri-ods’ financial statements for changes in accounting principles, unless it is impracticable to determine either theperiod-specific effects or the cumulative effect of the change. SFAS 154 also requires that retrospective applica-tion of a change in accounting principle be limited to the direct effects of the change. Indirect effects of a changein accounting principle, such as a change in non-discretionary profit-sharing payments resulting from an account-ing change, should be recognized in the period of the accounting change. SFAS 154 also requires that a change in
48

Note 1—Summary of Significant Accounting Policies (Continued)
depreciation, amortization, or depletion method for long-lived, non-financial assets be accounted for as a changein accounting estimate effected by a change in accounting principle. SFAS 154 is effective for accounting changesand corrections of errors made in fiscal years beginning after December 15, 2005. Early adoption is permitted foraccounting changes and corrections of errors made in fiscal years beginning after the date this Statement is issued.The Company is required to adopt the provisions of SFAS 154, as applicable, beginning in fiscal 2007.
In March 2005, the FASB issued FASB Interpretation (FIN) No. 47, “Accounting for Conditional Asset Re-tirement Obligations, An Interpretation of FASB Statement No. 143,” which requires an entity to recognize a li-ability for the fair value of a conditional asset retirement obligation when incurred if the liability’s fair value canbe reasonably estimated. The Company adopted the provisions of FIN 47 in the fourth quarter of fiscal 2005. Theadoption of this Interpretation did not have a material impact on its consolidated financial position, results ofoperations or cash flows.
In December 2004, the FASB issued SFAS No. 123R, “Share-based Payments”. SFAS 123R revises SFAS123, “Accounting for Stock-Based Compensation,” which the Company adopted as of the beginning of its fiscal2003, and supersedes APB Opinion No. 25, “Accounting for Stock Issued to Employees”. SFAS 123R applies totransactions in which an entity exchanges its equity instruments for goods or services and also applies to li-abilities an entity may incur for goods or services that are based on the fair value of those equity instruments. Allemployee stock option grants made by the Company since the beginning of fiscal 2003 have been expensed overthe related option vesting period based on the fair value at the date the options are granted using the Black-Scholes model. Under SFAS 123R, the Company will be required to select a valuation technique, or option-pricing model that meets the criteria as stated in the standard. Allowable valuation models include a binomialmodel and the Black-Scholes model. The Company is required to adopt the provisions of SFAS 123R in the firstquarter of its fiscal 2006. The Company is in the process of assessing the impact on the Company’s results ofoperations from the adoption of FAS 123R for its effect on prospective option grants. The adoption of SFAS123R requires the Company to value stock options granted prior to its adoption of SFAS 123 under the fair valuemethod and expense these amounts in the income statement over the stock option’s remaining vesting period.This will result in the Company expensing $13,043 in fiscal 2006 that would previously have been presented in aproforma footnote disclosure. In addition, SFAS 123R will require the Company to reflect the tax savings result-ing from tax deductions in excess of expense reflected in its financial statements as a financing cash flow, whichwill impact the Company’s future reported cash flows from operating activities.
In November 2004, the FASB issued SFAS No. 151, “Inventory Costs—An Amendment of AccountingResearch Bulletin (ARB) No. 43, Chapter 4”. SFAS 151 clarifies that abnormal amounts of idle facility expense,freight, handling costs and spoilage should be expensed as incurred and not included in overhead. Further, SFAS151 requires that allocation of fixed and production facilities overheads to conversion costs should be based onnormal capacity of the production facilities. The provisions in this statement are effective for inventory costs in-curred during fiscal periods beginning after June 15, 2005. The Company does not believe that the adoption ofSFAS 151 will have a significant effect on its future consolidated financial statements.
In November 2004, the FASB issued SFAS No. 153, “Exchanges of Non-monetary Assets—An Amend-ment of APB No. 29”. The provisions of this statement are effective for asset exchanges occurring in fiscal peri-ods beginning after June 15, 2005. This statement eliminates the exception to fair value for exchanges of similarproductive assets and replaces it with a general exception for exchange transactions that do not have commercialsubstance—that is, transactions that are not expected to result in significant changes in the cash flows of the re-porting entity. The Company does not believe that the adoption of SFAS 153 will have a significant effect on itsfuture consolidated financial statements.
In March 2004, the FASB EITF reached a consensus on EITF Issue No. 03-1, “The Meaning of Other-Than-Temporary Impairment and Its Application to Certain Investments,” (EITF 03-1). The guidance prescribes a three-step model for determining whether an investment is other-than-temporarily impaired and requires disclosures about
49

NOTES TO CONSOLIDATED FINANCIAL STATEMENTS(dollars in thousands, except per share data) (Continued)
Note 1—Summary of Significant Accounting Policies (Continued)
unrealized losses on investments. The accounting guidance became effective for reporting periods beginning afterJune 15, 2004, while the disclosure requirements became effective for annual reporting periods ending afterJune 15, 2004. In September 2004, the FASB issued FASB Staff Position (FSP) EITF 03-1-1, “Effective Date ofParagraphs 10-20 of EITF Issue No. 03-1 ‘The Meaning of Other-Than-Temporary Impairment and Its Applicationto Certain Investments,” (FSP EITF 03-1-1). FSP EITF 03-1-1 delayed the effective date for the measurement andrecognition guidance contained in paragraphs 10-20 of EITF Issue 03-1. In November 2005, the FASB issued FSPFAS 115-1 and FAS 124-1, “The Meaning of Other-Than-Temporary Impairment and its Application to CertainInvestments.” This FSP addresses the determination as to when an investment is considered impaired, whether theimpairment is other than temporary and the measurement of an impairment loss. This statement specifically nullifiesthe requirements of paragraph 10-18 of EITF 03-1 and references existing other-than-temporary impairment guid-ance. The guidance under this FSP is effective for reporting periods beginning after December 15, 2005 and theCompany continued to apply relevant “other-than-temporary” guidance as provided for in FSP EITF 03-1-1 duringfiscal 2005. The Company does not believe that the adoption of the guidance of FSP FAS 115-1 and FAS 124-1 willhave a significant effect on its future consolidated financial statements.
In November 2003, the EITF reached consensus on Issue No. 03-10, “Application of Issue No. 02-16 byResellers to Sales Incentives Offered to Consumers by Manufacturers,” with respect to determining if consid-eration received by a reseller from a vendor that is reimbursed by the vendor for honoring the vendor’s sale in-centives offered directly to consumers should be recorded as a reduction in sales. These rules apply totransactions entered into by consumers in fiscal periods beginning after November 25, 2003 and, therefore, applyto such transactions starting with the Company’s fiscal third quarter of 2004, which began February 16, 2004.The adoption of EITF 03-10 did not affect the Company’s consolidated gross profit or net income, but did resultin a reduction of both net sales and merchandise costs by an equal amount. Had the Company’s first half of fiscal2004 and all of fiscal 2003 been reported under EITF 03-10 guidance, the sales and cost of sales would have beenreduced by approximately $186,900 and $282,300, respectively.
Use of Estimates
The preparation of financial statements in conformity with accounting principles generally accepted in theUnited States requires management to make estimates and assumptions that affect the reported amounts of assetsand liabilities and the disclosure of contingent assets and liabilities at the date of the financial statements and thereported amounts of revenues and expenses during the reporting period. Actual results could differ from thoseestimates.
Reclassifications
Certain reclassifications have been made to prior fiscal years to conform to the presentation adopted in thecurrent fiscal year.
Note 2—Comprehensive Income
Comprehensive income is net income, plus certain other items that are recorded directly to stockholders’equity. Comprehensive income was $1,204,987 for fiscal 2005, $976,517 for fiscal 2004 and $800,745 for fiscal2003. Foreign currency translation adjustments and unrealized gains and losses on short-term investments are theprimary components applied to net income to calculate the Company’s comprehensive income and totaled$146,273 and ($4,378), respectively, for fiscal 2005, $94,264 and ($140), respectively, for fiscal 2004, and$79,745 and $0, respectively, for fiscal 2003.
50

Note 3—Debt
Bank Credit Facilities and Commercial Paper Programs (all amounts stated in U.S. dollars)
The Company has a $500,000 commercial paper program supported by a $150,000 bank credit facility($300,000 at August 29, 2004) with a group of nine banks, which expires on November 15, 2005, and is not ex-pected to be renewed. At August 28, 2005 and August 29, 2004, no amounts were outstanding under thecommercial paper program and no amounts were outstanding under the credit facility. Applicable interest rateson the credit facility at August 28, 2005 and August 29, 2004, were 3.92% and 1.90%, respectively.
A wholly-owned Canadian subsidiary has a $167,000 commercial paper program ($152,000 at August 29,2004) supported by a $50,000 bank credit facility ($46,000 at August 29, 2004) with a Canadian bank, which isguaranteed by the Company and expires in March 2006. At August 28, 2005 and August 29, 2004, no amountswere outstanding under the Canadian commercial paper program or the bank credit facility. Applicable interestrates on the credit facility at August 28, 2005 and August 29, 2004, were 4.25% and 3.75%, respectively. AtAugust 28, 2005, standby letters of credit totaling $23,000 issued under the bank credit facility left $27,000available for commercial paper support. At August 29, 2004, standby letters of credit totaling $21,000 issuedunder the bank credit facility left $25,000 available for commercial paper support.
The Company has agreed to limit the combined amount outstanding under the U.S. and Canadian commer-cial paper programs to the combined amounts of the supporting bank credit facilities, which are $177,000 atAugust 28, 2005, decreasing to $27,000 on November 15, 2005. At August 29, 2004, the combined amount ofsupporting bank credit facilities was $325,000.
The Company’s wholly-owned Japanese subsidiary has a short-term $13,694 bank line of credit that expiresin February 2006. At August 28, 2005 and August 29, 2004, $5,477 and $0, respectively, were borrowed underthe line of credit, and $3,652 and $2,576, respectively, were used to support standby letters of credit. A second$13,694 bank line of credit was entered into in February 2005 that expires in February 2006. At August 28, 2005,$9,129 was borrowed under the second facility; this bank line was not in place at August 29, 2004. Applicableinterest rates on the credit facilities at both August 28, 2005 and August 29, 2004, were .84%.
The Company’s Korean subsidiary has a short-term $11,665 bank line of credit, which expires in January2006. At August 28, 2005 and August 29, 2004, no amounts were borrowed under the line of credit and $1,668and $0, respectively, were used to support standby letters of credit. Applicable interest rates on the credit facilityat August 28, 2005 and August 29, 2004, were 4.51% and 4.52%, respectively.
The Company’s Taiwan subsidiary has a $7,439 bank revolving credit facility that expires in January 2006. AtAugust 28, 2005 and August 29, 2004, no amounts were borrowed under the credit facility and $2,495 and $1,165,respectively, were used to support standby letters of credit. A second $15,499 bank revolving credit facility is inplace, which expires in July 2006. At August 28, 2005 and August 29, 2004, no amounts were borrowed under thesecond credit facility and $790 and $738, respectively were used to support standby letters of credit. Applicable in-terest rates on the credit facilities at August 28, 2005 and August 29, 2004, were 3.75% and 3.50%, respectively.
The Company’s wholly-owned United Kingdom subsidiary has a $108,408 bank revolving credit facilityexpiring in February 2007 and a $63,238 bank overdraft facility renewable on a yearly basis in March 2006. AtAugust 28, 2005, $39,750 was outstanding under the revolving credit facility with an applicable interest rate of5.30% and no amounts were outstanding under the bank overdraft facility. At August 29, 2004, $21,595 was out-standing under the revolving credit facility with an applicable interest rate of 5.285% and no amounts were out-standing under the bank overdraft facility.
Letters of Credit
The Company has letter of credit facilities (for commercial and standby letters of credit), totaling approx-imately $401,933. The outstanding commitments under these facilities at August 28, 2005 and August 29, 2004,
51

NOTES TO CONSOLIDATED FINANCIAL STATEMENTS(dollars in thousands, except per share data) (Continued)
Note 3—Debt (Continued)
totaled approximately $131,169 and $166,800, respectively, including approximately $64,532 and $52,900, re-spectively, in standby letters of credit.
Short-Term Borrowings
The weighted average borrowings, maximum borrowings and weighted average interest rate under allshort-term borrowing arrangements were as follows for fiscal 2005 and 2004:
Category of AggregateShort-term Borrowings
Maximum AmountOutstanding
During the Fiscal Year
Average AmountOutstanding
During the Fiscal Year
Weighted AverageInterest Rate
During the Fiscal Year
Fiscal year ended August 28, 2005Bank borrowings:
Canadian . . . . . . . . . . . . . . . . . . . . . . . . . . $12,841 $ 338 4.24%United Kingdom . . . . . . . . . . . . . . . . . . . . 41,576 20,394 5.22Japan . . . . . . . . . . . . . . . . . . . . . . . . . . . . . 14,606 8,702 0.84
Fiscal year ended August 29, 2004Bank borrowings:
Canadian . . . . . . . . . . . . . . . . . . . . . . . . . . $53,826 $ 3,005 2.73%United Kingdom . . . . . . . . . . . . . . . . . . . . 48,232 21,994 4.40
Long-term Debt
Long-term debt at August 28, 2005 and August 29, 2004 consisted of the following:
2005 2004
71⁄8% Senior Notes due June 2005 . . . . . . . . . . . . . . . . . . . . . . . . . . . . . . . . . . $ — $ 304,35051⁄2% Senior Notes due March 2007 . . . . . . . . . . . . . . . . . . . . . . . . . . . . . . . . . 307,688 321,4042.070% Promissory notes due October 2007 . . . . . . . . . . . . . . . . . . . . . . . . . . . 31,952 32,0041.187% Promissory notes due July 2008 . . . . . . . . . . . . . . . . . . . . . . . . . . . . . . 27,387 27,4320.88% Promissory notes due November 2009 . . . . . . . . . . . . . . . . . . . . . . . . . . 27,387 27,4320.92% Promissory notes due April 2010 . . . . . . . . . . . . . . . . . . . . . . . . . . . . . . 36,516 36,57631⁄2% Zero Coupon convertible subordinated notes due August 2017 . . . . . . . 274,071 543,025Capital lease obligations and other . . . . . . . . . . . . . . . . . . . . . . . . . . . . . . . . . . 8,899 7,117
713,900 1,299,340Less current portion . . . . . . . . . . . . . . . . . . . . . . . . . . . . . . . . . . . . . . . . . . . . . . 3,225 305,594
Total long-term debt . . . . . . . . . . . . . . . . . . . . . . . . . . . . . . . . . . . . . . . . . . . . . . $710,675 $ 993,746
In June 1995, the Company issued $300,000 of 71⁄8% Senior Notes due June 15, 2005. Interest on the noteswas payable semiannually on June 15 and December 15. The indentures contained certain limitations on theCompany’s and certain subsidiaries’ ability to create liens securing indebtedness and to enter into certain sale-leaseback transactions. In November 2001, the Company entered into “fixed-to-floating” interest rate swapagreements that replaced the fixed interest rate with a floating rate indexed to LIBOR. The Company’s 71⁄8%Senior Notes matured and were repaid on June 15, 2005 from its cash and cash equivalents balance. The interestrate swap agreement on the 71⁄8% Senior Notes also expired upon repayment of the underlying notes.
In March 2002, the Company issued $300,000 of 51⁄2% Senior Notes due March 15, 2007. Interest is pay-able semi-annually on March 15 and September 15. Simultaneous with the issuance of the 51⁄2% Senior Notes,
52

Note 3—Debt (Continued)
the Company entered into interest rate swap agreements converting the interest to a floating rate indexed to LI-BOR. As of August 28, 2005, the Company was in compliance with all restrictive covenants.
In October 2000, the Company’s wholly-owned Japanese subsidiary issued 2.070% promissory notes in theaggregate amount of $31,952, through a private placement. Interest is payable annually and principal is due onOctober 23, 2007.
In July 2001, the Company’s wholly-owned Japanese subsidiary issued 1.187% promissory notes in the ag-gregate amount of $27,387, through a private placement. Interest is payable semi-annually and principal is due onJuly 9, 2008.
In November 2002, the Company’s wholly-owned Japanese subsidiary issued promissory notes bearinginterest at 0.88% in the aggregate amount of $27,387, through a private placement. Interest is payable semi-annually and principal is due on November 7, 2009.
In April 2003, the Company’s wholly-owned Japanese subsidiary issued promissory notes bearing interest at0.92% in the aggregate amount of $36,516, through a private placement. Interest is payable semi-annually andprincipal is due on April 26, 2010.
The Company guarantees all of the promissory notes issued by its wholly-owned Japanese subsidiary.
On August 19, 1997, the Company completed the sale of $900,000 principal amount at maturity Zero Cou-pon Subordinated Notes (the “Notes”) due August 19, 2017. The Notes were priced with a yield to maturity of31⁄2%, resulting in gross proceeds to the Company of $449,640. The current Notes outstanding are convertibleinto a maximum of 9,430,147 shares of Costco Common Stock shares at an initial conversion price of $22.00.Holders of the Notes may require the Company to purchase the Notes (at the discounted issue price plus accruedinterest to date of purchase) on August 19, 2007, or 2012. The Company, at its option, may redeem the Notes (atthe discounted issue price plus accrued interest to date of redemption) any time on or after August 19, 2002. Asof August 28, 2005, $329,163 in principal amount of the Zero Coupon Notes had been converted by note holdersto shares of Costco Common Stock, of which $280,811 in principal was converted in fiscal 2005.
In February 1996, the Company filed with the Securities and Exchange Commission a shelf registrationstatement for $500,000 of senior debt securities. On October 23, 2001, an additional $100,000 in debt securitieswas registered, bringing the total amount of debt registered under the shelf registration to $600,000. The$300,000 of 51/2% Senior Notes issued in March 2002 reduced the amount of registered securities available forfuture issuance to $300,000.
At August 28, 2005, the fair value of the 51⁄2% Senior Notes, based on market quotes, was approximately$303,150. The Senior Notes are not redeemable prior to maturity. The fair value of the 31⁄2% Zero Coupon Sub-ordinated Notes at August 28, 2005, based on market quotes, was approximately $405,072. The fair value ofother long-term debt approximates carrying value.
Maturities of long-term debt during the next five fiscal years and thereafter are as follows:
2006 . . . . . . . . . . . . . . . . . . . . . . . . . . . . . . . . . . . . . . . . . . . . . . . . . . . . . . . . . . . . . $ 3,2252007 . . . . . . . . . . . . . . . . . . . . . . . . . . . . . . . . . . . . . . . . . . . . . . . . . . . . . . . . . . . . . 309,0682008 . . . . . . . . . . . . . . . . . . . . . . . . . . . . . . . . . . . . . . . . . . . . . . . . . . . . . . . . . . . . . 60,2642009 . . . . . . . . . . . . . . . . . . . . . . . . . . . . . . . . . . . . . . . . . . . . . . . . . . . . . . . . . . . . . 9502010 . . . . . . . . . . . . . . . . . . . . . . . . . . . . . . . . . . . . . . . . . . . . . . . . . . . . . . . . . . . . . 64,381Thereafter . . . . . . . . . . . . . . . . . . . . . . . . . . . . . . . . . . . . . . . . . . . . . . . . . . . . . . . . . 276,012
Total . . . . . . . . . . . . . . . . . . . . . . . . . . . . . . . . . . . . . . . . . . . . . . . . . . . . . . . . . $713,900
53

NOTES TO CONSOLIDATED FINANCIAL STATEMENTS(dollars in thousands, except per share data) (Continued)
Note 4—Leases
The Company leases land and/or warehouse buildings at 102 of the 433 warehouses open at August 28,2005, and certain other office and distribution facilities under operating leases with remaining terms rangingfrom 1 to 42 years. These leases generally contain one or more of the following options which the Company canexercise at the end of the initial lease term: (a) renewal of the lease for a defined number of years at the then fairmarket rental rate; (b) purchase of the property at the then fair market value; or (c) right of first refusal in theevent of a third party purchase offer. Certain leases provide for periodic rental increases based on the price in-dices and some of the leases provide for rents based on the greater of minimum guaranteed amounts or sales vol-ume. Contingent rents have not been material. The Company accounts for its leases with step-rent provisions on astraight-line basis over the original term of the lease.
Additionally, the Company leases certain equipment and fixtures under short-term operating leases thatpermit the Company to either renew for a series of one-year terms or to purchase the equipment at the then fairmarket value.
Aggregate rental expense for fiscal 2005, 2004 and 2003 was $131,690, $113,681 and $103,134, re-spectively. The amount for 2005 excludes $15,999 in rent expense associated with the correction made in thesecond quarter of fiscal 2005 to the Company’s method of accounting for ground leases that did not require rentalpayments during the period of construction. Future minimum payments, net of sub-lease income of $168,742 forall years combined, during the next five fiscal years and thereafter under non-cancelable leases with terms of atleast one year, at August 28, 2005, were as follows:
2006 . . . . . . . . . . . . . . . . . . . . . . . . . . . . . . . . . . . . . . . . . . . . . . . . . . . . . . . . . . . . . . . . . . . . $ 114,6822007 . . . . . . . . . . . . . . . . . . . . . . . . . . . . . . . . . . . . . . . . . . . . . . . . . . . . . . . . . . . . . . . . . . . . 111,6382008 . . . . . . . . . . . . . . . . . . . . . . . . . . . . . . . . . . . . . . . . . . . . . . . . . . . . . . . . . . . . . . . . . . . . 107,7642009 . . . . . . . . . . . . . . . . . . . . . . . . . . . . . . . . . . . . . . . . . . . . . . . . . . . . . . . . . . . . . . . . . . . . 100,3322010 . . . . . . . . . . . . . . . . . . . . . . . . . . . . . . . . . . . . . . . . . . . . . . . . . . . . . . . . . . . . . . . . . . . . 88,856Thereafter . . . . . . . . . . . . . . . . . . . . . . . . . . . . . . . . . . . . . . . . . . . . . . . . . . . . . . . . . . . . . . . 1,038,995
Total minimum payments . . . . . . . . . . . . . . . . . . . . . . . . . . . . . . . . . . . . . . . . . . . . . . . $1,562,267
Note 5—Stock Options
The Company’s 1993 Combined Stock Grant and Stock Option Plan (the “1993 plan”) provided for the issu-ance of up to 60 million shares of its common stock upon the exercise of stock options and up to 3,333,332shares through stock grants. During fiscal 2002 the 2002 Stock Incentive Plan (the “2002 plan”) was adopted fol-lowing shareholder approval. The 2002 plan authorized 30 million shares of common stock for issuance, subjectto adjustment. For future grants, the 2002 plan replaces the 1993 plan and the 1993 plan has been amended toprovide that no more options or stock grants may be issued under such plan. Any shares under the 1993 plan thatremain available for future option grants (and any additional shares that subsequently become available throughcancellation of unexercised options outstanding) will be added to the number of shares available for grant underthe 2002 plan. The 2002 plan authorizes the Company to grant stock options to eligible employees, directors andconsultants. During fiscal 2005 the 2002 plan was amended and is now referred to as the Amended and Restated2002 Stock Incentive Plan following shareholder approval. The Amended and Restated 2002 plan authorized theissuance of an additional 10 million shares for option grants and authorized the award of stock bonuses or stockunits in addition to stock option grants currently authorized. The number of shares issued as stock bonuses orstock units is limited to one-third of those available for option grants. Options granted under these plans have aten-year term and generally have a vesting period of five years. At August 28, 2005, options for approximately26.0 million shares were vested and 11.5 million shares were available for future grants under the plan.
54
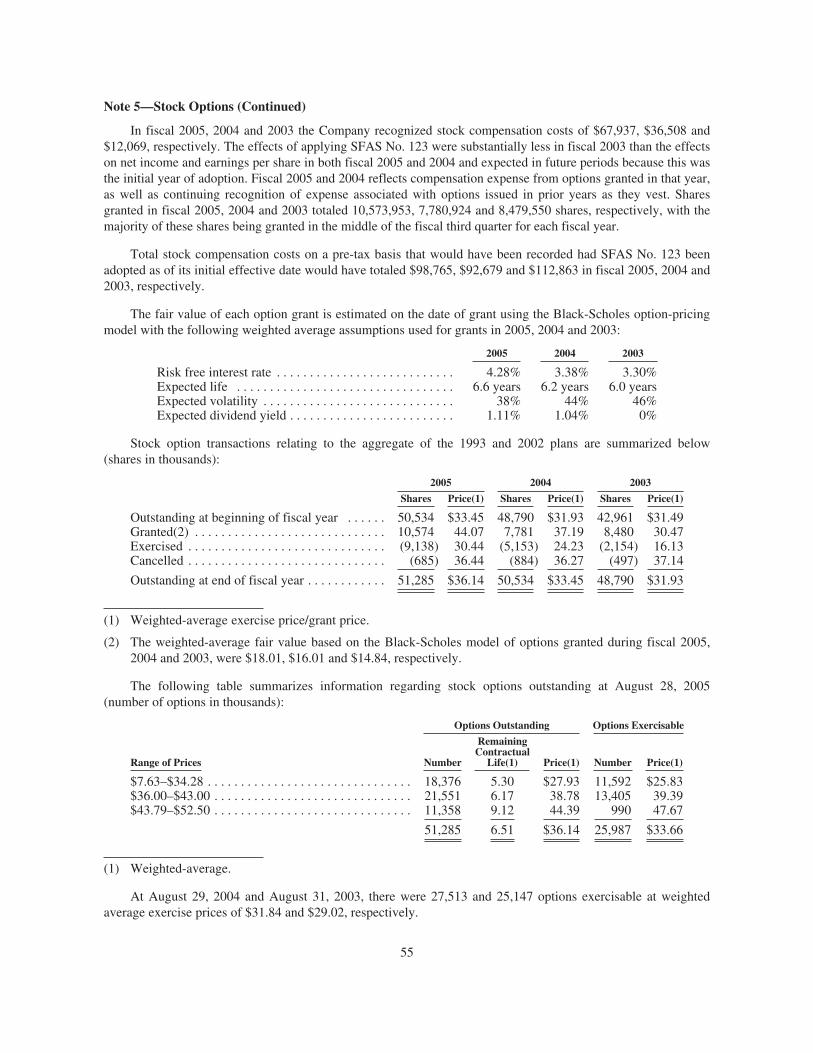
Note 5—Stock Options (Continued)
In fiscal 2005, 2004 and 2003 the Company recognized stock compensation costs of $67,937, $36,508 and$12,069, respectively. The effects of applying SFAS No. 123 were substantially less in fiscal 2003 than the effectson net income and earnings per share in both fiscal 2005 and 2004 and expected in future periods because this wasthe initial year of adoption. Fiscal 2005 and 2004 reflects compensation expense from options granted in that year,as well as continuing recognition of expense associated with options issued in prior years as they vest. Sharesgranted in fiscal 2005, 2004 and 2003 totaled 10,573,953, 7,780,924 and 8,479,550 shares, respectively, with themajority of these shares being granted in the middle of the fiscal third quarter for each fiscal year.
Total stock compensation costs on a pre-tax basis that would have been recorded had SFAS No. 123 beenadopted as of its initial effective date would have totaled $98,765, $92,679 and $112,863 in fiscal 2005, 2004 and2003, respectively.
The fair value of each option grant is estimated on the date of grant using the Black-Scholes option-pricingmodel with the following weighted average assumptions used for grants in 2005, 2004 and 2003:
2005 2004 2003
Risk free interest rate . . . . . . . . . . . . . . . . . . . . . . . . . . . 4.28% 3.38% 3.30%Expected life . . . . . . . . . . . . . . . . . . . . . . . . . . . . . . . . . 6.6 years 6.2 years 6.0 yearsExpected volatility . . . . . . . . . . . . . . . . . . . . . . . . . . . . . 38% 44% 46%Expected dividend yield . . . . . . . . . . . . . . . . . . . . . . . . . 1.11% 1.04% 0%
Stock option transactions relating to the aggregate of the 1993 and 2002 plans are summarized below(shares in thousands):
2005 2004 2003
Shares Price(1) Shares Price(1) Shares Price(1)
Outstanding at beginning of fiscal year . . . . . . 50,534 $33.45 48,790 $31.93 42,961 $31.49Granted(2) . . . . . . . . . . . . . . . . . . . . . . . . . . . . . 10,574 44.07 7,781 37.19 8,480 30.47Exercised . . . . . . . . . . . . . . . . . . . . . . . . . . . . . . (9,138) 30.44 (5,153) 24.23 (2,154) 16.13Cancelled . . . . . . . . . . . . . . . . . . . . . . . . . . . . . . (685) 36.44 (884) 36.27 (497) 37.14
Outstanding at end of fiscal year . . . . . . . . . . . . 51,285 $36.14 50,534 $33.45 48,790 $31.93
(1) Weighted-average exercise price/grant price.
(2) The weighted-average fair value based on the Black-Scholes model of options granted during fiscal 2005,2004 and 2003, were $18.01, $16.01 and $14.84, respectively.
The following table summarizes information regarding stock options outstanding at August 28, 2005(number of options in thousands):
Options Outstanding Options Exercisable
Range of Prices Number
RemainingContractual
Life(1) Price(1) Number Price(1)
$7.63–$34.28 . . . . . . . . . . . . . . . . . . . . . . . . . . . . . . . 18,376 5.30 $27.93 11,592 $25.83$36.00–$43.00 . . . . . . . . . . . . . . . . . . . . . . . . . . . . . . 21,551 6.17 38.78 13,405 39.39$43.79–$52.50 . . . . . . . . . . . . . . . . . . . . . . . . . . . . . . 11,358 9.12 44.39 990 47.67
51,285 6.51 $36.14 25,987 $33.66
(1) Weighted-average.
At August 29, 2004 and August 31, 2003, there were 27,513 and 25,147 options exercisable at weightedaverage exercise prices of $31.84 and $29.02, respectively.
55

NOTES TO CONSOLIDATED FINANCIAL STATEMENTS(dollars in thousands, except per share data) (Continued)
Note 6—Retirement Plans
The Company has a 401(k) Retirement Plan that is available to all U.S. employees who have completed 90days of employment. For all U.S. employees, with the exception of California union employees, the plan allowspre-tax deferral against which the Company matches 50% of the first one thousand dollars of employee con-tributions. In addition, the Company will provide each eligible participant a contribution based on salary andyears of service.
California union employees participate in a defined benefit plan sponsored by their union. The Companymakes contributions based upon its union agreement. For all the California union employees, the Company spon-sored 401(k) plan currently allows pre-tax deferral against which the Company matches 50% of the first fivehundred dollars of employee contributions. In addition, the Company will provide each eligible participant a con-tribution based on hours worked and years of service. The Company has a defined contribution plan for Canadianand United Kingdom employees and contributes a percentage of each employee’s salary. The Company complieswith government requirements related to retirement benefits for other international operations and accrues ex-penses based on a percentage of each employee’s salary as appropriate.
Amounts expensed under these plans were $191,651, $169,664 and $149,392 for fiscal 2005, 2004 and2003, respectively. The Company has defined contribution 401(k) and retirement plans only, and thus has no li-ability for post-retirement benefit obligations under SFAS No. 106 “Employer’s Accounting for Post-retirementBenefits Other than Pensions.”
Note 7—Income Taxes
Income before income taxes are comprised of the following:
2005 2004 2003
Domestic (including Puerto Rico) . . . . . . . . . . . . . . . . . . . . . . . $1,225,741 $1,194,548 $1,024,045Foreign . . . . . . . . . . . . . . . . . . . . . . . . . . . . . . . . . . . . . . . . . . . 323,221 206,076 134,188
Total . . . . . . . . . . . . . . . . . . . . . . . . . . . . . . . . . . . . . . . . . $1,548,962 $1,400,624 $1,158,233
The provisions for income taxes for fiscal 2005, 2004 and 2003 are as follows:
2005 2004 2003
Federal:Current . . . . . . . . . . . . . . . . . . . . . . . . . . . . . . . . . . . . . . . . . . $306,527 $ 238,136 $284,828Deferred . . . . . . . . . . . . . . . . . . . . . . . . . . . . . . . . . . . . . . . . . (48,070) 116,390 35,150
Total federal . . . . . . . . . . . . . . . . . . . . . . . . . . . . . . . . . . . 258,457 354,526 319,978
State:Current . . . . . . . . . . . . . . . . . . . . . . . . . . . . . . . . . . . . . . . . . . 75,063 49,852 56,886Deferred . . . . . . . . . . . . . . . . . . . . . . . . . . . . . . . . . . . . . . . . . (14,699) 20,479 (470)
Total state . . . . . . . . . . . . . . . . . . . . . . . . . . . . . . . . . . . . . 60,364 70,331 56,416
Foreign:Current . . . . . . . . . . . . . . . . . . . . . . . . . . . . . . . . . . . . . . . . . . 123,969 171,006 9,634Deferred . . . . . . . . . . . . . . . . . . . . . . . . . . . . . . . . . . . . . . . . . (1,866) (100,344) 38,857
Total foreign . . . . . . . . . . . . . . . . . . . . . . . . . . . . . . . . . . . 122,103 70,662 48,491
Tax benefits allocated to contributed capital . . . . . . . . . . . . . . 44,946 22,712 12,348
Total provision for income taxes . . . . . . . . . . . . . . . . . . . . . . . . $485,870 $ 518,231 $437,233
56

Note 7—Income Taxes (Continued)
Reconciliation between the statutory tax rate and the effective rate for fiscal 2005, 2004 and 2003 is as fol-lows:
2005 2004 2003
Federal taxes at statutory rate . . . . . . . . . . . . . . . . . $542,137 35.00% $490,218 35.00% $405,382 35.00%State taxes, net . . . . . . . . . . . . . . . . . . . . . . . . . . . . . 39,193 2.53 48,157 3.44 37,875 3.27Foreign taxes, net . . . . . . . . . . . . . . . . . . . . . . . . . . (15,506) (1.00) (5,729) (0.41) (396) (0.03)Transfer pricing settlement . . . . . . . . . . . . . . . . . . . (54,155) (3.50) — 0.00 — 0.00Tax benefit on unremitted earnings . . . . . . . . . . . . . (30,602) (1.98) — 0.00 — 0.00Translation gain on unremitted earnings . . . . . . . . . 10,010 0.65 — 0.00 — 0.00Other . . . . . . . . . . . . . . . . . . . . . . . . . . . . . . . . . . . . (5,207) (0.33) (14,415) (1.03) (5,628) (0.49)
$485,870 31.37% $518,231 37.00% $437,233 37.75%
The components of the deferred tax assets and liabilities are as follows:
August 28,2005
August 29,2004
Stock Options . . . . . . . . . . . . . . . . . . . . . . . . . . . . . . . . . . . . . . . . . . . . . . . . . . . . $ 30,480 $ 14,483Deferred income/membership fees . . . . . . . . . . . . . . . . . . . . . . . . . . . . . . . . . . . . 36,594 29,432Excess foreign tax credits . . . . . . . . . . . . . . . . . . . . . . . . . . . . . . . . . . . . . . . . . . . 30,602 —Accrued liabilities and reserves . . . . . . . . . . . . . . . . . . . . . . . . . . . . . . . . . . . . . . 266,337 208,409Other . . . . . . . . . . . . . . . . . . . . . . . . . . . . . . . . . . . . . . . . . . . . . . . . . . . . . . . . . . . 3,880 16,296
Total deferred tax assets . . . . . . . . . . . . . . . . . . . . . . . . . . . . . . . . . . . . . . . . 367,893 268,620
Property and equipment . . . . . . . . . . . . . . . . . . . . . . . . . . . . . . . . . . . . . . . . . . . . 273,794 271,798Merchandise inventories . . . . . . . . . . . . . . . . . . . . . . . . . . . . . . . . . . . . . . . . . . . . 91,407 73,913Translation gain . . . . . . . . . . . . . . . . . . . . . . . . . . . . . . . . . . . . . . . . . . . . . . . . . . . 16,047 —
Total deferred tax liabilities . . . . . . . . . . . . . . . . . . . . . . . . . . . . . . . . . . . . . 381,248 345,711
Net deferred tax liabilities . . . . . . . . . . . . . . . . . . . . . . . . . . . . . . . . . . . . . . . . . . . $ (13,355) $ (77,091)
The deferred tax accounts at August 28, 2005 and August 29, 2004 include current deferred income tax as-sets of $159,197 and $116,291, respectively, included in other current assets; non-current deferred income taxassets of $7,962 and $6,755, respectively, included in other assets; and non-current deferred income tax liabilitiesof $180,514 and $200,137, respectively, included in deferred income taxes and other liabilities.
The effective income tax rate on earnings was 31.4% in fiscal 2005, 37% in fiscal 2004, and 37.8% in fiscal2003. The decrease in the effective income tax rate in fiscal 2005 from fiscal 2004 is primarily attributable to a$54,155 income tax benefit resulting from the settlement of a transfer pricing dispute between the United Statesand Canada (covering the years 1996-2003) and a net tax benefit on unremitted foreign earnings of $20,592. TheCompany recognized a tax benefit of $30,602, resulting from excess foreign tax credits on unremitted foreignearnings and recognized a tax expense of $10,010, resulting from tax expense on translation gains accumulated tothe date that the Company determined that certain unremitted foreign earnings were no longer permanently re-invested. The net benefit of $20,592 relates to that portion of unremitted foreign earnings that the Company plansto repatriate in the foreseeable future. Excluding these benefits the effective income tax rate on earnings in fiscal2005 was 36.2%.
For the fourth quarter of fiscal 2005 and 2004, the effective tax rate was 28.9% and 37.0%, respectively.The decrease in the fourth quarter tax rate for fiscal 2005 is primarily attributable to a net tax benefit of $20,592,
57
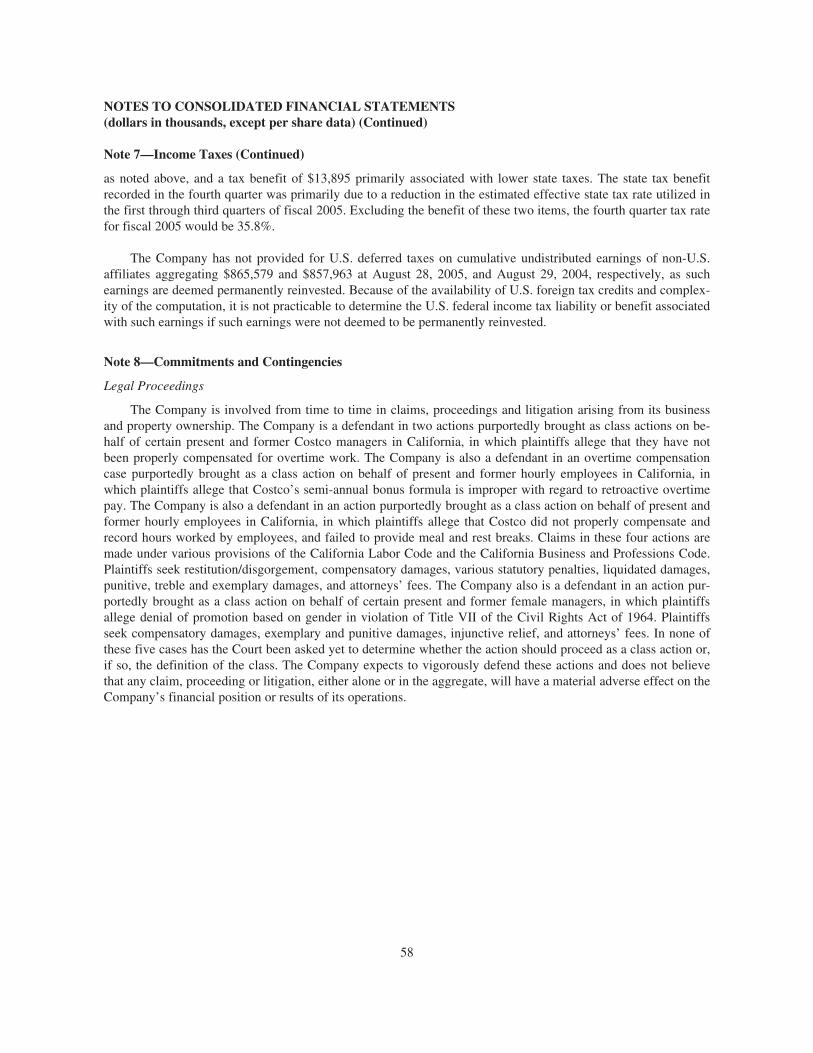
NOTES TO CONSOLIDATED FINANCIAL STATEMENTS(dollars in thousands, except per share data) (Continued)
Note 7—Income Taxes (Continued)
as noted above, and a tax benefit of $13,895 primarily associated with lower state taxes. The state tax benefitrecorded in the fourth quarter was primarily due to a reduction in the estimated effective state tax rate utilized inthe first through third quarters of fiscal 2005. Excluding the benefit of these two items, the fourth quarter tax ratefor fiscal 2005 would be 35.8%.
The Company has not provided for U.S. deferred taxes on cumulative undistributed earnings of non-U.S.affiliates aggregating $865,579 and $857,963 at August 28, 2005, and August 29, 2004, respectively, as suchearnings are deemed permanently reinvested. Because of the availability of U.S. foreign tax credits and complex-ity of the computation, it is not practicable to determine the U.S. federal income tax liability or benefit associatedwith such earnings if such earnings were not deemed to be permanently reinvested.
Note 8—Commitments and Contingencies
Legal Proceedings
The Company is involved from time to time in claims, proceedings and litigation arising from its businessand property ownership. The Company is a defendant in two actions purportedly brought as class actions on be-half of certain present and former Costco managers in California, in which plaintiffs allege that they have notbeen properly compensated for overtime work. The Company is also a defendant in an overtime compensationcase purportedly brought as a class action on behalf of present and former hourly employees in California, inwhich plaintiffs allege that Costco’s semi-annual bonus formula is improper with regard to retroactive overtimepay. The Company is also a defendant in an action purportedly brought as a class action on behalf of present andformer hourly employees in California, in which plaintiffs allege that Costco did not properly compensate andrecord hours worked by employees, and failed to provide meal and rest breaks. Claims in these four actions aremade under various provisions of the California Labor Code and the California Business and Professions Code.Plaintiffs seek restitution/disgorgement, compensatory damages, various statutory penalties, liquidated damages,punitive, treble and exemplary damages, and attorneys’ fees. The Company also is a defendant in an action pur-portedly brought as a class action on behalf of certain present and former female managers, in which plaintiffsallege denial of promotion based on gender in violation of Title VII of the Civil Rights Act of 1964. Plaintiffsseek compensatory damages, exemplary and punitive damages, injunctive relief, and attorneys’ fees. In none ofthese five cases has the Court been asked yet to determine whether the action should proceed as a class action or,if so, the definition of the class. The Company expects to vigorously defend these actions and does not believethat any claim, proceeding or litigation, either alone or in the aggregate, will have a material adverse effect on theCompany’s financial position or results of its operations.
58

Note 9—Segment Reporting
The Company and its subsidiaries are principally engaged in the operation of membership warehouses in theUnited States, Canada, Japan and the United Kingdom and through majority owned subsidiaries in Taiwan andKorea and through a 50%-owned joint venture in Mexico. The Company’s reportable segments are based onmanagement responsibility. The investment in the Mexico joint venture is only included in total assets underUnited States Operations in the table below, as it is accounted for under the equity method and its operations arenot consolidated in the Company’s financial statements.
United StatesOperations
CanadianOperations
OtherInternationalOperations Total
Year Ended August 28, 2005Total revenue . . . . . . . . . . . . . . . . . . . . . . . . . . . . . . . . $43,051,603 $6,728,156 $3,155,469 $52,935,228Operating income . . . . . . . . . . . . . . . . . . . . . . . . . . . . 1,167,736 241,503 65,064 1,474,303Depreciation and amortization . . . . . . . . . . . . . . . . . . 387,148 48,992 41,728 477,868Capital expenditures . . . . . . . . . . . . . . . . . . . . . . . . . . 733,718 139,735 121,978 995,431Long lived assets . . . . . . . . . . . . . . . . . . . . . . . . . . . . . 6,170,553 833,637 786,002 7,790,192Total assets . . . . . . . . . . . . . . . . . . . . . . . . . . . . . . . . . 13,051,374 2,034,420 1,427,848 16,513,642Net assets . . . . . . . . . . . . . . . . . . . . . . . . . . . . . . . . . . . 6,796,523 1,192,121 892,465 8,881,109
Year Ended August 29, 2004Total revenue . . . . . . . . . . . . . . . . . . . . . . . . . . . . . . . . $39,427,622 $6,042,804 $2,636,566 $48,106,992Operating income . . . . . . . . . . . . . . . . . . . . . . . . . . . . 1,121,122 214,518 50,008 1,385,648Depreciation and amortization . . . . . . . . . . . . . . . . . . 364,432 40,220 36,069 440,721Capital expenditures . . . . . . . . . . . . . . . . . . . . . . . . . . 560,387 89,748 55,485 705,620Long lived assets . . . . . . . . . . . . . . . . . . . . . . . . . . . . . 5,853,103 675,871 690,855 7,219,829Total assets . . . . . . . . . . . . . . . . . . . . . . . . . . . . . . . . . 12,107,613 1,717,962 1,266,973 15,092,548Net assets . . . . . . . . . . . . . . . . . . . . . . . . . . . . . . . . . . . 5,888,495 928,937 807,378 7,624,810
Year Ended August 31, 2003Total revenue . . . . . . . . . . . . . . . . . . . . . . . . . . . . . . . . $35,119,039 $5,237,023 $2,189,490 $42,545,552Operating income . . . . . . . . . . . . . . . . . . . . . . . . . . . . 927,590 199,043 29,995 1,156,628Depreciation and amortization . . . . . . . . . . . . . . . . . . 323,850 33,732 33,720 391,302Capital expenditures . . . . . . . . . . . . . . . . . . . . . . . . . . 698,713 68,432 43,520 810,665Long lived assets . . . . . . . . . . . . . . . . . . . . . . . . . . . . . 5,705,675 612,647 641,686 6,960,008Total assets . . . . . . . . . . . . . . . . . . . . . . . . . . . . . . . . . 10,522,260 1,579,972 1,089,456 13,191,688Net assets . . . . . . . . . . . . . . . . . . . . . . . . . . . . . . . . . . . 5,141,056 783,521 630,403 6,554,980
The accounting policies of the segments are the same as those described in Note 1. All inter-segment totalrevenue and expenses are immaterial and have been eliminated in computing total revenue and operating income.
59
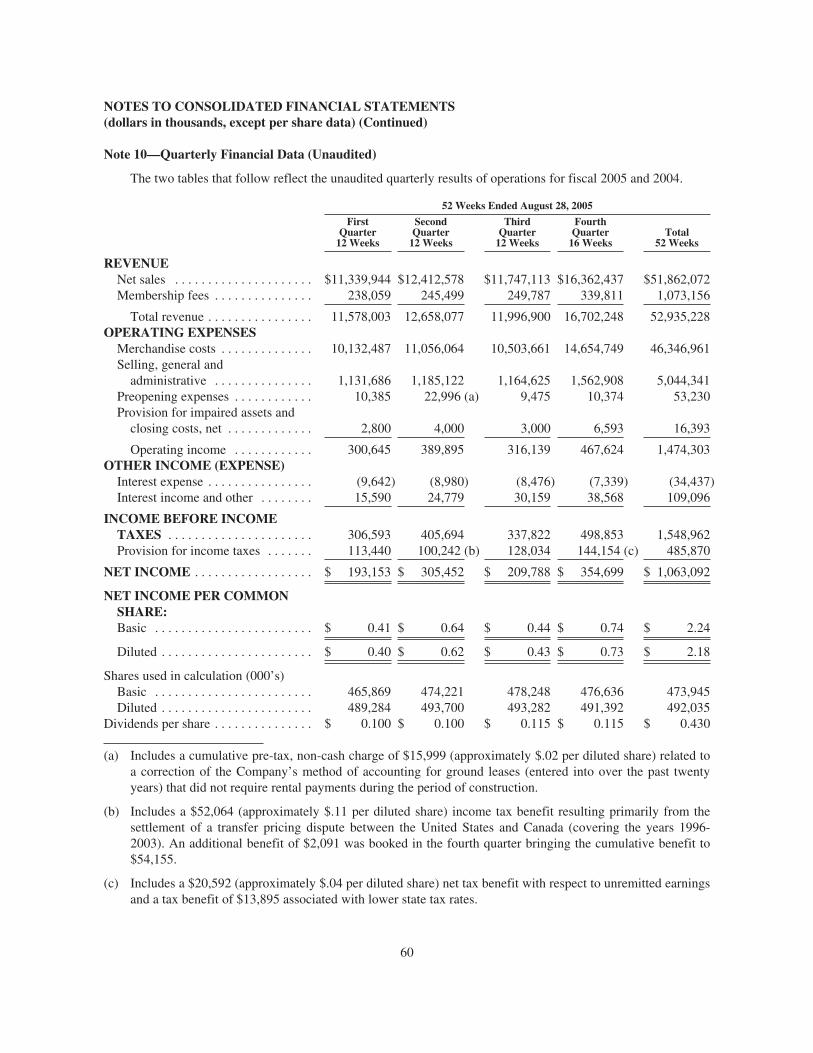
NOTES TO CONSOLIDATED FINANCIAL STATEMENTS(dollars in thousands, except per share data) (Continued)
Note 10—Quarterly Financial Data (Unaudited)
The two tables that follow reflect the unaudited quarterly results of operations for fiscal 2005 and 2004.
52 Weeks Ended August 28, 2005
FirstQuarter
12 Weeks
SecondQuarter
12 Weeks
ThirdQuarter
12 Weeks
FourthQuarter
16 WeeksTotal
52 Weeks
REVENUENet sales . . . . . . . . . . . . . . . . . . . . . $11,339,944 $12,412,578 $11,747,113 $16,362,437 $51,862,072Membership fees . . . . . . . . . . . . . . . 238,059 245,499 249,787 339,811 1,073,156
Total revenue . . . . . . . . . . . . . . . . 11,578,003 12,658,077 11,996,900 16,702,248 52,935,228OPERATING EXPENSES
Merchandise costs . . . . . . . . . . . . . . 10,132,487 11,056,064 10,503,661 14,654,749 46,346,961Selling, general and
administrative . . . . . . . . . . . . . . . 1,131,686 1,185,122 1,164,625 1,562,908 5,044,341Preopening expenses . . . . . . . . . . . . 10,385 22,996 (a) 9,475 10,374 53,230Provision for impaired assets and
closing costs, net . . . . . . . . . . . . . 2,800 4,000 3,000 6,593 16,393
Operating income . . . . . . . . . . . . 300,645 389,895 316,139 467,624 1,474,303OTHER INCOME (EXPENSE)
Interest expense . . . . . . . . . . . . . . . . (9,642) (8,980) (8,476) (7,339) (34,437)Interest income and other . . . . . . . . 15,590 24,779 30,159 38,568 109,096
INCOME BEFORE INCOMETAXES . . . . . . . . . . . . . . . . . . . . . . 306,593 405,694 337,822 498,853 1,548,962Provision for income taxes . . . . . . . 113,440 100,242 (b) 128,034 144,154 (c) 485,870
NET INCOME . . . . . . . . . . . . . . . . . . $ 193,153 $ 305,452 $ 209,788 $ 354,699 $ 1,063,092
NET INCOME PER COMMONSHARE:Basic . . . . . . . . . . . . . . . . . . . . . . . . $ 0.41 $ 0.64 $ 0.44 $ 0.74 $ 2.24
Diluted . . . . . . . . . . . . . . . . . . . . . . . $ 0.40 $ 0.62 $ 0.43 $ 0.73 $ 2.18
Shares used in calculation (000’s)Basic . . . . . . . . . . . . . . . . . . . . . . . . 465,869 474,221 478,248 476,636 473,945Diluted . . . . . . . . . . . . . . . . . . . . . . . 489,284 493,700 493,282 491,392 492,035
Dividends per share . . . . . . . . . . . . . . . $ 0.100 $ 0.100 $ 0.115 $ 0.115 $ 0.430
(a) Includes a cumulative pre-tax, non-cash charge of $15,999 (approximately $.02 per diluted share) related toa correction of the Company’s method of accounting for ground leases (entered into over the past twentyyears) that did not require rental payments during the period of construction.
(b) Includes a $52,064 (approximately $.11 per diluted share) income tax benefit resulting primarily from thesettlement of a transfer pricing dispute between the United States and Canada (covering the years 1996-2003). An additional benefit of $2,091 was booked in the fourth quarter bringing the cumulative benefit to$54,155.
(c) Includes a $20,592 (approximately $.04 per diluted share) net tax benefit with respect to unremitted earningsand a tax benefit of $13,895 associated with lower state tax rates.
60
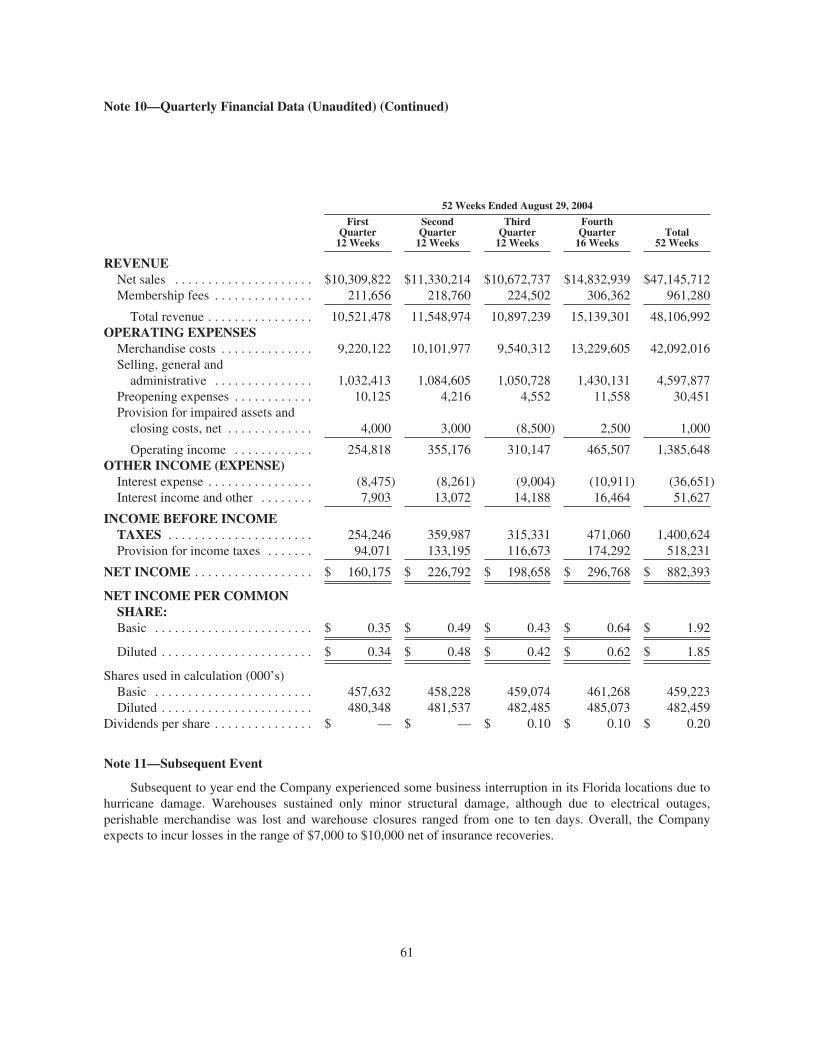
Note 10—Quarterly Financial Data (Unaudited) (Continued)
52 Weeks Ended August 29, 2004
FirstQuarter
12 Weeks
SecondQuarter
12 Weeks
ThirdQuarter
12 Weeks
FourthQuarter
16 WeeksTotal
52 Weeks
REVENUENet sales . . . . . . . . . . . . . . . . . . . . . $10,309,822 $11,330,214 $10,672,737 $14,832,939 $47,145,712Membership fees . . . . . . . . . . . . . . . 211,656 218,760 224,502 306,362 961,280
Total revenue . . . . . . . . . . . . . . . . 10,521,478 11,548,974 10,897,239 15,139,301 48,106,992OPERATING EXPENSES
Merchandise costs . . . . . . . . . . . . . . 9,220,122 10,101,977 9,540,312 13,229,605 42,092,016Selling, general and
administrative . . . . . . . . . . . . . . . 1,032,413 1,084,605 1,050,728 1,430,131 4,597,877Preopening expenses . . . . . . . . . . . . 10,125 4,216 4,552 11,558 30,451Provision for impaired assets and
closing costs, net . . . . . . . . . . . . . 4,000 3,000 (8,500) 2,500 1,000
Operating income . . . . . . . . . . . . 254,818 355,176 310,147 465,507 1,385,648OTHER INCOME (EXPENSE)
Interest expense . . . . . . . . . . . . . . . . (8,475) (8,261) (9,004) (10,911) (36,651)Interest income and other . . . . . . . . 7,903 13,072 14,188 16,464 51,627
INCOME BEFORE INCOMETAXES . . . . . . . . . . . . . . . . . . . . . . 254,246 359,987 315,331 471,060 1,400,624Provision for income taxes . . . . . . . 94,071 133,195 116,673 174,292 518,231
NET INCOME . . . . . . . . . . . . . . . . . . $ 160,175 $ 226,792 $ 198,658 $ 296,768 $ 882,393
NET INCOME PER COMMONSHARE:Basic . . . . . . . . . . . . . . . . . . . . . . . . $ 0.35 $ 0.49 $ 0.43 $ 0.64 $ 1.92
Diluted . . . . . . . . . . . . . . . . . . . . . . . $ 0.34 $ 0.48 $ 0.42 $ 0.62 $ 1.85
Shares used in calculation (000’s)Basic . . . . . . . . . . . . . . . . . . . . . . . . 457,632 458,228 459,074 461,268 459,223Diluted . . . . . . . . . . . . . . . . . . . . . . . 480,348 481,537 482,485 485,073 482,459
Dividends per share . . . . . . . . . . . . . . . $ — $ — $ 0.10 $ 0.10 $ 0.20
Note 11—Subsequent Event
Subsequent to year end the Company experienced some business interruption in its Florida locations due tohurricane damage. Warehouses sustained only minor structural damage, although due to electrical outages,perishable merchandise was lost and warehouse closures ranged from one to ten days. Overall, the Companyexpects to incur losses in the range of $7,000 to $10,000 net of insurance recoveries.
61

DIRECTORS AND OFFICERS
DIRECTORS
Jeffrey H. Brotman William H. GatesChairman of the Board Director
Dr. Benjamin S. Carson, Sr., M.D. Hamilton E. JamesDirector Director
Susan L. Decker Richard M. LibensonDirector Director
Richard D. DiCerchioSenior Executive Vice President, COO—Global Operations, Distribution andConstruction and Director
John W. MeisenbachDirector
Charles T. MungerDirector
Daniel J. Evans Jill S. RuckelshausDirector Director
Richard A. Galanti James D. SinegalExecutive Vice President, ChiefFinancial Officer and Director
President, Chief ExecutiveOfficer and Director
EXECUTIVE AND SENIOR OFFICERS
Joel BenolielSenior Vice President,Administration & Chief Legal Officer
Jeffrey H. BrotmanChairman of the Board
Don BurdickSenior Vice President, Information Systems
Charles V. BurnettSenior Vice President, Pharmacy
Roger A. CampbellSenior Vice President, General Manager—Southeast Region
Richard C. ChavezSenior Vice President, Costco WholesaleIndustries & Business Development
Richard D. DiCerchioSenior Executive Vice President, COO—Global Operations, Distribution & Construction
John B. GahertySenior Vice President, General Manager—Midwest Region
Richard A. GalantiExecutive Vice President, Chief Financial Officer
Jaime GonzalezSenior Vice President, General Manager—Mexico
Bruce GreenwoodSenior Vice President, General Manager—Los Angeles Region
Robert D. HicokSenior Vice President, General Manager—San Diego Region
Dennis A. HooverSenior Vice President, General Manager—Bay Area Region
W. Craig JelinekExecutive Vice President, COO—Merchandising
Dennis E. KnappSenior Vice President, GMM—Non-Foods
Jeffrey R. LongSenior Vice President, General Manager—Northeast Region
Jeffrey LyonsSenior Vice President, Merchandising—Fresh Foods
John MatthewsSenior Vice President, Human Resources& Risk Management
John McKaySenior Vice President, General Manager—Northwest Region
Russ MillerSenior Vice President, General Manager—Western Canada Region
Ali MoayeriSenior Vice President, Construction
Paul G. MoultonExecutive Vice President, Real EstateDevelopment
James P. MurphySenior Vice President, International Operations
David S. PettersonSenior Vice President, Corporate Controller
62

EXECUTIVE AND SENIOR OFFICERS (Continued)
Joseph P. PorteraExecutive Vice President, COO—Eastern &Canadian Divisions
Pierre RielSenior Vice President, General Manager—Eastern Canada Region
Ginnie RoeglinSenior Vice President, E-Commerce & Publishing
Timothy L. RoseSenior Vice President, Merchandising—Foods & Sundries
Doug SchuttExecutive Vice President, COO—Northern &Midwest Divisions
James D. SinegalPresident, Chief Executive Officer
John ThelanSenior Vice President, Operations—Depots
Thomas K. WalkerExecutive Vice President, Construction &Distribution
Louise WendlingSenior Vice President, Country Manager—Canada
Dennis ZookExecutive Vice President, COO—SouthwestDivision & Mexico
VICE PRESIDENTS
Jeffrey AbadirOperations—Bay Area Region
Sandi BabinsGMM—Foods & Sundries—WesternCanada Region
Francis BallCountry Manager—UK
Joe F. BasseGMM—Corporate Non-Foods
John BoothOperations—Bay Area Region
Andree BrienSenior GMM—Non-Foods—Canadian Division
Alan BubitzGMM—Food Services & Food Court
Debbie CainGMM—Foods—Northwest Region
Deborah CalhounGMM—Foods—San Diego Region
Patrick CallansMember Services
Richard ChangCountry Manager—Taiwan
Jeff ColeU.S. Gas Purchasing & Operations
Victor CurtisPharmacy
Richard DelieGMM—Corporate Non-Foods
Gerard DempseyGMM—Non-Foods Replenishment—Southeast Region
George Ed DwyerOperations—Depots
John T. EaganGMM—Foods—Los Angeles Region
Liz ElsnerE-Commerce Merchandising & Marketing
Frank FarconeOperations—Los Angeles Region
Timothy K. FarmerGMM—Corporate Non-Foods
Murray FlemingGMM—Hardlines—Canadian Division
Jack S. FrankReal Estate Development—West
Caton FratesOperations—Midwest Region
Gary GiacomiGMM—Non-Foods—Northwest Region
Cynthia GlaserGMM—Corporate Non-Foods
Joseph Grachek IIIMerchandise Accounting Controller
Nancy GrieseGMM—Corporate Foods
Isaac HamaouiGMM—Hardlines—Canadian Division
Bill HansonGMM—Foods—Midwest Region
Robert HardieInternal Audit
63

VICE PRESIDENTS (Continued)
Doris HarleyGMM—Foods—Southeast Region
David HarruffOperations—Northwest Region
Daniel M. HinesFinancial Accounting Controller
Mitzi HuGMM—Imports
Ross HuntHuman Resources, Finance & IS—Canadian Division
Arthur D. Jackson, Jr.Administration & Community Giving
Harold E. KaplanCorporate Treasurer
James KlauerGMM—Corporate Non-Foods
Gary KotzenGMM—Corporate Foods
Paul LathamMarketing, Membership & Costco Travel
Robert LeuckOperations—Northeast Region
Gerry LibenGMM—Ancillaries—Canadian Division
Phil LindBusiness Centers
Steve MantanonaGMM—Merchandising—Mexico
Tracy Mauldin-AveryGMM—Foods—Bay Area Region
Mark MaushundOperations—Los Angeles Region
Susan McConnahaDirector of Bakery Operations
John MinolaReal Estate Development
Michael W. MostellerOperations—Labor Relations
Robert E. NelsonFinancial Planning & Investor Relations
Pietro NenciGMM—Foods—Eastern Canada Region
David NickelGMM—Non-Foods Replenishment -Western Canada Region
Gary OjendykGMM—Corporate Non-Foods
Richard J. OlinLegal, General Counsel
Mario OmossOperations—Texas Region
Steve PappasCountry Manager—Korea
Shawn ParksOperations—Los Angeles Region
Mike ParrottGlobal Purchasing, Costco Home, BusinessCenters and Corporate Purchasing
Mike PollardE-commerce Operations
Steve PowersOperations—Southeast Region
Robert L. PugmireGMM—Corporate Non-Foods
Paul PulverOperations—Northeast Region
Aldyn RoyesOperations—Southeast Region
Yoram RubanenkoOperations—Northeast Region
James W. RutherfordInformation Systems
Drew SakumaOperations—UK
Janet ShanksGMM—Fresh Foods—Canadian Division
Michael SinegalCountry Manager—Japan
David SkinnerOperations—Eastern Canada Region
Kimberley L. SuchomelGMM—International
Gary SwindellsOperations—Eastern Canada Region
Mauricio TalayeroChief Financial Officer—Mexico
Keith H. ThompsonConstruction
Adrian ThummlerOperations—Mexico
Scott TylerOperations—Western Canada Region
Ron VachrisOperations—San Diego Region
Azmina ViraniGMM—Softlines—Canadian Division
Richard WebbOperations—Midwest Region
Jack WeisblyGMM—Corporate Non-Foods
Charlie A. WintersOperations—Fresh Meat & ServiceDeli
64

ADDITIONAL INFORMATION
A copy of Costco’s annual report to the Securities and Exchange Commission on Form 10-K and quarterlyreports on Form 10-Q will be provided to any shareholder upon written request directed to Investor Relations,Costco Wholesale Corporation, 999 Lake Drive, Issaquah, Washington 98027. Internet users can access recentsales and earnings releases, the annual report and SEC filings, as well as our Costco Online web site, at http://www.costco.com. E-mail users may direct their investor relations questions to [email protected]. All of theCompany’s filings with the SEC may be obtained at the SEC’s Public Reference Room at Room 1580, 100 FStreet NE, Washington, DC 20549. For information regarding the operation of the SEC’s Public ReferenceRoom, please contact the SEC at 1-800-SEC-0330. Additionally, the SEC maintains an internet site that containsreports, proxy and information statements and other information regarding issuers that file electronically with theSEC at www.sec.gov.
Corporate Office999 Lake Drive
Issaquah, WA 98027(425) 313-8100
Division Offices
Northern DivisionNorthwest Region1045 Lake DriveIssaquah, WA 98027
Bay Area Region2820 Independence DriveLivermore, CA 94550
Midwest Region1901 West 22nd Street, 2nd FloorOak Brook, IL 60523
Eastern DivisionNortheast Region45940 Horseshoe Drive, Suite 150Sterling, VA 20166
Southeast Region3980 Venture Drive NW, #W100Duluth, GA 30096
Southwest DivisionLos Angeles Region11000 Garden Grove, #201Garden Grove, CA 92843
San Diego Region4649 Morena Blvd.San Diego, CA 92117
Canadian DivisionEastern Region415 Hunt Club Road WestOttawa, ON K2E 1C5
Western Region3550 Brighton St.Burnaby, BC V5A 4W3
International DivisionUnited Kingdom Region213 Hartspring LaneWatford, HertfordshireEngland, UK WD2 8JS
Japan Region4F Komahara Bldg 1-4-3Yakumo, Meguro-kuTokyo, 152-0023 Japan
Korea Region65-3-ka Yangpyung-dongYoungdeungpo-kuSeoul, Korea
Taiwan Region255 Min Shan Street, NeihuTaipei, 114 Taiwan
Mexico RegionBoulevard Magnocentro #4Col. San FernandoLa Herradura 52760Huixquilucan, Mexico
Annual MeetingWednesday, January 25, 2006 at 4:00 PMMeydenbauer Center11100 NE 6th StreetBellevue, Washington 98004
Independent Public AccountantsKPMG LLP801 Second Avenue, Suite 900Seattle, WA 98104
Transfer AgentMellon Investor Services, L.L.C.Costco Shareholder RelationsP. O. Box 3315South Hackensack, New Jersey 07606Telephone: (800) 249-8982TDD for Hearing Impaired: (800) 231-5469Outside U.S.: (201) 680-6578
Stock Exchange ListingNASDAQ Stock MarketStock Symbol: COST
65

YEAR ENDED AUGUST 28, 2005
AnnualReport2005
2005
AnnualReport2005
PRINTED ON RECYCLED PAPER