priority areas for a national hydrogen strategy for turkey
TRANSCRIPT

Priority Areas for a National Hydrogen Strategy for Turkey

About SHURA Energy Transition CenterSHURA Energy Transition Center, founded by the European Climate Foundation (ECF), Agora Energiewende and Istanbul Policy Center (IPC) at Sabancı University, contributes to decarbonisation of the energy sector via an innovative energy transition platform. It caters to the need for a sustainable and broadly recognized platform for discussions on technological, economic, and policy aspects of Turkey’s energy sector. SHURA supports the debate on the transition to a low-carbon energy system through energy efficiency and renewable energy by using fact-based analysis and the best available data. Taking into account all relevant perspectives by a multitude of stakeholders, it contributes to an enhanced understanding of the economic potential, technical feasibility, and the relevant policy tools for this transition.
AuthorsDeğer Saygın (SHURA Enerji Dönüşümü Merkezi), Emre Gencer (MIT Energy Initiative) and Barış Sanlı (Bilkent Energy Policy Research Center)
Acknowledgements We appreciate the valuable review and feedback received from Arkın Akbay (TURCAS), Emanuele Taibi (International Renewable Energy Agency) and Matthias Deutsch (Agora Energiewnede). Draft findings of this report has been presented to the sector stakeholders at the Hydrogen Quest Conference on 15 January 2020, IRENEC 2020 on 5 June 2020 and the National Hydrogen Workshop on 25 August 2020. SHURA Energy Transition Center is grateful to the generous funding provided by the ECF.
This report is available for download from www.shura.org.tr.For further information or to provide feedback, please contact the SHURA team at [email protected]
DesignTasarımhane Tanıtım Ltd. Şti.
Copyright © 2021 Sabancı University
DisclaimerThis report and the assumptions made within the scope of the study have been drafted based on different scenariosand market conditions as of the end of 2019. Since these assumptions, scenarios and the market conditions aresubject to change, it is not warranted that the forecasts in this report will be the same as the actual figures. Theinstitutions and the persons who have contributed to the preparation of this report can not be held responsiblefor any commercial gains or losses that may arise from the divergence between the forecasts in the report and theactual values.

Priority Areas for a National Hydrogen Strategy for Turkey


3 Priority Areas for a National Hydrogen Strategy for Turkey
List of Figures
List of Tables
List of Abbreviations
Key findings
1. Global trends in hydrogen supply and use 1.1. Rapid decarbonization of the energy system 1.2. The role of Hydrogen in decarbonization 1.3. Growing hydrogen initiatives from around the globe
2. Opportunities for hydrogen in Turkey 2.1. Manufacturing industry 2.2. Transportation 2.3. Buildings 2.4. Hard to decarbonize sectors 2.5. Opportunities for green hydrogen
Industrial heat Transport Buildings Hydrogen blending into natural gas for heating
3. Renewable hydrogen potential in Turkey: sectors and applications 3.1. Potential demand for and supply of green hydrogen in Turkey 3.2. System integration impacts of green hydrogen
4. Infrastructure needs to enable hydrogen transition
5. Opportunities for Hydrogen Entrepreneurship in Turkey Research and Development Technology innovation Safety measures Commercialization Appliance development Niche applications in transportation Business models Large-scale adoption and deployment
6. Priority areas in developing a national hydrogen strategy for Turkey
References
CONTENTS
4
4
4
7
991016
21212323262929313233
353538
41
454545464647474747
49
51

4 Priority Areas for a National Hydrogen Strategy for Turkey
Figure 1: The bulk of emissions reductions: renewables and efficiencyFigure 2: Production routes of hydrogenFigure 3: Electrolysis-based hydrogen projectsFigure 4: Current production pathways and application areas of hydrogen in the worldFigure 5: Levelized cost of hydrogen production (in US$/kg H2) Figure 6: Impact of electrolyser capacity factors (x-axis) on hydrogen production costs (y-axis)Figure 7: Summary of announced initiatives by governments between June 2018 and November 2020Şekil 8: Overview of hydrogen studies in Turkey, 31 October 2019Şekil 9 : Breakdown of Turkey’s total final consumption, 2018Şekil 10: Breakdown of Turkey’s manufacturing industry final energy consumption and non-energy use by sector, 2018Şekil 11: Breakdown of total final energy consumption of buildings in Turkey, 2018Şekil 12: Hydrogen transportation and distribution optionsŞekil 13 : Potential routes to use hydrogen for buildings heat supply Şekil 14: Hydrogen tolerance of gas infrastructure componentsŞekil 15: Effect of 40000 MWh of storage on Turkish summer demand and load-duration curveŞekil 16: Turkish electricity system has to start curtailing a lot of solar and wind if their capacity increases above 20000 MW eachFigure 17: Location of iron and steel plants in Turkey, 2015Figure 18: Location of cement plants in Turkey, 2018Figure 19: Gas pipelines in Turkey, 2020
Table 1: Key decarbonization solutions by sectorTable 2: Hard to transform sectors and their contribution to Turkey’s total final energy consumption and CO2 emissions, 2018Table 3: Specifications of announced fuel cell electric trucksTable 4: Potential of green hydrogen for Turkey
BOTAŞ Boru Hatları ile Petrol Taşıma Anonim Şirketi Petroleum Pipeline Company (Boru Hatları ile Petrol Taşıma Anonim Şirketi)BEV Battery Electric VehiclesCO2 Carbon DioxideDRI direct reduced ironEAF electric arc furnace
91011
121516
17
182122
25
32333439
40
424343
1428
3136
LIST OF FIGURES
LIST OF TABLES
LIST OF ABBREVIATIONS

5 Priority Areas for a National Hydrogen Strategy for Turkey
EJ exajoulesEU European UnionEV electric vehicleFCET fuel cell electric truckFCEV fuel cell electric vehicleGAZBİR Turkey Natural Gas Distributors AssociationGAZMER Technical Center of GAZBİRGj gigajouleGt gigatonGW gigawattH2 HydrogenICHET International Centre for Hydrogen Energy TechnologiesIEA International Energy AgencyIRENA International Renewable Energy Agencykcal kilocalorieskg kilogramkm kilometerkW kilowattkWh kilowatt-hourLPG liquefied petroleum gasm3 cubic meterMENR Ministry of Energy and Natural ResourcesMt million tonsMtce million tons of coal equivalentMtoe million tons of oil equivalentMW megawattoC degree CelsiusPEM polymer electrolysis membranePJ petajoulesPV photovoltaicR&D research and developmentSMR steam methane reformingTANAP Trans-Anatolian Natural Gas PipelineTKİ Turkey Coal Operations Authority (Türkiye Kömür İşletmeleri Kurumu)Türkiye Kömür İşletmeleriUS$ United States dollarYEKA Renewable Energy Resource Area (Yenilenebilir Enerji Kaynak Alanı)YEKDEM Turkish Renewable Energy Resources Support Mechanism (Yenilenebilir Enerjki Kaynak Destek Mekanizması)


Priority Areas for a National Hydrogen Strategy for Turkey7
• More than 95% of global hydrogen production is from fossil fuels with nearly half via the steam reforming of methane route. Electrolysis represents 4% of the total global hydrogen output
• Alkaline electrolysis is already commercial but new alternatives are emerging. The number and scale of electrolysis projects are growing worldwide with 100-megawatt (MW) size systems becoming mainstream. With the rapid developments in electrolyzer technology and falling costs of renewable power, attention to green hydrogen is growing
• Currently, hydrogen is mainly used as feedstock in the production of chemicals and petrochemicals. With green hydrogen emerging as a cross-cutting technology in multiple markets, applications of hydrogen are expanding. Notably new process design in the manufacturing industry to replace traditional high-temperature processes for bulk materials production, freight transport and blending hydrogen in natural gas grids are gaining momentum
• Costs of producing green hydrogen stands as the main bottleneck to its wide deployment. Global assessments show green hydrogen cost-competitiveness at production costs of around US$2-3 per kilogram. Enabling this will require technology learning to reduce electrolyzer costs, continued decline in renewable power costs, optimum use of electrolyzer capacity and increasing electrolyzer efficiency. Creation of carbon markets can also accelerate transition to green hydrogen
• Building a local hydrogen industry has become an important energy strategy ambition of Turkey. As this analysis shows, hydrogen can have a role in Turkey’s energy mix which is equally split between manufacturing industry, buildings (residential, commercial and public) and transport. Bulk materials production of steel and cement represent a large share of Turkey’s industrial energy demand and in their production the country ranks in the top-10 worldwide. Road freight transport is a growing mode of transport. Gas grids are spread across the country with annual gas consumption averaging 50 billion cubic meters (m3) from nearly 53 million active users representing nearly two-thirds of Turkey’s population. Each one of these areas pose a specific challenge to Turkey’s energy transition as solutions to replace the use of fossil fuels are limited and currently costly.
• Green hydrogen production from renewable power can provide an important opportunity in transformation of Turkey’s end-use sectors. A first order estimate for the current situation shows a potential of 4.6 million tons of oil equivalent (Mtoe) hydrogen potential split between 2.1 Mtoe in industry, 1.8 Mtoe for road freight transport and 0.6 Mtoe in blending in gas grids, equivalent to around 5% of Turkey’s total final energy consumption in 2018. This would require a total installed electrolyzer capacity of 12.1 gigawatt (GW). The electricity supply for electrolysis must also be considered estimated at 36.3 GW. Total investment needs would be US$45.4 billion. Other markets for green hydrogen such as its role to provide system flexibility can increase this potential further.
Key findings

Priority Areas for a National Hydrogen Strategy for Turkey8
• The reports shows several priority areas for Turkey in developing a hydrogen strategy including the development of a clear plan that encompasses the costs, benefits and system implications of hydrogen production Turkey from various pathways, the need for mobilizing financing, understanding hydrogen’s business opportunities, and the contribution of hydrogen to Turkey’s energy transition strategy as a local resource.

Priority Areas for a National Hydrogen Strategy for Turkey9
1.1. Rapid decarbonization of the energy system
The global energy sector is experiencing a profound energy transition. At the center of this are the dual pillars of energy efficiency and renewable energy, both of which are rapidly expanding. Another key component of this transition is system-wide innovation, including the growing electrification of energy end uses and digitalization to manage the transforming energy system.
The global energy transformation lies at the center of meeting the Paris Climate Agreement goals to limit the average global temperature rise to below 2°C above pre-industrial levels; and to pursue efforts to limit the increase to 1.5 °C by the end of this century. Energy sector’s carbon dioxide (CO2) emissions represent around two-thirds of the total global greenhouse gas emissions. In a scenario where the existing national climate plans are extended to 2050, global energy related CO2 emissions are estimated to peak after 2025 and remain slightly below the current levels. In order to remain within the carbon budget that is in line with the Paris Climate Agreement, emissions would need to be on a linearly declining trajectory starting now till 2050 and emissions would need to be below 10 gigatons (Gt) per year by 2050 (see Figure 1).
1. Global trends in hydrogen supply and use
Renewables
Fuel switch and others
45
40
35
30
25
20
15
10
5
02015 20202010 2025 2030 2035 2040 2045 2050
Buildings
Transport
District Heat
Power
Buildings
Transport
District Heat
Power
Industry
Industry
Planned Energy Scenario 33 Gt in 2050
Baseline Energy Scenario 43 Gt in 2050
Transforming Energy Scenario 9.5 Gt in 2050
Two-thirdsof emissions reduction potential in the Transforming Energy Scenario
21%
27%
52%
29%26%
45%
CO2 (Gt/yr)
Energy efficiency
Figure 1: The bulk of emissions reductions: renewables and efficiency
Source: IRENA (2020a)
In a scenario where the existing national climate
plans are extended to 2050, global energy related CO2 emissions are estimated to peak after 2025 and
remain slightly below the current levels.

10 Priority Areas for a National Hydrogen Strategy for Turkey
1.2. The role of Hydrogen in decarbonization
Some scenario findings show that energy efficiency and renewable energy (including electrification) could account for nearly 80% of the needed emissions reductions in this timeframe (IRENA, 2020a). Other scenarios show the role of behavioral change, nuclear power and transition to less polluting fossil fuel technology alternatives (IEA, 2020).
Green hydrogen is defined as hydrogen produced from renewable energy sources. Blue hydrogen is production from fossil fuel resources such as natural gas, but carbon emissions during production are captured and stored or reused. While transition to a hydrogen economy has been discussed for the past two decades, hydrogen as a crucial solution of the energy system decarbonization has gained attention in the past few years. The underlying reason is there is no commercialized solution for sectors that are hard to decarbonize. Indeed, energy efficiency and renewables are immediate solutions to the power sector and to large extent to cut down emissions from the heating and transport sectors. The deployment of electrification options such as electric vehicles and heat pumps are also gaining traction. However, for high temperature process heat in the manufacturing industry such as in the production of iron, steel, chemicals and cement and for transport modes beyond passenger vehicles options remain limited. This has pushed markets and the policy community to seek new technology options such as e-fuels and green hydrogen. Green hydrogen can be produced from several feedstocks including: renewable power, biomass and sun irradiation (see Figure 2).
Figure 2: Production routes of hydrogen
Feed
stoc
k us
ed
Applied research / Prototype / Demonstration / Commercial
Biomass and
biogas
Sun irradiation
RenewableElectricity SOEC
electrolysers PEMelectrolysers ALK
electrolysers
Pyrolysis &Gasyfication
Anaerobic digestion& dark fermentation
Steamreforming
Supercriticalwater gasification
Photo-catalysis
Thermochemicalwater splitting
Source: IRENA (2018)
Green hydrogen is defined as hydrogen produced
from renewable energy sources. While transition to
a hydrogen economy has been discussed for the past
two decades, hydrogen as a crucial solution
of the energy system decarbonization has gained
attention in the past few years.

11 Priority Areas for a National Hydrogen Strategy for Turkey
As a low-cost feedstock, renewable power combined with the availability of commercial electrolysis options emerges as an early opportunity. This is primarily driven by the availability of low-cost renewable power resources. For instance, recent global data from 2019 shows a continued decline in electricity generation costs from solar photovoltaic (PV) on a year-by-year basis of 13%. The levelized costs of electricity generation from new solar PV projects in 2019 were below US$7 cents (ct) per kilowatt-hour (kWh) (IRENA, 2020b). By the end of 2020, it is expected that solar PV costs will be on par with onshore wind. Alkaline electrolysis is already commercial and has been used in the production of hydrogen (see Figure 3). Polymer electrolysis membrane (PEM) technology is more efficient whilst more capital expensive than the alkaline electrolysis. Some projects in place favor PEM technology. Recent project information shows a striking growth in the average plant size (above 100 MW) and a shift towards more advanced electrolysis technologies such as solid oxide electrolyzer cells.
Figure 3: Electrolysis-based hydrogen projects
Source: IRENA (2019b)
Num
ber o
f New
Pro
ject
s
Aver
age
Size
of N
ew P
roje
cts (
MW
)
ALKPEM
Solid oxideUnknown
Average Size
12 Priority Areas for a National Hydrogen Strategy for Turkey
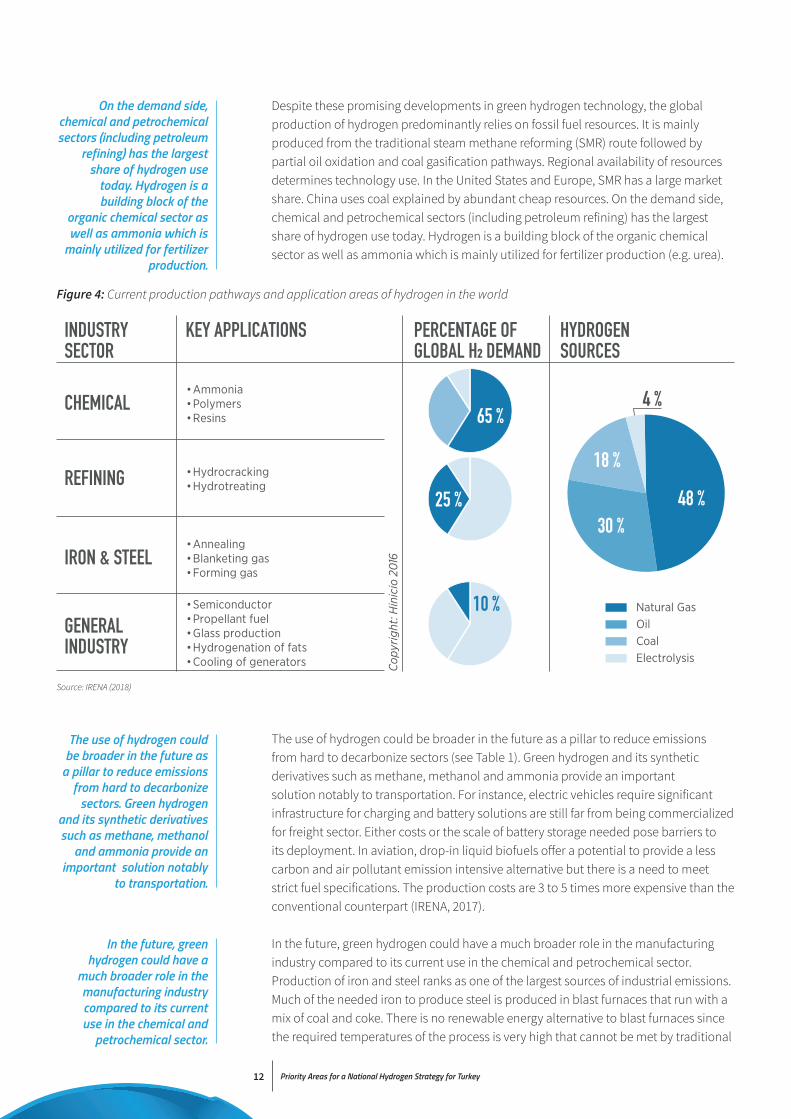
Despite these promising developments in green hydrogen technology, the global production of hydrogen predominantly relies on fossil fuel resources. It is mainly produced from the traditional steam methane reforming (SMR) route followed by partial oil oxidation and coal gasification pathways. Regional availability of resources determines technology use. In the United States and Europe, SMR has a large market share. China uses coal explained by abundant cheap resources. On the demand side, chemical and petrochemical sectors (including petroleum refining) has the largest share of hydrogen use today. Hydrogen is a building block of the organic chemical sector as well as ammonia which is mainly utilized for fertilizer production (e.g. urea).
The use of hydrogen could be broader in the future as a pillar to reduce emissions from hard to decarbonize sectors (see Table 1). Green hydrogen and its synthetic derivatives such as methane, methanol and ammonia provide an important solution notably to transportation. For instance, electric vehicles require significant infrastructure for charging and battery solutions are still far from being commercialized for freight sector. Either costs or the scale of battery storage needed pose barriers to its deployment. In aviation, drop-in liquid biofuels offer a potential to provide a less carbon and air pollutant emission intensive alternative but there is a need to meet strict fuel specifications. The production costs are 3 to 5 times more expensive than the conventional counterpart (IRENA, 2017).
In the future, green hydrogen could have a much broader role in the manufacturing industry compared to its current use in the chemical and petrochemical sector. Production of iron and steel ranks as one of the largest sources of industrial emissions. Much of the needed iron to produce steel is produced in blast furnaces that run with a mix of coal and coke. There is no renewable energy alternative to blast furnaces since the required temperatures of the process is very high that cannot be met by traditional
Figure 4: Current production pathways and application areas of hydrogen in the world
• Ammonia• Polymers• Resins
• Hydrocracking• Hydrotreating
• Annealing• Blanketing gas• Forming gas
• Semiconductor• Propellant fuel• Glass production• Hydrogenation of fats• Cooling of generators
Cop
yrig
ht: H
inic
io 2
016
48 %30 %
18 %
4 %65 %
25 %
10 %
INDUSTRY SECTOR
CHEMICAL
REFINING
IRON & STEEL
GENERALINDUSTRY
KEY APPLICATIONS PERCENTAGE OF GLOBAL H² DEMAND
HYDROGENSOURCES
Natural GasOilCoalElectrolysis
Source: IRENA (2018)
On the demand side, chemical and petrochemical sectors (including petroleum
refining) has the largest share of hydrogen use
today. Hydrogen is a building block of the
organic chemical sector as well as ammonia which is
mainly utilized for fertilizer production.
The use of hydrogen could be broader in the future as
a pillar to reduce emissions from hard to decarbonize
sectors. Green hydrogen and its synthetic derivatives such as methane, methanol
and ammonia provide an important solution notably
to transportation.
In the future, green hydrogen could have a
much broader role in the manufacturing industry compared to its current use in the chemical and
petrochemical sector.

13 Priority Areas for a National Hydrogen Strategy for Turkey
technologies (above >1000oC). Biocoke and charcoal are emerging but their uses remain limited to small-scale blast furnaces in Brazil and the mechanical stability of the final product remains weak (Saygin et al., 2014). Direct reduced iron (DRI) route that uses natural gas or coal coupled with electric arc furnaces represent around 5% of the total steel production today. The industry is pursuing various low-emission reduction routes. A DRI-electric arc furnace (EAF) route that uses hydrogen from renewable power reduces CO2 emissions by 80–95%, compared to the blast furnace route. Hydrogen-based iron making is technically feasible and various producers are working to develop this option further. The following initiatives have been identified: The hydrogen subproject of the ULCOS program, run mostly from France (Université de Lorraine); Hybrit project, SSAB, Sweden; SuSteel, VoestAlpine, Austria; Salcos-Macor, Salzgitter, Germany; ArcelorMittal Midrex plant, Germany; Flash iron making, the United States (Gielen et al., 2020).
Ammonia production represents an important early opportunity for green hydrogen: Haldor Topsoe, a technology provider for ammonia plants, is demonstrating efficiency improvements in the renewable power to ammonia technology by incorporating waste heat to reduce power consumption (and costs). The start-up Atmonia plans to build a US$2 million prototype for an electrochemical catalyst process for generating aqueous ammonia directly from air and water, using renewable power. Starfire Energy developed a new solution for renewable power to ammonia production, including hydrogen production by proton exchange membrane electrolyzer, nitrogen production by pressure swing adsorption, ammonia synthesis, and liquid ammonia storage. It built a 10 kilogram (kg) per day ammonia synthesis system in Colorado using its low pressure ‘Rapid Ramp’ ammonia process and plans to modulate the plant to 100 kg/day in 2020 (Saygın & Gielen, 2021).
These markets can significantly expand hydrogen demand by a factor of two by 2050 (from just below 15 exajoules, EJ, to nearly 30 EJ).1 According to the scenarios of the International Renewable Energy Agency (IRENA, 2020c), by 2050, more than half of all hydrogen production would be green hydrogen. The remainder would be a mix of blue and grey hydrogen.
1 1 million tons of oil equivalent is 41.868 petajoules (PJ). 1000 PJ is 1 EJ.
Ammonia production represents an important
early opportunity for green hydrogen.
These markets can significantly expand
hydrogen demand by a factor of two by 2050.

14 Priority Areas for a National Hydrogen Strategy for Turkey
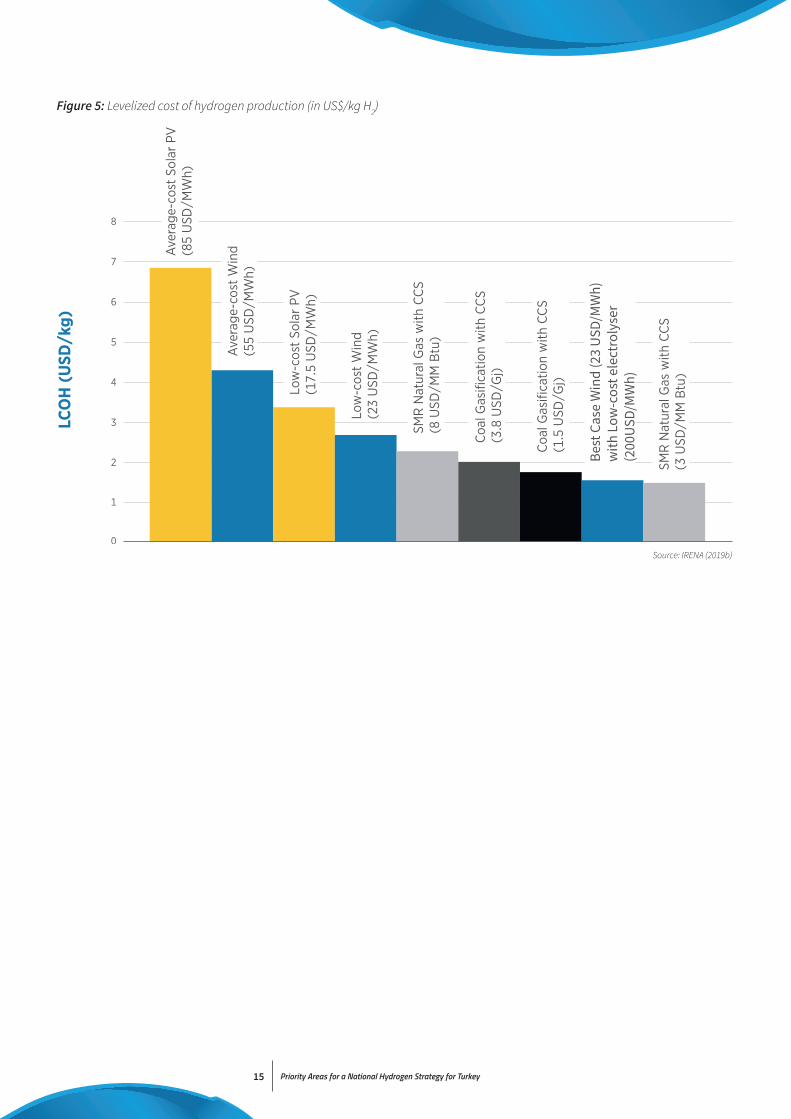
The cost of green hydrogen is critical for the business case of its derived products (see Figure 5). Green hydrogen production cost can be split into electricity cost and capital cost for the electrolyzer facility. The energy conversion efficiency of the electrolyzer is 65-67%, 50 kWh of electricity is needed per kg hydrogen. At US$4 ct per kWh, the electricity cost amount to 2 US$/kg hydrogen. The electrolyzer facility cost amount to 1000 US$ per kilowatt (kW) (input power). Given an annuity of 10%, this translates into 0.6-1.8 US$ per kg hydrogen, the range reflecting capacity factors. Today green hydrogen costs between US$6 and US$10 per kg. Other sources quote between 2.5 and 5.5 Euro/kg (35-87 Euro/MWh electricity price and electrolyzer capital cost of Euro 600/kW) which is up to 4 times more expensive than gas-based production at 1.5 Euro/kg (European Commission, 2019). This may fall to 3 US$/kg in the coming years in the most favorable conditions. Still at such price a gigajoule (GJ) of hydrogen (around 8 kg) would cost US$24, while a GJ of transmission pipeline natural gas costs currently between US$2 and US$3 in Europe and the United States. Hence, hydrogen is more than 7 times more expensive. This does not account for any hydrogen transmission cost or electricity grid surcharges. For affordable production of green hydrogen reduction in capital costs of electrolyzers and renewable power will be needed. Another important contributor to hydrogen costs is the capacity utilization factors of electrolyzers. At low rates of utilization, the costs of production are much higher (see Figure 6). This requires continuous supply of low-cost renewable power, i.e. surplus power generated from wind and solar will not be sufficient to reach low-cost green hydrogen.
Table 1: Key decarbonization solutions by sector
Sectors Key solutions
Road freight transport Direct electrification, green hydrogen, biofuels
Aviation Biofuels, synfuels from green hydrogen, electrification
Shipping Synfuels from green hydrogen, biofuels, electrification
Iron and steel Green hydrogen, CCS, biomass, circular economy
Chemicals and petrochemicals Biomass, green hydrogen, circular economy
Aluminium Electrification, circular economy
Cement and lime CCS, circular economy, renewable energy and waste
Greening the gas system Green hydrogen, synthetic methane from green hydrogen, cleaned biogas
Source: IRENA (2020a)
The energy conversion efficiency of the electrolyzer
is 65-67%, 50 kWh of electricity is needed per kg
hydrogen.
For affordable production of green hydrogen reduction in capital costs of electrolyzers
and renewable power will be needed.
15 Priority Areas for a National Hydrogen Strategy for Turkey
Source: IRENA (2019b)
Figure 5: Levelized cost of hydrogen production (in US$/kg H2)
Best
Cas
e W
ind
(23
USD
/MW
h)w
ith L
ow-c
ost e
lect
roly
ser
(200
USD
/MW
h)

Priority Areas for a National Hydrogen Strategy for Turkey16
1.3. Growing hydrogen initiatives from around the globe
Hydrogen policy and research emerge as one of the most popular topics in the energy sector. Many national initiatives and strategies are emerging. A selection is provided below:• Australia: Australia’s National Hydrogen Strategy (November 2019) (COAG Energy
Council, 2019) that shows a plan to accelerate the commercialization of hydrogen, build a national production and its supply chain and foster domestic demand
• European Union: A hydrogen strategy for a climate-neutral Europe (July 2020) (European Commission, 2019) that explores how hydrogen as a priority for Europe can be developed in decarbonizing the region’s energy system
• France: Plan de déploiement de l’hydrogène pour la transition énergétique (June 2018) (DGEC & CEA, 2018) that provides a strategy to produce green hydrogen and start its use across industry, gas supply, mobility and as energy storage
• Germany: The National Hydrogen Strategy (June 2020) (BMWI, 2020) which defines hydrogen produced from renewable energy as green hydrogen and sustainable in the long term
• Italy: The energy transition in Italy and the role of the gas and power sectors (October 2019) (CDP,n.d.) which explores how hydrogen and other e-fuels can help decarbonize the gas sector under different energy scenarios
• Japan: The Strategic Road Map for Hydrogen and Fuel Cells (March 2019) (Hydrogen and Fuel Cell Strategy Council, 2019) which explores strategies to transition to a hydrogen society
• The Netherlands: The Green Hydrogen Economy in the Northern Netherlands (May 2019) (NIB, n.d.) that shows how green energy can facilitate the transition of chemistry, transportation, electricity and heating sectors
Figure 6: Impact of electrolyser capacity factors (x-axis) on hydrogen production costs (y-axis)
Levelized cost of hydrogen production (US$/kg H2)
Targeted generation cost
2025 electricity mix
2017 electricity mix
Source: IRENA (2019b)

Priority Areas for a National Hydrogen Strategy for Turkey17
• The United States: US DRIVE Hydrogen Production Technical Team Roadmap (November 2017) (U.S. DRIVE, 2017) that aims to enable the development of hydrogen production that uses clean, domestic resources at dispensed cost of US$2-4 per gasoline gallon equivalent
Figure 7: Summary of announced initiatives by governments between June 2018 and November 2020
Source: IRENA (2020d)
CaliforniaVision document
France Strategy
CanadaVision document
2018
2019
2020
European UnionVision document
Republic of KoreaRoadmapEuropean Union Roadmap
New ZealandVision document
Republic of Korea Strategy
China R&D programme
PortugalVision document
Spain Strategy
Japan Roadmap
Japan Strategy
Australia Strategy
Norway Strategy
Germany Strategy
European Union Strategy
Chile Strategy
Finland Strategy
Russia Roadmap
Netherlands Strategy
Upcoming Strategies:
AustriaColombiaDenmarkItalyMorocco
OmanParaguayUnited KingdomUruguay
Portugal Strategy
and moreto come
R&D PROGRAMMES ROADMAPVISION DOCUMENT STRATEGY
P1National Strategies

18 Priority Areas for a National Hydrogen Strategy for Turkey
Private sector initiatives are also growing. In June 2017, the Hydrogen Council as a CEO-level advisory board was launched with currently more than 90 members (Hydrogen Council, n.d.).There are also growing number of studies undertaken by intergovernmental organizations that focus on clean energy resources such as the International Energy Agency (IEA) (IEA, 2019) and the IRENA (IRENA, 2019a, 2020c, 2020e).
Turkey has previously attempted to increase hydrogen research and development (R&D), through supporting UNIDO-ICHET in Istanbul. The support failed policy makers’ expectations and the center was closed. Later the equipment has been transported to Hydrogen Labs of the Ministry of Energy and Natural Resources (MENR). Until January 2020, the hydrogen was hardly visible in energy policies. On the 15th of January 2020, Ministry has initiated a public consultation period with a kick-off meeting (“Hydrogen Quest Conference”) (Enerji ve Tabii Kaynaklar Bakanlığı, 2020). Since then, hydrogen has become an important part of Turkey’s energy transition strategy. In the meeting the Minister of Energy and Natural Resources of Turkey Mr Fatih Dönmez has declared that by 2021, Turkey will test mixing hydrogen with natural gas in the distribution grid. The task has been assigned to Turkey Natural Gas Distributors Association (Gazbir), the natural gas distribution companies’ association. Currently Gazbir, with its underdog for technical issues Gazmer is working on the project. One important study discussed during the conference is the “Map of hydrogen studies in Turkey”. As of 31st of October 2019, a total of 28156 hydrogen related studies have been completed across Turkey (Figure 8). There are studies of hydrogen in all provinces. So academic readiness for hydrogen studies may be sufficient to move forward.
Source: SCOPUS Period: 1970-2020Date: 31 October 2019 Keyword: Hydrogen Affiliation: By the city names of TR
56
127
179
471
257
218
2192
213
208
338
89
293
473
6179
92
997
475158
164
215
58104
290
1752
89304
436152
571176
727241
41 25
224
49
57
2082
1747
47 88
208
64
257
109
207
163
162
147
298
120
480
87
301
1243
225
456
51580
155
50
246
93
23917
333
574
154 139
72
49
135
11466800
229
544 894
92
414
Figure 8: Overview of hydrogen studies in Turkey, 31 October 2019
Total28156

19 Priority Areas for a National Hydrogen Strategy for Turkey
During the Ministry’s Hydrogen Quest Conference, Turkish startups working on hydrogen or related subjects including materials have been summoned in Hydrogen Lab. An informal exchange and recorded survey have been done. According to the survey, most of the participants expect hydrogen to have a share of 1% in Turkey’s total energy mix by 2030. This is a very low expectation considering that the respondents are already working with hydrogen or related technologies.
The complete survey results are attached to the meeting notes and published on MENR’s web page. But two important subjects discussed during the gathering was how burning hydrogen will change the production processes in industry and safe burning technologies. Currently, big industrial players are investigating hydrogen on the basic level and there are lots of questions about the effects of hydrogen on final product quality and specifications. This is an important area for government sponsored R&D.

21 Priority Areas for a National Hydrogen Strategy for Turkey
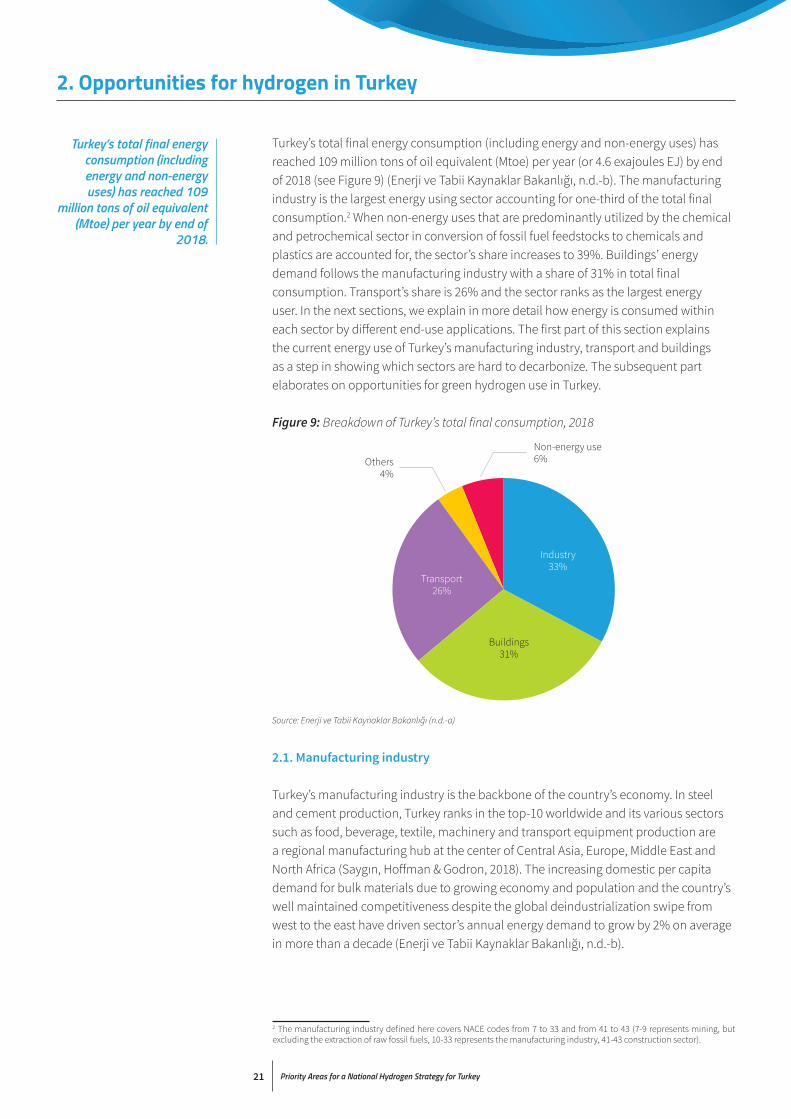
Turkey’s total final energy consumption (including energy and non-energy uses) has reached 109 million tons of oil equivalent (Mtoe) per year (or 4.6 exajoules EJ) by end of 2018 (see Figure 9) (Enerji ve Tabii Kaynaklar Bakanlığı, n.d.-b). The manufacturing industry is the largest energy using sector accounting for one-third of the total final consumption.2 When non-energy uses that are predominantly utilized by the chemical and petrochemical sector in conversion of fossil fuel feedstocks to chemicals and plastics are accounted for, the sector’s share increases to 39%. Buildings’ energy demand follows the manufacturing industry with a share of 31% in total final consumption. Transport’s share is 26% and the sector ranks as the largest energy user. In the next sections, we explain in more detail how energy is consumed within each sector by different end-use applications. The first part of this section explains the current energy use of Turkey’s manufacturing industry, transport and buildings as a step in showing which sectors are hard to decarbonize. The subsequent part elaborates on opportunities for green hydrogen use in Turkey.
Figure 9: Breakdown of Turkey’s total final consumption, 2018
2.1. Manufacturing industry
Turkey’s manufacturing industry is the backbone of the country’s economy. In steel and cement production, Turkey ranks in the top-10 worldwide and its various sectors such as food, beverage, textile, machinery and transport equipment production are a regional manufacturing hub at the center of Central Asia, Europe, Middle East and North Africa (Saygın, Hoffman & Godron, 2018). The increasing domestic per capita demand for bulk materials due to growing economy and population and the country’s well maintained competitiveness despite the global deindustrialization swipe from west to the east have driven sector’s annual energy demand to grow by 2% on average in more than a decade (Enerji ve Tabii Kaynaklar Bakanlığı, n.d.-b).
2. Opportunities for hydrogen in Turkey
2 The manufacturing industry defined here covers NACE codes from 7 to 33 and from 41 to 43 (7-9 represents mining, but excluding the extraction of raw fossil fuels, 10-33 represents the manufacturing industry, 41-43 construction sector).
Industry33%
Buildings31%
Others4%
Non-energy use6%
Transport26%
Source: Enerji ve Tabii Kaynaklar Bakanlığı (n.d.-a)
Turkey’s total final energy consumption (including energy and non-energy uses) has reached 109
million tons of oil equivalent (Mtoe) per year by end of
2018.

Priority Areas for a National Hydrogen Strategy for Turkey22
Turkey’s ambitious industrial strategy has significantly contributed to this drive where low-cost electricity sources (though still more expensive than retail tariffs for households) have helped building electric arc furnaces for steel production and cement kilns across the entire country. (SHURA Enerji Dönüşümü Merkezi, 2019a). Traditionally, an agriculture-based economy, Turkey has also benefited from years of experience in building its food and beverage sector rich in exports of multiple products to neighboring regions and beyond. While its textile sector has lost a share in the global market in recent years at the expense of a growing service-based economy, Turkey still holds numerous manufacturing plants that operate across the full supply chain of garments and other goods oriented mainly for exports (Özkadı, 2020).
The growth success and contribution to value added of Turkey’s strong manufacturing industry through exports need to be carefully assessed. Nearly half of Turkey’s manufacturing industry total final energy consumption is supplied from imported hard coal, natural gas and crude oil products. Industry consumes half of all Turkey’s total net electricity output and the share of electricity in the sector’s total final energy consumption is just above a quarter (see Figure 10). Local renewable energy sources represent on average only a third of the total electricity supply. The remaining two-thirds is mainly supplied from a mix of imported fossil fuels. Turkey’s manufacturing industry is largely energy import dependent based on the current energy mix. Energy costs of the manufacturing industry (estimated at around US$50 billion end of 2018) represent around 12 of the sector’s total value of US$400 billion in the same year (World Bank, n.d.). Reducing import dependence through locally extracted and converted energy resources is crucial for reducing Turkey’s current account deficit defined by a large share of energy imports and for maintaining the sustainability of industry sector’s competitiveness. This is becoming more important in the context of a possible border carbon adjustment under the European Union’s Green Deal where the region accounts for more than half of Turkey’s all exports (SHURA Enerji Dönüşümü Merkezi & Agora Energiewende, 2020).
Figure 10: Breakdown of Turkey’s manufacturing industry final energy consumption and non-energy use by sector, 2018
Construction 3%
Pulp and paper 2%
Wood processing 1%
Transport equipment 1%
Machinery 1%Mining 1%
Furniture 0%
Non-metallic minerals
25%
Others10%
Chemical and
petrochemical11%
Basic metals (incl. BF and CO)
23%
Textile9%
Food and beverage
8%
Source: Enerji ve Tabii Kaynaklar Bakanlığı (n.d.-b)
Industry consumes half of all Turkey’s total net
electricity output and the share of electricity in the
sector’s total final energy consumption is just above a quarter. Local renewable
energy sources represent on average only a third of the
total electricity supply.
Turkey’s manufacturing industry is largely energy import dependent based
on the current energy mix. Energy costs of the manufacturing industry
(estimated at around US$50 billion end of 2018)
represent around 12 of the sector’s total value of
US$400 billion in the same year.

Priority Areas for a National Hydrogen Strategy for Turkey23
2.2. Transportation
Transport sector represented just more than a quarter of Turkey’s total final energy consumption in 2016. Sector’s energy demand has the second least share in Turkey’s total energy demand just above the agriculture sector. The sector’s energy mix, which is predominantly based on fossil fuel: oil products represent more than 99% of the total fuel demand and there is a very small contribution from natural gas. Electricity’s share is 0.4% and renewables represent a negligible share less than 0.1% of the total energy mix (a mix of ethanol and biodiesel). This makes transportation as the single largest user of oil in Turkey.
The share of road vehicles in total passenger transport has reached 90%. Majority of the remaining 10% was in aviation, the transport mode that is growing the fastest in Turkey. Similarly, around 90% of all freight transport was carried by road vehicles. The remaining 10% was halved between railways and marine transport (Ulaştırma Bakanlığı, 2015).
Road transport represents more than 90% of all energy demand in Turkey. This includes passenger transport by cars, two-wheelers (like motorcycles, scooters etc), minibuses and buses, and freight transport by trucks, light commercial vehicles etc. Another 8% of the total energy demand is split between aviation, navigation, railways and pipeline transport. The demand for energy in the transport sector is growing rapidly with increasing per capita income levels and growing population.
The developments in the passenger car segment is striking. Currently, there are about 12.5 million passenger vehicles in Turkey that are on the road. This compares with the 22.7 million road vehicles that are on the road in total with 3.7 million small trucks, 3.2 million motorcycles and 1.9 million tractors following passenger vehicles. The passenger vehicle ownership rate has reached 154 out of 1,000 people. This is a low level when put in comparison with other countries of the OECD like Germany and the United States, however, ownership rates are rapidly increasing with passenger cars representing 6 out of the 10 vehicles sold in Turkey.
Passenger vehicles in Turkey compromise the use of three types of fuels: gasoline, diesel and liquefied petroleum gas (LPG). EVs have an exceedingly small share in the total stock from a total of less than 2,000 vehicles (including plug-in and battery EVs) but their share in total car sales is growing.
There are growing concerns related to the environmental impacts of the booming vehicle use in Turkey. Notably much of these emissions occur in urban areas with high traffic congestion, resulting in adverse impacts on human health.
2.3. Buildings
Turkey has a high rate of urbanization approaching a growth rate of 2% per year. The fast growth of the building stock is marked by new construction rates often in excess of 4%. The construction sector is one of the most important drivers of Turkish economy, contributing 6.6% of the real gross domestic product growth. There are about 9.1 million buildings and 23 million dwellings in Turkey. On an average year, 100,000 new buildings are added to the building stock in Turkey. Their combined energy use, including those of residential, commercial, and public buildings, was responsible
Transport sector represented just more than
a quarter of Turkey’s total final energy consumption
in 2016. Sector’s energy demand has the second
least share in Turkey’s total energy demand just above the agriculture sector. The sector’s energy mix, which
is predominantly based on fossil fuel: oil products represent more than 99% of the total fuel demand and there is a very small
contribution from natural gas.
24 Priority Areas for a National Hydrogen Strategy for Turkey
for around one-third of the country’s total final energy consumption in 2015. In this context, given the rapid increase in the sector’s energy demand averaging 4.4% per year in recent years effectively rendered the building sector as one of the largest energy users in Turkey.
The residential sector’s energy demand represents just over half of the entire building sector’s total final energy consumption. Public and commercial buildings account for the rest. However, available statistics do not provide sufficient data to allow a further breakdown of this total. Turkey’s building stock is characterized by the prominence of rather new dwellings, often built after 1980. Around three-quarters of buildings were built between 1980 and 2016; and of that volume, around 40% were built after 2000 (SHURA Enerji Dönüşümü Merkezi, 2020a).
Space and water heating lead to more than half of all buildings’ energy demand in Turkey. This is also the area where one of the highest energy efficiency improvement potentials exists. Household appliances account for the largest share of electricity demand. Cooling’s (air conditioning) share remains low compared to developed countries with similar climate, such as the United States, with the main reason being relatively lower per capita income levels bringing about a currently lower penetration rate of air-conditioning units. But it is expected to be one of the fastest growing energy consuming segments with the increasing purchasing power of the population.
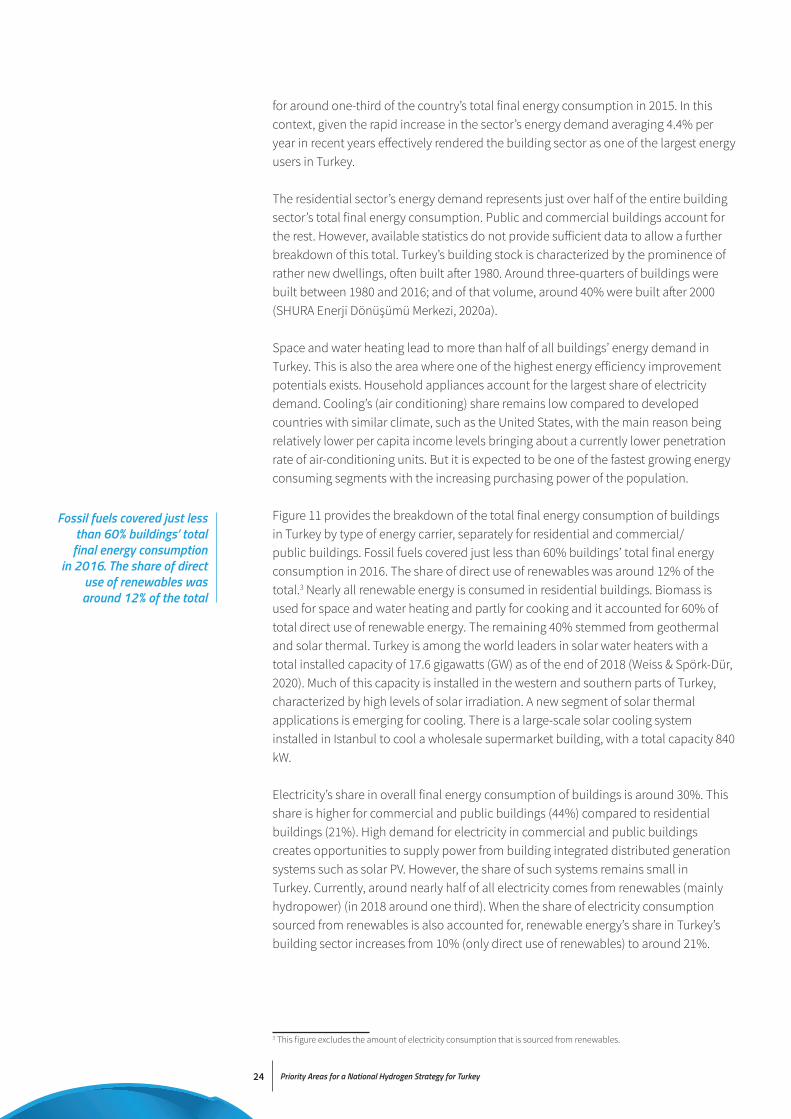
Figure 11 provides the breakdown of the total final energy consumption of buildings in Turkey by type of energy carrier, separately for residential and commercial/public buildings. Fossil fuels covered just less than 60% buildings’ total final energy consumption in 2016. The share of direct use of renewables was around 12% of the total.3 Nearly all renewable energy is consumed in residential buildings. Biomass is used for space and water heating and partly for cooking and it accounted for 60% of total direct use of renewable energy. The remaining 40% stemmed from geothermal and solar thermal. Turkey is among the world leaders in solar water heaters with a total installed capacity of 17.6 gigawatts (GW) as of the end of 2018 (Weiss & Spörk-Dür, 2020). Much of this capacity is installed in the western and southern parts of Turkey, characterized by high levels of solar irradiation. A new segment of solar thermal applications is emerging for cooling. There is a large-scale solar cooling system installed in Istanbul to cool a wholesale supermarket building, with a total capacity 840 kW.
Electricity’s share in overall final energy consumption of buildings is around 30%. This share is higher for commercial and public buildings (44%) compared to residential buildings (21%). High demand for electricity in commercial and public buildings creates opportunities to supply power from building integrated distributed generation systems such as solar PV. However, the share of such systems remains small in Turkey. Currently, around nearly half of all electricity comes from renewables (mainly hydropower) (in 2018 around one third). When the share of electricity consumption sourced from renewables is also accounted for, renewable energy’s share in Turkey’s building sector increases from 10% (only direct use of renewables) to around 21%.
3 This figure excludes the amount of electricity consumption that is sourced from renewables.
Fossil fuels covered just less than 60% buildings’ total
final energy consumption in 2016. The share of direct
use of renewables was around 12% of the total

25 Priority Areas for a National Hydrogen Strategy for Turkey
Natural gas is the dominant fuel for Turkey’s buildings. On average, annually 1,000 m3 of gas is consumed per household in Turkey. Virtually the whole gas supply in Turkey is imported, with domestic production representing less than 1% of the total supply. Gas demand in buildings is largely correlated with the annual changes in ambient temperature. For instance, in the first four months of 2017, temperature levels were below the expected average (around 5oC lower). This resulted in an increase of around 14.5% in total gas demand compared to the same period of 2016. Given Turkey’s exceptionally diverse weather characteristics, with hot summers and cold winters that result in a wide range of climate zones, consumption in the eastern parts of Turkey is around 50% higher than the national average. These temperature differences highlight the need to consider various climate zones and adjust to seasonal extremes in terms of temperatures all the while benchmarking annual building energy consumption rates.
The buildings’ demand for gas accounts for the largest share in gas consumption with a 33% share. This share is likely to increase as access to natural gas supply is on the rise throughout Turkey. At the same time, the share of gas in electricity generation declines since the general trend is one replacing gas with local energy resources like renewables and lignite. As of the end of 2019, in Turkey, more than 53 million people were actively using natural gas. Gas use share for heating in total gas demand of Turkey is increasing rapidly at the expense of its use for electricity generation (Saygın & Şanlı, 2020).
Coal is also widely used in Turkey. As of the end of 2015, 8.2 million tons of coal equivalent (Mtce) was consumed for heating. Two-thirds of this figure was used for meeting the heating demand of commercial and public service buildings, and it was predominantly sourced from hard coal, more than 95% of which is imported. The remaining one-third was used in the residential sector, in the form of either hard coal
Figure 11: Breakdown of total final energy consumption of buildings in Turkey, 2018
% 100
% 90
% 80
% 70
% 60
% 50
% 40
% 30
% 20
% 10
% 0Residential Other Total
Coal Petroleum products Natural gas Biomass and waste Geothermal Solar Electricity
Source: Enerji ve Tabii Kaynaklar Bakanlığı (n.d.-a)
26 Priority Areas for a National Hydrogen Strategy for Turkey
or lignite. Of the total 70 million tons (Mt) of lignite supplied in Turkey in 2015, 5% was used to meet the demand for heating in buildings. The rest was used by power plants and for industrial heating. Lignite has a much lower calorific value than hard coal, by a factor of two to three times, and produces significantly higher emissions of CO2 and air pollutants per kWh of energy generated. However, lignite is cheaper since it is typically locally mined and is available across Turkey’s entire geography. Hard coal has a higher calorific value than lignite and its combustion is more energy efficient (SHURA Enerji Dönüşümü Merkezi & Buildings Performance Institute Europe, 2019). Oil’s share in Turkey’s buildings’ total final energy consumption is much lower in comparison, accounting for merely 3% of the overall figure. Nowadays it is only rarely used as a heating and cooking fuel where there are no other alternatives, such as connection to the gas networks.
2.4. Hard to decarbonize sectors
Turkey is abundant in local renewable energy resources of solar, wind and geothermal energy. Hydro resources are largely utilized by the power sector. Biomass and waste potential are untapped whilst the potential is small compared to Turkey’s total energy demand. So far power sector was at the core of Turkey’s renewable energy strategies with the aim to increase local share of resources and reduce import dependency. In recent years, thanks to hydropower (including large hydropower), Turkey’s share of renewables in total electricity output remained at around one third. 2019 was an exceptionally rainy year. Combined with low electricity demand, renewables’ share represented around 44% of the total output and this share has grown to more than 50% in the first half of 2020. End of 2019, hydropower accounted for 30% of all power output followed by a 10% share from variable resources of wind and solar, and 4% from geothermal and biogas. In 2020, wind and solar share was around 15%.
Another strategic local resource is lignite that is spread across nearly the entire country. The calorific value of Turkey’s lignite ranges from as low as 1000 kilocalories (kcal) to 4200 kcal per kg, however, the energy quality of most resources is closer to the lower end of this range. For example, India’s least quality lignite, one of the world’s poorest, has calorific value twice as much as these resources. Power plants that operate with such lignite quality are inefficient (between 30% and 35% efficiency) and they require massive logistics. If Turkey would have sufficient hard coal reserves, three times less road transport would be needed. In addition, lignite-fired power plants require significant investments as opposed to smaller renewable energy plants. At the end of August 2020, Turkey has announced the discovery of natural gas reserves with a total potential of more than 320 billion m3. This is nearly 100 times more than the current proven gas reserves of Turkey. The plan is to deliver this gas to end users by 2023 and it would be sufficient to supply Turkey’s total gas demand for around 7 years (Saygın & Şanlı, 2020).
Currently Turkey’s power system is characterized by an overcapacity of supply. This is explained by the significant generator capacity investments during the liberalization period where investors assumed a continuation of rapid growth in energy demand as well as an increase in electricity prices which did not materialize to the extent expected. The shrinking economy, and the subsequent decline in energy demand due to Turkey’s financial turmoil have hampered investments, changed debt structures, and challenged investors to maintain a business case for their plants. This effect has been pronounced in the CoVid-19 period where some gas-fired generators have been
In 2020, wind and solar share was around 15%.

27 Priority Areas for a National Hydrogen Strategy for Turkey
pushed out of the generation mix along with imported coal-based generators. At the current state of limited financing and debt structure, investing in large-scale coal-fired power plants is more challenging. This is further pronounced by an increasing number of global financiers who refuse to lend money to such investments with the international climate mitigation debate gaining an unprecedented focus by countries at the fifth year of the Paris Climate Agreement in 2020. These mark a heavy question on Turkey’s energy strategy to provide an immediate and affordable solution to its growing electricity demand. A study carried out by the SHURA Energy Transition Center in 2018 shows that Turkey’s transmission grid can accommodate up to 20% wind and solar that is double the current share without any additional grid investments and operational flexibility needs (SHURA Enerji Dönüşümü Merkezi, 2020b). A higher share of 30% is possible but that requires introducing flexibility measures such as storage and demand response. Turkey’s strategy to improve system flexibility focuses on the local manufacture of battery storage technologies and for several years demand response and pumped hydro are on the energy policy agenda.
Compared to the case of the power sector, the potential of renewable energy was largely overlooked by Turkey’s end-use sectors (Saygın & Şanlı, 2020):
• Only a mere 2% share of the manufacturing industry’s total final consumption is from renewables. Indeed, industry is a complex sector with intertwined processes that run at varying process heat temperatures (ranging from low-temperature process heat for hot water generation to more than 1000oC for production of steel, cement or ceramics) and steam pressures. Years of operational experience has helped optimizing and integrating the material and energy flows of production processes, thereby improving their efficiency. These make it challenging for traditional renewables as they can only deliver steam at low and medium temperature (less than 250oC) with biomass being an exception (to and above 400oC) and costly process modifications are needed for their integration to conventional processes unless greenfield investments are considered. Although renewable energy in industry has not yet received the same attention as in other energy sectors and despite its challenges, it is technically and economically possible to substitute a quarter of the total global industrial fossil energy and feedstock use with biomass and attain higher shares with solar thermal technologies. Today only certain applications of renewable energy are cost effective such as low temperature process heat generation with solar water heaters or steam production from low-cost biomass residues. Some food production sub-sectors like dairy industry and textile processing industries are typical sectors where these technologies could be applied. Renewable energy technologies can provide practical and cost-effective alternatives for process heat generation and as a renewable carbon source for the production of chemical and plastics.
• As mentioned above, transport sector is predominantly relying on petroleum products that are utilized in traditional internal combustion engines. An immediate alternative to transport is electric vehicles. A study by the SHURA Energy Transition Center released in 2019 shows that 10% of the total passenger vehicle stock can be replaced by electric vehicles by 2030 without any major impacts on the distribution grid operations (SHURA Enerji Dönüşümü Merkezi, 2019b). However, the major transport modes that are growing are road freight and non-road transport where availability of commercial low-carbon solutions are limited, either because technology is immature, or it is too expensive.
Compared to the case of the power sector, the potential
of renewable energy was largely overlooked by
Turkey’s end-use sectors.

Priority Areas for a National Hydrogen Strategy for Turkey28
• To transform buildings energy demand energy efficiency will play the first role. Plenty of low-cost technologies are available that can help to provide the same service of comfort in buildings whilst saving energy, along with options to manage energy demand at the consumer side with limited additional investments. In addition, low temperature space and water heating can be provided with different renewable energy technologies including solar thermal, geothermal and heat pumps (provided that the electricity needed is supplied from renewable energy resources). However, gas still represents the majority of Turkey’s buildings energy demand. Infrastructure is already in place at the transmission and distribution level and there is no readily available solution for substitution. Biomethane and biogas injection are commercial alternatives, but Turkey’s biomass resource availability is limited.
In view of this situation, several sectors emerge with hurdles for a complete transformation with low-carbon technology options. Table 2 provides a summary of these sectors’ total energy consumption and CO2 emissions. They represent more than 60% of Turkey’s total final energy consumption and around 43% of the country’s energy and process related CO2 emissions.
Total final energy consumption (Mtoe/year)
Total CO2 emissions (Mt CO2/year)
Iron steel 5,2 19.1
Chemical and petrochemical 1,7 4,3
Plastics 2,0 6,3
Cement 6,4 21,3
Road freight 7,3 23,6
Aviation 1,2 4,0
Maritime 0,4 1,3
Natural Gas Sector 41,2 96,5
Electricity 15,0 35,2
Heating 25 59,1
Pipelines 0,3 0,7
Total of sectors ~65 ~176
Total 108 419
Table 2: Hard to transform sectors and their contribution to Turkey’s total final energy consumption and CO2 emissions, 2018
Yeşil Ekonomi (2020)
They represent more than 60% of Turkey’s total final energy consumption and
around 43% of the country’s energy and process related
CO2 emissions.
Priority Areas for a National Hydrogen Strategy for Turkey29
2.5. Opportunities for green hydrogen
Defining an optimal transformation strategy for all end-use sectors across Turkey would be challenging. So, it is important to understand the commonalities and individual characteristics of each one of these sectors. A cross-cutting solution that emerge for these areas is green hydrogen.
One strategy that has received some attention in recent years to transform manufacturing industry is the conversion of the existing thermal process to electricity-based alternatives coupled with renewable power generation. Renewable electricity can also be used to generate hydrogen that can be used to replace fossil fuels. New processes could emerge that are based on hydrogen such as DRI and these could be coupled with the existing electric arc furnace lines in Turkey for green steel production. Electricity-based synthetic fuels can also be used as a feedstock for chemicals and plastics production such as hydrogen, methane/methanol and naphtha. Likewise, green hydrogen provides a viable alternative to diesel use for trucks as well as to blend with gas while maintaining the existing gas infrastructure. The following sections outline the opportunities by sector.
Industrial heatThe various processes and high integration of production plants make decarbonizing industrial heat complex as heat quality requirements and applications vary, changes in existing plants are capital-intensive, and low-carbon alternatives might be related to the local resource availability. Industrial heat is still highly dependent on fossil fuels, and especially high-temperature applications are relying on coal and natural gas. In many cases, the fossil energy carrier is fuel and feedstock.
For example, coal is needed for the reduction in blast furnaces to produce pig iron from iron ore and as a fuel at the same time. Especially in the iron and steel industry, hydrogen can replace coal as fuel and feedstock. Natural gas is still used as a feedstock for the steam-methane reforming process to produce syngas (i.e. hydrogen production), mainly for ammonia production. Aluminum and other non-ferrous metals require vast amounts of electricity for electric arc furnaces and temperatures about 1,600°C. The cement industry requires temperatures up to 1,450°C, while pulp production needs around 170°C for the sulphate process.
Low-carbon alternatives for industrial heat must be identified and implemented into the various industries. Those alternatives are related to the demand of each industrial sectors (heat temperature levels, heat demand). The integration of non-dispatchable renewables (e.g., solar thermal) is limited by high-temperature levels and capacity factors of industry sub-sectors. Some low-carbon options are available, but none of them are used at scale yet. Low-carbon options for industrial heat are hydrogen, biomass (and biofuels), electrification, carbon capture, utilization, and storage, solar thermal, and in some cases, advanced nuclear thermal.
Earlier analysis has shown that industrial energy efficiency improvements could result in energy savings of up to 25% compared to today’s level and reductions in CO2 emissions on a similar order of magnitude. Improving energy efficiency is priority and it will be at the core of making all new industrial installations low carbon after 2020. Yet energy efficiency improvements have not gone beyond business as usual rates of around 1% per year.
Defining an optimal transformation strategy
for all end-use sectors across Turkey would
be challenging. So, it is important to understand
the commonalities and individual characteristics of each one of these sectors. A
cross-cutting solution that emerge for these areas is
green hydrogen.
New processes could emerge that are based on hydrogen such as DRI and
these could be coupled with the existing electric
arc furnace lines in Turkey for green steel production. Electricity-based synthetic
fuels can also be used as a feedstock for chemicals and
plastics production such as hydrogen, methane/methanol and naphtha.

30 Priority Areas for a National Hydrogen Strategy for Turkey
While renewables and energy efficiency could make significant contribution to industrial emission reductions, their joint potential is not enough to decarbonize the industry sector entirely. CO2 capture and storage and its use can be deployed for manufacturing of iron, ammonia, cement clinker and ethylene oxide production. Especially for industries with high process emissions such as cement clinker production this option can play an important role. Up to one-third of all industrial CO2 emissions could be mitigated by carbon capture technologies. However, these technologies would reduce energy savings from improving energy efficiency since they require additional energy to run their sub-processes.
Technologies for sustainable and low-carbon heat provision are highly dependent on the industry sub-sector, the demand size, and the available regional infrastructure. However, existing infrastructure limits opportunities. Furthermore, the applicability of renewable heat sources often depends on geographical location. This regional dependency is particularly the case for solar thermal and geothermal heat. Which low-carbon technology is viable and feasible is not only dependent on the industry type but also on the industrial plants itself (e.g., equipment age). Therefore, it is difficult to say in general which technology might be the best. Furthermore, decarbonization will require changes in the existing facilities, which can be costly. Some industries like the iron and steel industry are highly integrated, which means changes in the process heat provision systems affect all processes in the facility. In those industries, waste heat and waste material are often used or sold, like plaster of the iron and steel industry.
Industry sectors are common across several characteristics: they produce bulk materials, operate at high temperature process energy, represented by few plants (around forty electric arc furnaces, similar number of cement kilns, three integrated steel plants, less than 10 refineries and large-scale chemical production complexes). Steel production is largely electrified with the traditional electric arc furnace technology. Cement plants use mainly new and efficient rotary kiln technologies, but cement grinding remains electricity intensive. Chemical and petrochemical industry of Turkey is rather small with a single steam cracker in operation but several fertilizer production and conversion of intermediates to plastics is scattered across the country with smaller size plants using less energy per production plant.
Green hydrogen can solve that issue. It can be used to store renewable electricity and meet the high capacity factor requirements of factories in a circular economy. Moreover, hydrogen can meet temperature level needs, among all industries. Hydrogen combustion can be retrofitted in existing infrastructure. However, hydrogen from renewables requires high investment cost for infrastructure and production, while having a relatively low round-trip efficiency. Moreover, the low round-trip efficiency and the resulting electricity demand are emerging issues on a large scale, which needs to be addressed. Anyway, green hydrogen from electrolysis requires 1.4 times and more electricity from renewables than direct electrification. Further, green hydrogen provision will require dedicated power capacity expansion.

31 Priority Areas for a National Hydrogen Strategy for Turkey
TransportInternal combustion engines of long-distance trucks that consume diesel are huge in power size and generally much less efficient compared to passenger vehicles. Current deployment of electrification technologies offers very few opportunities to replace the traditional engine system. They are costly and require significant road infrastructure for charging.
There is no single and universal solution for decarbonizing truck transportation, but battery-electric and fuel-cell electric trucks can be part of that solution. Unlike electrification of light duty vehicles, the electrification of heavy-duty vehicles depends on factors such as payload, frequency of long-distance travel, charging/fueling time, and total cost of ownership. The trucking industry has focused on using existing diesel engines with alternative fuels, both bio- and e-fuels. Unfortunately, while both alternatives can be carbon-neutral, their development and use cause different challenges. The diesel engine - even with alternative fuels - cannot be the driver of eliminating greenhouse gas emissions from the transportation sector.
While numerous BEVs are already available or in development in 2019, fuel cell electric vehicles (FCEV) still have a niche existence in the present development. But, several automotive manufacturers like Toyota, Hyundai, Daimler, Nikola Motors, and others are working on fuel cell electric trucks (FCET). In 2019, the current FCET are in development and not available on the market yet. Nikola Motors announced a class-8 truck called Nikola One, with six electric traction motors to a combined power of 750 kW. For the power supply, it has a 320- kWh battery and a 300 kW fuel cell. The fuel cell is supposed to consume 4.6 kg hydrogen per 100 kilometers (km) from tanks with 100 kg hydrogen capacity, which provides a range of up to 1,900 km. Furthermore, Streetscooter is working in cooperation with DHL on a “last-mile” delivery truck, with a gross weight of 4.2 tons and a capacity of 800 kg. Toyota and Kenworth are developing in a joint-venture a class-8 truck, based on the Kenworth T680 with two Toyota Mirai fuel cells, with a power of 114 kW each. The specifications of those trucks are shown in Table 3.
Table 3: Specifications of announced fuel cell electric trucks
Source: Boenninghausen (2019), Nikola Motors (2019), O’Dell (2018)
Manufacturer Commercial name
Motor power (kW)
Maximum weight (t)
Battery capacity
(kWh)
Range (km)
Energy consumption
(kg H2/km)
Fuel Cell (kW)
Nikola Motors One 750 36 320 1900 4,6 300
Streetscooter H2 Panel van 122 4,2 40 500 1,2 26
Toyota/Kenworth Beta (T680) 492 36 12 480 - 228
There is no single and universal solution for
decarbonizing truck transportation, but battery-electric and fuel-cell electric
trucks can be part of that solution.
32 Priority Areas for a National Hydrogen Strategy for Turkey
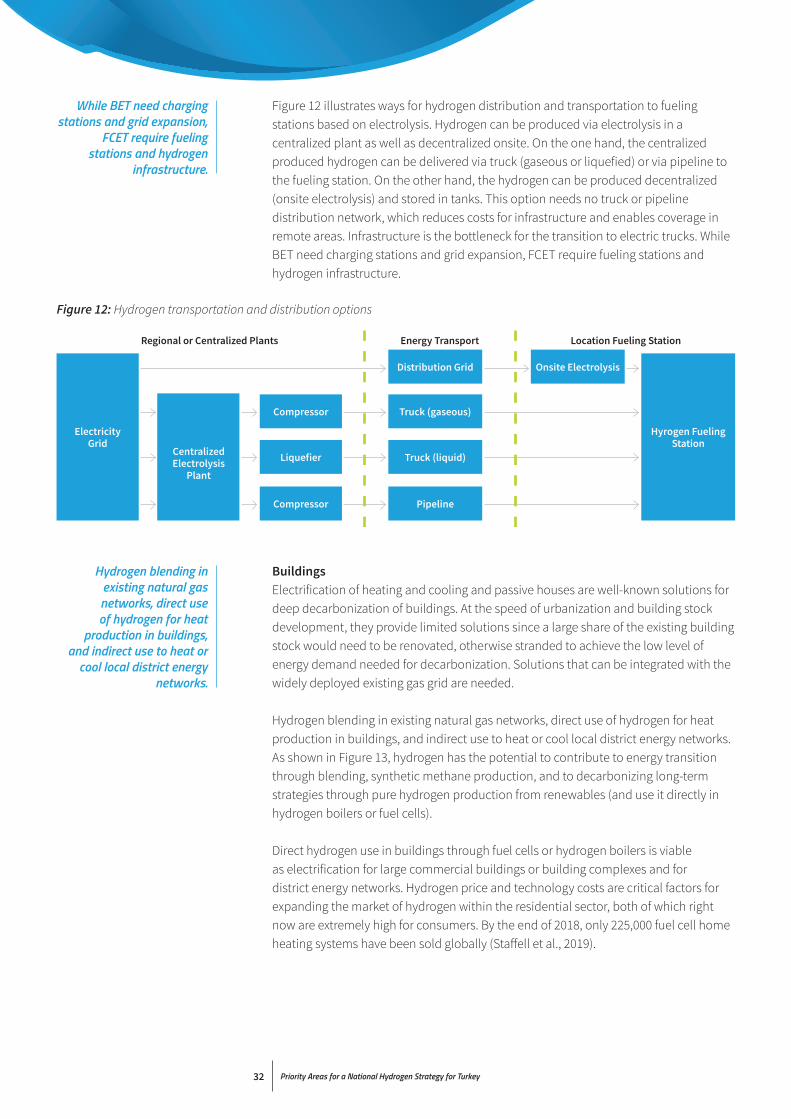
Figure 12 illustrates ways for hydrogen distribution and transportation to fueling stations based on electrolysis. Hydrogen can be produced via electrolysis in a centralized plant as well as decentralized onsite. On the one hand, the centralized produced hydrogen can be delivered via truck (gaseous or liquefied) or via pipeline to the fueling station. On the other hand, the hydrogen can be produced decentralized (onsite electrolysis) and stored in tanks. This option needs no truck or pipeline distribution network, which reduces costs for infrastructure and enables coverage in remote areas. Infrastructure is the bottleneck for the transition to electric trucks. While BET need charging stations and grid expansion, FCET require fueling stations and hydrogen infrastructure.
BuildingsElectrification of heating and cooling and passive houses are well-known solutions for deep decarbonization of buildings. At the speed of urbanization and building stock development, they provide limited solutions since a large share of the existing building stock would need to be renovated, otherwise stranded to achieve the low level of energy demand needed for decarbonization. Solutions that can be integrated with the widely deployed existing gas grid are needed.
Hydrogen blending in existing natural gas networks, direct use of hydrogen for heat production in buildings, and indirect use to heat or cool local district energy networks. As shown in Figure 13, hydrogen has the potential to contribute to energy transition through blending, synthetic methane production, and to decarbonizing long-term strategies through pure hydrogen production from renewables (and use it directly in hydrogen boilers or fuel cells).
Direct hydrogen use in buildings through fuel cells or hydrogen boilers is viable as electrification for large commercial buildings or building complexes and for district energy networks. Hydrogen price and technology costs are critical factors for expanding the market of hydrogen within the residential sector, both of which right now are extremely high for consumers. By the end of 2018, only 225,000 fuel cell home heating systems have been sold globally (Staffell et al., 2019).
Figure 12: Hydrogen transportation and distribution options
Regional or Centralized Plants Energy Transport Location Fueling Station
ElectricityGrid
Hyrogen Fueling Station
Centralized Electrolysis
Plant
Truck (liquid)
Pipeline
Truck (gaseous)
Distribution Grid Onsite Electrolysis
Liquefier
Compressor
Compressor
While BET need charging stations and grid expansion,
FCET require fueling stations and hydrogen
infrastructure.
Hydrogen blending in existing natural gas networks, direct use of hydrogen for heat
production in buildings, and indirect use to heat or
cool local district energy networks.
33 Priority Areas for a National Hydrogen Strategy for Turkey
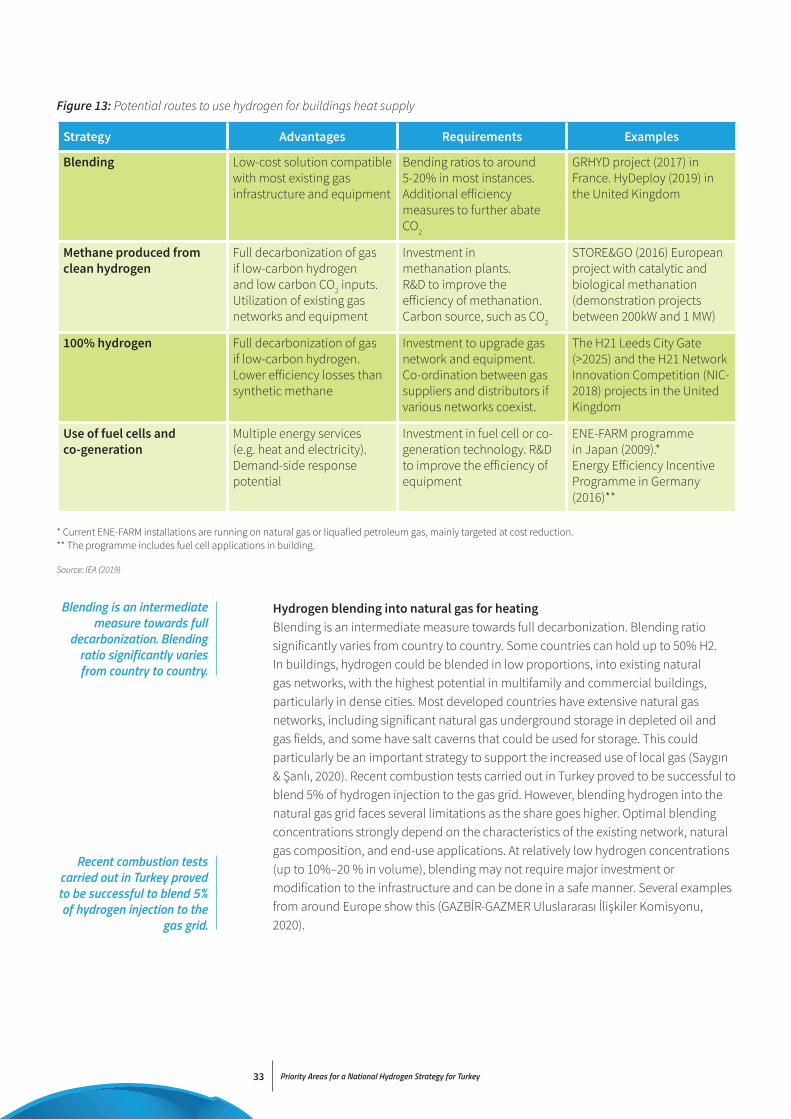
Hydrogen blending into natural gas for heatingBlending is an intermediate measure towards full decarbonization. Blending ratio significantly varies from country to country. Some countries can hold up to 50% H2. In buildings, hydrogen could be blended in low proportions, into existing natural gas networks, with the highest potential in multifamily and commercial buildings, particularly in dense cities. Most developed countries have extensive natural gas networks, including significant natural gas underground storage in depleted oil and gas fields, and some have salt caverns that could be used for storage. This could particularly be an important strategy to support the increased use of local gas (Saygın & Şanlı, 2020). Recent combustion tests carried out in Turkey proved to be successful to blend 5% of hydrogen injection to the gas grid. However, blending hydrogen into the natural gas grid faces several limitations as the share goes higher. Optimal blending concentrations strongly depend on the characteristics of the existing network, natural gas composition, and end-use applications. At relatively low hydrogen concentrations (up to 10%–20 % in volume), blending may not require major investment or modification to the infrastructure and can be done in a safe manner. Several examples from around Europe show this (GAZBİR-GAZMER Uluslararası İlişkiler Komisyonu, 2020).
* Current ENE-FARM installations are running on natural gas or liquafied petroleum gas, mainly targeted at cost reduction.** The programme includes fuel cell applications in building.
Figure 13: Potential routes to use hydrogen for buildings heat supply
Strategy Advantages Requirements Examples
Blending Low-cost solution compatible with most existing gas infrastructure and equipment
Bending ratios to around 5-20% in most instances. Additional efficiency measures to further abate CO2
GRHYD project (2017) in France. HyDeploy (2019) in the United Kingdom
Methane produced from clean hydrogen
Full decarbonization of gas if low-carbon hydrogen and low carbon CO2 inputs. Utilization of existing gas networks and equipment
Investment in methanation plants. R&D to improve the efficiency of methanation. Carbon source, such as CO2
STORE&GO (2016) European project with catalytic and biological methanation (demonstration projects between 200kW and 1 MW)
100% hydrogen Full decarbonization of gas if low-carbon hydrogen. Lower efficiency losses than synthetic methane
Investment to upgrade gas network and equipment. Co-ordination between gas suppliers and distributors if various networks coexist.
The H21 Leeds City Gate (>2025) and the H21 Network Innovation Competition (NIC-2018) projects in the United Kingdom
Use of fuel cells and co-generation
Multiple energy services (e.g. heat and electricity). Demand-side response potential
Investment in fuel cell or co-generation technology. R&D to improve the efficiency of equipment
ENE-FARM programme in Japan (2009).* Energy Efficiency Incentive Programme in Germany (2016)**
Source: IEA (2019)
Blending is an intermediate measure towards full
decarbonization. Blending ratio significantly varies from country to country.
Recent combustion tests carried out in Turkey proved to be successful to blend 5% of hydrogen injection to the
gas grid.

Priority Areas for a National Hydrogen Strategy for Turkey34
As Figure 14 shows, the most critical applications with respect to blending shares are gas turbines, pore storage, compressor stations, and compressed natural gas tanks (which currently restrict acceptable blend shares to 2% by volume without any further adjustment). Gas flow detectors, quantity transformers, and end-use meters, as well as most gas appliances installed in the residential sector, may need adjustment or modification. Blending concentrations greater than 20% hydrogen by volume would require significant changes to existing infrastructure and end-use applications.
Figure 14: Hydrogen tolerance of gas infrastructure components
0
10
20
30
40
50
60
70
H2 in
Nat
ural
Gas
(Vol
. - %
)
Tran
smis
sion
pip
elin
es
Gas
tur
bine
s
Com
pres
sure
Sta
tions
Cav
ern
Poro
us
Oth
er
Surf
ace
and
com
plet
ion
tech
nolo
gies
Gas
met
ers
Volu
me
corr
ecto
rs
Proc
ess
gas
chro
mat
ogra
phs
Gas
pre
ssur
e re
g.
Odo
risat
ion
syst
em (
inje
ctio
n no
zzle
)
Stee
l pip
elin
es
Plas
tic p
ipel
ines
Gas
kets
and
mem
bran
es
Join
ts
Gas
flow
mon
itor
Arm
atur
es
Dom
estic
inst
alla
tion
Vehi
cles
- e
ngin
es
CN
G -
tan
ks
Atm
osph
eric
gas
bur
ner
Forc
ed a
ir-bu
rner
s
Fuel
cel
ls
Stirl
ing
Gas
sto
ves
Cal
orifi
c va
lue
burn
ers
Com
bine
d he
at a
nd p
ower
uni
t
H2 admixture harmless After technical check feasible Research needed
TransportMetering &
pressure regulation Distribution UtilisationStorage
Source: IRENA (2018)
Blending concentrations greater than 20% hydrogen
by volume would require significant changes to
existing infrastructure and end-use applications.
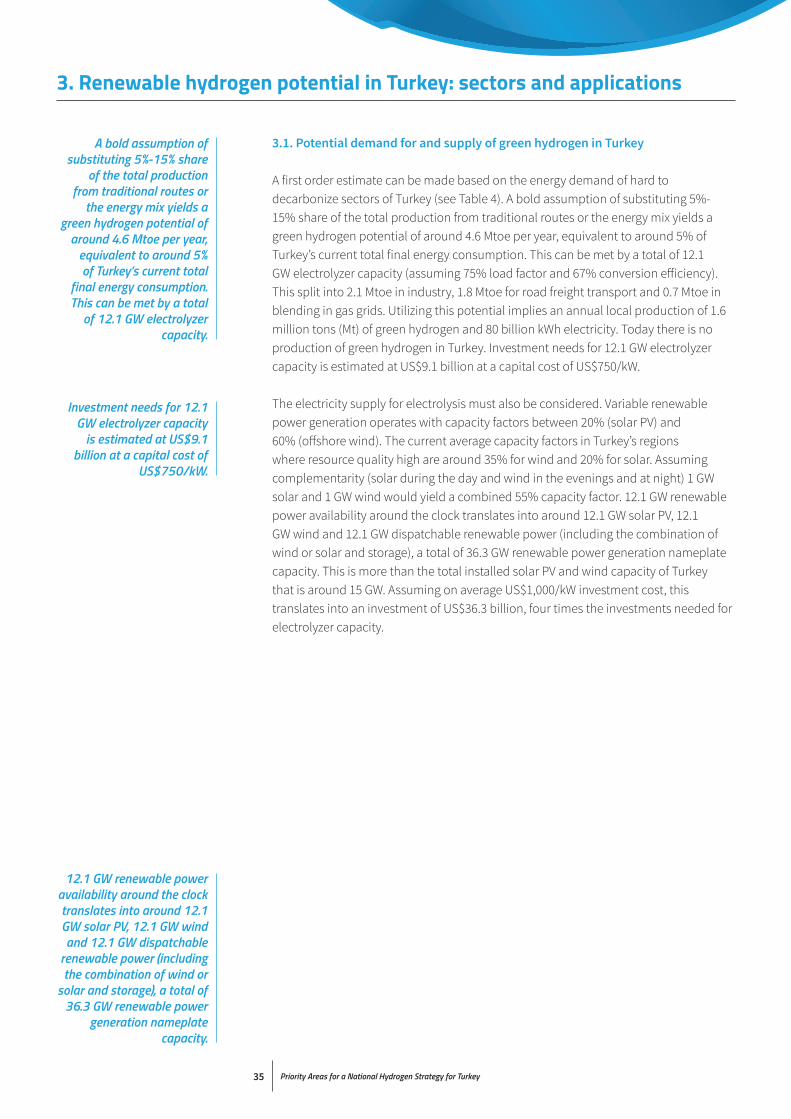
Priority Areas for a National Hydrogen Strategy for Turkey35
3.1. Potential demand for and supply of green hydrogen in Turkey
A first order estimate can be made based on the energy demand of hard to decarbonize sectors of Turkey (see Table 4). A bold assumption of substituting 5%-15% share of the total production from traditional routes or the energy mix yields a green hydrogen potential of around 4.6 Mtoe per year, equivalent to around 5% of Turkey’s current total final energy consumption. This can be met by a total of 12.1 GW electrolyzer capacity (assuming 75% load factor and 67% conversion efficiency). This split into 2.1 Mtoe in industry, 1.8 Mtoe for road freight transport and 0.7 Mtoe in blending in gas grids. Utilizing this potential implies an annual local production of 1.6 million tons (Mt) of green hydrogen and 80 billion kWh electricity. Today there is no production of green hydrogen in Turkey. Investment needs for 12.1 GW electrolyzer capacity is estimated at US$9.1 billion at a capital cost of US$750/kW.
The electricity supply for electrolysis must also be considered. Variable renewable power generation operates with capacity factors between 20% (solar PV) and 60% (offshore wind). The current average capacity factors in Turkey’s regions where resource quality high are around 35% for wind and 20% for solar. Assuming complementarity (solar during the day and wind in the evenings and at night) 1 GW solar and 1 GW wind would yield a combined 55% capacity factor. 12.1 GW renewable power availability around the clock translates into around 12.1 GW solar PV, 12.1 GW wind and 12.1 GW dispatchable renewable power (including the combination of wind or solar and storage), a total of 36.3 GW renewable power generation nameplate capacity. This is more than the total installed solar PV and wind capacity of Turkey that is around 15 GW. Assuming on average US$1,000/kW investment cost, this translates into an investment of US$36.3 billion, four times the investments needed for electrolyzer capacity.
3. Renewable hydrogen potential in Turkey: sectors and applications
A bold assumption of substituting 5%-15% share
of the total production from traditional routes or
the energy mix yields a green hydrogen potential of
around 4.6 Mtoe per year, equivalent to around 5% of Turkey’s current total
final energy consumption. This can be met by a total
of 12.1 GW electrolyzer capacity.
12.1 GW renewable power availability around the clock translates into around 12.1 GW solar PV, 12.1 GW wind and 12.1 GW dispatchable
renewable power (including the combination of wind or
solar and storage), a total of 36.3 GW renewable power
generation nameplate capacity.
Investment needs for 12.1 GW electrolyzer capacity
is estimated at US$9.1 billion at a capital cost of
US$750/kW.
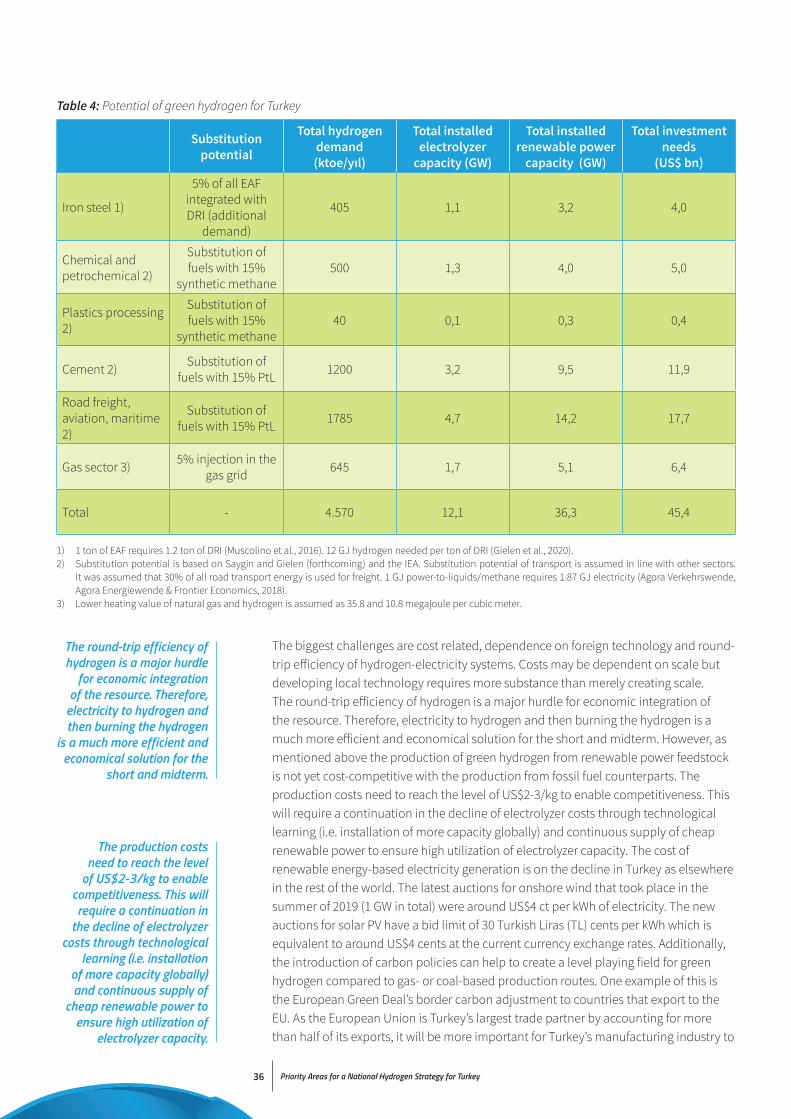
Priority Areas for a National Hydrogen Strategy for Turkey36
The biggest challenges are cost related, dependence on foreign technology and round-trip efficiency of hydrogen-electricity systems. Costs may be dependent on scale but developing local technology requires more substance than merely creating scale. The round-trip efficiency of hydrogen is a major hurdle for economic integration of the resource. Therefore, electricity to hydrogen and then burning the hydrogen is a much more efficient and economical solution for the short and midterm. However, as mentioned above the production of green hydrogen from renewable power feedstock is not yet cost-competitive with the production from fossil fuel counterparts. The production costs need to reach the level of US$2-3/kg to enable competitiveness. This will require a continuation in the decline of electrolyzer costs through technological learning (i.e. installation of more capacity globally) and continuous supply of cheap renewable power to ensure high utilization of electrolyzer capacity. The cost of renewable energy-based electricity generation is on the decline in Turkey as elsewhere in the rest of the world. The latest auctions for onshore wind that took place in the summer of 2019 (1 GW in total) were around US$4 ct per kWh of electricity. The new auctions for solar PV have a bid limit of 30 Turkish Liras (TL) cents per kWh which is equivalent to around US$4 cents at the current currency exchange rates. Additionally, the introduction of carbon policies can help to create a level playing field for green hydrogen compared to gas- or coal-based production routes. One example of this is the European Green Deal’s border carbon adjustment to countries that export to the EU. As the European Union is Turkey’s largest trade partner by accounting for more than half of its exports, it will be more important for Turkey’s manufacturing industry to
Table 4: Potential of green hydrogen for Turkey
Substitution potential
Total hydrogen demand (ktoe/yıl)
Total installed electrolyzer
capacity (GW)
Total installed renewable power
capacity (GW)
Total investment needs
(US$ bn)
Iron steel 1)
5% of all EAF integrated with DRI (additional
demand)
405 1,1 3,2 4,0
Chemical and petrochemical 2)
Substitution of fuels with 15%
synthetic methane 500 1,3 4,0 5,0
Plastics processing 2)
Substitution of fuels with 15%
synthetic methane40 0,1 0,3 0,4
Cement 2) Substitution of fuels with 15% PtL 1200 3,2 9,5 11,9
Road freight, aviation, maritime 2)
Substitution of fuels with 15% PtL 1785 4,7 14,2 17,7
Gas sector 3) 5% injection in the gas grid 645 1,7 5,1 6,4
Total - 4.570 12,1 36,3 45,4
1) 1 ton of EAF requires 1.2 ton of DRI (Muscolino et al., 2016). 12 GJ hydrogen needed per ton of DRI (Gielen et al., 2020).2) Substitution potential is based on Saygin and Gielen (forthcoming) and the IEA. Substitution potential of transport is assumed in line with other sectors.
It was assumed that 30% of all road transport energy is used for freight. 1 GJ power-to-liquids/methane requires 1.87 GJ electricity (Agora Verkehrswende, Agora Energiewende & Frontier Economics, 2018).
3) Lower heating value of natural gas and hydrogen is assumed as 35.8 and 10.8 megajoule per cubic meter.
The round-trip efficiency of hydrogen is a major hurdle
for economic integration of the resource. Therefore,
electricity to hydrogen and then burning the hydrogen
is a much more efficient and economical solution for the
short and midterm.
The production costs need to reach the level
of US$2-3/kg to enable competitiveness. This will require a continuation in
the decline of electrolyzer costs through technological
learning (i.e. installation of more capacity globally) and continuous supply of
cheap renewable power to ensure high utilization of
electrolyzer capacity.

Priority Areas for a National Hydrogen Strategy for Turkey37
decarbonize its production through low carbon alternatives such as green hydrogen to sustain exports to the EU.
There are also sector specific challenges to the utilization of green hydrogen. Injection to gas grid is technically possible with no or minor modifications to around 10%-15% in volume, however, higher levels require additional investments and further R&D. As the share of hydrogen in the gas mix increases the amount of volume that needs to be transported to provide the same energy service also increases because hydrogen’s energy density is much less than for natural gas. This may require additional grid investments as well as changes in the volume and pressure of how hydrogen is introduced to the grid which may impact materials use. While some sources mention there’s experience in managing grids with high hydrogen content from times when city gas was more commonly used, the gas transmission and distribution is more complex and they differ significantly from each other in terms of the choice and specificities of pipeline material, the need for maintaining security, metering of gas flows and the distance in how much gas is transmitted. Therefore, each part of the gas supply chain needs specific measures. Finally, modifications or new end use technologies may be needed to process gas-hydrogen mixtures (GAZBİR-GAZMER Uluslararası İlişkiler Komisyonu, 2020).
Introducing hydrogen-based products to the manufacturing industry of Turkey requires an understanding of the supply chain of how green hydrogen and its derived products like synthetic fuels will be produced. It is also crucial to understand the industry structure. Substituting fossil fuels with green hydrogen based synthetic fuels is straight forward as in principle as heating equipment for combusting such fuels are available and industrial processes require no modifications. In the case of the steel industry, Turkey currently relies on the supply and processing of steel scrap in electric arc furnaces. Green hydrogen-based steel production requires the production of direct reduced iron from iron ore and mixing this with scrap before feeding into the electric arc furnace. While this is a proven technology, the logistic and production infrastructure and trade routes established for processing steel scrap would need to be altered to accommodate its commercialization in Turkey.
A similar issue pertains transportation infrastructure. At the start of 2020, Turkey has set a vision to transform its transport sector with electric vehicles. This means new urban areas will be designated for charging infrastructure expansion and existing pumping stations will replaced with charging stations for electric vehicles. Hydrogen that can be stored and subsequently used in fuel-cell vehicles is being considered by several automobile manufacturers. Hydrogen requires its own infrastructure. This could potentially compete with infrastructure for electric vehicles and could lead to additional investments if not planned well as part of an overall transport sector transformation strategy.
Policy side issues will also need to be addressed. Traditionally Turkish policy makers are more realistic than ambitious. They prioritize known options to unknown or untested solutions. Therefore, the initial strategy seems to lay on natural gas system and mixing hydrogen with methane. This is not unforeseen in Turkish gas history. In Ankara, coal/town gas was used before 1990s and according to experts (Boru Hatları ile Petrol Taşıma Anonim Şirketi, BOTAŞ, ex-DG Gökhan Yardım), during demand deficit times in Ankara like Ramadan dinners, system was fed with hydrogen rich coal gas. The official position to prioritize natural gas blending over other options is an incomplete
As the European Union is Turkey’s largest trade
partner by accounting for more than half of its exports, it will be more important for Turkey’s
manufacturing industry to decarbonize its production
through low carbon alternatives such as green
hydrogen to sustain exports to the EU.

Priority Areas for a National Hydrogen Strategy for Turkey38
but viable strategy, a good starting point. The memories of overambitious hydrogen strategy turning sour has impacted policy framework. So, a step-by-step private sector-based strategy gives the message, creates the economic volume and initiates a failsafe strategy. In addition, blending 5% of natural gas with hydrogen may save Turkey around US$0.6 billion/year.
Domestic coal utilization for hydrogen generation is another important theme. Turkish Coal Enterprises (Türkiye Kömür İşletmeleri, TKI), a state-owned enterprise has carried out research on feasibility of such technologies. The gasification and related technologies have been studied by TKI. The results are mixed but TKI’s R&D team has an understanding for such technologies.
A fundamentally different aspect of this strategy is how policy makers deal with hydrogen technologies. Previously, strategy was based on a government institution or company to realize a domestication of a key technology. This time the strategy is aiming for a “hydrogen ecosystem” with startups and entrepreneurs marketed by established players like natural gas distribution companies or the BOTAŞ.
The blue-green hydrogen discussion is not top on the agenda for energy experts. The viewpoint is more pragmatic than climate centric. It is important that hydrogen is part of solution for Turkey’s National Energy and Mining policy, and the costs and benefits of options to produce hydrogen from coal, renewables or recently found domestic gas reserves should be assessed. The use of low-carbon technologies to improve air quality and contribute to climate change mitigation are crucial. Major exporters of Turkish goods to EU are concerned about border carbon adjustment regimes and policies will be needed to enable a transition to low-carbon solutions for the industry SHURA Enerji Dönüşümü Merkezi & Agora Energiewende, 2020).
3.2. System integration impacts of green hydrogen
The power system implications of hydrogen use will need to be planned for. Turkey is giving an increasing importance to solar and wind resources. But as California’s recent blackouts have demonstrated, there are fundamental limits to frictionless solar and wind integration. To further utilize these resources either demand should be flexible, or storage systems must be installed. The battery storage solves only part of the problem in terms of short-term storage. But the real necessity is interseasonal storage. For example, if Turkey installs 50000 MW of solar PV in addition to other renewable capacity, some solar capacity at peak production should be stored for winter usage. Turkish policy makers are more in favor of interseasonal storage capability of excess solar through hydrogen.
The decarbonization pathway of the power sector is uncertain and can take different shapes. The development of electrolysis technology is significantly advanced based on a review of commercial technologies currently available, as well as expected improvements going forward (Buttler & Spliethoff, 2018). They note the technical suitability of current electrolysis technologies for several applications, including energy storage and grid balancing. They also identify opportunities to leverage sectoral coupling via power to gas and power to liquid production, as a form of storage-as-second order-decarbonization. The review also provides detailed technical parameters on the performance of various electrolysis technologies, which will prove valuable for techno-economic assessments.
The power system implications of hydrogen
use will need to be planned for.
If Turkey installs 50000 MW of solar PV in addition
to other renewable capacity, some solar capacity at peak production should be stored
for winter usage. Turkish policy makers are more
in favor of interseasonal storage capability of excess
solar through hydrogen.
Priority Areas for a National Hydrogen Strategy for Turkey39
We note a range of results when utilizing flexible electrolysis, coupled with hydrogen storage, as a support mechanism for the electric power system. The introduction of flexible electrolysis and hydrogen storage in the French power system has a potential for use in load following (in the context of France’s large baseload nuclear capacity) as well as for use as a balancing mechanism for variability in generation (Bennoua et al., 2015). Specifically examining the viability of hydrolysis plants participating in frequency regulation activities, another study finds that revenue for the plants is mostly driven by the capacity component of payments. However, compensation would have to increase 2-3 times over a 2010 baseline in order for such operations to be profitable for the plant (Guinot et al., 2015).
Looking more on the systemic scale, the successful integration of electrolysis for flexible energy storage at a large scale in Spain for transition from a modern power system to a decarbonized requires optimistically the integration of 50 MW of electrolysis capacity (Gutiérrez-Martín et al., 2015).
Battery storage is widely discussed topic and there are some good case studies like Horndale Battery Storage in Australia. But simulations done on Turkish electricity system shows that a huge battery storage is needed to make an important impact. The major reason is the high demand periods are high for up to 2-3 weeks and low demand periods are low for 2-3 weeks. This means during the high demand season, the incentive to store electricity for later hours does not make such a big difference, for low seasons it is the same. Although it provides short term flexibility, it cannot store economically for inter-seasonal usage.
According to another simulation, Turkish electricity system can get stressed above 20000 MW of solar and 20000 MW of wind if they coincide at peak production. The problem is not linear, the combination of solar, wind and demand as well as the location of these resources are important. Also, especially during low demand times there is a big chance of increased hydro generation during spring. The red lines on Figure 16 (right) is the need for curtailment of wind, solar. Summer is the season with least curtailments assuming demand will be high. This requires a utilization of this electricity and probably the best option is to use hydrogen and gas network as a solution. Stored hydrogen in underground salt-cavern storage can be used for both heat generation and electricity generation for ramp-up periods and winter.
Figure 15: Effect of 40000 MWh of storage on Turkish summer demand and load-duration curve
Source: Sanlı (2019b)
40000 MWh Depolama
50000
45000
40000
35000
30000
4850 4875 4900 4925 4950 4975 5000
Tertiplenmiş yük eğrisi - 40000 MWh
50000
45000
40000
35000
30000
25000
20000
0 2000 4000 6000 8000
Genel toplamAfter storage
MW tüketimMW depolama
We note a range of results when utilizing flexible
electrolysis, coupled with hydrogen storage, as a
support mechanism for the electric power system.
In order to prioritize the synergies for green
hydrogen between its uses for end use sectors and the gas grids as well as power
system transformation, a cost-benefit analysis will
be needed, including a comparison with the system
costs of other flexibility options such as battery
storage.

Priority Areas for a National Hydrogen Strategy for Turkey40
In order to prioritize the synergies for green hydrogen between its uses for end use sectors and the gas grids as well as power system transformation, a cost-benefit analysis will be needed, including a comparison with the system costs of other flexibility options such as battery storage.
Figure 16: Turkish electricity system has to start curtailing a lot of solar and wind if their capacity increases above 20000 MW each
50000
50000
3000
2500
2000
1500
1000
500
0
40000
40000
30000
30000
20000
20000
10000
10000
0
0
Güne
ş
Üre
tim (M
W)
Artan rüzgâr ve güneş kurulu gücüne göre kesinti saat sayısı Rüzgâr=35000MW Güneş=50000MW için 0-8759 saatler arası üretim/kesinti
Kesinti gereken saat miktarı
Rüzgâr Saat
40000
20000
0
-20000
-40000
0 2000 4000 6000 8000
Kesinti Hidro Rüzgâr Güneş DiğerSource: Sanlı (2019a)

Priority Areas for a National Hydrogen Strategy for Turkey41
Hydrogen logistics and trade potential need to be understood in developing Turkey’s hydrogen strategy against the country’s significant potential of renewables.
In line with its national and local energy strategy, Turkey would understandably aim to produce green hydrogen locally and from local resources. As shown above, this would require large investments and the need for subsequent financing. It will be important to understand where hydrogen will be used since demand locations across Turkey’s geography differ significantly. While iron plants are mainly located in the western and southern regions (see Figure 17), cement plants are spread across the entire country (Figure 18). Figure 19 shows the major gas pipelines in Turkey which indicate the possibilities where Turkey can inject green hydrogen for export to other countries. By comparison gas is used across the entire country with more than 16 million subscribers and 53 million active users (this compares with Turkey’s total population that is reaching 85 million). The potential for wind and solar exists across the entire country but wind power benefits the highest output predominantly in the western parts of Turkey whereas solar irradiation is the highest in the central and southern parts of the country. To minimize grid investments and consumer on-site power to produce hydrogen such mapping needs to be done in strategy development. Supply locations should also be matched with the demand locations where proximity offers opportunities. This would also help to use low-cost renewable electricity generation for hydrogen production in electrolyzers without any additional transmission grid costs. Some of the local hydrogen production could also be exported to other countries through gas pipelines or in the form of liquid hydrogen or as end-use products like ammonia or iron from harbor areas of Turkey which also have significant resource potential for wind and solar. Some of major harbor areas in the western and southern parts of Turkey are also the areas where solar and wind resource potential exists. However, economic activity is also significantly high in these areas limiting the availability of land and requiring electricity to meet local demand first.
This points to the importance of the integration of electricity and gas systems with hydrogen. The benefit expected is to solve part of Turkey’s east-west electricity flow imbalances. As more solar is available in less populated and hot regions, instead of trying to balance that solar in the produced region, is should be transferred as both in gas from and electricity. The electricity flows can be controlled with electrolyzers providing demand flexibility. Then this gas can be fed and stored for short term stored in Turkey’s strong natural gas grid. This mixture may later be used during ramp-up periods by natural gas combined cycle power plants. Extra gas can be stored in Tuz gölü or Silivri natural gas storage facilities.
There is one more option of sending the blended gas or pure hydrogen through Trans-Anatolian Natural Gas Pipeline (TANAP), Turkey-Greece or Turkey-Bulgaria interconnectors. This is not a possibility now, but these can be options for exporting green hydrogen to the EU. This may further pave the way for more renewable capacity integration in Turkey.
A plan based on these assumptions should be compatible with the National Energy and Mining policy of 2017. Localization of technology will be utmost important. Therefore, the renewable energy resource area (Yenilenebilir Enerji Kaynak Alanı, YEKA) auction model can be tilted for hydrogen electrolyzers. The first step in this direction
4. Infrastructure needs to enable hydrogen transition
To minimize grid investments and consumer
on-site power to produce hydrogen such mapping
needs to be done in strategy development. Supply
locations should also be matched with the demand locations where proximity
offers opportunities.
Some of the local hydrogen production could also be
exported to other countries through gas pipelines or in
the form of liquid hydrogen or as end-use products
like ammonia or iron from harbor areas of Turkey
which also have significant resource potential for wind
and solar.

Priority Areas for a National Hydrogen Strategy for Turkey42
is the determination of BOTAŞ’s transmission grid’s technical limits for hydrogen. Technical studies had to be carried out. But a Hydrogen-to-Electricity agreements with domestic technology fabrication with feed in guarantees (Yenilenebilir Enerji Kaynak Destek Mekanizması, YEKDEM) or integrated YEKA-hydrogen projects are not impossible. In addition, new regulatory options for using renewable power plants in hydrogen production that have so far benefitted from the YEKDEM model can should also be explored.
If cost reductions for electrolyzers are going to be driven by “learning by doing” and economies of scale, similar to other energy technologies, it is imperative that market structure for hydrogen transactions and infrastructure to move the gas be built. Even still, in a world where a market is established an infrastructure exists, there are still regulatory issues around hydrogen production that must be faced before any substantial decrease in electrolyzer technologies will be realized.
Figure 17: Location of iron and steel plants in Turkey
If cost reductions for electrolyzers are going
to be driven by “learning by doing” and economies of scale, similar to other energy technologies, it is
imperative that market structure for hydrogen
transactions and infrastructure to move the
gas be built.
24
48
24
24
723
33
7 Electric Arc Furnace
Integrated
Induction Furnace
7
7
7
7
72
24
96
24
Source: TÇÜD (2019)
7168

Priority Areas for a National Hydrogen Strategy for Turkey43
Figure 18: Location of cement plants in Turkey, 2018
Figure 19: Gas pipelines in Turkey, 2020
TÇMB Member Grinding Units
Non-TÇMB Member Grinding Units
TÇMB Member Integrated Plants
Non-TÇMB Member Integrated Plants
Source : TÇMB (2018)
Source: Botaş (2020)


Priority Areas for a National Hydrogen Strategy for Turkey45
The success of Turkey’s hydrogen strategy will highly depend on the development of its innovation and entrepreneurship eco system. Hydrogen’s anticipated role in economy-wide deep decarbonization creates unique opportunities and directions for entrepreneurship. The first challenge involves addressing the large capital investment that needs to be made, especially in infrastructure. Once industry and policymakers are convinced that hydrogen will be a critical component for decarbonization, investing in that infrastructure is the next step. To move toward a semi-hydrogen economy, we need to identify the sectors or end users that really require or could benefit from using hydrogen. Another key issue is the nature of hydrogen production itself. Though hydrogen does not generate any emissions directly when used, hydrogen production can have a huge environmental impact. Today, close to 95% of its production is from fossil resources. As a result, CO2 emissions from hydrogen production are quite high. Turkey has advantageous position for some of the listed areas. Three pillars of hydrogen eco system are research and development, commercialization, and large-scale adoption and deployment. Here, we explore each one of these pillars for Turkey’s potential global leadership role in hydrogen transition.
Research and DevelopmentWhile hydrogen is extensively used in several industries, current production is dominated by fossil fuel-based conversion methods and utilization is mainly for chemical, refinery products, and fertilizer production. The versatility of hydrogen creates a huge potential across all energy sectors; power, transportation, residential and commercial buildings heating, and the manufacturing industry. However, the wide-spread adoption of green hydrogen as an energy vector is dependent on the availability of cost-effective technology options across its entire value chain. Research and Development can be divided into two general categories: technology innovation and safety measures.
Technology innovationGreen hydrogen production: advancement in electrolyzer technologies. Alkaline and proton exchange membrane electrolyzers are commercially available. However, current and projected hydrogen production costs are still higher than fossil fuel-based alternatives. Innovation for cost decline is of utmost importance. One of the challenges of green hydrogen production is that the renewable energy sources (solar and wind in particular) are intermittently available. The hydrogen production technology should be able to operate following the load variation and the low utilization factor of electrolyzer units should be compensated by low capital cost. Another key consideration is system integration to maximize the utilization of these assets. Another important innovation element is the alignment between the production method and utilization condition. This primarily includes tradeoff between central large scale and distributed small scale production. But the condition of production (temperature, pressure, and phase of hydrogen) has equivalent importance. Hydrogen transport and conditioning. Hydrogen is currently carried as compressed (gaseous) or liquefied (liquid) conditions via pipelines, trailer trucks, and tanker trucks. Both transport states have significant energy and cost penalties depending on the distance of transportation and end use applications. One of the key considerations as listed in the hydrogen production point is performing a system optimization. Another important element is exploring alternative hydrogen transport modes that repurpose
5. Opportunities for Hydrogen Entrepreneurship in Turkey
Hydrogen’s anticipated role in economy-wide deep
decarbonization creates unique opportunities
and directions for entrepreneurship.
The wide-spread adoption of green hydrogen as an
energy vector is dependent on the availability of cost-
effective technology options across its entire value chain.
One of the key considerations as listed in
the hydrogen production point is performing a system optimization.
Another important element is exploring alternative
hydrogen transport modes that repurpose existing
infrastructure.

46 Priority Areas for a National Hydrogen Strategy for Turkey
existing infrastructure. Existing pipelines cannot be directly used to transport hydrogen. Development of low-cost retrofitting technologies can open up the opportunities for utilizing existing infrastructure for hydrogen transport. Development of coating materials, monitoring standards and equipment, as well as the fast application methods such as in-pipe robots should drive the hydrogen transport innovation. Hydrogen storage is available in various phases and conditions, similar to transport modes. The current low cost, long term option is to use geologic storage sites (salt domes). In the green hydrogen context, storage will especially be important as production will likely to follow the availability of renewable energy sources. Unfortunately, geologic storage is not available everywhere and regional inventory of potential storage sites has not been extensively studied. Development of hydrogen carriers and storage alternatives such as liquid organic hydrogen carriers can help overcome another important bottleneck. On the small-scale storage applications including mobile applications such as compressed hydrogen tanks for vehicles, development of cost effective and safe options is important.
Hydrogen conversion is the ultimate step in the hydrogen value chain. As presented in earlier sections of this report, hydrogen can be used for a plethora of applications, each one of which will have a different conversion process. For electric power applications, retrofitting existing gas turbine assets is of high priority. For transportation, development of fuel cell vehicle technologies and high-performance machinery for heavy duty applications is important. Vehicles for public transportation can help reduce air pollution while still maintaining the maximum drive time. For residential and commercial applications, hydrogen or hydrogen blended fuel burning equipment development and/or retrofit options is crucial. For industry, fuel switching to hydrogen and development of new technologies that will benefit from direct utilization of hydrogen is at the top of innovation agenda.
Safety measuresHydrogen has a number of properties that make it safer to handle and use than the conventional fuels used in our energy system today. Hydrogen is nontoxic and much lighter than air. In the case of a leak, its lightness allows for relatively rapid dispersal. All fuels have some degree of danger associated with them, but fuel systems can be designed with engineering controls and establish standards to ensure their safe handling and use. However, the number of successful hydrogen projects should grow to demonstrate the feasibility and increase public acceptance.
CommercializationThe adoption of hydrogen use for deep decarbonization should see a sharp increase in the next decade. This relatively short timeline put pressure to rapidly commercialize hydrogen technology options that will further accelerate its wide-spread use. In the Research and Development section, we have listed areas that have paramount importance. In this section, instead of creating an exhaustive list, the focus is to highlight Turkey’s current strengths that can give a head start.
In the green hydrogen context, storage will
especially be important as production will likely to
follow the availability of renewable energy sources.
The number of successful hydrogen projects should grow to demonstrate the
feasibility and increase public acceptance.

47 Priority Areas for a National Hydrogen Strategy for Turkey
Appliance developmentHydrogen use in residential and commercial buildings applications will require hydrogen compatible appliances. This will include a range of products that tolerates certain hydrogen blends all the way to products that operates with pure hydrogen. Appliances will include Heaters, water heaters, stoves, ovens. Turkish appliance manufacturing industry is perfectly positioned to invest in this area.
Niche applications in transportationCurrent use applications of hydrogen include fork-lifts in warehouses, taxis, and trains. All of these examples can be adopted in Turkey both from manufacturing and utilization perspective. Initially requirement of infrastructure can be minimized focusing on applications that can be practiced using central fueling stations. Metrobus, warehouse tools and vehicles have a great potential as point of entrance to the hydrogen market.
Business modelsHydrogen value chain is composed of multiple players. This creates unique opportunities to create new business models. As the presence of hydrogen grows new solutions need to be developed including ownership models for different assets in the hydrogen value chain, transport and distribution network development, planning for strategically locating production, storage and refueling stations, creating and enforcing safety protocols, developing certification standards for hydrogen devices, creating cross-sector applications.
Large-scale adoption and deploymentThe effectiveness of hydrogen role in deep decarbonization depends on its adoption in large scale. There are many factors that will boost hydrogen’s potential. A national hydrogen strategy prioritizing research and development, deployment of low carbon hydrogen production facilities, infrastructure upgrade and incentives for multi-sector adoption of hydrogen, must be adopted. While the private sector is expected to drive the hydrogen’s growth in Turkey, national strategy will determine the players. Strategic issues include the primary focus (hydrogen for energy security, for decarbonization or to become a net clean energy exporter), the national hydrogen network design (carrying electron for distributed hydrogen production vs. transporting hydrogen via centralized hydrogen production).
Hydrogen use in residential and commercial buildings
applications will require hydrogen compatible
appliances.
Hydrogen value chain is composed of multiple
players. This creates unique opportunities to create new
business models.
A national hydrogen strategy prioritizing
research and development, deployment of low carbon
hydrogen production facilities, infrastructure
upgrade and incentives for multi-sector adoption of
hydrogen, must be adopted.

Priority Areas for a National Hydrogen Strategy for Turkey48

Priority Areas for a National Hydrogen Strategy for Turkey49
Several priority areas emerge from this brief paper that can help Turkey in developing a national hydrogen strategy:
• Understanding the opportunities of green hydrogen to reduce energy import dependency: Based on the first-order assessment carried out in this study, green hydrogen has a potential to provide around 5% of Turkey’s total final energy consumption and can create a crucial role in mitigating Turkey’s import dependency on gas and other fossil fuels. For instance, 5% blending in the gas grid means the elimination of 2.5 billion m3 per year imported gas, equivalent to around US$0.6 billion per year imported gas costs. This would provide a clean energy alternative in the energy-intensive heavy industry, transportation and most importantly to green the gas grid of Turkey and provide alternative flexibility options for the grid investments of renewables.
• Understanding the opportunities for the gas sector: If transmission pipelines are utilized, this hydrogen may even be exported to Europe. Turkey’s east west electricity transfers are expected to grow until 2023 with the addition of new generation capacities. Some of this generation can be transferred as hydrogen to the combined cycle gas-fired power plants in the west.
• Mobilizing financing for electrolyzer and renewable power capacities: Investments for renewable power capacity is three times higher than for electrolyzers, so this requires mobilizing investments and creating finance. Rapid technology deployment is needed to drive down electrolyzer costs in realizing cost competitiveness
• Planning for renewable energy integration to green hydrogen production: Turkey needs to plan for how it can use its large renewable energy resource availability to decarbonize its energy sector and create opportunities for export, thus maximize renewable capacity especially solar using electrolyzers as both demand flexibility and hydrogen generation, more renewables can be integrated.
• Quantifying the costs, social, economic and environment benefits of hydrogen production: There are multiple markets for green hydrogen and its costs and benefits should be compared at a sector/application level, including a comparison with other low—carbon solutions to decarbonize Turkey’s energy system. With respect to environment benefits of green hydrogen, the full suite of benefits that vary from reducing air pollutant emissions to climate change mitigation should be addressed. Implementing market-based mechanisms that address reducing energy-related CO2 emissions will increase Turkey’s industrial competitiveness. There’s also a need to compare these findings with the costs and benefits of hydrogen production from coal and other resources.
• Gaining insights into power system implications of green hydrogen: Interseasonal storage is the biggest hurdle standing before the 100% renewable based systems. Battery storage is much more useful for short term system needs. Hydrogen-based storage can be a viable option if it can be economically integrated to gas infrastructure.
6. Priority areas in developing a national hydrogen strategy for Turkey

Priority Areas for a National Hydrogen Strategy for Turkey50
• Creating an indigenous hydrogen ecosystem: Turkey’s energy policy is based on the utilization of domestic resources with domestic technology. Creating a hydrogen technology and startup ecosystem locally that are offered by the business opportunities of hydrogen will create opportunities for a wider economy.
• Positioning the role of green hydrogen in the Turkey’s overall energy transition strategy: Broader energy sector decarbonization with green hydrogen needs to be supported with energy efficiency, renewable energy and electrification, so a clear strategy for green hydrogen in the context of Turkey’s national energy and climate strategies are needed with a time plan of technology development and deployment, location choices, costs and benefits, industry transformation opportunities and business models

Priority Areas for a National Hydrogen Strategy for Turkey51
Agora Verkehrswende, Agora Energiewende & Frontier Economics (2018). The Future Cost of Electricity-Based Synthetic Fuels, September 2018. https://www.agora-energiewende.de/fileadmin2/Projekte/2017/SynKost_2050/Agora_SynKost_Study_EN_WEB.pdf
Bennoua, S., Le Duigou, A., Quéméré, M.-M., & Dautremont, S. (2015). Role of hydrogen in resolving electricity grid issues. International Journal of Hydrogen Energy, 40(23), 7231–7245. https://doi.org/10.1016/j.ijhydene.2015.03.137
Boenninghausen, D. (2019). DHL und Streetscooter entwickeln E-Transporter mit Brennstoffzelle. Nutzfahrzeuge. https://www.electrive.net/2019/05/24/dhl-und-streetscooter-entwickeln-e-transporter-mit-brennstoffzelle
BOTAŞ. (2020). Doğal Gaz ve Petrol Boru Hatları Haritasi. https://www.botas.gov.tr/Sayfa/dogal-gaz-ve-petrol-boru-hatlari-haritasi/168
BMWI (2020). The National Hydrogen Strategy, Federal Ministry for Economic Affairs and Energy. June 2020. https://www.bmbf.de/files/bmwi_Nationale%20Wasserstoffstrategie_Eng_s01.pdf
Buttler, A., & Spliethoff, H. (2018). Current status of water electrolysis for energy storage, grid balancing and sector coupling via power-to-gas and power-to-liquids: A review. Renewable and Sustainable Energy Reviews, 82, 2440–2454. https://doi.org/10.1016/j.rser.2017.09.003
CDP (n.d.). The energy transition in Italy and the role of the electricity and gas sector, Cassa Depositi e Prestiti. https://download.terna.it/terna/The_Energy_Transition_8d752160d62f6a6.pdf
COAG Energy Council (2019). Australia’s National Hydrogen Strategy. https://www.industry.gov.au/sites/default/files/2019-11/australias-national-hydrogen-strategy.pdf
DGEC & CEA (2018). Plan de déploiement de l’hydrogène pour la transition énergétique, La Direction générale de l’Energie et du Climat (DGEC) et au Commissariat à l’énergie atomique et aux énergies alternatives (CEA), June 2018. https://www.ecologie.gouv.fr/sites/default/files/2018.06.01_dp_plan_deploiement_hydrogene_0.pdf
Enerji ve Tabii Kaynaklar Bakanlığı (2020). “Enerjide Arama Buluşmaları”, January 2020, Ankara. https://boren.gov.tr/uploads/dosyaYoneticisi/479628-enerjide-arama-bulusmalari-hidrojen-program.pdf
Enerji ve Tabii Kaynaklar Bakanlığı (n.d.-a). “Denge Tabloları”. https://enerji.gov.tr/enerji-isleri-genel-mudurlugu-denge-tablolari
Enerji ve Tabii Kaynaklar Bakanlığı (n.d.-b). Enerji İşleri Genel Müdürlüğü, https://enerji.gov.tr/eigm
European Commission (2019). Hydrogen, https://ec.europa.eu/energy/topics/energy-system-integration/hydrogen_en
GAZBİR-GAZMER Uluslararası İlişkiler Komisyonu (2020). “Doğal Gaz Sistemlerinde Hidrojene Geçiş : Avrupa Örneği”, July 2020. http://www.gazmer.com.tr/dokumanlar/gazbir-gazmer-dogalgaz-sistemlerinde-hidrojene-gecis.pdf
References

52 Priority Areas for a National Hydrogen Strategy for Turkey
Gielen, D., Saygin, D., Taibi, E., & Birat, J. (2020). Renewables based decarbonization and relocation of iron and steel making: A case study. Journal of Industrial Ecology, 24(5), 1113–1125. https://doi.org/10.1111/jiec.12997
Guinot, B., Montignac, F., Champel, B., & Vannucci, D. (2015). Profitability of an electrolysis based hydrogen production plant providing grid balancing services. International Journal of Hydrogen Energy, 40(29), 8778–8787. https://doi.org/10.1016/j.ijhydene.2015.05.033
Gutiérrez-Martín, F., Ochoa-Mendoza, A., & Rodríguez-Antón, L. M. (2015). Pre-investigation of water electrolysis for flexible energy storage at large scales: The case of the Spanish power system. International Journal of Hydrogen Energy, 40(15), 5544–5551. https://doi.org/10.1016/j.ijhydene.2015.01.184
Hydrogen and Fuel Cell Strategy Council (2019). “The Strategic Road Map for Hydrogen and Fuel Cells -Industry-academia-government action plan to realize a “Hydrogen Society”. https://www.meti.go.jp/english/press/2019/pdf/0312_002b.pdf
Hydrogen Council (n.d.). https://hydrogencouncil.com/en/
IEA (2019). “The Future of Hydrogen” International Energy Agency, Paris https://www.iea.org/reports/the-future-of-hydrogen
IEA (2020). “World Energy Outlook 2020” International Energy Agency, October 2020. https://www.iea.org/reports/world-energy-outlook-2020. https://www.iea.org/reports/world-energy-outlook-2020
IRENA (2017). Biofuels for aviation: Technology brief, International Renewable Energy Agency, Abu Dhabi. https://www.irena.org/-/media/Files/IRENA/Agency/Publication/2017/IRENA_Biofuels_for_Aviation_2017.pdf
IRENA (2018). Hydrogen from renewable power: Technology outlook for the energy transition, International Renewable Energy Agency, Abu Dhabi. https://www.irena.org/-/media/Files/IRENA/Agency/Publication/2018/Sep/IRENA_Hydrogen_from_renewable_power_2018.pdf
IRENA (2019a). Hydrogen: A renewable energy perspective, International Renewable Energy Agency, Abu Dhabi https://www.irena.org/-/media/Files/IRENA/Agency/Publication/2020/Jun/IRENA_Power_Generation_Costs_2019.pdf
IRENA (2019b). Hydrogen: A renewable energy perspective, International Renewable Energy Agency, Abu Dhabi. https://www.irena.org/-/media/Files/IRENA/Agency/Publication/2019/Sep/IRENA_Hydrogen_2019.pdf
IRENA (2020a). Global Renewables Outlook: Energy transformation 2050 (Edition: 2020), International Renewable Energy Agency, Abu Dhabi. April 2020. https://www.irena.org/-/media/Files/IRENA/Agency/Publication/2020/Apr/IRENA_Global_Renewables_Outlook_2020.pdf.
IRENA (2020b). Green Hydrogen: A guide to policy making, International Renewable Energy Agency, Abu Dhabi. https://www.irena.org/-/media/Files/IRENA/Agency/Publication/2020/Nov/IRENA_Green_hydrogen_policy_2020.pdf
IRENA (2020c). Hydrogen from Renewable Power, International Renewable Energy Agency, Abu Dhabi. https://www.irena.org/energytransition/Power-Sector-Transformation/Hydrogen-from-Renewable-Power

53 Priority Areas for a National Hydrogen Strategy for Turkey
IRENA (2020d). Green Hydrogen Cost Reduction: Scaling up Electrolysers to Meet the 1.5⁰C Climate Goal, International Renewable Energy Agency, Abu Dhabi. https://www.irena.org/-/media/Files/IRENA/Agency/Publication/2020/Dec/IRENA_Green_hydrogen_cost_2020.pdf
IRENA (2020e). Renewable Power Generation Costs in 2019, International Renewable Energy Agency, Abu Dhabi. https://www.irena.org/-/media/Files/IRENA/Agency/Publication/2020/Jun/IRENA_Power_Generation_Costs_2019.pdf
Muscolino, F., Martinis, A., Ghiglione, M., Duarte P. (2016). “Introduction to direct reduction technology and outlook for its use”, La Metallurgia Italiana. http://www.aimnet.it/la_metallurgia_italiana/2016/aprile/Muscolino.pdf
NIB (n.d.). The Green Hydrogen Economy in the Northern Netherlands, Northern Netherlands Innovation Board. https://www.ebnn-nieuw.nl/wp-content/uploads/2019/05/NIB-Hydrogen-Full_report.pdf
Nikola Motor. (2019). “Hydrogen Advantages”. https://nikolamotor.com/hydrogen
O’Dell, J. (2018). “Toyota Unveils More Advanced Heavy-Duty Fuel Cell Truck Prototype”. https://www.trucks.com/2018/07/30/toyota-advanced-fuel-cell-truck
Özkadı, F. (2020). Carbon Border Adjustment Mechanism Potential Impacts on Turkey’s Exports to EU, May 2020. https://www.shura.org.tr/wp-content/uploads/2020/05/SHURA_Agora_BCA_Ozkadi.pdf
Şanlı, B. (2019a).“ Sürdürülebilir Doğal Gaz, Yakıt Piyasa Eşleşmeleri Ve Türkiye’ye etkileri, October 2019.http://barissanli.com/calismalar/2019/20191017-ingas.pdf
Şanlı, B. (2019b).“Python Ile Enerji Analizi.” Enerji Depolama Simulasyonu, March 2019.http://barissanli.com/python/depolama.php.
Saygin, D. (2012). “Assessing industrial energy use and CO2 emissions Opportunities for energy efficiency, biomass and CCS.
Saygin, D. & Gielen, D. (2021). Zero emission pathway for the global chemical and petrochemical sector.
Saygin, D., Gielen, D. J., Draeck, M., Worrell, E., & Patel, M. K. (2014). Assessment of the technical and economic potentials of biomass use for the production of steam, chemicals and polymers. Renewable and Sustainable Energy Reviews, 40, 1153–1167. https://doi.org/10.1016/j.rser.2014.07.114
Saygın, D, & Şanlı, B. (2020). “Isıtma Sektöründe Yenilenebilir Enerjinin Rolü”, Bilkent Enerji Politikaları Araştırma Merkezi, January 2020. https://www.shura.org.tr/wp-content/uploads/2020/09/Enerji-donusumunde-yerli-dogal-gazin-rolu.pdf
Saygın, D., Hoffman, M. & Godron, P. (2018). “How Turkey Can Ensure a Successful Energy Transition”, July 2018. https://www.americanprogress.org/issues/security/reports/2018/07/10/453281/turkey-can-ensure-successful-energy-transition/
SHURA Enerji Dönüşümü Merkezi (2019a). “Energy pricing and non-market flows in Turkey’s energy sector”, May 2019, İstanbul. https://www.shura.org.tr/wp-content/uploads/2020/05/raporweb_ENG-.pdf
54 Priority Areas for a National Hydrogen Strategy for Turkey
SHURA Enerji Dönüşümü Merkezi (2019b). “Transport sector transformation: Integrating electric vehicles into Turkey’s distribution grids”, December 2019, İstanbul. https://www.shura.org.tr/wp-content/uploads/2020/10/Transport-sector-transformation-Integrating-electric-vehicles-into-Turkeys-distribution-grids.pdf
SHURA Enerji Dönüşümü Merkezi (2020a). “Binalarda Çatı Üstü Güneş Enerjisi Potansiyeli - Türkiye’de Çatı Üstü Güneş Enerjisi Sistemlerinin Hayata Geçmesi için Finansman Modelleri ve Politikalar” April 2020, İstanbul. https://www.shura.org.tr/ binalarda_cati_ustu_gunes_enerjisi_potansiyeli-turkiyede_cati-_ustu_gunes_enerjisi_ sistemlerinin_hayata_gecmesi_icin_finansman_modelleri_ve_politikalar/
SHURA Enerji Dönüşümü Merkezi (2020). “Optimum electricity generation capacity mix for Turkey towards 2030”, August 2020, İstanbul. https://www.shura.org.tr/wp-content/uploads/2020/09/ExecutiveSum.pdf
SHURA Enerji Dönüşümü Merkezi & Agora Energiewende (2020). “The European Green Deal’s Border Carbon Adjustment: Potential impacts on Turkey’s exports to the European Union”, May 2020, İstanbul. https://www.shura.org.tr/wp-content/uploads/2020/05/SHURA_Agora_Border_Carbon_Adjustment_Turkey_EU.pdf
SHURA Enerji Dönüşümü Merkezi & Buildings Performance Institute Europe (2019). “Enhancing Turkey’s policy framework for energy efficiency of buildings, and recommendations for the way forward based on international experiences”, June 2019, İstanbul. https://www.shura.org.tr/wp-content/uploads/2019/08/Buildings-Energy-Efficiency-Policy-Working-Paper-3.pdf
Staffell, I., Scamman, D., Velazquez Abad, A., Balcombe, P., Dodds, P. E., Ekins, P., Ward, K. R. (2019). The role of hydrogen and fuel cells in the global energy system. Energy & Environmental Science, 12(2), 463–491. https://doi.org/10.1039/c8ee01157e
TÇÜD. (2019). “Çelik Haritası”. http://celik.org.tr/harita/
Türkiye Çimento Müstahsilleri Birliği (2018). Tüm Üye Fabrikalar. https://www.turkcimento.org.tr/tr/uye_fabrikalar
U.S. DRIVE (2017). Hydrogen Production Tech Team Roadmap, Driving Research and Innovation for Vehicle efficiency and Energy Sustainability. https://www.energy.gov/sites/prod/files/2017/11/f46/HPTT%20Roadmap%20FY17%20Final_Nov%202017.pdf
Ulaştırma Bakanlığı (2015). “2003-2014 İstatistiklerle Ulaştırma Denizcilik ve Haberleşme”, Strateji Geliştirme Başkanlığı, Ankara, s: 11, 18, 30, 41, 54, 56, 61, 106, 108.
Weiss, W. & Spörk-Dür, M. (2020). “Solar Heat Worldwide Global Market Development and Trends in 2019 Detailed Market Data 2018” May 2020. https://www.iea-shc.org/Data/Sites/1/publications/Solar-Heat-Worldwide-2020.pdf
World Bank (n.d.). “Manufacturing, value added (% of GDP) – Turkey”. https://data.worldbank.org/indicator/NV.IND.MANF.ZS?locations=TR
Yeşil Ekonomi (2020). “Türkiye’nin sera gazı emisyonları 2018’de geriledi”, April 2020 https://yesilekonomi.com/turkiyenin-sera-gazi-emisyonlari-2018de-geriledi/#:~:text=Türkiye%20İstatistik%20Kurumu%20tarafından%20yapılan,137%2C5%20oranında%20üstünde%20oldu.

55 Priority Areas for a National Hydrogen Strategy for Turkey
NOTES

56 Priority Areas for a National Hydrogen Strategy for Turkey
NOTES

About Istanbul Policy Center at the Sabancı UniversityIstanbul Policy Center (IPC) is a global policy research institution that specializes in key social and political issues ranging from democratization to climate change, transatlantic relations to conflict resolution and mediation. IPC organizes and conducts its research under three main clusters: The Istanbul Policy Center–Sabancı University–Stiftung Mercator Initiative, Democratization and Institutional Reform, and Conflict Resolution and Mediation. Since 2001, IPC has provided decision makers, opinion leaders, and other major stakeholders with objective analyses and innovative policy recommendations.
About European Climate FoundationThe European Climate Foundation (ECF) was established as a major philanthropic initiative to help Europe foster the development of a low-carbon society and play an even stronger international leadership role to mitigate climate change. The ECF seeks to address the “how” of the low-carbon transition in a non-ideological manner. In collaboration with its partners, the ECF contributes to the debate by highlighting key path dependencies and the implications of different options in this transition.
About Agora EnergiewendeAgora Energiewende develops evidence-based and politically viable strategies for ensuring the success of the clean energy transition in Germany, Europe and the rest of the world. As a think tank and policy laboratory, Agora aims to share knowledge with stakeholders in the worlds of politics, business and academia while enabling a productive exchange of ideas. As a non-profit foundation primarily financed through philanthropic donations, Agora is notbeholden to narrow corporate or political interests, but rather to its commitment to confronting climate change.

Evliya Çelebi Mh. Kıblelizade Sk. Eminbey Apt. No:16 K:3 D:4 34430 Beyoğlu / İstanbulTel: +90 212 243 21 90E-mail: [email protected]
/company/shura @shuraedm SHURAEDM
SHURA is founded by