prism of possibilities
TRANSCRIPT
PRISM OF
PossibilitiesA N N U A L R E P O R T 2 0 1 8 - 1 9
I N N O V A T E
I N T E G R A T E
M O T I V A T E

Corporate Information 1
Vision, Mission & Values 4
Financial Highlights 5
Chairman's Message 6
Panacea Biotec at a Glance 9
Key Strengths 10
Management Discussion & Analysis 11
Directors' Report 25
Corporate Governance Report 49
Auditors' Report on Standalone 65Financial Statements
Standalone Financial Statements 73
Auditors' Report on Consolidated 118Financial Statements
Consolidated Financial Statements 125
CO
NTE
NTS
Safe Harbour StatementThis report contains forward-looking statements, which may be identified by their use of words like ‘plans’, ‘expects’, ‘will’, ‘anticipates’, ‘believes’, ‘intends’, ‘projects’, ‘estimates’, or other words of similar meaning. All statements that address expectations or projections about the future, including but not limited to statements about Company’s future growth drivers, product development, market position and expenditures are forward looking statements. Forward looking statements are based on certain assumptions and expectations for future events. The Company may not guarantee that these assumptions and expectations are accurate and will be realised. The Company’s actual results, performance or achievements could thus differ materially from those projected in any forward-looking statements. The Company assumes no responsibility to publicly amend, modify, revise any forward-looking statements, on the basis of any subsequent developments, information and events.

www.panaceabiotec.comCIN: L33117PB1984PLC022350
Corporate InformationBoard of DirectorsExecutive Directors
Mr. Soshil Kumar Jain - Chairman
Dr. Rajesh Jain - Managing Director
Mr. Sandeep Jain - Joint Managing Director
Mrs. Sunanda Jain - Whole time Director
Mr. Sumit Jain - Director Operations & Projects
Mr. Ankesh Jain - Director Sales & Marketing Non-Executive Directors Mr. Ashwini Luthra
Mr. Bhupinder Singh
Mr. K. M. Lal Mrs. Manjula Upadhyay Mr. Mukul Gupta
Mr. Nithin Krishna Kaimal
Mr. N. N. Khamitkar
Mr. R. L. Narasimhan
Company Secretary Mr. Vinod Goel - Group CFO and Head Legal &
Company Secretary
Chief Financial Officer Mr. Devender Gupta - Chief Financial Officer & Head Information Technology
Registered OfficeAmbala - Chandigarh Highway
Lalru - 140 501, Punjab, India
Corporate OfficesB-1 Extn./G-3, Mohan Co-operative Indl. EstateMathura Road, New Delhi - 110 044, India
B-1 Extn./A-27, Mohan Co-operative Indl. Estate
Mathura Road, New Delhi - 110 044, India
Manufacturing FacilitiesMalpur, Baddi, Dist. Solan
Himachal Pradesh - 173 205, India
Ambala - Chandigarh Highway
Lalru - 140 501, Punjab, India
R&D CentresAmbala - Chandigarh HighwayLalru - 140 501, Punjab, India
Sales & Marketing Officeth7 �oor, Sagar Tech Plaza, ‘A’ Wing, Saki Naka,
Andheri (East), Mumbai - 400 072, India
Statutory AuditorsM/s. Walker Chandiok & Co. LLP
Chartered Accountants, Gurugram, India
Secretarial AuditorsM/s. R&D Company Secretaries, Delhi, India
Cost AuditorsM/s. GT & Co., Cost Accountants, New Delhi, India
Registrar & Transfer AgentsM/s. Skyline Financial Services Private Limited
stD-153 A, I Floor, Okhla Indl. Area, Phase-I
New Delhi - 110 020, India
BankAxis Bank Limited
IDBI Bank Limited
State Bank of India
Information as on August 12, 2019
01Panacea Biotec Ltd.

I N N O V AT EI N T E G R AT E
M O T I V AT E

This year presents many challenges to the health
care industry due to the impending health
reforms, changing regulatory scenario, slow rate
of growth in major markets, high cost of drug
development , growing legal chal lenges,
protectionisms, increasing push on generics,
falling prices of generics in major markets,
increasing competitions, market access issues,
increasing cost of production, lack of adequate
healthcare infrastructure in developing countries
including India, low insurance coverage and
provider reimbursements issues.
Still, even with its challenges, the pharmaceutical
industry is maintaining a stronghold globally.
Indian Biotechnology and pharmaceutical sector
is presently growing at a compound annual
growth rate (CAGR) of 20% and is expected to
reach USD 100 b i l l ion by 2025. Global
pharmaceutical market is expected to exceed US$
1.5 trillion by 2023 growing at a CAGR of around
6% and the key growth drivers will continue to be
the US and the emerging economies with a CAGR
of 4-7% and 5-8%, respectively. The global
vaccines market was estimated at US$ 33.70
billion in 2018 and is expected to reach US$ 57.50
billion by 2025, growing at a CAGR of 7.9%. The
Asia-Pacific vaccines market is expected to grow
at a higher CAGR of 8.9%. The Indian vaccine
market was estimated at around Rs.69 billion in
2017 and is expected to grow to Rs.111 billion by
2022, at a CAGR of around 10%. Moreover, the
Ayushman Bharat - National Health Protection
S c h e m e ( N H P S ) , re c e n t l y l a u n c h e d by
Government of India, with a vision to provide
insurance cover to an estimated 500 million
individuals from nearly 100 million poor and
financially vulnerable families to address the gap
in the common man's access to rel iable
healthcare, is also a valuable opportunity to
contr ibute towards del iver ing health at
reasonable costs. Emerging markets with strong
market growth such as India and China promise
more innovative drug development, hopefully
leading to more life-saving drug approvals for
patients worldwide.
Some of the major trends in the healthcare
industry are growing market share of Biosimilars,
increasing influence of healthcare technologies in
disease management, use of huge amount of big
data generated by healthcare devices/wearable's
by pharmaceutical companies for product and
service development and better disease
prevention & management, increasing trends
towards comsumerization of branded drugs,
more aware and engaging patients and care
givers prompting development of new strategies
and therapies by pharmaceutical industry.
Thus, while the challenges are compelling, now is
the time for Indian and global healthcare
companies to capitalize and overcome the
challenges by utilizing big data, cutting edge
healthcare technologies, innovative strategies
and see the prism of opportunities available to
them not only in India but on the global level by
motivating their core leadership, all stakeholders
through innovative measures and integrating all
their efforts for delivering more focused,
personalized, quality healthcare product and
services to more demanding and aware
consumers.
Healthcare professionals must be motivated by
the challenges and opportunities that are clearly
visible on the horizon and gear up for forging
ahead in the competition.
Prism of Possibilities: Innovate, Integrate, Motivate“Ability is what you're capable of doing. Motivation determines what you do.Attitude determines how well you do it.”
03Panacea Biotec Ltd.

04 Annual Report 2018-19
Innovation
in Support
of Life
Mission Vision
Leading
HealthManagement
Company
Goal
To Meet EveryHealthcare Need
with aPanacea Biotec
Brand and Service
Objective
Take Ideas fromGrey Cell to Markets in a
Proactive Manner
A process which transforms business ideas to marketable products
Bringing together different functions of the organisation like marketing, �nance, R&D, manufacturing to meet a common goal
A 'way of life' in every activity, from administration to innovation
To challenge every process & solution to discover ways to make them better
Intolerance towards stability, encouraging continuous change
Thinking about the impossible and discovering ways to execute it
Deep rooted and sustainable change and super�cial efforts
Striving for leadership in every activity and to become the guiding star
Having a vision of the future and succeed in reaching there before anyone else
Persevere in owning innovation and be the �rst mover in the market
Empowering people to speed up the organisation growth
Always embracing new technology and processes
Con�dence to stand apart from competitive organisations
Humility to respect all individuals
Care for individuals and environment
Placing betterment of people (external and internal) at the core of each activity
Core of new developments
Honesty
Ethical practices
Transparent and clear communication
Always learning & improving
Our Values

8,843.67
9,778.50
1,582.50
1,181.00
800.40
-
66.84
6,898.40
6,965.24
14,745.30
6,946.58
14,745.30
17.89
13.35
9.05
25%
11.98
17,177.94
17,177.94
11,304.60
11,655.12
2,843.50
1,554.90
1,350.50
-
61.25
6,306.80
6,368.05
6,523.60
25.15
13.75
11.95
75%
21.35
6,883.80
7,080.43
(864.50)
(2,629.47)
(2,077.87)
-
61.25
8,079.60
8,140.85
18,528.80
10,483.66
18,528.80
(12.56)
(38.20)
(30.18)
(33.92)
5,304.20
6,013.50
(786.61)
(2,506.30)
(2,301.30)
-
61.25
5,551.30
5,612.55
16,798.20
9,864.10
16,798.20
(14.83)
(47.25)
(43.39)
-
(37.57)
4,671.40
5,146.66
(805.90)
(4.16)
(4.16)
-
61.25
5,561.59
5,622.84
18,864.62
11,120.27
18,864.62
(17.25)
(0.09)
(0.09)
-
(0.07)
6,432.23
7,072.52
955.69
(633.41)
(652.29)
-
61.25
5,172.81
5,397.06
18,792.32
10,766.59
18,792.32
14.86
(9.85)
(10.14)
-
(10.65)
6,196.46
6,724.56
1,380.70
14.00
8.73
-
61.25
5,176.05
5,400.30
18,074.30
10,065.88
18,074.30
22.28
0.23
0.14
-
0.14
5,219.10
5,976.89
1,231.49
(840.43)
(726.61)
(734.29)
61.25
4,496.95
4,558.20
17,817.51
9,696.98
17,817.51
23.60
(16.10)
(13.92)
-
(11.86)
5,597.54
5,951.70
990.41
(612.34)
(718.76)
(732.92)
61.25
3,819.72
3,880.97
16,734.88
9,280.89
16,734.89
17.69
(10.94)
(12.84)
-
(11.74)
3.84
3.75
63.59
65.40
(20.03)
5.38
0.89
59.63
60.52
208.54
119.05
208.54
(0.46)
0.12
0.09
-
0.06
4,397.31
4,522.32
(1,384.88)
371.78
259.19
61.25
4,123.47
4,184.72
14,420.35
8,232.42
14,420.35
(31.49)
8.45
6.04
-
4.34
* Figures are as per Indian Accounting Standard (Ind AS)# Include �gures for the discontinued operations
** 1 USD = INR 69.15 as on 31.03.2019## Includes other income
*** Per Equity Share of Re.1.eachNote: Figures in brackets are negative numbers
(Rs. in million)
2010-11 *2016-17 2015-16 2014-15 2013-14 2012-13 2011-12 2009-10
USD **million
Particulars
Financial Performance Summary
Key Performance Indicators
Pro�tability Ratios
Shareholders Related Ratios
(Rs. in million)
Net Turnover
Total Income ##EBITDA
PBT
PAT
Total comprehensiveincome
Equity Share Capital
Reserves & Surplus/Other Equity
Shareholders' Funds
Total Liabilities
Net Fixed Assets
Total Assets
EBITDA Margin (%)
PBT Margin (%)
PAT Margin (%)
Equity Dividend
EPS (Basic & Diluted)*** (In Rs.)
265.70
#*2018-19 *2017-18
Financial Highlights

CHAIRMAN’S MESSAGE
Our endeavouris not only to addyears to Life...but Life to years

CHAIRMAN’S MESSAGE
07Panacea Biotec Ltd.
Dear StakeholdersAt Panacea Biotec, we believe in giving a chance for better health, a chance to live longer and live well. We, at Panacea Biotec, remain committed to affordable innovations that make a real difference in people's lives around the world. Our innovative p h a r m a c e u t i c a l p r o d u c t s a n d va c c i n e development program have consistently delivered Next Generation Vaccines and Pharmaceuticals.
At the outset, I am delighted to share with you that India Resurgence Fund (“IndiaRF”), promoted by Piramal Enterprises Limited and Bain Capital Credit, along with its affiliates have committed an investment of up to Rs.992 Crore (US$ 144 million) in the Company. This investment is structured by way of Non-Convertible Debentures (NCDs) of upto Rs.864 Crore (out of which NCDs worth Rs.743 Crore have been issued and allotted on April 8, 2019) and subscription amount of Rs.32 Crore towards share warrants allotted on a preferential basis. The subscription amount represents 25% of total amount of Rs.128 Crore proposed to be raised upon issuance of equity shares against warrants. Subject to exercise of warrants, IndiaRF (along with its affiliates) will collectively end up owning 10.4% stake in the Company on a fully diluted basis. The significant portion of the investment proceeds have been used for bilateral settlements with the existing lenders and the balance is being used for general working capital and growth requirements of the Company.
We are really delighted to partner with IndiaRF at this critical juncture in Panacea Biotec's journey. We look forward to leveraging their proven global expertise in restructuring and turnarounds, and are certain that our combined efforts will now help
accelerate our ambitious growth and profitability targets.
The Company's mission of becoming the world's leading biotechnology company offering widest range of innovative products and services to meet every healthcare need of mankind remains intact. We have taken several innovative measures such as consolidation and merger of our various business units to integrate efforts and optimize productivity, greater focus on R&D in priority areas, several measures towards increasing field force motivation, raising funds from IndiaRF to overcome working capital challenges, developing & commercializing best-in-class medicines and expanding our business operations in developed and emerging markets. Our motivation now is at its peak and we are fully geared to achieve improved financial performance in the coming years with launch of new products in the markets.
The Company's Pharmaceutical Formulations business registered revenues of Rs.348 Crore in FY2018-19 as against Rs.384 Crore in previous financial year. During the year, the performance was affected due to continued product shortages and working capital challenges. In the current year, the Company has already taken remedial measures and has seen improved performance in the business. As a result, during the first quarter of current fiscal, the Pharmaceutical Formulations business has earned revenues of Rs.97 Crore registering a growth of around 13% as against the revenues of Rs.86 Crore during corresponding quarter of the year under review.
The Company's Pharmaceutical Formulations business in India has been restructured during the current financial year and is now being managed

CHAIRMAN’S MESSAGE
by 4 Strategic Business Units (SBUs) - 2 SBUs for Super-Specialty Business viz. Transplantation & Immunology and OncoTrust and 2 SBUs for Acute & Chronic Care Business viz. Diacar Alpha and Procare.
The Company has entered into a tripartite agreement with Natco Pharma Ltd. and B r e c ke n r i d g e P h a r m a c e u t i c a l I n c . f o r manufacturing and supply of Azacitidine Injection for the US market under Breckenridge's already- approved ANDA. The commercial supplies have commenced during first quarter of the financial year 2019-20.
The Company's ANDA for Paclitaxel Protein bound particles for Injectable Suspension 100mg/vial has been accepted for filing by the USFDA. In addition, the approval process for other ANDAs filed earlier with the USFDA is in progress. The Company plans to launch these products in US, Europe, etc. through strategic collaborations with leading pharma companies.
The Company along with its partner, Apotex has entered into a Settlement Agreement with Celgene Corporation. As part of the Settlement Agreement, Panacea Biotec and Apotex have received a non-exclusive license under which Panacea Biotec may, through its partner Apotex, begin selling Panacea Biotec's generic version of Abraxane® in the US and its territories and also in certain jurisdictions outside of the US on mutually agreed-upon dates. As a part of the settlement, the Company has also received an amount of around Rs.21 Crore as its share of Litigation Avoidance Fee.
The Company's manufacturing facility located at Baddi completed 5 consecutive successful current Good Manufacturing Practices (cGMP) and pre-approval inspections by the USFDA.
The Company continues to focus on building a robust pipeline of several products for filing in several other emerging markets which it will be filing in the next 1-2 years and aims to improve the
accessibility and affordability of medicines as the Company's contribution to Government of India's “MAKE IN INDIA” mission.
The Company has received registration of Bendamustin (first oncology registration) in Syria and launched in-house developed product Sitcom (for hemorrhoids) in Zambia and Uzbekistan.
Panacea Biotec became one of the leading players in Vaccine therapeutic category in India and has earned revenues of Rs.96 Crore during FY 2018-19. Panacea Vaccine SBU has registered a strong y-o-y growth of 48% and has consistently improved its rank and market share in Vaccine therapeutic category since last 3 years.
The Company has in place a detailed strategic plan to achieve significant growth in near-term, medium-term and long-term. The key growth drivers would include scaling up of the existing products and launch of new products and penetrating into newer markets in both vaccines and pharmaceutical formulations business.
Panacea Biotec continues its efforts to make a s ign ificant d i f ference in l ives of people everywhere. It works closely towards the development of society, in line with its philosophy of creating happier and healthier society.
Although the future is full of unlimited possibilities for us, as an organization we have to innovate, integrate our efforts and organizational capabilities and continuously motivate to outperform. Let's all gear up and prepare for the better days ahead which is not very far away.
With these words, I express my sincere thanks to all our stakeholders, bankers, employees, partners, and associates for their unbroken support, participation and guidance which we continue to count on as we forge ahead towards our destination.
Best wishes
Soshil Kumar Jain
08 Annual Report 2018-19

09Panacea Biotec Ltd.
Panacea Biotec at a GlanceA leading research based pharmaceutical & biotechnology Company and pioneer in development of vaccines and pharmaceutical formulations with established brand equity since 1984.
1. Biospectrum KPMG Survey October 2016. 2. AIOCD AWACS MAT MARCH 2019. 3. Innovation Awards 2016 by Clarivative Analytics.
#4 1 in vaccines pharma company in#11
2 represented mkt. biotechnology#15
1 company in India
Amongst
Top 503Innovators In India
WHO pre-quali�ed for pentavalent vaccine and
bivalent oral polio vaccine (type 1 & 3)
TMEasySixst1 fully liquid wP
based Hexavalent Vaccine globally
Launched st1 Genericin India
PacliALL: Albumin bound paclitaxel
440+ Patents granted globally110+ applications under process

Pharmaceutical Formulations Facility, Baddi, Himachal PradeshPharmaceutical Formulations Facility, Baddi, Himachal PradeshPharmaceutical Formulations Facility, Baddi, Himachal Pradesh
Key Strengths• with signi�cant brand market share in respective therapeutic segmentStrong Product Portfolio
• with multi-disciplinary Research & Development centersEstablished R&D capabilities
• of promising niche products to fuel long term future growth Robust product pipeline
• – cGMP compliant and USFDA approvedState of the art manufacturing facilities
• providing end to end visibilityExtensive sales and distribution network
• with renowned National and International bodiesGrowing collaborations and alliances
• Highly experienced Promoters and Senior Management Team
1
2
3
4
5
6
7
8 • Global Footprint Signi�cant focus on exports

Management Discussion & AnalysisINDUSTRY STRUCTURE & DEVELOPMENTS
Global Vaccine Market
The global vaccine market is estimated at US$ 33.70 billion in 2018 and is expected to reach US$ 57.50 billion by 2025, growing at a CAGR of 7.9%. The key drivers for the growth will be high prevalence of diseases, increasing government initiatives towards immunization, rising adoption of vaccines, technological advancements in vaccine industry and strong pipeline for vaccines. Increasing epidemic potentials and growing focus on therapeutic vaccines will also offer signi�cant growth opportunities. The high costs associated with vaccine development, stringent regulations, longer timeline for vaccine development and product recalls may, however, impact the future growth to a certain extent.
North America accounted for largest share of vaccines market in 2017. The Asia-Paci�c vaccines market is expected to grow at a CAGR of 8.9%. The growth in the APAC market is mainly attributed to large patient pool, rising prevalence of diseases, growing awareness about health and vaccination, increasing government initiatives, expanding presence of key players and increasing disposable income in emerging countries.
Indian Vaccine Market
The Indian vaccine market was estimated at around Rs.69 billion in 2017 and is expected to grow to Rs.111 billion by 2022, at a CAGR of around 10%. Over the years, India has emerged as one of the leading manufacturers of vaccines worldwide, and supplies large quantities of basic and advanced vaccines across the globe. The Indian vaccine industry has been instrumental in facilitating cost effective vaccination in India and also export of vaccines to majority of the countries across the world. India has emerged as a global vaccine manufacturing hub and currently, more than two thirds of the total volume of the vaccines manufactured in India is exported while the rest is utilised in India. Indian vaccine industry supplies over 50% of global demand for various vaccines.
The strong growth of the market is expected on account of numerous factors including advancement in technology, signi�cant addition in vaccine production capacities along with cold chain storage facilities, the increasing investments in research and development by government funding agencies. The launch of the Universal Immunization Program (UIP) aimed at increased immunization coverage against vaccine preventable diseases in the country, has also signi�cantly added to the market growth. The advent of a number of privately owned entities in India has positively transformed the Indian vaccine industry. These entities have
been making efforts to bring low cost solutions and are increasingly shifting their focus on innovation so as to increase their revenues.
Indian biotechnology industry comprising vaccines, bio-pharmaceuticals, bio-services, bio-agriculture, bio-industry and bio-informatics is expected to grow at an average growth rate of around 30% a year and reach US$ 100 billion by 2025.
Global Pharmaceutical Market
As per industry estimates, the global pharmaceutical market is expected to exceed US$ 1.5 trillion by 2023 growing at a CAGR of around 6% and the key growth drivers will continue to be the US and the emerging economies with a CAGR of4-7% and 5-8%, respectively. The growth is largely expected from the expansion of existing therapies as well as the launch of novel therapies.
Global pharmaceutical markets are in the midst of major discontinuities. New products and losses of exclusivity will continue to drive similar dynamics across developed markets, while product mix will continue to shift to specialty and orphan products. The generics drug market in the United States is expected to reach to a level of US$ 112 billion by 2022. While growth in developed markets is expected to slow down, emerging markets will become increasingly important in the coming decade. The Indian pharmaceuticals market, along with the markets of China, Brazil and Russia, will spearhead growth within these markets.
Indian Pharmaceutical Market
The Indian Pharmaceutical Market (IPM) is one of the fastest growing markets globally, growing at a rate of around 10% p.a. Globally, IPM is the largest exporter of generics, by volume, with the total Indian pharma export market estimated at around US$ 19 billion, which is in addition to the domestic market of around US$ 20 billion.
Indian pharmaceutical industry supplies around 40% of generic demand in the US and 25% of all medicines in UK. Furthermore, India accounts for around 40% of generic drug approvals in the US, based on FY17 data, thereby indicating increasing relevance of India in the global pharma market. Currently, more than 10,000 companies/�rms of diverse size operate in India providing medication to a large population of around 1.3 billion.
The IPM is expected to expand at a CAGR of 22.4% over 2015–20 to reach US$ 55 billion. The growth will be characterised by increasing prevalence of chronic diseases, strong growth in GDP and incomes, rising healthcare awareness, increasing insurance coverage, and increasing government and private sector spending on healthcare
11Panacea Biotec Ltd.

12 Annual Report 2018-19
apart from steady rise in disease prevalence and acceptability of modern medicines & newer therapies. The country also has a large pool of scientists and engineers who have the potential to steer the industry ahead to an even higher level. Moreover, the Ayushman Bharat - National Health Protection Scheme (NHPS), recently launched by Government of India, with a vision to provide insurance cover to an estimated 500 million individuals from nearly 100 million poor and �nancially vulnerable families to address the gap in the common man's access to reliable healthcare, is also a valuable opportunity to contribute towards delivering health at reasonable costs. The Indian government has allocated US$ 915 million towards NHPS in the Interim Budget for FY 2019-20, a 167% increase from the US$ 343 million in FY 2018-19.
PANACEA BIOTEC BUSINESS SEGMENTS
PHARMACEUTICAL FORMULATIONS
Panacea Biotec has leading brands in therapeutic areas such as Organ Transplantation, Vaccine, Diabetes Management, Pain, Cough & Cold and Gastroenterology and has a signi�cant presence in Osteoporosis and Oncology in the Indian Pharmaceutical Market.
thPanacea Biotec has attained 10 position in its represented Therapeutic Market and is also amongst the Top 60 Pharmaceutical Companies in the Indian Pharmaceutical Market as per the AIOCD AWACS (MAT March 2019) sales data.
The Company's leading brands are well recognized and respected by the medical fraternity and command signi�cant market share in their respective Covered Market (CVM). As per the AIOCD AWACS (MAT March 2019) sales data, the Company's top selling brands viz., PanGraf, Panimun Bioral, Alphadol and Fosbait are ranked number 1 and Glizid, Glizid-M, Glizid-MV, Mycept, Mycept-S, Sitcom and Nimulid are amongst the top 5 brands in their respective covered markets.
thWith 180 rank, Glizid-M features among the Top 200 brands in Indian Pharmaceutical Market as per the AIOCD AWACS (MAT March 2019) sales data.
As per the AIOCD AWACS (MAT March 2019) sales data, the Company's rank in respective therapeutic category covered markets in India is as follows:
As per the AIOCD AWACS (MAT March 2019) sales data, the
Company's key brands performance in respective covered markets and their market ranking in India are as follows:
The Company's Pharmaceutical Formulations business registered revenues of Rs.3,479.41 million in FY2018-19 as against Rs.3,839.14 million in previous �nancial year.
During the year, the Company's performance was affected due to continued product shortages and working capital challenges. In the current year, the Company has already taken remedial measures and has seen improved performance in the business. As a result, during the �rst quarter, the Pharmaceutical Formulations business earned revenues of Rs.969.47 million registering a growth of around 13% as against the revenues of Rs.857.41 million during corresponding quarter of the year under review.
The Company has increased its footprint in international markets and is currently in the process of launching additional new products across different countries such as US, CIS countries, Brazil, Middle-East and other emerging South-East Asian Countries.
On March 25, 2019, as a part of business reorganization, the Company has decided to transfer its Pharmaceutical Formulat ions business including pharmaceutical formulations facility at Baddi, Himachal Pradesh and related research & development activities and natural products extraction activities of the Company to its wholly-owned subsidiary, Panacea Biotec Pharma Limited on a going concern basis through slump sale, with an objective to segregate the different businesses of the Company to ensure smooth functioning of each business in the future.
Domestic Pharmaceutical Formulations
The Company's Pharmaceutical Formulations business in India has been restructured during the current �nancial year and is being managed by 4 Strategic Business Units (SBUs) - 2 SBUs for Super-Specialty Business viz. Transplantation & Immunology and OncoTrust and 2 SBUs for Acute & Chronic Care Business viz. Diacar Alpha and Procare.
As per AIOCD AWACS (MAT March 2019) sales data,
3Sitcom Varicose Therapy, Systemic
(Haemorrhoids/ Piles management)
3Mycept-S Mycophenolate Mofetil
3Glizid-MV Voglibose + Metformin + Gliclazide
4Glizid Gliclazide
Brands Brand Rank in CVM
CVM
Pangraf 1Tacrolimus
Panimun Bioral 1Cyclosporine
Alphadol 1Alfacalcidol
Fosbait 1Lanthanum Carbonate Mycept 2Mycophenolate Mofetil
Nimulid 2NimesulideGlizid-M Gliclazide + Metformin 3
Therapeutic Category Rank in CVM
PBL Rank in CVM 10
Anti-Neoplastics 3
Anti-Diabetic 18
Gastro Intestinal 8
Pain / Analgesics 8
Blood Related 9
13Panacea Biotec Ltd.
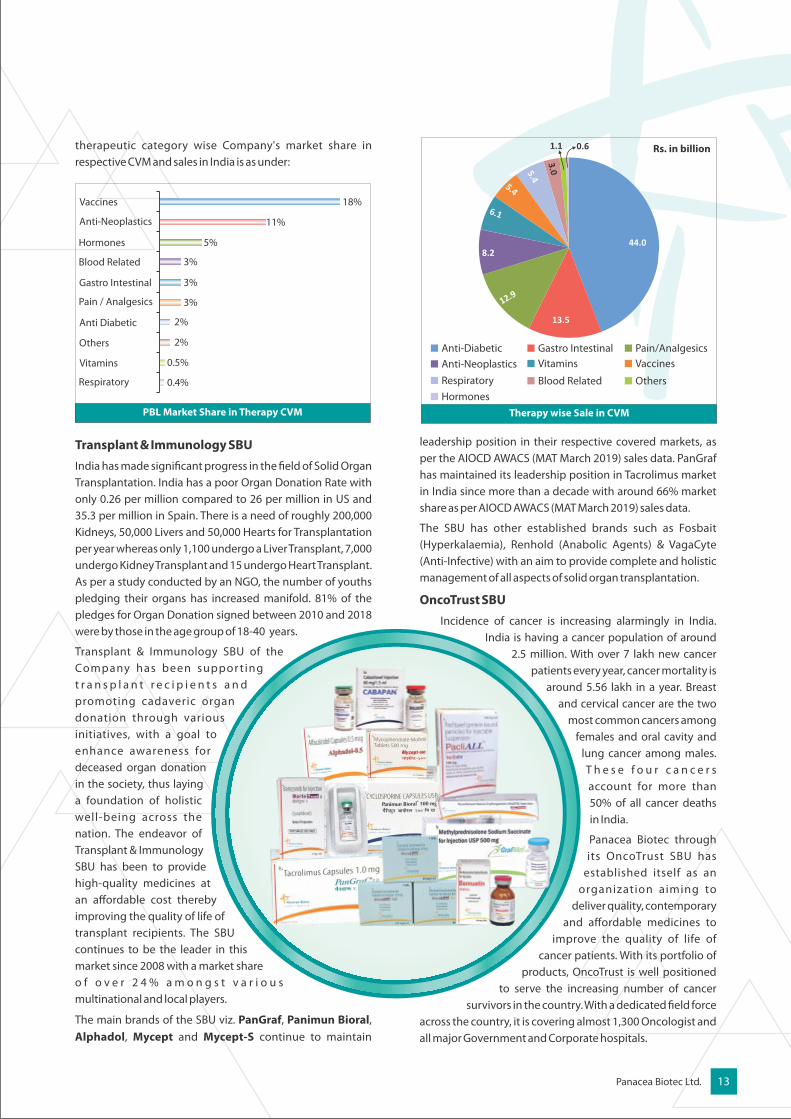
therapeutic category wise Company's market share in respective CVM and sales in India is as under:
Transplant & Immunology SBU
India has made signi�cant progress in the �eld of Solid Organ Transplantation. India has a poor Organ Donation Rate with only 0.26 per million compared to 26 per million in US and 35.3 per million in Spain. There is a need of roughly 200,000 Kidneys, 50,000 Livers and 50,000 Hearts for Transplantation per year whereas only 1,100 undergo a Liver Transplant, 7,000 undergo Kidney Transplant and 15 undergo Heart Transplant. As per a study conducted by an NGO, the number of youths pledging their organs has increased manifold. 81% of the pledges for Organ Donation signed between 2010 and 2018 were by those in the age group of 18-40 years.
Transplant & Immunology SBU of the Company has been suppor t ing t r a n s p l a n t r e c i p i e n t s a n d promoting cadaveric organ donation through various initiatives, with a goal to enhance awareness for deceased organ donation in the society, thus laying a foundation of holistic well-being across the nation. The endeavor of Transplant & Immunology SBU has been to provide high-quality medicines at an affordable cost thereby improving the quality of life of transplant recipients. The SBU continues to be the leader in this market since 2008 with a market share o f o v e r 2 4 % a m o n g s t v a r i o u s multinational and local players.
The main brands of the SBU viz. PanGraf, Panimun Bioral, Alphadol, Mycept and Mycept-S continue to maintain
leadership position in their respective covered markets, as per the AIOCD AWACS (MAT March 2019) sales data. PanGraf has maintained its leadership position in Tacrolimus market in India since more than a decade with around 66% market share as per AIOCD AWACS (MAT March 2019) sales data.
The SBU has other established brands such as Fosbait (Hyperkalaemia), Renhold (Anabolic Agents) & VagaCyte (Anti-Infective) with an aim to provide complete and holistic management of all aspects of solid organ transplantation.
OncoTrust SBU
Incidence of cancer is increasing alarmingly in India. India is having a cancer population of around
2.5 million. With over 7 lakh new cancer patients every year, cancer mortality is
around 5.56 lakh in a year. Breast and cervical cancer are the two
most common cancers among females and oral cavity and
lung cancer among males. T h e s e f o u r c a n c e r s account for more than 50% of all cancer deaths in India.
Panacea Biotec through its OncoTrust SBU has
established itself as an organization aiming to
deliver quality, contemporary and affordable medicines to
improve the quality of life of cancer patients. With its portfolio of
products, OncoTrust is well positioned to serve the increasing number of cancer
survivors in the country. With a dedicated �eld force across the country, it is covering almost 1,300 Oncologist and all major Government and Corporate hospitals.
PBL Market Share in Therapy CVM
Vaccines
Anti-Neoplastics
Blood Related
Gastro Intestinal
Others
Anti Diabetic
Vitamins
Pain / Analgesics
Hormones
Respiratory
18%
11%
5%
3%
3%
3%
2%
2%
0.5%
0.4%
Therapy wise Sale in CVM
Gastro IntestinalVitamins
Blood Related Others
VaccinesPain/AnalgesicsAnti-Diabetic
Anti-NeoplasticsRespiratoryHormones
44.0
13.5
12.9
8.2
6.1
5.4
5.4
3.0
1.1 0.6 Rs. in billion

14 Annual Report 2018-19
Panacea Biotec was the �rst Indian Company to launch PacliALL a brand of nab Paclitaxel, for the management of Breast Cancer. PacliALL, the �agship brand of the Company, which was awarded with Brand of the Year Award 2011 by Bio-Spectrum, continues to be No.1 brand in nab-paclitaxel market and has saved the lives of more than 7,000 patients till now, and is one of the most admired brands for the treatment of breast cancer.
The other major brands of the SBU include Bemustin ( B e n d a m u s t i n e H y d r o c h l o r i d e ) , DoceTrust (Docetaxel Trihydrate), GemTrust ( G e m c i t a b i n e H y d r o c h l o r i d e ) a n d BorteTrust (Bortezomib) injections.
Diacar Alpha SBU
As per industry estimates, the Indian Diabetes Market was valued at around US$ 1.60 billion in 2017. India is considered as the diabetes capital of the world with over 75 million diagnosed diabetics. Diabetes today has emerged as one of the most important risk factors for mortality and often affects other vital organs of the body like heart, eyes, kidneys, brain and nerves. The major reasons of increasing diabetes incidence in India include increasing obesity, rising stress levels and absence of proper physical exercise. The growing awareness regarding the symptoms of diabetes and its adverse health effects have largely intensi�ed the diagnosis and drug treatment rates in the country. This is the major growth-driving factor for the diabetes market in India. In future, the Diabetes market is expected to exceed US$ 4.2 billion by 2023.
With a dedicated marketing and sales team of more than 350 people, Diacar Alpha SBU focuses on specialties such as Endocrinologists, Diabetologists, Cardiologists and Physicians in a �ercely competitive anti-diabetic market. Diacar Alpha SBU has around 24% market share as per the AIOCD AWACS (MAT March 2019) sales data.
The �agship brands of Diacar Alpha SBU, Glizid-M, Glizid and Glizid-MV are amongst top 5 brands in its market segment. Glizid-M is ranked at No. 180 amongst the Top 200 brands in the Indian Pharmaceutical Market.
Procare SBU
Procare SBU continues to focus in the acute and chronic care segment having increasing incidence of chronic disorders such as osteoarthritis and osteoporosis alongside lifestyle acute disorders like piles, constipation and acid peptic disorders through its established brands and engagement
with Consulting Physicians, Orthopedic, Gastroenterologists and General Surgeons.
The chronic diseases management drugs market in India is valued at around Rs.427 billion. The Gastro-
rdintestinal is the 3 largest therapy valued at around Rs.149 billion contributing
1 1 . 3 8 % t o t h e I n d i a n Pharmaceutical Market as per
AIOCD AWACS (MAT March 2019) sales data and is
growing at 8.8% on MAT basis.
The Procare SBU has established its �agship b r a n d s S i t c o m a n d Livoluk amongst the top 5 b r a n d s i n t h e i r
respective CVM as per the AIOCD AWACS (MAT March
2019) sales data.
The SBU has anti-in�ammatory and muscle relaxant products
including Willgo CR (Aceclofenac 200mg SR), Willgo P (Aceclofenac
100mg, Paracetamol 325mg), Willgo TH4 & Willgo TH8 (Aceclofenac & Thiocolchicoside Tablets)
and Willgo SP (Aceclofenac 100mg, Serratiopeptidase 15mg as enteric coated granules and Paracetamol 325mg) intended for Pain Management in patients suffering from Rheumatoid Arthritis and Arthritis.
CUBE SBU
The Capacity Utilization & Business Enhancement (CUBE) SBU is playing an important role in the Company's overall pharmaceutical business. The SBU aims to enhance capacity utilization by exploring contract manufacturing operations for third party products. As a strategic policy, the Company has decided to discontinue out-licensing of its own products to third parties in a phased manner and focus more on in-licensing of third party products for US and other international markets.
International Pharmaceutical Business
The Company exports its pharmaceutical formulations in around 30 countries including US, Germany, Russian Federation, Turkey, Tanzania, Kenya, Syria, Serbia, Vietnam, Philippines, Sri Lanka, Panama and Ecuador etc. The Company has taken necessary steps to strengthen and grow its exports in the coming years including strengthening marketing team, entering into newer markets, registering products in more countries as well as strengthening existing relationships with the partners. The Company has further continued its focus on development, registration and marketing of products portfolio catering to chronic therapies in private markets in several countries. Simultaneously, the
15Panacea Biotec Ltd.
Company has consolidated its international pharmaceutical business by eliminating loss making products, markets etc.
During the year, the revenues from exports have been Rs.894.88 million. The Company has improved sale of Rizatriptan Oral Dispersible Tablets and Prasugrel HCL in US markets through strategic partners in US. The Company faced supply challenges from the raw material supplier of tacrolimus because of which it could not sustain and improve the sales of tacrolimus in the US and other international markets.
The Company has entered into a tripartite agreement with Natco Pharma Ltd. and Breckenridge Pharmaceutical Inc. for manufacturing and supply of Azacitidine Injection for the US market under Breckenridge's already-approved ANDA (the generic equivalent of Vidaza® marketed by Celgene Corp, US). The commercial supplies have commenced during �rst quarter of the �nancial year 2019-20.
The Company's Abbreviated New Drug Application (ANDA) submitted under section 505(j) of the Federal Food, Drug & Cosmetics Act (FD&C Act) for Paclitaxel Protein bound particles for Injectable Suspension 100mg/vial has been accepted for �ling by the U.S. Food and Drug Administration (USFDA). In addition, the approval process for other ANDAs �led earlier with the USFDA is in progress. The Company plans to launch these products in US, Europe, etc. through strategic collaborations with leading pharma companies.
During the year, the Company along with its partner, Apotex Inc. and Apotex Corp. (Apotex) has entered into a Settlement Agre e m e n t w i t h Ce l g e n e Co r p o r a t i o n , a g l o b a l biopharmaceutical company headquartered in US and its
subsidiary Abraxis BioScience, LLC, for settlement of disputes regarding patents covering Abraxane® drug product and the Company's ANDA for paclitaxel protein bound particles for injectable suspension, 100mg/vial, a generic version of Abraxane®. As part of the Settlement Agreement, Panacea Biotec and Apotex have received a non-exclusive license under which Panacea Biotec may, through its partner Apotex, begin selling Panacea Biotec's generic version of Abraxane® in the US and its territories on a mutually agreed-upon date, and also in certain jurisdictions outside of the US on a mutually agreed-upon date. As a part of the settlement, the Company has also received an amount of Rs.206.59 million as its share of Litigation Avoidance Fee.
During the year, the Company's manufacturing facility located at Baddi completed 5 consecutive successful current Good Manufacturing Practices (cGMP) and pre-approval inspections by the USFDA. The Company's oral solid dosage manufacturing facility and oncology facility at Baddi, Himachal Pradesh have been found consistently complying with the Good Manufacturing Practices.
The Company continues to focus on building a robust pipeline of several products for �ling in several other emerging markets which it will be �ling in the next 1-2 years and aims to improve the accessibility and affordability of medicines as the Company's contribution to Government of India's “MAKE IN INDIA” mission.
The Company has received the registration of Bendamustin (�rst oncology registration) in Syria and launched in-housed developed product Sitcom (for hemorrhoids) in Zambia and Uzbekistan.
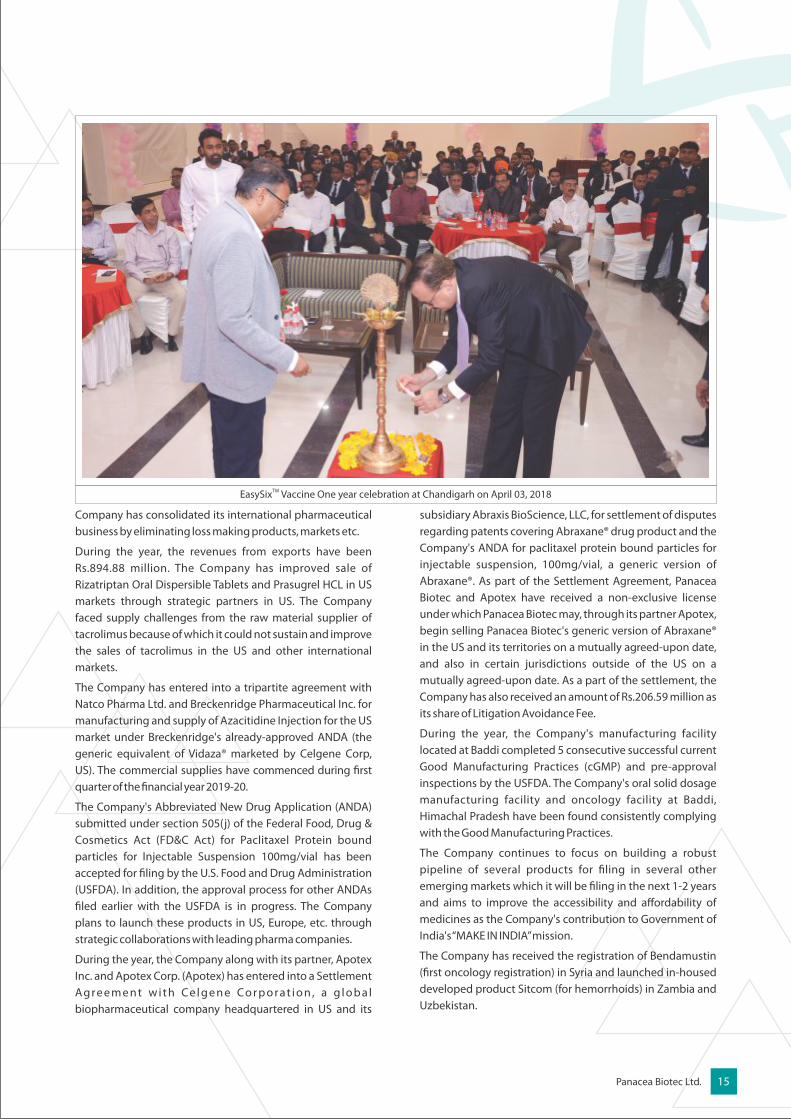
TMEasySix Vaccine One year celebration at Chandigarh on April 03, 2018

16 Annual Report 2018-19
VACCINES BUSINESS
Panacea Biotec continues to focus on vaccines as a core business segment. The Company has pioneered in development of wP based fully liquid combination vaccines and has launched world's �rst fully liquid wP-IPV based
TMhexavalent vaccine EasySix (Diphtheria, Wholecell Pertussis, Tetanus, Hepatitis B, Hib and IPV) and tetravalent vaccine Easyfour-TT (Diphtheria, Wholecell Pertussis, Tetanus and Hib) in India in March 2017 and December 2016, respectively. Earlier the Company had launched �rst time in the world fully liquid pentavalent vaccine Easy�ve-TT (Diphtheria, Wholecell Pertussis, Tetanus, Hepatitis B and Hib), bivalent Oral Polio Vaccine (bOPV) and Monovalent Oral Polio Vaccine (mOPV) (Type I & Type III).
Panacea Biotec has played a pivotal role in eradication of polio disease from India and many other countries by having supplied over 10 billion doses of OPV to UNICEF/Govt. of India/Pan American Health Organisation (PAHO) etc. in the last 2 decades. The Company has been supplying bOPV to Govt. of India from its Baddi vaccine plant. During the year, the revenues from vaccines business has been Rs. 962.10 million.
The Company has a strategic collaboration with Serum Institute of India Pvt. Ltd. (“SII”) under which, (a) SII will ensure supply of IPV bulk, an important constituent of hexavalent
TMvaccine, EasySix to the Company from its wholly owned subsidiary, Bilthovan Biologicals B.V., The Netherlands; (b) SII is also entitled to manufacture & sell hexavalent vaccine; and (c) the Company and SII will work together to get t h i s H e x a v a l e n t V a c c i n e introduced in the developing countries by working closely with key stakeholders including national governments, WHO, GAVI, Bill and Melinda Gates Foundation and other United Nation Agencies, etc.
As a part of the long-term growth strategy, the Company is now expanding its sales of hexavalent
TMvaccine EasySix in India and is expediting development of other critical vaccines including the pneumococcal and dengue vaccine which are expected to be launched during the year 2022.
Panacea Vaccines SBU
Domestic Vaccine market in India is estimated to be Rs.21.27 billion in FY 2018-19. Panacea Biotec is one of the leading players in Vaccine therapeutic category in India. The Company's Vaccine Business in India is managed by Panacea Vaccines SBU. Panacea Vaccine has registered a strong Y-O-Y growth of 48% as per AIOCD AWACS (MAT March 2019) sales
data and has consistently improved its rank and market share in Vaccine therapeutic category since last three years.
Panacea Biotec continues to protect millions of infants across India from diseases that could otherwise be life threatening. The SBU has expanded its reach to nearly around 15,000 pediatricians spread across India with a �eld force strength of about 130. Panacea Vaccine SBU has improved its market ranking to No. 3 in its covered market as per AIOCD AWACS (MAT March 2019) sales data.
Innovation is proven to be the backbone for Panacea Biotec, which helped the SBU to outperform in Vaccine therapeutic category. The Company's innovative Vaccine brand
TMEasySix , world's �rst fully liquid wP-IPV based Hexavalent Vaccine (DTwP-HepB-Hib-IPV), is one the most phenomenal success for Panacea Biotec in the Indian Vaccine Industry. As per AIOCD AWACS (MAT March 2019) unit sales data,
TMEasySix became the market leader in hexavalent vaccine market in India and is expected to maintain its market leader position along with strong growth.
th TMWith 204 rank, EasySix features among the Top 250 brands in Indian Pharmaceutical Market as per the AIOCD AWACS (MAT March 2019) sales data.
The other major brands in the SBU's brand portfolio include Easy�ve-TT (DTwP-HepB-Hib) and
E a s y fo u r -T T (DTwP-H ib) . Panacea Vaccines is the only vaccine SBU which
has the wP based ful ly l iquid t e t r a v a l e n t , p e n t a v a l e n t &
hexavalent vaccines in India. TMThe �agship brand EasySix is
ranked among the Top 2 new launches in IPM as per AIOCD AWACS (MAT March 2019) sales data and also attained No. 1 rank
in units sale in the hexavalent vaccine category with market
share of 37% as per the AIOCD AWACS (MAT March 2019) sales data.
International Vaccines Business
Panacea Biotec supplies its vaccines to UNICEF, PAHO & other governments of several countries and
also sells in the private market through tie-ups with established industry players in various countries. The Company has registered its vaccines in around 16 countries with further registrations in around 9 countries expected in the near future. The Company is targeting to enter emerging markets with sizeable birth cohort (3-5 mn) to expand business.
Panacea Biotec is supporting global cause of providing affordable vaccines to the children across the globe. The Company is a member of Developing Countries Vaccine Manufacturers Network (DCVMN), a public health driven,

international alliance of manufacturers, and shares common vision and mission of combating infectious diseases and accelerating access to affordable high-quality vaccines.
Supply Chain Management & Logistics Network
Panacea Biotec has a well-established Supply Chain Management (SCM) system designed for creating end-to-end visibility and controls right from sourcing of materials till collection of receivables for both the pharmaceuticals and vaccines products.
The Company has a strong logistics network comprising of 2 Central Warehouse and 25 sales depots/Carrying & Forwarding Agents (CFAs) (comprising of Pharma Sales Depots/CFAs & Vaccine CFAs). Product availability across India is done through vast distributor network of 1,500 distributors for pharmaceutical formulations and 385 distributors for vaccines.
The Company has got expertise in cold chain management for storage and distribution of vaccines under controlled conditions using a system of Vaccine Vial Monitors (VVMs), data loggers, Ice boxes, coolant, cold rooms, refrigerated vehicles and Tyvek sheet for sending temperature controlled products overseas and across India directly from its Vaccine Formulation Facility at Baddi, H.P. This ensures that the Vaccines remain safe and effective against changes in the variant temperature conditions during transit. The SCM team is committed to ensure timely availability of Company's products to its business partners and patients.
The Company has strengthened its Track and Trace System and documentation quality to ensure that goods reach destination timely and to avoid demurrage and detention charges. The Company has optimized raw material, packaging material, �nished good inventory to achieve
maximum inventory turn and to minimize expiry. The Company is continously providing training to SCM team on good distribution practices to meet emerging requirements of domestic and international markets.
MANUFACTURING FACILITIES
Panacea Biotec has state-of-the-art cGMP compliant integrated facility for manufacturing drug substances for vaccines and biosimilars at Lalru in Punjab and for manufacturing vaccines and pharmaceutical formulations at Baddi, Himachal Pradesh. The manufacturing facilities have been set up in compliance with international regulatory standards including USFDA, WHO cGMP and European Union standards.
The Company's manufacturing expertise lies in various oral solid, semi-solid, cytotoxic injectable, liquid oral dosage forms and vaccines such as:
• Oral-solids - conventional tablets/capsules, controlled/ delayed release/enteric coated tablets and capsules, tablet in tablet, tablet in capsule, multi layered tablets, hard gelatin/soft gelatin capsules, mouth dissolving/ chewable tablets, beads encapsulation, coating (�lm, sugar & functional), taste masking and fast-dissolving tablets;
• Semi-solids - ointments/creams/gels, transdermal drug delivery system;
• Liquids - suspensions/syrups/solutions;
• Vaccines – recombinant, bacterial, viral, combination formulations, cell culture; and
• Cytotoxic - injectable.
Pharmaceutical Formulations Facility at Baddi
The Company's state - of-the -ar t pharmaceuticals formulations facility at Baddi, Himachal Pradesh became
17Panacea Biotec Ltd.
ndDr. Rajesh Jain, Managing Director at 2 CII National Biotechnology Conclave at New Delhi on November 22, 2018

operational in year 2006. The facility has been audited by Indian NRA, USFDA, Health Authority Saarland, Germany and Envisa of Brazil, etc.
The Company's cytotoxic injectable formulation facility at Baddi, Himachal Pradesh, has two lines dedicated for liquid & lyophilized vials as well as pilot scale up batches. Oncology facility is equipped for manufacturing conventional and technology based injections e.g. nano-particle and liposomal lyophilized products.
Vaccines Formulation Facility at Baddi
The Company's state-of-the-art vaccines formulations facility at Baddi, Himachal Pradesh which started its operations in year 2008 is comprised of two blocks.
The facility has two independent formulation suites and three �lling lines for manufacturing of bacterial, viral and recombinant Vaccines including live attenuated vaccines in pre-�lled syringe (PFS) and multi-dose and single dose vial presentations. The facility has large lyophilization capacity for lyophilized vaccines in vials. This facility is approved and pre-quali�ed by WHO for pentavalent vaccine Easy�ve-TT & bOPV. The facility is licensed to produce 12 vaccines in different presentations for Indian and export markets.
The warehouse facility is equipped with cold storage and deep freezer for cold chain maintenance and dispatch management of vaccines.
Quality control laboratories of the facility are equipped with assortment of latest sophisticated analytical equipment for testing of vaccines and input materials to assure quality of the product at each stage of manufacturing.
Drug Substance & Biosimilar facility at Lalru, Punjab
The Company has manufacturing facilities with blocks for manufacture of recombinant, bacterial and viral vaccine drug substance. An integrated block for vaccines and biopharmaceuticals is also established which comprises of three independent suites dedicated for manufacture of:
a) bacterial vaccines,
b) viral vaccines, and
c) recombinant e.g. biosimilar molecules on cell culture in both conventional as well as disposable formats.
Recombinant Hepatitis B surface antigen, Haemophilus in�uenza type B conjugate (Hib-TT), Diphtheria, Tetanus Toxoids and whole cell Pertussis drug substance are manufactured at these facilities. The facilities have been approved by Indian NRA and WHO. During the year, the Company has consolidated the drug substance for vaccine manufacturing operations into itself which was earlier being carried on by its Associate Company, PanEra Biotec Pvt. Ltd.
RESEARCH & DEVELOPMENT
Research & Development is one of the core strengths of Panacea Biotec. With its state-of-the-art R&D Centers manned with around 50 quali�ed and experienced scientists committed towards solving the world's problems by developing high quality and innovative drugs, the Company has built a strong R&D infrastructure to support its business segments - drug discovery, vaccines, pharmaceutical formulations and biosimilars. The Company is working on several key projects in NCEs, APIs, pharmaceutical formulations, biopharmaceuticals and vaccines. All the R&D centers are recognized by the Department of Scienti�c and Industrial Research (DSIR) of the Govt. of India.
During the year, with a view to optimize costs and resources, the Global Research and Development (GRAND) Center at Navi Mumbai has been relocated and merged into Sampann R&D Center at Lalru, Punjab and the OneStream Research Centre at New Delhi and Laksh Drug Discovery R&D Center at Mohali have been shifted to Lalru, Punjab.
The Company continues to focus on Research & Development in the �elds of:
(I) Oncology, Organ Transplantation, CNS and hormonal products amongst others for the global markets. In this area, the capabilities include delivery conceptualization
SAMPANN Drug Delivery Research and Development Centre, LalruSAMPANN Drug Delivery Research and Development Centre, LalruSAMPANN Drug Delivery Research and Development Centre, Lalru

19Panacea Biotec Ltd.
to pharmaco-kinetic (PK) proof of concept in areas of nano-particles, liposomes, micro-particles, gastro retention and oral �lms;
(ii) pharmaceutical research using different innovative technologies like hydro gel based topical drug delivery system of peptides and herbal drugs, solid-solid dispersion for highly variable drugs, self-emulsifying drug delivery system (SEDDS) and controlled release drug delivery systems in different therapeutic areas;
(iii) new chemical entities (NCEs, small molecules) and API Research (developing non-infringing API processes for NCEs and generic products for captive consumption); and
(iv) novel and efficacious vaccines and biologicals against various epidemic/endemic diseases for global market.
The Company's Sampann R&D Centre at Lalru is in advanced stage of development of new products for domestic & ROW markets in the therapeutic segments of immuno-suppressant, diabetes, pain management and oncology, etc.
In the �eld of NCE Research, the Company has successfully developed three pre-clinical candidates (PCCs), two of which are currently under investigation for IND (Investigational New Drug) �ling at different stages of phase I studies in India. In diabetes, phase I trials of one of the NCEs for IR (immediate release) have been completed and the Company has developed a formulation resulting in convenient dosing regimen for better compliance by the patient. The other NCE is undergoing phase I directed safety evaluation. New areas in diabetes are being explored.10 PCT applications and more than 50 patent applications in national phases have been �led by the Company in respect of NCE Research out of which many patents have already been granted in the US (5), Europe (4), India (2) Japan (1), Russia (1) and China (1).
With regard to the vaccine development, the Company focuses on providing cost effective products and process development complying with all regulatory requirements. The R&D activities are dedicated to carry out research in vaccines using advanced genetic engineering, molecular biology, genomics tools, animal cell culture, fermentation, puri�cation, serological and analytical techniques. Vaccine R&D Center has an excellent portfolio of innovative pediatric vaccines which protect children against dreadful diseases. Further to broaden the presence of Panacea Biotec in the market, the Vaccine R&D is developing the new generation vaccines like typhoid conjugate, pneumococcal conjugate and tetravalent dengue vaccine. Other vaccines which are in the pipeline include Sabin Inactivated Polio vaccine (sIPV), Tetanus vaccine, Varicella vaccine and fully indigenous wP based pentavalent vaccine.
Clinical Research
Clinical research is a critical function that guides clinical decisions based on facts and scienti�c data through clinical
studies on drugs that can affect the health and well-being of millions of people.
Phase I/II Studies on novel Tetravalent Dengue Vaccine & Phase I Studies on 11 Valent Pneumococcal Conjugate Vaccine have already begun. Subsequently, Phase III Studies on these Vaccines will be carried out in near future. Clinical Dossier for Phase I Typhoid Conjugate Vaccine has been submitted with the Indian NRA.
In the pharmaceutical domain, bio-equivalence (BE) studies with respect to Cyclosporine Capsules have been successfully completed during the year. Additional BE studies for international markets with respect to Tacrolimus ER, Everolimus, Mycophenolate Suspension, Vildagliptin & Vildagliptin Metformin Combination are slated to be carried out during the current �nancial year.
During the year, the Company has received approval from Indian NRA for conducting Phase III clinical trials on pharmaceutical formulations of Sitcom + Lidocaine ointment and Aceclofenac ointment. Active Pharmaco-vigilance Surveillance Study involving Pediatric Combination Vaccines
TMsuch as Easyfour-TT & EasySix are being carried out during the current �nancial year.
Intellectual Property
The Company has a strong portfolio of intellectual property in the form of patents, trade marks and copy rights. As on March 31, 2019, Panacea Biotec has been granted 448 patents including 65 patents in India for different formulation products/new drug delivery technologies/new chemical entities etc. The Company has 114 patent applications under processing including 22 patent applications in India as on that date.
The Company has been grated 848 trademark registrations out of which 383 have been registered outside India. In addition, the Company has 199 trademark applications pending for registration including 96 applications �led in international markets. The Company has 167 registered copyrights as on March 31, 2019.
Human Resources
The Company thrives to provide a long and rewarding career to its talented and diverse workforce and focuses on their all-round development and growth. At Panacea Biotec, the employees are the core strength of its continuing growth in all the segments. The Company believes that its employees are pivotal to all the initiatives that drive the growth of the business and thus the growth of the people and the business is a simultaneous process. Accordingly, the Company has created a work culture representing a unique mix of its values and functional expertise.
As on March 31, 2019, the Company has a total manpower of around 2,600 employees (including around 350 employees through contractors). There are around 50 scientists engaged in R&D Centers, around 675 employees engaged in Production, Quality Control & Quality Assurance and around 1,000 employees engaged in Logistics, Sales & Marketing.

20 Annual Report 2018-19
The Human Resources team continuously works towards getting talented people onboard thereby establishing strong brand image of the organization. The team also aims to become progressive and employee centric and has conducted several employee engagement activities across locations like New year celebration, Dussehra, Diwali, Christmas, Baisakhi, Lohri, Holi, etc. leading to increased job satisfaction, efficient working and ethical organizational culture.
Information Technology
Panacea Biotec uses fully integrated SAP System as its Enterprise Resource Planning System. Sales and marketing team uses Sales Force Automation Platform for effective tracking & analysis of actual �eld force activities against plans and tracking of secondary sales of our stockiest. The Company aims to bring data, analytics and insights to sales & marketing teams to set up an analytics-driven marketing operations leveraging technology to offer targeted content experiences for health professionals and patients and make their interactions with the customers more personalized.
The Company has installed various tools to protect its network and data from external threats and has upgraded the �rewall and intrusion protection architecture to enhance the network security. The Company is now working to transform its enterprise IT Infrastructure to implement best practices in Network Security to make its IT Infrastructure highly secure to prevent any kind of cyber security risks to business continuity, and also improve its capabilities to quickly detect, investigate and remediate any kind of security breaches.
Internal Audit & Internal Financial Control System
Panacea Biotec has a comprehensive internal control system that commensurate with its size and nature of operations. These cover all manufacturing and research & development facilities, warehouses & sales offices besides corporate office.
The internal �nancial controls have been developed and implemented at each business process level across the Company. The user level responsibilities are constantly shared with key users for their implementation and compliance. Checks & balances and control systems have been established to ensure that assets are safeguarded, utilized with proper authorization and recorded in the books of account. There is a proper de�nition of roles and responsibilities across the organization to ensure information �ow and monitoring.
Further, internal audits are conducted periodically by
independent Chartered Accountant �rms. The Audit Committee actively reviews the adequacy and effectiveness of internal controls, internal audit systems and advises improvements as may be required. Post audit follow-ups are carried out to ensure identi�ed risks are addressed and recommendations of the Audit Committee are implemented.
The Company has established and maintained adequate and effective internal �nancial controls over �nancial reporting (IFCoFR) in accordance with the framework, which includes policies and procedures adopted by the Company for ensuring the orderly and efficient conduct of its business, including adherence to the Company's policies, safeguarding of its assets, the prevention and detection of fraud and errors, the accuracy and completeness of the accounting records, and timely preparation of reliable �nancial information.
FINANCIAL PERFORMANCE
Summarized Balance Sheet
Shareholders' Funds: The Company's Shareholders' funds were Rs.4,184.72 million as at March 31, 2019 as compared to Rs.3,880.97 million as at March 31, 2018.
Non-current Liabilities: Non-current liabilities include long-term borrowings (excluding current maturities), provisions and other non-current liabilities. The non-current liabilities as at March 31, 2019 were Rs.1,258.23 million (including Rs.1,024.77
Particulars As at March31, 2018
Equity & Liabilities:
Shareholders’ Funds
Non-current liabilities
Current liabilities
Total Liabilities
Assets:
Fixed assets
Financial assets
Other non-current assets
Current assets
Asset classi�ed as held for saleand discontinued operations
Total Assets
As at March31, 2019
(Rs. in million)
4,184.72
1,024.77
7,010.67
14,420.35
4,995.42
40.56
223.30
1,084.55
8,076.52
14,420.35
3,880.97
6,001.24
6,852.67
16,734.88
9,280.89
3,461.21
456.27
3,536.51
-
16,734.88
Liabilities directly associatedwith discontinued operations
2,200.19 -

21Panacea Biotec Ltd.
for continuing operations and Rs.233.46 million pertaining to discontinued operations) as against Rs.6,001.24 million as at March 31, 2018. The same have been declined mainly on account of decrease in long-term borrowings due to reclassi�cation of the ECB and other long-term bank debts as current on account of settlement and payment of debts in April 2019.
Current Liabilities: Current liabilities include short-term borrowings, trade payables and other current �nancial liabilities (including current maturities of long term borrowings). The current �nancial liabilities as at March 31, 2019 have increased to Rs.8,977.41 million (including Rs.7,010.67 million for continuing operations and Rs.1,966.74 million for discontinued operations) as compared to Rs.6,852.67 million as at the end of previous year, mainly due to reclassi�cation of long term debts into short term debts.
Liabilities directly associated with discontinued operations: This represents liabilities directly pertaining to the Company's pharmaceutical business (being transferred to Panacea Biotec Pharma Ltd. as a going concern) and real estate business (being demerged into Ravinder Heights Ltd.) which are considered as discontinued operations as per the Ind-AS. Total liabilities associated with discontinued operations as at March 31, 2019 were Rs.2,200.19 million out of which Rs.2,183.39 million pertains to pharmaceutical business and Rs.16.80 million pertains to real estate undertaking.
Fixed Assets: The net �xed assets have decreased to Rs.8,232.42 million (including Rs.4,995.42 for continuing operations and Rs.3,237.00 million pertaining to discontinued operations) as against Rs.9,280.89 million as at the end of previous year mainly due to depreciation charged during the year.
Financial Assets: Non-current �nancial assets include long-term investments, loans and other long-term �nancial assets. The non-current �nancial assets as at March 31, 2019 were Rs.3,433.54 million (including Rs.40.56 million for continuing operations and Rs.3,392.98 million pertaining to discontinued operations) as against Rs.3,461.21 million as at the end of previous year.
Other Non-current Assets: Other non-current assets include deferred tax asset (net of MAT credit) and other non-current assets. The non-current assets as at March 31, 2019 have increased to Rs.481.02 million (including Rs.223.30 for continuing operations and Rs.257.72 million pertaining to discontinued operations) as against Rs.456.27 million as at the end of previous year mainly due to increase in the deposits with statutory authorities.
Current Assets: Current assets include inventories, trade receivables, cash & cash equivalents, other bank balances, short-term loans and other current assets. Total current assets have decreased to Rs.2,273.34 million (including Rs.1,084.55 for continuing operations and Rs.1,188.79 million pertaining to discontinued operations) as at the end of �scal 2019 as compared to Rs.3,536.51 million as at the end of previous year mainly due to decrease in the inventories, trade receivables and other current assets.
Summarized Statement of Pro�t & Loss
Income from Continuing Operations
Revenue from Operations: During the year, the Company's revenue from continuing operations decreased to Rs.962.10 million as compared to Rs.1,839.80 million during previous �nancial year. The revenues from operations have decreased mainly due to decline in the institutional vaccine business owing to intense price competition and low margin.
Other Income: Other income has decreased to Rs.35.25 million during FY2018-19 as compared to Rs.125.01 million in previous �nancial year, mainly on account of lower rental income and adjustment of provision on interest on loans receivables.
Expenditures for Continuing Operations
Materials & Finished Goods purchases: The raw & packing materials and �nished goods purchases during the year have decreased to Rs.764.28 million as against Rs.883.39 million during the previous �nancial year due to decreased sales.
Employee bene�ts expenses: The employee bene�ts expenses have increased to Rs.411.58 million during FY2018-19 from Rs.359.72 million during FY2017-18, mainly due to increased manpower and higher provisioning of expenses.
Other Expenses: The other expenses have increased to Rs.1,252.87 million during FY2018-19 from Rs.677.74 million
Particulars For the year ended
March 31,2018
Revenue from operations
Finance CostsDepreciation and amortizationexpense
Other IncomePro�t/ (Loss) before tax and exceptional items
Pro�t/ (Loss) Before Tax
Provision for Taxes (including deferred tax)
Pro�t/(Loss) After Tax from continuingoperations
(Rs. in million)
Exceptional items
Materials & Finished Goods Purchases
Other expenses
Pro�t/(loss) after tax from discontinuedoperationsOther comprehensive income(net of tax)
1,839.80
883.39
677.74
1,032.28
336.94
125.01
(1,325.26)
-
(1,325.26)
106.42
(1,431.68)
712.92
(14.16)(6.51)
962.10
764.28
1,252.87
1,046.33
330.30
35.25
(2,808.01)
3,133.49
325.48
106.08
219.40
46.30
*Earnings Per Share in Rs. per Equity Share of Re.1
March 31,2019
Employee bene�ts expense 359.72411.58
Total comprehensive income
Basic & Diluted EPS* from continuing operations
(732.92)
(23.37)3.58
259.19
Basic & Diluted EPS* from discontinuedoperations
11.640.76
Total Basic and Diluted EPS* (11.73)4.34
Continuing operations:

during previous �nancial year. The increase in other expenses is primarily due to higher provisioning and write offs of unrecoverable assets and advances etc.
Finance costs: Finance costs comprising of interest and bank charges have marginally increased to Rs.1,046.33 million during FY2018-19 as against Rs.1,032.28 million during FY2017-18.
Depreciation and amortization expenses: Depreciation for the year was Rs.330.30 million as compared to Rs.336.94 million during previous �nancial year.
Pro�t/(Loss) Before tax and exceptional items: The Company's loss before tax and exceptional items has increased to Rs.2,808.01 million as against Rs.1,325.26 million during FY2017-18 on account of reasons as explained above.
Exceptional items: The Company has recorded an exceptional income of Rs.3,133.49 million during the �nancial year under review towards reversal of excess liabilities and interests pursuant to the one time settlement agreed with the lenders on bilateral basis.
Pro�t/(Loss) Before Tax (PBT) after exceptional item: The Company has registered pro�t before tax of Rs.325.48 million during the �scal 2019 as against loss of Rs.1,325.26 million for �scal 2018.
Pro�t/(Loss) After Tax (PAT): The pro�t after tax for the year was Rs.219.40 million as against loss of Rs.1,431.68 million during �scal 2018.
Pro�t/(Loss) from discontinued operations
The net pro�t from discontinued operations has decreased to Rs.46.30 million during FY2018-19 from Rs.712.92 million during FY2017-18 mainly on account of decline in revenues and increased expenses.
Other comprehensive income
Other comprehensive income include actuarial gain/(loss) on gratuity and deferred tax thereon as per IND-AS requirement.
Earnings per Share
The basic and diluted EPS from continuing operations was Rs.3.58 per share as against negative EPS of Rs.23.37 per share for �scal 2018.The basic and diluted EPS from discontinued operations was Rs.0.76 per share as against Rs.11.64 per share for �scal 2018. Overall basic and diluted EPS from continuing and discontinued operations was Rs.4.34 per share as against negative EPS of Rs.11.73 per share for �scal 2018.
Cash Flow Statement
Cash Flow from Operating Activities: The net cash in�ows from operating activities during �nancial year 2018-19 were Rs.1,071.55 million as compared to Rs.1,720.59 million during �nancial year 2017-18. The net cash in�ows from operating activities have decreased due to decrease in revenues from operations and increased expenses during the year.
Cash Flow from Investing Activities: During the year, the net cash used in investing activities were Rs.83.31 million as against Rs.27.30 million during previous �nancial year. The Company has invested funds in the product development activities and other normal capital expenditure required for business operations in the previous year.
Cash Flow from Financing Activities: Net cash out�ow from �nancing activities were Rs.984.55 million as against Rs.1,636.68 million during previous �nancial year on account of payment of interest and debts during the year.
Details of Ratios
Signi�cant changes exceeding 25% vis-a-vis immediately preceding �nancial year was reported in the following ratios: • Interest Coverage Ratio : 0.42 to -2.26 - Declined
• Current Ratio : 0.52 to 0.25 - Declined
• Debt Equity Ratio : 2.54 to 1.65 - Improved
• Operating Pro�t Margin % : 7.27 to -43.27 - Declined
• Net Pro�t Margin % : -12.44 to 5.98 - Improved
• Return on Net worth % : -18.52 to 6.35 - Improved
There has been a positive impact on the net pro�t margin, return on net worth and debt-equity ratio due to improvement in the net pro�ts and subsequent impact on the net worth on account of reversal of excess liabilities and interest pursuant to the one-time bilateral settlements with existing lenders. The decline in interest coverage ratio and operating pro�t margin has been mainly due to decline in the operating revenues and higher provisioning and write-offs. The current ratio has declined due to increase in current liabilities mainly on account of the re-classi�cation of long-term debts into current short-term debts due to the above referred settlement.
Consolidated Financial Performance
The consolidated revenues from operations of the Group has increased to Rs.4,566.96 million during FY2018-19 as compared to Rs.5,961.61 million during previous �nancial year. On consolidated basis, the Group has earned pro�t before tax (after exceptional items) of Rs.486.15 million during the year under review as against loss before tax of Rs.637.35 million during previous �nancial year. The consolidated pro�t after tax from continuing operations was Rs.409.08 million during FY2018-19 as against loss after tax of Rs.735.93 million during previous �nancial year.
Opportunities and Outlook
The Company operates in a highly regulated and
Cash Flows from:
Fiscal 2019 Fiscal 2018
Operating Activities
Investing Activities
Financing Activities
Cash & Cash Equivalent at the end
1,071.55
(83.31)
(984.54)
49.58
1,720.59
(27.30)
(1,636.68)
65.24
(Rs. in million)
22 Annual Report 2018-19

competitive environment across multiple geographies. The Company is engaged in research, development, manufacturing and marketing of a broad range of branded and generic pharmaceutical formulations and vaccines. The management continues to be committed to grow the Company’s business building on its strong foundation and executing its pipeline of products. Execution of the pipeline is critical to ensure that the Company continues to grow its business across markets.
The Company will continue to invest in the branding and promotion of its products and funding clinical trials for the products in pipeline will continue.
SWOT Analysis
Strengths
• Experienced Management Team: The Company has a team of professionally quali�ed and experienced persons in all management functions. Most of the senior management personnel are working with the Company for more than 5 years thereby indicating stable management team.
• State-of-the-art Manufacturing Infrastructure: The Company's drug substance and vaccine formulation facilities at Lalru and Baddi respectively have been set up in compliance with international regulatory standards and meet the WHO cGMP norms. The Baddi's vaccine facility has been approved by WHO for pentavalent and bivalent oral polio vaccine. The pharmaceutical formulation facility at Baddi is approved by several international regulatory agencies like USFDA, Germany etc.
• Established Brand Equity: The Company is focussing on niche therapeutic areas and has established brands enjoying leadership positions in these segments in domestic market.
• Research & Development: Panacea Biotec has strong R&D capabilities manned with around 50 scientists, duly recognised by Department of Scienti�c and Industrial Research (DSIR). Most of the pharma and vaccine formulations are developed in-house using advanced drug delivery system.
• Sales and Distribution Network: The Company has established network for sales and distribution of its products in India and other ROW markets with annual double digit growth rate.
Weakness
• Long Gestation Period on R&D Projects: R&D projects undertaken by the Company involve longer development time and medium to high investment. As a result of this, the present pro�tability is affected whereas the output may come in medium to long term future periods.
• Late Entry in the US Market: Despite having good R&D infrastructure, the Company is a laggard as far as launching of generic products going off-patent in the US market is concerned.
• High Dependence on Institutional Business in Vaccine Segment: Until 2011, the Company was deriving 70% of its revenue from institutional supplies to UNICEF/Government of India/PAHO etc. As the price unit in institutional market is showing decreasing trend over the years, the margins remain under pressure. Therefore, paediatric vaccine business for immunization programme is a high volume business. The Company has already started sale in private markets in India and other developing countries and participating in national tenders �oated by different countries like Philippines, Vietnam, Iran, etc. to improve the sales and reduce its dependence on UNICEF business.
• Revenue Concentration on Few Products: In vaccine segment, the revenue generation is mainly dependent on three products i.e. pentavalent, hexavalent and oral polio vaccine. Any future disruption in any of these products may impact the future �nancial performance.
• Under-utilized Infrastructure: The Company has set up vaccine facility at Baddi and drug substance manufacturing facility at Lalru for vaccines. Due to delisting, the Company was not able to leverage this infrastructure. In the pharma segment, some of the production lines are not fully utilized even on single shift working basis.
Opportunities
• To improve Capacity Utilization: The Company has an opportunity to improve its plant utilization levels with the receipt of WHO PQ for pentavalent vaccine for which Baddi vaccine plant was set up. Similarly, the Company expects to improve the capacity utilization of pharma production lines by launching new products in US and ROW markets and also through contract manufacturing. The Company has already �led 6 Abbreviated New Drug Applications (ANDAs) with the USFDA out of which 3 have already been approved & commercialized and 3 are under approval. The Company is working on more ANDAs to be �led in due course. Similarly, the Company is also undertaking select contract manufacturing, which has a potential for a signi�cant upside.
• Products in Pipeline for Commercial Launch: The Company is having around 25 products currently under different stages of development for domestic and international market. These products will also get launched in the next 2- 3 years' time. The Company is targeting on improving the product range in vaccine segment and is working on development of vaccines like Pneumococcal, Dengue, Typhoid Conjugate, etc.
• Use of in-house drug substance: The Company is in the process of replacing the imported drug substance with its in-house manufactured drug substance in future thereby
rd reducing its dependence on 3 party suppliers and ensuring higher quality controls as well as improving contribution.
23Panacea Biotec Ltd.

Threats
• Dependence on few imported suppliers in drug substance. However, the Company is focusing on reducing its dependence on foreign suppliers by developing in-house drug substances at Lalru.
• Price Control by Government: Pharmaceutical industry per- se is facing price control risk from the Government. Recently, the Government has introduced new pricing policy for 348 products �xing the ceiling prices.
• I n c re a s i n g R e g u l ato r y Co m p l i a n ce s a n d Co s t s : International regulatory agencies like USFDA have started exercising greater controls and compliances. As a result of this, the cost of compliance has also started increasing. Recently, many Indian companies have been disquali�ed by USFDA due to non-compliance with cGMP guidelines. However, the Company has been following the guidelines prescribed by USFDA and other regulatory agencies and has successfully passed USFDA audit thrice in last 3 years.
• Pricing pressure amid intense competition in the Pharmaceutical industry across the globe.
• High volatility in currency exchange rates may affect the Industry adversely.
• Risk of all R&D initiatives not leading to commercially viable and successful products.
Future Growth Strategy
Pharma Business
• Short-term (1-2 years): aGrowth in Branded Formulations exports to ~30 Emerging Markets.
a Scaling up of existing niche generic business in US.
a Growth in domestic Branded Formulation business by increase in Per Man Per Month Productivity.
a Increase Patient connect for sustainable growth.
a Initiating registration of PacliAll in EU, Japan, Emerging and Developing Countries.
• Medium Term (3-5 years):
aLaunch of PacliALL, Cyclosporine and other ANDAs in US market under existing collaborations with Apotex, Bionpharma Inc. etc.
a Launch of ~25 branded New Products in existing and new emerging markets.
aLaunch of ~16 branded new Products in India.
aEmerging Market partners will have access to Brand Building, sales force effectiveness processes.
• Long Term (5 years+)
aLaunch of ~5 ANDAs in US market every year.
aLaunch of products in EU and Japanese markets.
aLaunch of 10 new products in Domestic, Emerging and Developing Countries every year.
Vaccine Business
• Short-term (1-2 years): TM aScaling up EasySix vaccine sales in Private Market in
India with target of catching up 1 million new born babies/year.
aParticipation in institutional business for Easy�ve-TT vaccine.
aLaunch of Typhoid Conjugate Vaccine in India.
• Medium Term (3-5 years):TM aIntroduction of EasySix vaccine in UNICEF/PAHO
Program, private markets and National Program of Developing Countries.
TM aLaunch of DengiAll Dengue Vaccine in India.TM aLaunch of NucoVac Pneumococcal Vaccine in India
(Private and National Program).
• Long Term (5 years+)TM TM aScale up of Sales of DengiAll vaccine and NucoVac
vaccine in Private Market and Developing Countries National Program etc.
aLaunch of Niche private market Branded Vaccines which are currently under advanced stage of pre-clinical studies in India and Developing Countries.
Safety, Health and Environment Protection
The Company undertakes all its operations with a high concern and sincerity for environment and its surroundings as well as the safety and health of people. The Company has dedicated Environment & Occupational Health and Safety (EOHS) Protection department and also engages the services of consultant for independent evaluation of EOHS activities.
Corporate Social Responsibility
Panacea Biotec recognizes Corporate Social Responsibility as one of its core values by making continuous efforts on spreading awareness on critical health issues impacting the quality of life of Indians. The Company regularly takes initiatives towards ful�lling its corporate social responsibility including patients' awareness/assistance programs for prevention, detection and management of critical diseases including cancer, renal diseases and diabetes.
Panacea Biotec has been actively engaged in conducting Patient Camps such as Diabetes Detection, HbA1C & Diabetic Neuropathy Camps to help patients better manage Diabetes and co-morbid conditions, Cancer Survivor Meets to help patients manage life post chemotherapy, Organ Donation Awareness Campaigns to spread awareness and positive impact of Organ Donation, Osteoporosis Camps to help patients identify risk of osteoporosis ahead of time, Piles Camps for detection, management and awareness of Piles.
These camps are conducted across the country with an objective to provide free diagnostic services to the patients and spread awareness on lifestyle management with such chronic diseases to help improve their quality of life.
24 Annual Report 2018-19
Note: As a result of rounding off adjustments, the �gures/ percentages in a column in various sections in the Annual Report may not add up to the total for such columns.

Panacea Biotec Ltd. 25
Dear Members,Your Directors feel pleasure in presenting the 35th Annual Report on the business and operations of the Company together with the Audited Standalone and Consolidated Financial Statements and the Auditors’ Reports thereon for the financial year ended March 31, 2019. Financial ResultsThe highlights of financial results of the Company are as under:
(Rs. in million)
Particulars Standalone2018-19# 2017-18##
Revenue from operations 4,441.63 5,775.54Other Income 81.20 176.16Total Income 4,522.83 5,951.70Earnings/(Loss) Before Interest, Tax, Depreciation & Amortisation (EBITDA)*
(1,384.88) 990.41
Profit/ (Loss) before exceptional items and tax
(2,968.29) (612.34)
Exceptional items 3,340.08 -Profit/(Loss) before Tax (PBT) 371.78 (612.34)Profit/(loss) after tax 265.70 (718.76)Total comprehensive income 259.19 (732.92)
# Include figures for the discontinued operations## Previous year’s figures have been re-grouped, re-classified and/or restated
wherever necessary* Includes Other Income
Performance HighlightsDuring the year ended March 31, 2019, the Company has registered revenue from operations of Rs.4,441.63 million as against Rs.5,775.54 million during the corresponding previous financial year. However, in view of the proposed transfer of pharmaceutical formulations business including related research and development activities and natural products extraction activities ("Pharma business") to the Company’s wholly owned subsidiary, Panacea Biotec Pharma Limited ("PBPL") and proposed demerger of real estate undertaking including investment in Radhika Heights Limited into the Company’s wholly owned subsidiary, Ravinder Heights Limited ("RVHL"), the activities of the Pharma business as well as the income from real estate activities of the Company, that are considered as disposal group, have been presented as a discontinued operation in the Standalone Financial Statements of the Company in accordance with the applicable accounting standards. The Company has earned revenue from operations of Rs.3,479.53 million (previous year Rs.3,935.74 million) from such discontinued operations. The revenue from continuing operations have been Rs.962.10 million as against Rs.1,839.80 million during corresponding previous financial year.The pharmaceutical formulations segment registered a turnover of Rs.3,479.41 million as against Rs.3,839.14 million during the previous financial year. The vaccines segment registered a turnover of Rs.962.10 million as against Rs.1,839.80 million during the previous financial year. The Research & Development segment earned revenue of Rs.0.12 million as against Rs.96.60 million during the previous financial year. The Company’s total export revenue was Rs.1,065.58 million as compared to Rs.1,675.30 million in the previous financial year.
Directors’ Report
The Company has earned profit before tax of Rs.371.78 million as against net loss before tax of Rs.612.34 million in the previous financial year. The Company has earned profit after tax and exceptional items of Rs.265.70 million as against loss after tax of Rs.718.76 million in the previous year. Profit after tax from continuing operations was Rs.219.40 million as against loss after tax of Rs.1,431.68 million during previous financial year. Profit after tax from discontinued operations was Rs.46.30 million as against Rs.712.92 million during previous financial year.During the year ended March 31, 2019, the Group has registered consolidated revenue from operations of Rs.4,566.96 million as against Rs.5,961.61 million during the previous financial year. On consolidated basis, the Group has earned profit before tax (after exceptional items) of Rs.486.15 million during the year under review as against loss before tax of Rs.637.35 million during previous financial year. The consolidated profit after tax was Rs.409.08 million during FY2018-19 as against loss after tax of Rs.735.93 million during previous financial year.During the year under review, your Company along with its partner, Apotex Inc. and Apotex Corp. (Apotex) have entered into a Settlement Agreement with Celgene Corporation, a global biopharmaceutical company headquartered in USA and its subsidiary Abraxis BioScience, LLC, for settlement of disputes regarding patents covering Abraxane® drug product and the Company’s Abbreviated New Drug Application (ANDA) for paclitaxel protein bound particles for injectable suspension, 100mg/vial, a generic version of Abraxane®. As part of the Settlement Agreement, Panacea Biotec and Apotex have received a non-exclusive license under which Panacea Biotec may, through its partner Apotex, begin selling Panacea Biotec’s generic version of Abraxane® in the U.S. and its territories on a mutually agreed-upon date, and also in certain jurisdictions outside of the U.S. on a mutually agreed-upon date. As a part of the settlement, the Company has also received an amount of Rs.206.59 million as its share of the Litigation Avoidance Fee.Your Company has also entered into a tripartite agreement with Natco Pharma Ltd. (“Natco”) and Breckenridge Pharmaceutical Inc. (“Breckenridge”) for the manufacture and supply of Azacitidine Injection for the U.S. market under Breckenridge’s already-approved ANDA. Under the terms of the agreement, Natco has provided the technology for manufacturing Azacitidine to Panacea Biotec’s facility located at Baddi, Himachal Pradesh, India. Panacea Biotec will be responsible for manufacture and supply of the product, which will be marketed, sold and distributed by Breckenridge in the U.S. The Company has received USFDA approval for this product and has launched the same in USA during current financial year through Breckenridge.Further, during the current financial year, India Resurgence Fund (“IndiaRF”), promoted by Piramal Enterprises Limited and Bain Capital Credit, along with its affiliates has committed an investment of upto Rs.9,920 million in the Company. This investment is structured by way of Non-Convertible Debentures (NCDs) of up to Rs.8,640 million and subscription amount of Rs.320 million towards share warrants allotted on a preferential basis. The subscription amount represents 25% of total amount of Rs.1,280 million proposed to be raised upon issuance of equity shares against warrants as per SEBI (Issue

Annual Report 2018-1926
of Capital and Disclosure Requirements) Regulations, 2018 ("SEBI ICDR Regulations").Your Company’s Oncology Parenteral Formulation Facility at Baddi, Himachal Pradesh, India has received United States Food & Drug Administration (USFDA) approval for manufacture and supply of Azacitidine Injection, 100 mg/vial, for the US market. Panacea Biotec’s state-of-the-art pharmaceutical formulation facility at Baddi is already approved by National Regulatory Authority (NRA) of India and USFDA for other oral solids and injectable products.A detailed discussion on operations for the year ended March 31, 2019 is given in the Management Discussion and Analysis Report forming part of the Annual Report.Credit RatingDuring the year, the Credit Analysis & Research Ltd. (CARE) has reaffirmed the credit rating of CARE D (Single D) for Long Term Bank Facilities and for Short Term Bank Facilities of the Company due to delays in repayment of the debt obligations of the Company. With the improvements in the financial position and operational performance of the Company during the current year, the rating agency will review the rating in due course of time.Dividend and Transfer to ReservesThough the Company has earned profits after tax and exceptional items of Rs.265.70 million during the year but keeping in view the fact that the Company has incurred losses before tax & exceptional items of Rs.2,808.01 million and also with a view to conserve cash flows for the Company’s operations, the Board of Directors has decided to invest the amount towards the growth of the Company and not recommended any dividend on the Equity as well as Preference Shares of the Company. Accordingly, there has been no transfer to general reserves. Share CapitalThe issued, subscribed and paid up Share Capital of the Company as on March 31, 2019, remains unchanged at Rs.224.25 million comprising of Rs.61.25 million equity share capital divided into 61,250,746 Equity Shares of Re.1 each and Rs.163.00 million preference share capital divided into 1,63,00,000, 0.5% Non-Convertible Cumulative Non-Participating Redeemable Preference Shares (“NCCRPS”) of Rs.10 each.During the year under review, the Company has not issued any equity shares with differential rights/sweat equity shares under Rule 4 & Rule 8 of the Companies (Share Capital and Debentures) Rules, 2014.Subsequent to the year under review, the Company has amended the terms of NCCRPS wherein the tenure of NCCRPS has been increased to 15 years with an option with the Company as well as the Preference Shareholders for early redemption of NCCRPS, subject to certain conditions stipulated in the amendment agreement.Significant Events during current yeara) Issue of Warrants:
As approved by the shareholders in their Extra-ordinary General Meeting held on March 25, 2019, the Company has, on April 8, 2019, issued and allotted 71,11,111 convertible warrants (“Warrants”) at a price of Rs.180 each (“Warrant Issue Price”) on a preferential basis to India Resurgence Fund – Scheme 1, India Resurgence Fund – Scheme 2 and
Piramal Enterprises Limited (collectively “IndiaRF”), with a right to convert each warrant into one equity share of face value of Re.1 each at a price of Rs.180 including premium of Rs.179 per equity share within a period of 18 months from the date of allotment of Warrants. The Company has received an amount of Rs.320 million as upfront payment which is equivalent to 25% of the total amount of Rs.1,280 million proposed to be raised upon issuance of equity shares against warrants as per SEBI ICDR Regulations. Subject to exercise of warrants, IndiaRF (along with its affiliates) will collectively end up owning around 10.4% stake in the Company on a fully diluted basis.
b) Issue of Non-Convertible Debentures:Subsequent to the year under review, the Company has raised funds by way of issue and allotment of 74,300 secured, unrated, unlisted, redeemable Non-Convertible Debentures (“NCDs”), having the face value of Rs.1,00,000 each, aggregating to Rs.7,430 million under Series 1A, Series 1B and Series 2 NCDs through private placement to IndiaRF.
c) One time settlement with the existing lenders:During the quarter ended March 31, 2019, in order to resolve the debt position of the Company, the Company reached bilateral settlements of its debts with each consortium lender individually. Subsequent to the year under review, the Company has paid all its debts to the said lenders including ECB from Bank of India pursuant to the said bilateral settlements on April 9, 2019 and obtained ‘no dues’ certificates from such lenders.
d) Proposed Transfer of Pharmaceutical Formulations business:On March 25, 2019, as part of business reorganization, the Company approved the transfer of pharmaceutical formulations business including pharmaceutical formulations facility at Baddi, Himachal Pradesh and related research & development activities and natural products extraction activities of the Company to Panacea Biotec Pharma Limited (“PBPL”), with an objective to segregate the different businesses of the Company to ensure smooth functioning of each business in the future. Subsequent to the year under review, to implement the above divesture, the Company has executed a Business Transfer Agreement (“BTA”) with PBPL to transfer Pharma business to PBPL, together with all tangible assets (except R&D center and natural products extraction facility at Lalru), intangible assets and related liabilities as specified in the BTA, in relation to the pharmaceutical formulations business including pharmaceutical formulations facility at Baddi, Himachal Pradesh, as a going concern through slump sale.
e) Proposed Scheme of Arrangement for demerger of real estate business:The Board of Directors of “the Company” had, at its meetings held on May 30, 2019 approved the Scheme of Arrangement (‘the Scheme’) between the Company and Ravinder Heights Limited ("RVHL") and their respective shareholders and creditors for demerger of real estate business of the Company comprising of Radhika Heights Limited alongwith its step down subsidiaries and two real estate properties, into RVHL, subject to applicable approvals.
Directors’ Report

Panacea Biotec Ltd. 27
The management believes that the proposed Scheme will lead to simplification and rationalization of business undertakings holding structure of the Companies, better management focus, optimum utilization of various resources of the Companies and will enable the Companies to focus on their core businesses. It will create and enhance stakeholders’ value by unlocking the intrinsic value of Companies core businesses and listing of shares of RVHL. The Company has filed the application with the BSE Limited ("BSE") and National Stock Exchange of India Limited ("NSE") for its in-principle approval under Regulation 37 of the SEBI (Listing Obligations and Disclosure Requirements) Regulations, 2015 ("SEBI LODR Regulations") and the same is pending as on the date of this Report.
f ) Alteration in Memorandum and Articles of Association:Subsequent to the year under review, the existing Memorandum of Association (“MOA”) of the Company has been replaced in its entirety by new set of MOA with a view to align the same with Table A of the Schedule I to the Act.Further, the existing Articles of Association (“AOA”) of the Company has been replaced in its entirety by new set of AOA with a view:• to align the same with the requirements of the Act;
and• to suitably incorporate the relevant provisions of the
Warrant Subscription and Shareholders Agreement and Debenture Trust Deed both dated April 06, 2019 executed by the Company, in connection with the issue of Share Warrants and Non-Convertible Debentures (NCDs) to India Resurgence Fund-Scheme 1, India Resurgence Fund-Scheme 2 and Piramal Enterprises Limited.
Apart from the updates mentioned above, there were no significant events after the end of the financial year ended March 31, 2019.Significant and material orders impacting the going concern status and Company’s operations in futureDuring the year under review, no significant and material orders were passed by any regulator or court or tribunal which may impact the going concern status and your Company’s operations in future.During the financial year 2011-12, a search operation was conducted by Income Tax Department in the premises of the Company and hence the Company re-filed the income tax returns for the Assessment Years (“AY”) 2006-07 to 2012-13. During the financial year 2014-15, the Income Tax Department completed the assessment of the said years, disallowed certain expenses and issued demand of Rs.3,294.9 million (including interest) on various grounds. The Company preferred appeals before CIT (Appeals) and after several hearings in the matter and on the basis of facts of the matter, the appeals were decided in favour of the Company and the entire demand of Rs.3,294.9 million was cancelled. However, CIT (Appeals) made certain disallowances of Rs.60.2 million with respect to AY 2010-11 & AY 2011-12 against which the Company has filed appeals before the Income Tax Appellate Tribunal (“ITAT”). The Income Tax Department has also filed appeals before ITAT against the orders of CIT (Appeals). The appeals before ITAT are pending at present.
Report on Corporate Governance Your Company has always placed thrust on managing its affairs with diligence, transparency, responsibility and accountability. Your Directors support the broad principles of Corporate Governance and lays emphasis on its role to align and direct the actions of the Company in achieving its objectives. The report on Corporate Governance as stipulated under Regulation 34 read with Schedule V of the SEBI LODR Regulations for the year under review together with a certificate from the Practicing Company Secretary confirming compliance thereof is attached and forms part of the Annual Report.Management Discussion and Analysis ReportManagement Discussion and Analysis Report for the year under review, as required pursuant to Regulation 34 read with Schedule V of SEBI LODR Regulations, is presented in a separate section and forms an integral part of this Report.Subsidiaries, Associates and Joint VenturesA. SubsidiariesAs on March 31, 2019, your Company has 4 wholly owned subsidiary (“WOS”) companies, viz. Radhika Heights Limited (“RHL”), Panacea Biotec Pharma Limited (“PBPL”) (w.e.f. March 22, 2019), Panacea Biotec (International) S.A., Switzerland (“PBS”), Rees Investments Limited, Islands of Guernsey (“Rees”) (dissolved w.e.f. May 23, 2019) and 7 indirect WOS companies, as under:• Cabana Construction Private Limited, Cabana Structures
Limited, Nirmala Buildwell Private Limited, Nirmala Organic Farms Resorts Private Limited, Radicura Infra Limited and Sunanda Infra Limited; all being WOS of RHL; and
• Panacea Biotec Germany GmbH (“PBGG”), the WOS of PBS.Subsequent to the year end, the Company has formed 2 WOS, viz. Meyten Realtech Private Limited (“Meyten”) (w.e.f. April 12, 2019) and Ravinder Heights Limited (“RVHL”) (w.e.f. April 15, 2019). RHL inter-alia, owns a prime immovable property which is being used by the Company as its Corporate Office at New Delhi and land at Pataudi Road, Gurugram (along with its 4 WOSs). It has diversified its activities in construction and development of township as part of its growth plans. Accordingly, RHL along with its 4 WOS companies signed a term sheet with a developer for development of the integrated township on its land at Pataudi Road, Gurugram during the earlier year, however, a dispute had emerged among the parties and the matter is under arbitration. The Company holds 47,76,319 equity shares of Re.1 each in RHL with an investment of Rs.3,385.65 million as on March 31, 2019. The real estate business including RHL alongwith its step down subsidiaries and two real estate properties, is being demerged into the Company’s wholly owned subsidiary namely, Ravinder Heights Limited, subject to applicable approvals.PBPL has been formed with the objective of transferring the Company’s pharmaceutical formulations business to PBPL on a going concern basis. Post completion of transfer of business, PBPL will carry on the said business. The Company holds 10,00,000 equity shares of Re.1 each with an investment of Rs.1.00 million as on March 31, 2019.PBS was earlier engaged in the business of trading of pharmaceutical products and is currently not pursuing any business. Since no further activity is envisaged to be
Directors’ Report
Annual Report 2018-1928
undertaken by PBS, it has been decided to liquidate PBS. The Company holds 6,000 equity shares of CHF 100 each with an investment of Rs.34.36 million as on March 31, 2019. PBGG, WOS of PBS is engaged in marketing of pharmaceutical products including the Company’s products in Germany.Rees had its objects of inter-alia, making strategic investments in other entities. Since no further activities were envisaged in Rees, it was decided to liquidate the same. Subsequent to the year under review, Rees has been dissolved on May 23, 2019.Meyten has been incorporated on April 12, 2019 for the purpose of proposed demerger of specified Leasing Business of RHL into Meyten. The Company holds 1,00,000 equity shares of Re.1 each with an investment of Rs.0.10 million in Meyten.RVHL has been incorporated on April 15, 2019 for the purpose of proposed demerger of real estate undertaking of the Company including its investment in RHL into RVHL. The Company holds 1,00,000 equity shares of Re.1 each with an investment of Rs.0.10 million in RVHL.B. Joint Ventures and AssociatesYour Company has 2 joint ventures, viz. Adveta Power Private Limited (“Adveta”) and Chiron Panacea Vaccines Private Limited (Under Liquidation) (“CPV”) and 1 associate company, viz PanEra Biotec Private Limited (“PanEra”). Adveta and PanEra have been considered as subsidiaries for the purpose of consolidation of accounts pursuant to the provisions of IND-AS.Adveta, the Company’s 50:50 joint venture with PanEra, was granted in-principle approval by Govt. of Arunachal Pradesh for allotment of two Power Projects of 80 MW and 75 MW in Arunachal Pradesh in financial year 2012-13. Adveta has in the past initiated taking preliminary steps in connection with the implementation of projects. However, no major investment has been made in this regard nor is envisaged during the current financial year. Further, as per the terms agreed with IndiaRF, the Company has initiated the preliminary steps for disposal of its investments in Adveta in due course of time.CPV: The voluntary winding up process of CPV is currently in progress.PanEra: With a view to inter-alia, streamline and consolidate the Company’s business operations, your Company has consolidated the entire vaccine manufacturing activities including the activity of manufacturing of bulk vaccines and antigens of PanEra in the Company at its bulk vaccines manufacturing facility at Lalru, Punjab effective from May 25, 2018 and now the entire activities of manufacturing of bulk vaccine and antigens are being undertaken by the Company.During the year under review, PanEra has achieved a net turnover of Rs.221.42 million as against Rs.211.18 million in previous financial year. PanEra has incurred a net loss of Rs.0.97 million as compared to a net loss of Rs.40.35 million in previous financial year. Further during earlier year, PanEra has been granted in principle approval by Govt. of Himachal Pradesh for allotment of a hydro-power project of 4 MW in Himachal Pradesh. PanEra will be taking necessary steps in connection with the implementation of the project in due course of time. However, no major investment has been made in this regard nor is envisaged during the current financial year. Further, as per the terms agreed with IndiaRF, the Company has initiated the preliminary steps for disposal of its investments in PanEra in due course of time.
A separate statement containing the salient features of financial statements of the Company’s subsidiaries, joint ventures and associates, in the prescribed Form AOC-1, forms part of the Annual Report and hence not repeated here for the sake of brevity.The annual financial statements and related detailed information of the subsidiary companies shall be made available to the shareholders of the holding and subsidiary companies seeking such information on all working days during business hours. The financial statements of the subsidiary companies shall also be kept open for inspection by any shareholder during working hours at the Company’s registered/corporate office and that of the respective subsidiary companies concerned.The Company has formulated a Policy for determining material subsidiaries which may be accessed on the Company’s website at the link: https://www.panaceabiotec.com/statutory-policies. Presently, Radhika Height Limited is a material subsidiary of the Company pursuant to SEBI LODR Regulations.Consolidated Financial StatementsThe Consolidated Financial Statements of the Company and its subsidiaries, joint ventures and associates, prepared in terms of Section 129 of the Act, Regulation 33 of SEBI LODR Regulations and in accordance with Ind AS 110 read with Ind AS 28 and 31 as specified in the Companies (Indian Accounting Standards) Rules, 2015, and provisions of Schedule III to the Act, are attached herewith and the same together with Auditors’ Report thereon, forms part of the Annual Report.Indian Accounting Standards, 2015The annexed financial statements comply in all material aspects with Indian Accounting Standards ("Ind AS") notified under Section 133 of the Companies Act, 2013 ("the Act"), Companies (Indian Accounting Standards) Rules, 2015 and other relevant provisions of the Act.Listing of Equity SharesThe Equity Shares of the Company continue to be listed on NSE and BSE. The requisite annual listing fees for the financial year 2019-20 have been paid to these Exchanges.Public DepositsDuring the year under review, your Company has not invited or accepted any deposits from the public/members pursuant to the provisions of Sections 73 and 76 of the Act read with Companies (Acceptance of Deposits) Rules, 2014.Directors and Key Managerial Personneli) Cessation of Directors: During the year, Mr. O.P. Kelkar
(DIN:00943362), an independent director of the Company, departed for his heavenly abode on July 21, 2018. Your Directors place their sincere appreciation towards the invaluable contributions, guidance and support received from him during his tenure as Director of the Company towards the progress of the Company and pray the almighty that the departed soul rest in peace.
ii) Re-appointment of Executive Directors: During the year, Mr. Soshil Kumar Jain (DIN:00012812), Dr. Rajesh Jain (DIN:00013053), Mr. Sandeep Jain (DIN:00012973) and Mr. Ankesh Jain (DIN:03556647) have been re-appointed as Chairman, Managing Director, Joint Managing Director and Whole time Director respectively for a period of three (3) years w.e.f. April 01, 2019. Further, Mr. Sumit Jain
Directors’ Report

Panacea Biotec Ltd. 29
(DIN:00014236) has been re-appointed as Whole-time Director for a period of three (3) years w.e.f. July 22, 2018.
iii) Appointment of Independent Directors: During the year, the Board of Directors on the recommendation of Nomination and Remuneration Committee of the Board (“NRC”), has appointed Mr. Ashwini Luthra (DIN: 05103137) as an additional director and Non-Executive Independent Director for a period of five (5) years w.e.f. October 18, 2018. Further, subsequent to the year end, the Board of Directors on the recommendation of NRC, has appointed Mr. Bhupinder Singh (DIN:00062754) as an additional director and Non-Executive Independent Director for a period of five (5) years w.e.f. April 08, 2019.
iv) Appointment of Non-Executive Director: Subsequent to the year end, the Board of Directors on the recommendation of NRC, has appointed Mr. Nithin Krishna Kaimal (DIN:05253046) as an additional director and Non-Executive Director of the Company w.e.f. April 08, 2019, not liable to retire by rotation.
v) Re-appointment of Independent Directors: During the year, Mr. R.L. Narasimhan (DIN:00073873), Mr. N.N. Khamitkar (DIN:00017154) and Mr. K. M. Lal (DIN:00016166) have been re-appointed as Independent Directors w.e.f. April 1, 2019 for a second term of five (5) consecutive years up to March 31, 2024. Further, the first term of office of Mrs. Manjula Upadhyay (DIN:07137968) as Independent Director, will expire on March 29, 2020. The Board of Directors has, after taking into account the report of performance evaluation and the recommendation of NRC, in its meeting held on August 12, 2019, recommended her re-appointment as Independent Director for a second term of five (5) consecutive years upto March 29, 2025, subject to approval of shareholders. The terms and conditions for her re-appointment are contained in the Explanatory Statement forming part of the Notice of the ensuing Annual General Meeting ("AGM") of the Company.
vi) Retirement by Rotation: In accordance with the provisions of Section 152 of the Act and Article 124 of the Articles of Association of the Company, Mrs. Sunanda Jain (DIN:03592692) and Mr. Sumit Jain (DIN: 00014236) directors of the Company are liable to retire by rotation. Being eligible, they have offered themselves for re-appointment as director at the ensuing AGM.
vii) Profile of Directors seeking appointment/re-appointment: The brief resume of the Directors seeking appointment/ re-appointment along with other details as stipulated under Regulation 36(3) of the SEBI LODR Regulations and Secretarial Standards issued by The Institute of Company Secretaries of India, are provided in the Notice convening the AGM of the Company.
viii) Declaration of independence: Your Company has received declarations from all the Independent Directors of the Company confirming that they meet the criteria of independence provided in Section 149(6) of the Act and Regulation 16 of the SEBI LODR Regulations and there has been no change in the circumstances which may affect their status as Independent Director during the year under review.
Your Directors recommend appointment/re-appointment of the above said directors in the ensuing AGM.Apart from the above, there was no other change in the directors and Key Managerial Personnel (KMP) during the year under review.Board EvaluationIn terms of the provisions of the Act and Regulation 19(4) of SEBI LODR Regulations, the Board has adopted a formal mechanism for evaluating its performance as well as that of its Committees and individual directors, including the Chairman of the Board. The exercise was carried out through a structured evaluation process covering various aspects such as Board composition & quality, strategic & risk management, board functioning, etc. which are briefly stated in the Corporate Governance Report, forming part of the Annual Report.Performance evaluation of independent directors was conducted by the Board of Directors excluding the director being evaluated on the criteria such as ethics and values, knowledge and proficiency, behavioral traits etc.Board MeetingsDuring the year under review, five (5) Board Meetings were held on May 30, 2018, August 14, 2018, November 14, 2018, February 14, 2019 and February 26, 2019. The intervening gap between two Board Meetings was within the maximum period prescribed under the Act. The detailed information is furnished in the Corporate Governance Report, forming part of the Annual Report.Audit CommitteeDuring the year under review, the Audit Committee of the Board of Directors consisted entirely of Independent Directors. The details of the composition and number of meetings of the Audit Committee are furnished in the Corporate Governance Report, forming part of the Annual Report. During the year, all the recommendations made by the Audit Committee were accepted by the Board. Subsequent to the year end, Mr. Nithin Krishna Kaimal, Non-Executive Director has been appointed as a Member of the Audit Committee.Policy on Directors’ appointment & remunerationPursuant to the provisions of Section 178(3) of the Act and Regulation 19(4) of SEBI LODR Regulations and as per the recommendations of NRC, the Board has adopted a policy for selection & appointment of Directors and Key Managerial Personnel of the Company and their remuneration. The components of remuneration policy are briefly stated in the Corporate Governance Report, forming part of the Annual Report.Energy Conservation, Technology Absorption & Foreign ExchangeAs required under Section 134 of the Act read with Rule 8 of the Companies (Accounts) Rules, 2014 (“Accounts Rules’’) the particulars regarding conservation of energy, technology absorption and foreign exchange earnings & outgo, are given in Annexure A hereto and forms part of this Report.Extract of Annual ReturnAs required pursuant to Section 134 and 92(3) of the Act, an extract of Annual Return in Form MGT-9 as on financial year ended on March 31, 2019 is annexed as Annexure B hereto and forms part of this Report. The same is available on Company’s website at: https://www.panaceabiotec.com.
Directors’ Report

Annual Report 2018-1930
Directors’ Report
Related Party TransactionsAs per the provisions of the Act and SEBI LODR Regulations, your Company has formulated a policy on Related Party Transactions which is available on Company’s website at: https://www.panaceabiotec.com/statutory-policies. The policy intends to ensure that proper reporting, approval and disclosure processes are in place for all transactions between the Company and the Related Parties.This policy specifically deals with the review and approval of material related party transactions keeping in mind the potential or actual conflicts of interest that may arise because of entering into these transactions. All related party transactions are placed before the Audit Committee for its review and approval. Wherever applicable, prior approval is obtained for related party transactions on a quarterly basis for transactions which are of repetitive nature and / or entered in the ordinary course of business and are at arm’s length basis.During the year, all related party transactions entered into were in the ordinary course of business and on an arm’s length basis. The Company has not entered into any material related party transactions, i.e. transactions exceeding 10% of the annual consolidated turnover as per the last audited financial statements. Suitable disclosures as required under Accounting Standard AS-18 have been made in the notes to the Financial Statements forming part of the Annual Report.Information on transactions with related parties pursuant to Section 134(3)(h) of the Act read with Rule 8(2) of the Accounts Rules are given in the prescribed Form AOC-2 annexed as Annexure C hereto and the same forms part of this Report.Particulars of Employees and Related disclosuresDisclosures pertaining to remuneration and other details as required under Section 197(12) of the Act read with Rule 5(1) of the Companies (Appointment and Remuneration of Managerial Personnel) Rules, 2014 (“Managerial Personnel Rules”) are provided in Annexure D hereto and the same forms part of this Report.In terms of the provisions of Section 197(12) of the Act read with Rules 5(2) and 5(3) of the Managerial Personnel Rules, a statement showing the names and other particulars of the employees drawing remuneration in excess of the limits set out in the said Rules is provided in Annexure E hereto and the same forms part of this Report. Auditors and Audit Reportsi) Statutory Auditors and Audit Report:
Pursuant to the provisions of Section 139 of the Act and the rules framed thereunder, M/s. Walker Chandiok & Co. LLP, Chartered Accountants (Regn. No. 001076N/N500013), were appointed as statutory auditors of the Company for a period of five (5) years to hold office from the conclusion of the 30th AGM of the Company held on September 25, 2014 till the conclusion of the ensuing AGM.As per the provisions of Section 139 of the Act, no listed company shall appoint or re-appoint an audit firm as auditor for more than two terms of five (5) consecutive years. The current auditors i.e. M/s. Walker Chandiok & Co. LLP, Chartered Accountants, has completed one term of five consecutive years. Accordingly, it is proposed to re-appoint M/s. Walker Chandiok & Co. LLP, Chartered Accountants (Regn. No. 001076N/N500013) as statutory
auditors of the Company for a second term of five (5) consecutive years to hold office from the conclusion of the ensuing 35th AGM of the Company till the conclusion of the 40th AGM of the Company on a remuneration, out-of-pocket expenses, etc. incurred in connection with the audit as may be decided by the Board in consultation with the auditors from year to year.The Board of Directors at its meeting held on August 12, 2019, based on the recommendation of the Audit Committee has recommended the re-appointment of M/s. Walker Chandiok & Co. LLP, Chartered Accountants (Regn. No. 001076N/N500013), as the statutory auditors of the Company for approval by the members.M/s. Walker Chandiok & Co. LLP, Chartered Accountants have consented to the said re-appointment and confirmed that their re-appointment, if made, would be within the limits specified under Section 141(3)(g) of the Act and that they are not disqualified to be appointed as statutory auditors in accordance with the provisions of Section 141 of the Act.The Auditors have not given any qualified opinion or made any reservation, adverse remark or disclaimer in their Audit Report.The management response to the Emphasis of Matters and observations/comments contained in the Auditors’ Report and Annexure thereto have been suitably given in the respective Notes to the Financial Statements referred to therein.Further, the Emphasis of Matters as contained in the Auditors’ Report on the Standalone Financial Statements are also mentioned as Emphasis of Matters in the Auditors’ Report on the Consolidated Financial Statements in similar manner. The management responses thereto have been suitably given in the respective Notes to the Consolidated Financial Statements referred to therein.The notes to accounts and other observations, if any, in the Auditors’ Report are self-explanatory and therefore, do not call for any further comments.
ii) Cost Accounts and Auditors:The Company is required to maintain cost records as specified by the Central Government under Section 148(1) of the Act and accordingly, such accounts and records have been duly made and maintained by the Company in compliance with the provisions of the Act.Pursuant to the provisions of Section 148 of the Act, M/s. GT & Co., Cost Accountants (Firm’s Registration Number: 000253), were appointed as the Cost Auditors to conduct the audit of the Company’s Cost Records for the financial year ended March 31, 2019 and their remuneration has been ratified by the shareholders in the 34th AGM of the Company held on September 29, 2018.The cost audit for the said period has been completed and the Cost Auditors Report will be submitted with the Central Government within the prescribed time. The Cost Audit Report for the financial year 2017-18 was filed on September 12, 2018.Based on the recommendations of the Audit Committee, the Board of Directors has re-appointed M/s. GT & Co., Cost Accountants, as cost auditors of the Company for

Panacea Biotec Ltd. 31
the financial year 2019-20 pursuant to the provisions of Section 148 of the Act. As required, the item for ratification of remuneration of cost auditor has been included in the notice of the ensuing AGM for shareholders’ approval.
iii) Secretarial Auditors and Secretarial Audit Report:Pursuant to the provisions of Section 204 of the Act read with Rule 9 of the Managerial Personnel Rules, the Board of Directors has appointed M/s. R&D Company Secretaries, Practicing Company Secretaries to conduct the Secretarial Audit of the Company for the financial year ended March 31, 2019. The Secretarial Audit Report for the said period is annexed as Annexure F to this Report.The management responses to the observations contained in the Secretarial Audit Report are given below:a) There are some delays in filing of ECB-2 (monthly
return) as required to be filed in terms of Master Circular on External Commercial Borrowings and Trade Credits governed under the provisions of Foreign Exchange Management Act, 1999:
The Company is regular in filing ECB-2 (monthly return) within the stipulated time. However, 2 monthly returns were inadvertently delayed due to reasons beyond reasonable control.
b) The Company has paid managerial remuneration for the financial years ended 31st March 2019, 2018, 2017, 2016, 2014 and 2013, which is in excess of the limits specified by the relevant provisions of the Companies Act, 2013 / the Companies Act, 1956 by Rs.154 million for the said years. The Company’s applications to the Central Government seeking approval for payment of such excess remuneration have not been approved and consequently the Company is required to recover the excess amount thus paid for the said years. The Company has recorded an amount of Rs.154 million as recoverable from the directors towards such excess remuneration paid. The Company had submitted applications to the Central Government for waiver of recovery of excess remuneration paid. Further, pursuant to the notification of the effective date of Section 67 of the Companies (Amendment) Act, 2017 amending Section 197 - overall maximum managerial remuneration and managerial remuneration in case of absence or inadequacy of profits, of the Companies Act, 2013, the aforesaid applications pending with the Central Government stand abated and the Company is in the process of seeking requisite approvals required in accordance with the provisions of Section 197(10) of the Companies Act, 2013.The above observation in the Secretarial Audit Report is self-explanatory and therefore, does not call for any further comment.
In addition to the above and in compliance with SEBI Circular No. CIR/CFD/CMD/1/27/2019 dated February 08, 2019, a report on secretarial compliance issued by M/s. R&D Company Secretaries for the year ended March 31, 2019 has been submitted to stock exchanges.As per the requirements of the SEBI LODR Regulations, the material subsidiary of the Company viz. Radhika Heights Limited has undertaken secretarial audit for the Financial Year 2018-19.
Material changes and commitments affecting the financial position which have occurred between March 31, 2019 and date of the ReportExcept as disclosed elsewhere in the Annual Report, there have been no material changes and commitments which can affect the financial position of the Company between the end of the financial year and the date of this Report.As required under Section 134(3) of the Act, the Board of Directors inform the members that during the financial year, there have been no material changes, except as disclosed elsewhere in the Annual Report:• in the nature of Company’s business;• in the Company’s subsidiaries or in the nature of business
carried out by them; and• in the classes of business in which the Company has an
interest.Secretarial StandardsThe Directors state that applicable Secretarial Standards i.e. SS-1 and SS-2, relating to ‘Meetings of the Board of Directors’ and ‘General Meetings’, respectively have been duly followed by the Company.Directors’ Responsibility StatementThe Directors hereby confirm that:a) in the preparation of the annual financial statements for
the financial year ended March 31, 2019, the applicable Accounting Standards have been followed along with proper explanation relating to material departures;
b) the directors have selected such accounting policies and applied them consistently and made judgments and estimates that are reasonable and prudent so as to give a true and fair view of the state of affairs of the Company as at March 31, 2019, and of the profits of the Company for the year ended March 31, 2019;
c) the directors have taken proper and sufficient care for the maintenance of adequate accounting records in accordance with the provisions of the Act for safeguarding the assets of the Company and for preventing and detecting fraud and other irregularities;
d) the directors have prepared the annual accounts on a going concern basis;
e) the directors have laid down internal financial controls to be followed by the Company and that such internal financial controls are adequate and are operating effectively; and
f ) the directors have devised proper systems to ensure compliance with the provisions of all applicable laws and that such systems were adequate and operating effectively.
Details in respect of frauds reported by auditors under Section 143(12)During the year under review, there were no frauds reported by the auditors to the Audit Committee or the Board under Section 143(12) of the Act.Particulars of loans, guarantees or investmentsThe Company has made investments or extended loans/guarantees to its wholly owned subsidiaries for their business purposes. The details of loans, guarantees and investments covered under the provisions of Section 186 of the Act, have
Directors’ Report

Annual Report 2018-1932
been disclosed in the notes to the Financial Statements forming part of the Annual Report.Risk ManagementThe Company has formulated a Risk Management Policy and monitors the risk management plan on a periodic basis. The Company has defined a structured approach to manage uncertainty and to make use of these in the decision making in business decisions and corporate functions.The Company has regularly invested in insuring itself against unforeseen risks. The Company’s stocks and insurable assets like building, plant & machinery, computer equipment, office equipment, furniture & fixtures, lease hold improvements and upcoming projects have been adequately insured against major risks. The Company has also taken appropriate product liability insurance policies for conducting clinical trials and for insuring its products (manufactured & sold) with an extension of unnamed vendor liability and add on cover of public liability inclusive of pollution liability to cover the risk on account of claims, if any, filed against the Company.Internal Control SystemYour Company has established a system of internal controls to ensure that assets are safeguarded and transactions are appropriately authorized, recorded and reported. The detailed explanation is provided in the Management Discussion and Analysis Report, forming part of this Report.Internal Financial ControlsThe Company has designed and implemented a process driven framework for Internal Financial Controls (IFC) within the meaning of the explanation to Section 134(5)(e) of the Act. For the year ended on March 31, 2019, the Board is of the opinion that the Company has sound IFC commensurate with the size, scale and complexity of its business operations. The IFC operates effectively and no material weakness exists. The Company has a process in place to continuously monitor the same and identify gaps, if any, and implemented new and / or improved controls whenever the effect of such gaps would have a material effect on the Company’s operations.Vigil MechanismAs required pursuant to the provisions of Section 177(9) of the Act read with Rule 7 of the Companies (Meetings of Board and its Powers) Rules, 2014, Regulation 22 of SEBI LODR Regulations and Regulation 9A of Securities and Exchange Board of India (Prohibition of Insider Trading) Regulations, 2015, your Company has adopted a Vigil Mechanism/Whistle Blower Policy with a view to provide its employees an avenue to raise any sensitive concerns regarding any unethical behavior or wrongful conduct and to enable employees to report instances of leak of unpublished price sensitive information and to provide adequate safeguards for protection from any victimization.
This Policy is available on the website of the Company and can be accessed at: https://www.panaceabiotec.com/statutory-policies. This Policy, inter-alia, provides a direct access to the Chairman of the Audit Committee.Your Company hereby affirms that no director/employee has been denied access to the Chairman of the Audit Committee and that no complaint has been received during the year.Corporate Social ResponsibilityThe provisions of Section 135 of the Act and the Rules made thereunder regarding Corporate Social Responsibility are not attracted to the Company as the Company does not fall under the threshold limit of net worth of Rs.5,000 million or more, or turnover of Rs.10,000 million or more, or a net profit (as defined under Section 198 of the Act) of Rs.50 million or more during the financial year. However, the Company has been, over the years, pursuing Corporate Social Responsibility by putting continuous efforts in the areas of health, education and patient awareness/assistance programs towards the development of happier and healthier society.Prevention of Sexual Harassment at WorkplaceThe Company has in place a Prevention of Sexual Harassment Policy in line with the requirements of The Sexual Harassment of Women at the Work Place (Prevention, Prohibition and Redressal) Act, 2013. All employees (permanent, contractual, temporary, trainees) are covered under this policy.Your company has complied with the provisions relating to constitution of Internal Complaints Committee under the Sexual Harassment of Women at Workplace (Prevention, Prohibition and Redressal) Act, 2013 for dealing with the complaint, if any, relating to sexual harassment of women at workplace. No case has been reported during the year under review.AcknowledgementsYour Directors acknowledge with gratitude the co-operation and assistance received from the UN Agencies, Central Government, State Governments and all other Government agencies and encouragement they have extended to the Company. Your Directors also thank the shareholders, financial institutions, banks/ other lenders, customers, vendors and other business associates for their confidence in the Company and its management and look forward for their continuous support. The Board wishes to place on record its appreciation for the dedication and commitment of the employees at all levels which has continued to be our major strength.
For and on behalf of the Board
Place : New Delhi Soshil Kumar JainDated : August 12, 2019 Chairman
Directors’ Report

Panacea Biotec Ltd. 33
The Company strives to be energy efficient by being conservative in its approach of energy utilization and also utilizing energy efficient devices. The Company regularly reviews energy consumption and maintains effective control on utilization of energy by adopting measures to reduce wastage and optimize consumption. The Company has undertaken several measures to minimize energy losses and ensure sustainable energy utilization.
1. Energy Conservation measures taken:
The Company had devised its production lines and other facilities keeping in view the objective of minimum energy losses. The following are the major energy conservation measures implemented during the year under review and recent past:
• Replacement of CFL lamps and conventional tube lights with LED lights at several locations.
• Used water treated from ETP & STP for plantation & irrigation purposes.
• Used RO rejected water for cooling tower at Lalru Plant.
2. Additional Investments/ Proposals, if any, for reduction of Energy Consumption:
The Company’s initiatives in energy consumption extend beyond the needs of the present to ensure sustainable growth for years ahead. Continuous efforts are being made to further reduce the expenditure on power & fuel in the time to come. A few measures under consideration are listed below:
• The Company intends to continue replacement of CFL lights with LED lights across the organization over a period of time.
• The Company has planned to install a 1.5 ton boiler at its Baddi location to be run on LPG (Liquefied Petroleum Gas) in place of Furnace Oil (FO). This would considerably reduce exhaust emission as LPG is a clean fuel.
3. Impact of measures taken and impact on cost of production of goods:
The energy conservation measures indicated above have helped the Company to reduce the energy consumption & restrict the impact of increase in the cost of energy, thereby reducing the cost of production of goods to that extent.
Annexure to the Directors’ Report
Annexure AParticulars of Conservation of Energy, Technology Absorption and Foreign Exchange Earnings and
Outgo required under the Companies (Accounts) Rules, 2014
Form AParticulars of Consumption of Energy
Particulars Current Year Previous YearA. Power and Fuel Consumption1. Electricity
(a) PurchasedUnits (Nos. in thousand) 26,107.22 24,971.99Total Amount (Rs. in million) 164.16 169.03Rate/Unit (Rs.) 6.29 6.77
(b) Own generation(i) Through Diesel Generator
Units (Nos. in thousand) 634.09 699.39Unit per litre of Diesel/Oil 3.33 3.44Cost/Unit (Rs.) 19.78 16.89
(ii) Through Steam Turbine/GeneratorUnits (Nos.) Nil NilUnit per litre of Diesel/OilCost/Unit (Rs.)
2. CoalQuantity (tonnes) Nil NilTotal Cost Average Rate
3. Furnace OilQuantity (Kilolitres) 2,652.46 1,446.55Total Cost (Rs. in million) 96.46 39.07Rate/Unit (Rs.) 36.37 27.01
4. Others/Internal generationQuantity Nil NilTotal CostRate/Unit
I. Conservation of Energy

Annual Report 2018-1934
Annexure to the Directors’ Report
Form B
II. Technology Absorption
Form for disclosure of particulars with respect to Technology Absorption
Research & Development (R&D)
1. Specific areas in which R&D is carried out by the Company:
The Company had 4 R&D Centres at Lalru, Mohali, New Delhi and Navi Mumbai, manned with around 100 scientists working on several key projects in vaccines, pharmaceutical formulations and biopharmaceuticals. During the year under review, with a view to optimize costs and resources, the R&D Center at Navi Mumbai has been relocated and merged into Sampann R&D Center at Lalru, Punjab and the R&D Centers at New Delhi & Mohali have been shifted to Lalru, Punjab.
The areas of research being pursued by the Company include:
• Platform Technology - SPORTS Technology;• NDDS based pharmaceutical formulations development;• Development of Vaccines;• Development of biosimilar therapeutic products &
monoclonal antibodies; • Small Molecule Drug Discovery (NCE Research) in 3
therapeutic areas, viz. metabolic disorders (Diabetes & Obesity), infectious diseases, and CNS disorders; and
• Development of APIs.2. Benefits derived as a result of the above R&D:
• Development of novel drug delivery products;• Bringing innovative products to market;• Fulfilling unmet therapeutic needs and customer
satisfaction;
• Improved product quality and safety aspects;• Availability of products at affordable prices;• Yield improvement;• Grant of new product/process patents;• Entry into newer markets and export of quality products;
and• Solving public health problems with the availability
of vaccines for immunization of public at large and affordable life-saving drugs for critical diseases like cancer etc.
3. Future Plan of Action:The Company intends to continue to focus on R&D activities for growing its revenues and profitability, inter-alia, in the following areas:• Oral immediate and modified release formulation;• Technology based injectable dosage form;• Nano-emulsion technology based dosage form;• Polymeric nano-particulate system;• Nano-crystal technology;• Solid-Solid dispersion of critical dose drugs;• Biodegradable polymer based long acting injection;• Liposomal drug delivery technology;• Recombinant, polysaccharide conjugate and cell culture
based vaccines; and• Development of biosimilar therapeutic products and
Monoclonal antibodies.
B. Consumption per unit of productionTablets
Production (no. in million) 564.17 663.39Electricity Consumption (Units per thousand) 5.90 5.16
CapsulesProduction (no. in million) 129.87 124.09Electricity Consumption (Units per thousand) 21.55 21.34
SyrupsProduction (in litres) 187,102 198,285Electricity Consumption (Units per kilolitre) 0.67 0.41
GelsProduction (in kilograms) 36,126 45,125Electricity Consumption (Units per kilogram) 5.25 4.57
VaccinesProduction (no. of doses in thousand) 23,298 86,964Electricity Consumption (Units per thousand) 24.57 15.65
Pre-filled Syringes (PFS)Production (no. of PFS in thousand) 610 857Electricity Consumption (Units per thousand) 307.39 323.28
Granules Production (in kilograms) 20,728 22,734Electricity Consumption (Units per kilogram) 0.88 0.74
InjectionsProduction (no. of injection in thousand) 102 80
Electricity Consumption (Units per thousand) 781.74 985.93
Particulars Current Year Previous Year
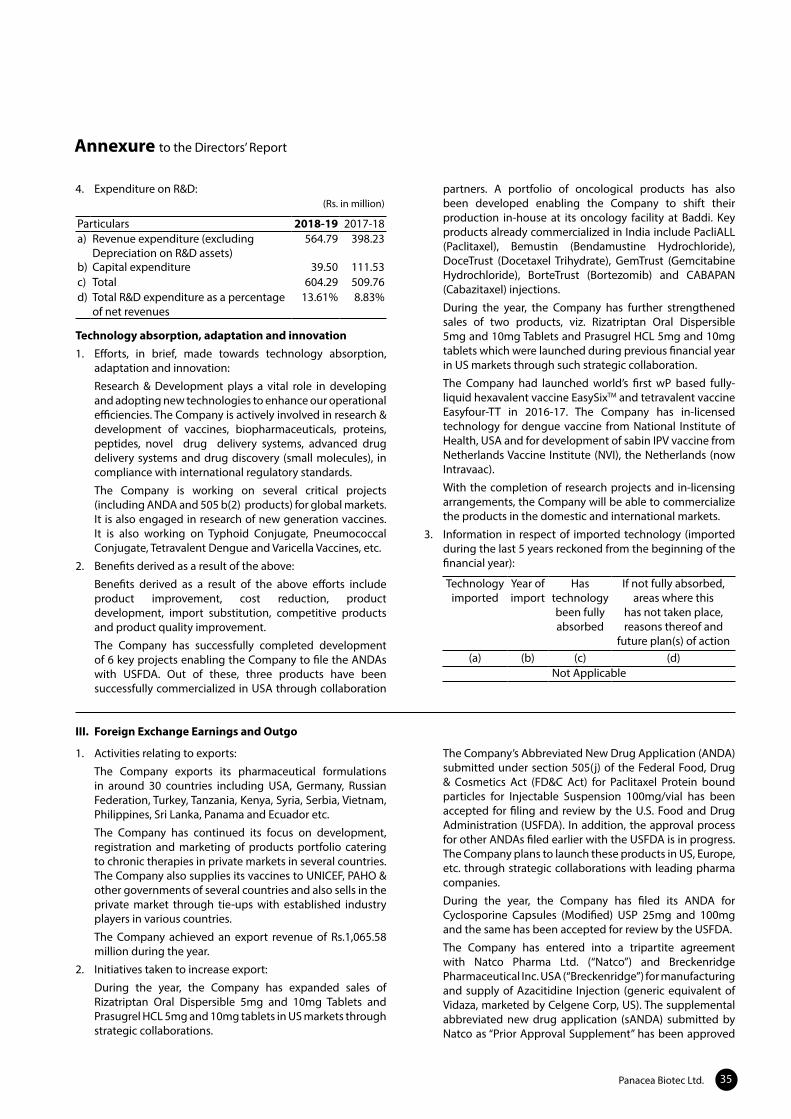
Panacea Biotec Ltd. 35
Annexure to the Directors’ Report
4. Expenditure on R&D: (Rs. in million)
Particulars 2018-19 2017-18a) Revenue expenditure (excluding
Depreciation on R&D assets)564.79 398.23
b) Capital expenditure 39.50 111.53c) Total 604.29 509.76d) Total R&D expenditure as a percentage
of net revenues13.61% 8.83%
Technology absorption, adaptation and innovation1. Efforts, in brief, made towards technology absorption,
adaptation and innovation:
Research & Development plays a vital role in developing and adopting new technologies to enhance our operational efficiencies. The Company is actively involved in research & development of vaccines, biopharmaceuticals, proteins, peptides, novel drug delivery systems, advanced drug delivery systems and drug discovery (small molecules), in compliance with international regulatory standards.
The Company is working on several critical projects (including ANDA and 505 b(2) products) for global markets. It is also engaged in research of new generation vaccines. It is also working on Typhoid Conjugate, Pneumococcal Conjugate, Tetravalent Dengue and Varicella Vaccines, etc.
2. Benefits derived as a result of the above:
Benefits derived as a result of the above efforts include product improvement, cost reduction, product development, import substitution, competitive products and product quality improvement.
The Company has successfully completed development of 6 key projects enabling the Company to file the ANDAs with USFDA. Out of these, three products have been successfully commercialized in USA through collaboration
1. Activities relating to exports:
The Company exports its pharmaceutical formulations in around 30 countries including USA, Germany, Russian Federation, Turkey, Tanzania, Kenya, Syria, Serbia, Vietnam, Philippines, Sri Lanka, Panama and Ecuador etc.
The Company has continued its focus on development, registration and marketing of products portfolio catering to chronic therapies in private markets in several countries. The Company also supplies its vaccines to UNICEF, PAHO & other governments of several countries and also sells in the private market through tie-ups with established industry players in various countries.
The Company achieved an export revenue of Rs.1,065.58 million during the year.
2. Initiatives taken to increase export:
During the year, the Company has expanded sales of Rizatriptan Oral Dispersible 5mg and 10mg Tablets and Prasugrel HCL 5mg and 10mg tablets in US markets through strategic collaborations.
The Company’s Abbreviated New Drug Application (ANDA) submitted under section 505(j) of the Federal Food, Drug & Cosmetics Act (FD&C Act) for Paclitaxel Protein bound particles for Injectable Suspension 100mg/vial has been accepted for filing and review by the U.S. Food and Drug Administration (USFDA). In addition, the approval process for other ANDAs filed earlier with the USFDA is in progress. The Company plans to launch these products in US, Europe, etc. through strategic collaborations with leading pharma companies.
During the year, the Company has filed its ANDA for Cyclosporine Capsules (Modified) USP 25mg and 100mg and the same has been accepted for review by the USFDA.
The Company has entered into a tripartite agreement with Natco Pharma Ltd. (“Natco”) and Breckenridge Pharmaceutical Inc. USA (“Breckenridge”) for manufacturing and supply of Azacitidine Injection (generic equivalent of Vidaza, marketed by Celgene Corp, US). The supplemental abbreviated new drug application (sANDA) submitted by Natco as “Prior Approval Supplement” has been approved
III. Foreign Exchange Earnings and Outgo
partners. A portfolio of oncological products has also been developed enabling the Company to shift their production in-house at its oncology facility at Baddi. Key products already commercialized in India include PacliALL (Paclitaxel), Bemustin (Bendamustine Hydrochloride), DoceTrust (Docetaxel Trihydrate), GemTrust (Gemcitabine Hydrochloride), BorteTrust (Bortezomib) and CABAPAN (Cabazitaxel) injections.
During the year, the Company has further strengthened sales of two products, viz. Rizatriptan Oral Dispersible 5mg and 10mg Tablets and Prasugrel HCL 5mg and 10mg tablets which were launched during previous financial year in US markets through such strategic collaboration.
The Company had launched world’s first wP based fully-liquid hexavalent vaccine EasySixTM and tetravalent vaccine Easyfour-TT in 2016-17. The Company has in-licensed technology for dengue vaccine from National Institute of Health, USA and for development of sabin IPV vaccine from Netherlands Vaccine Institute (NVI), the Netherlands (now Intravaac).
With the completion of research projects and in-licensing arrangements, the Company will be able to commercialize the products in the domestic and international markets.
3. Information in respect of imported technology (imported during the last 5 years reckoned from the beginning of the financial year):
Technology imported
Year of import
Has technology been fully absorbed
If not fully absorbed, areas where this
has not taken place, reasons thereof and
future plan(s) of action(a) (b) (c) (d)
Not Applicable

Annual Report 2018-1936
Annexure to the Directors’ Report
by the USFDA on May 6, 2019. The Company has received USFDA approval for this product and has launched the same in USA during current financial year through Breckenridge.
3. Development of new export markets for Products and Export Plans:
The Company has taken necessary steps to strengthen and grow its exports in the coming years including strengthening marketing team, entering into newer markets, registering products in more countries as well as strengthening existing relationships with the partners. The Company has further continued its focus on development, registration and marketing of products portfolio catering to chronic therapies in private markets in several countries. Simultaneously, the Company has consolidated its international pharmaceutical business by eliminating loss making products, markets etc.
The Company continues to focus on building a robust pipeline of several products for filing in several other emerging markets which it will be filing in the next 1-2 years and aims to improve the accessibility and affordability of medicines as the Company's contribution to Government of India's “MAKE IN INDIA” mission.
The Company has received the registration of Bendamustin (first oncology registration) in Syria and launched in-housed developed product Sitcom (for hemorrhoids) in Zambia and Uzbekistan.
4. Total foreign exchange earned and used:(Rs. in million)
Particulars 2018-19 2017-18Foreign Exchange Earned:F.O.B. value of Exports 953.85 1,424.27 Research & License Fees 7.59 102.29 Interest Income from subsidiary company 32.09 73.47 Royalty Income 0.71 - Profit Share For Sale (Export) 2.20 - Litigation avoidance fee received 206.59 - Total 1,203.03 1,600.03 Foreign Exchange Used:Raw Materials & Packing Materials 265.92 907.66Components & Spare Parts 7.45 4.79Capital Goods 1.08 18.17Interest 97.47 109.22Legal & Professional Fees 21.32 24.56Royalty - 0.47Other Expenses:
- Patents, Trade Marks & Product Registration 5.87 4.83- Advertising and Sales Promotion 17.34 15.78- Commission on Sales 5.02 5.99- Rates & Taxes 29.28 21.52- Testing charges 2.14 3.96- General expenses 5.05 7.16- Bank charges 0.86 1.12- Travelling expenses 2.21 2.94- Others 5.63 3.27
Total 466.66 1,131.44
For and on behalf of the Board
Place: New Delhi Soshil Kumar Jain
Dated: August 12, 2019 Chairman

Panacea Biotec Ltd. 37
Annexure to the Directors’ Report
ANNEXURE BFORM NO. MGT-9
EXTRACT OF ANNUAL RETURNAs on financial year ended on March 31, 2019
[Pursuant to Section 92(3) of the Companies Act, 2013 read with Rule 12(1) of the Companies (Management & Administration) Rules, 2014]
I. REGISTRATION & OTHER DETAILS1 CIN L33117PB1984PLC0223502 Registration Date 02-02-19843 Name of the Company Panacea Biotec Limited4 Category/Sub-category of the Company Public Company / Limited by Shares5 Address of the Registered office & contact details Ambala-Chandigarh Highway, Lalru-140501, Punjab
Phone: +91-1762-505900 E-mail: [email protected] Website : www.panaceabiotec.com
6 Whether listed company Yes7 Name, Address & Contact Details of the Registrar &
Transfer Agent, if anyM/s. Skyline Financial Services Private Limited D-153 A, 1st Floor, Okhla Indl. Area, Phase-I, New Delhi - 110020, India Phone: 91-11-40450193-97, E-mail: [email protected]
II. PRINCIPAL BUSINESS ACTIVITIES OF THE COMPANY (All the business activities contributing 10% or more of the total turnover of the company shall be stated)
S. No. Name and Description of main Products / Services NIC Code of the Product / Service % to total turnover of the Company1 Manufacture of allopathic Pharmaceuticals preparations 21002 100
III. PARTICULARS OF HOLDING, SUBSIDIARY AND ASSOCIATE COMPANIESS.
No.Name and address of the Company CIN/GLN Holding/ Subsidiary/ Associate % of shares
heldApplicable
Section1 Radhika Heights Limited U74899PB1995PLC045879 Wholly Owned Subsidiary 100 2(87)2 Cabana Construction Private Limited U80904PB2007PTC045878 Step down Subsidiary 100 2(87)3 Cabana Structures Limited U15122PB2007PLC045877 Step down Subsidiary 100 2(87)4 Nirmala Buildwell Private Limited U55101PB2007PTC045914 Step down Subsidiary 100 2(87)5 Nirmala Organic Farms & Resorts Private Limited U01403PB2010PTC045880 Step down Subsidiary 100 2(87)6 Radicura Infra Limited U74899PB1993PLC045881 Step down Subsidiary 100 2(87)7 Sunanda Infra Limited U13209PB2007PLC045882 Step down Subsidiary 100 2(87)8 Panacea Biotec Pharma Limited* U24299DL2019PLC347566 Wholly Owned Subsidiary 100 2(87)9 Rees Investments Limited** Foreign Company Wholly Owned Subsidiary 100 2(87)
10 Panacea Biotec (International) SA Foreign Company Wholly Owned Subsidiary 100 2(87)11 Panacea Biotec Germany GmbH Foreign Company Step down Subsidiary 100 2(87)12 PanEra Biotec Private Limited# U24231DL1999PTC102557 Associate 50 2(6)13 Adveta Power Private Limited# U40101HP2011PTC031700 Joint Venture 50 2(6)14 Chiron Panacea Vaccines Private Limited
(Under liquidation)U24230MH2004PTC147790 Joint Venture 50 2(6)
* Subsidiary incorporated on March 22, 2019. ** Dissolved w.e.f. May 23, 2019. # Considered as Subsidiary for the purpose of consolidation of accounts as per Ind-AS.
IV. SHAREHOLDING PATTERN (Equity Share Capital breakup as percentage of total equity)
(i) Category-wise ShareholdingCategory of Shareholders No. of Shares held at the beginning of the year No. of Shares held at the end of the year % Change
during the yearDemat Physical Total % of Total
Shares Demat Physical Total % of Total Shares
A. Promoter and Promoter Group(1) Indiana) Individual/ HUF 43,057,230 - 43,057,230 70.30% 42,761,412 - 42,761,412 69.81% -0.48%b) Central Government - - - - - - - - - c) State Government(s) - - - - - - - - - d) Bodies Corporate - - - - - - - - - e) Banks / FI - - - - - - - - - (f ) Partnership Firms 2,313,454 - 2,313,454 3.78% 2,313,454 - 2,313,454 3.78% - Sub Total (A) (1) 45,370,684 - 45,370,684 74.07% 45,074,866 - 45,074,866 73.59% -0.48%

Annual Report 2018-1938
Annexure to the Directors’ Report
Category of Shareholders No. of Shares held at the beginning of the year No. of Shares held at the end of the year % Change during the
yearDemat Physical Total % of Total Shares Demat Physical Total % of Total
Shares(2) Foreigna) NRI Individuals - - - - - - - - - b) Other Individuals - - - - - - - - - c) Bodies Corporate - - - - - - - - - d) Banks / FI - - - - - - - - - e) Any other - - - - - - - - - Sub Total (A) (2) - - - - - - - - - Total Promoter and Promoter Group Shareholding (A) 45,370,684 - 45,370,684 74.07% 45,074,866 - 45,074,866 73.59% -0.48%
B. Public Shareholding1. Institutionsa) Mutual Funds - - - - 726,222 - 726,222 1.19% 1.19%b) Banks / FI 74,283 - 74,283 0.12% 31,340 - 31,340 0.05% -0.07%c) Central Government - - - - - - - - - d) State Government(s) - - - - - - - - - e) Venture Capital Funds - - - - - - - - - f ) Insurance Companies - - - - - - - - - g) FIIs - - - - - - - - - h) Foreign Venture Capital Funds - - - - - - - - - i) Others (specify) - - - - - - - - - Sub-total (B)(1): 74,283 - 74,283 0.12% 757,562 - 757,562 1.24% 1.12%2. Non-Institutionsa) Bodies Corporatei) Indian 8,120,522 - 8,120,522 13.26% 7,502,653 - 7,502,653 12.25% -1.01%ii) Overseas - - - - - - - - - b) Individuals - i) Individual shareholders holding nominal share capital upto Rs. 1 lakh
3,261,708 332,761 3,594,469 5.87% 3,020,964 256,251 3,277,215 5.35% -0.52%
ii) Individual shareholders holding nominal share capital in excess of Rs. 1 lakh
3,515,428 - 3,515,428 5.74% 3,873,492 - 3,873,492 6.32% 0.58%
c) Hindu Undivided Family 132,857 - 132,857 0.22% 175,369 - 175,369 0.29% 0.07%d) Non Resident Indians 94,329 - 94,329 0.15% 94,628 - 94,628 0.15% - e) Overseas Corporate Bodies 183,850 - 183,850 0.30% - - - - -0.30%f) Foreign Nationals - - - - - - - - - g) Clearing Members 26,045 - 26,045 0.04% 240,510 - 240,510 0.39% 0.35%h) Trusts - - - - - - - - -i) Foreign Portfolio Investors - - - - 139,173 - 139,173 0.23% 0.23%j) Foreign Corporate Bodies 65,400 - 65,400 0.11% - - - - -0.11%k) Investor Education and Protection Fund Authority, Ministry of Corporate Affairs
72,879 - 72,879 0.12% 115,278 - 115,278 0.19% 0.07%
Sub-total (B)(2) 15,473,018 332,761 15,805,779 25.81% 15,162,067 256,251 15,418,318 25.17% -0.63%Total Public Shareholding (B) 15,547,301 332,761 15,880,062 25.93% 15,919,629 256,251 16,175,880 26.41% 0.48%C. Shares held by Custodian for GDRs & ADRs - - - - - - - - -
Grand Total (A+B+C) 60,917,985 332,761 61,250,746 100.00% 60,994,495 256,251 61,250,746 100.00% -

Panacea Biotec Ltd. 39
Annexure to the Directors’ Report
(ii) Shareholding of Promoters and Promoters GroupS. No. Shareholder’s Name Shareholding at the beginning of the year Shareholding at the end of the year % change in
shareholding during the year
No. of Shares
% of total Shares of the
company
% of Shares Pledged/
encumbered to total shares
No. of Shares
% of total Shares of the
company
% of Shares Pledged /
encumbered to total shares
A. Promoters1 Mr. Soshil Kumar Jain 5,000,000 8.16% 100.00% 5,000,000 8.16% 100.00% 0.00%2 Dr. Rajesh Jain 6,213,500 10.14% 100.00% 6,213,500 10.14% 100.00% 0.00%3 Mr. Sandeep Jain 4,792,100 7.82% 100.00% 4,792,100 7.82% 100.00% 0.00%B. Promoters Group4 Mrs. Nirmala Jain 2,511,000 4.10% - 2,511,000 4.10% - 0.00%5 Mrs. Sunanda Jain 6,647,300 10.85% - 6,647,300 10.85% - 0.00%6 Mrs. Meena Jain 897,000 1.46% - 897,000 1.46% - 0.00%7 Mrs. Pamilla Jain 816,500 1.33% - 816,500 1.33% - 0.00%8 Soshil Kumar Jain (HUF) 2,251,713 3.68% - 2,251,713 3.68% - 0.00%9 Ravinder Jain (HUF) 4,135,000 6.75% - 4,135,000 6.75% - 0.00%
10 Rajesh Jain (HUF) 4,046,617 6.61% - 3,750,799 6.12% - -0.48%11 Sandeep Jain (HUF) 4,105,000 6.70% - 4,105,000 6.70% - 0.00%12 Mr. Sumit Jain 358,500 0.59% - 358,500 0.59% - 0.00%13 Mr. Nipun Jain - - - - - - - 14 Mrs. Radhika Jain 357,000 0.58% - 357,000 0.58% - 0.00%15 Mrs. Priyanka Jain 318,000 0.52% - 318,000 0.52% - 0.00%16 Mr. Ankesh Jain 307,000 0.50% - 307,000 0.50% - 0.00%17 Mr. Harshet Jain 299,500 0.49% - 299,500 0.49% - 0.00%18 Mr. Abhey Kumar Jain 1,000 0.00% - 1,000 0.00% - 0.00%19 Mrs Kanta Rani - - - - - - - 20 Mr. Ashish Jain 500 0.00% - 500 0.00% - 0.00%21 First Lucre Partnership Co. 2,255,815 3.68% - 2,255,815 3.68% - 0.00%22 Second Lucre Partnership Co. 57,639 0.09% - 57,639 0.09% - 0.00%
(iii) Change in Promoters and Promoters Group Shareholding (please specify, if there is no change)S. No. Shareholder’s Name Shareholding Date Increase/
Decrease in Shareholding
Reason Cumulative Shareholding during the year
No. of shares
% of total shares of the
Company
No. of shares % of total shares of the
CompanyA. Promoters NilB. Promoters Group1 Dr. Rajesh Jain (HUF)
at the beginning of the year 4,046,617 6.61% 01.04.2018 4,046,617 6.61%change in shareholding 29.08.2018 (163,298) Transfer 3,883,319 6.34%
30.08.2018 (1,103) Transfer 3,882,216 6.34%31.08.2018 (102,264) Transfer 3,779,952 6.17%03.09.2018 (29,153) Transfer 3,750,799 6.12%
at the end of the year 3,750,799 6.12% 31.03.2019 3,750,799 6.12%

Annual Report 2018-1940
Annexure to the Directors’ Report
(iv) Shareholding pattern of top 10 Shareholders (Other than Directors, Promoters and Holders of GDRs and ADRs):S. No. Shareholder’s Name Shareholding Date Increase/
Decrease in Shareholding
Reason Cumulative Shareholding during the year
No. of shares
% of total shares of the
Company
No. of shares % of total shares of the
Company1 Serum Institute of India Private Limited
at the beginning of the year 5,774,732 9.43% 01.04.2018 5,774,732 9.43%change in shareholding - - 5,774,732 9.43%at the end of the year 5,774,732 9.43% 31.03.2019 5,774,732 9.43%
2 Adar Cyrus Poonawalaat the beginning of the year 3,157,900 5.16% 01.04.2018 3,157,900 5.16%change in shareholding 06.04.2018 99,950 Transfer 3,257,850 5.32%
13.04.2018 (18,353) Transfer 3,239,497 5.29%20.04.2018 (77,830) Transfer 3,161,667 5.16%27.04.2018 (4,633) Transfer 3,157,034 5.15%
at the end of the year 3,157,034 5.15% 31.03.2019 3,157,034 5.15%3 ICICI Prudential Pharma Healthcare And Diagnostics (P.H.D) Fund
at the beginning of the year - 0.00% 01.04.2018 - 0.00%change in shareholding 10.08.2018 42,241 Transfer 42,241 0.07%
17.08.2018 32,767 Transfer 75,008 0.12%24.08.2018 110,457 Transfer 185,465 0.30%31.08.2018 214,535 Transfer 400,000 0.65%07.09.2018 200,000 Transfer 600,000 0.98%05.10.2018 17,556 Transfer 617,556 1.01%12.10.2018 368 Transfer 617,924 1.01%19.10.2018 2,529 Transfer 620,453 1.01%14.12.2018 105,769 Transfer 726,222 1.19%
at the end of the year 726,222 1.19% 31.03.2019 726,222 1.19%4 Apoorva Realtors and Finvest Pvt. Ltd.
at the beginning of the year 760,662 1.24% 01.04.2018 760,662 1.24%change in shareholding 01.03.2019 (65,000) Transfer 695,662 1.14%at the end of the year 695,662 1.14% 31.03.2019 695,662 1.14%
5 Chakan Investment Pvt. Ltd.at the beginning of the year 222,149 0.36% 01.04.2018 222,149 0.36%change in shareholding - - 222,149 0.36%at the end of the year 222,149 0.36% 31.03.2019 222,149 0.36%
6 Guttikonda Vara Lakshmiat the beginning of the year 122,722 0.20% 122,722 0.20%change in shareholding 24.08.2018 4,000 Transfer 126,722 0.21%
21.09.2018 18,400 Transfer 145,122 0.24%22.02.2019 23,459 Transfer 168,581 0.28%01.03.2019 15,000 Transfer 183,581 0.30%
at the end of the year 183,581 0.30% 31.03.2019 183,581 0.30%7 Gain Premium Limited
at the beginning of the year 183,850 0.30% 01.04.2018 183,850 0.30%change in shareholding 06.07.2018 (500) Transfer 183,350 0.30%
01.03.2019 (500) Transfer 182,850 0.30%29.03.2019 450 Transfer 183,300 0.30%
at the end of the year 183,300 0.30% 31.03.2019 183,300 0.30%8 Corpint Investments Pvt. Ltd.
at the beginning of the year 175,753 0.29% 01.04.2018 175,753 0.29%change in shareholding - - 175,753 0.29%at the end of the year 175,753 0.29% 31.03.2019 175,753 0.29%

Panacea Biotec Ltd. 41
S. No. Shareholder’s Name Shareholding Date Increase/ Decrease in
Shareholding
Reason Cumulative Shareholding during the year
No. of shares
% of total shares of the
Company
No. of shares % of total shares of the
Company
Annexure to the Directors’ Report
9 Priti Ketan Kotechaat the beginning of the year 104,806 0.17% 01.04.2018 104,806 0.17%change in shareholding 06.04.2018 1,050 Transfer 105,856 0.17%
13.04.2018 2,813 Transfer 108,669 0.18%20.04.2018 3 Transfer 108,672 0.18%27.04.2018 1,008 Transfer 109,680 0.18%11.05.2018 1,600 Transfer 111,280 0.18%18.05.2018 38 Transfer 111,318 0.18%25.05.2018 2,135 Transfer 113,453 0.19%01.06.2018 27 Transfer 113,480 0.19%08.06.2018 2,379 Transfer 115,859 0.19%15.06.2018 136 Transfer 115,995 0.19%22.06.2018 923 Transfer 116,918 0.19%29.06.2018 216 Transfer 117,134 0.19%06.07.2018 (40) Transfer 117,094 0.19%13.07.2018 1,698 Transfer 118,792 0.19%20.07.2018 510 Transfer 119,302 0.19%03.08.2018 419 Transfer 119,721 0.20%10.08.2018 (29,000) Transfer 90,721 0.15%17.08.2018 1,082 Transfer 91,803 0.15%24.08.2018 (3,237) Transfer 88,566 0.14%31.08.2018 1,794 Transfer 90,360 0.15%07.09.2018 2,462 Transfer 92,822 0.15%14.09.2018 400 Transfer 93,222 0.15%21.09.2018 1,023 Transfer 94,245 0.15%28.09.2018 3,577 Transfer 97,822 0.16%05.10.2018 2,601 Transfer 100,423 0.16%12.10.2018 4,391 Transfer 104,814 0.17%26.10.2018 7,075 Transfer 111,889 0.18%02.11.2018 (499) Transfer 111,390 0.18%09.11.2018 (200) Transfer 111,190 0.18%16.11.2018 611 Transfer 111,801 0.18%23.11.2018 447 Transfer 112,248 0.18%30.11.2018 555 Transfer 112,803 0.18%07.12.2018 106 Transfer 112,909 0.18%14.12.2018 126 Transfer 113,035 0.18%21.12.2018 1,171 Transfer 114,206 0.19%28.12.2018 1,079 Transfer 115,285 0.19%04.01.2019 684 Transfer 115,969 0.19%11.01.2019 827 Transfer 116,796 0.19%18.01.2019 819 Transfer 117,615 0.19%25.01.2019 11,980 Transfer 129,595 0.21%01.02.2019 29,984 Transfer 159,579 0.26%08.02.2019 124 Transfer 159,703 0.26%15.02.2019 (617) Transfer 159,086 0.26%22.02.2019 270 Transfer 159,356 0.26%01.03.2019 5 Transfer 159,361 0.26%08.03.2019 4,541 Transfer 163,902 0.27%15.03.2019 (1,468) Transfer 162,434 0.27%22.03.2019 920 Transfer 163,354 0.27%29.03.2019 (1,996) Transfer 161,358 0.26%31.03.2019 300 Transfer 161,658 0.26%
at the end of the year 161,658 0.26% 31.03.2019 161,658 0.26%

Annual Report 2018-1942
S. No. Shareholder’s Name Shareholding Date Increase/ Decrease in
Shareholding
Reason Cumulative Shareholding during the year
No. of shares
% of total shares of the
Company
No. of shares % of total shares of the
Company
Annexure to the Directors’ Report
10 Investor Education and Protection Fund Authority, Ministry of Corporate Affairsat the beginning of the year 72,879 0.12% 01.04.2018 72,879 0.12%change in shareholding 19.10.2018 (15) Transfer 72,864 0.12%
23.11.2018 40,430 Transfer 113,294 0.18%30.11.2018 1,984 Transfer 115,278 0.19%
at the end of the year 115,278 0.19% 31.03.2019 115,278 0.19%11 Mukul Mahavir Agarwal @
at the beginning of the year 130,000 0.21% 01.04.2018 130,000 0.21%change in shareholding 06.04.2018 (130,000) Transfer - - at the end of the year - - 31.03.2019 - -
12. SI Investments and Broking Pvt. Ltd. @at the beginning of the year 102,817 0.17% 01.04.2018 102,817 0.17%change in shareholding 04.05.2018 12,327 Transfer 115,144 0.19%
03.08.2018 (15,144) Transfer 100,000 0.16%07.12.2018 (2,953) Transfer 97,047 0.16%14.12.2018 (97,047) Transfer - -
at the end of the year - - 31.03.2019 - -@ Ceased to be in the list of Top 10 shareholders as on March 31, 2019 but was in the list of top 10 shareholders as on April 01, 2018.
(v) Shareholding of Directors and Key Managerial PersonnelS. No. Shareholder’s Name Shareholding Date Increase/
Decrease in Shareholding
Reason Cumulative Shareholding during the year
No. of shares % of total shares of the
Company
No. of shares % of total shares of the
CompanyA. Executive Directors:
1 Mr. Soshil Kumar Jainat the beginning of the year 5,000,000 8.16% 01.04.2018 5,000,000 8.16%change in shareholding - - 5,000,000 8.16%at the end of the year 5,000,000 8.16% 31.03.2019 5,000,000 8.16%
2 Dr. Rajesh Jainat the beginning of the year 6,213,500 10.14% 01.04.2018 6,213,500 10.14%change in shareholding - - 6,213,500 10.14%at the end of the year 6,213,500 10.14% 31.03.2019 6,213,500 10.14%
3 Mr. Sandeep Jainat the beginning of the year 4,792,100 7.82% 01.04.2018 4,792,100 7.82%change in shareholding - - 4,792,100 7.82%at the end of the year 4,792,100 7.82% 31.03.2019 4,792,100 7.82%
4 Mrs. Sunanda Jainat the beginning of the year 6,647,300 10.85% 01.04.2018 6,647,300 10.85%change in shareholding 6,647,300 10.85%at the end of the year 6,647,300 10.85% 31.03.2019 6,647,300 10.85%
5 Mr. Sumit Jainat the beginning of the year 358,500 0.59% 01.04.2018 358,500 0.59%change in shareholding - - 358,500 0.59%at the end of the year 358,500 0.59% 31.03.2019 358,500 0.59%
6 Mr. Ankesh Jainat the beginning of the year 307,000 0.50% 01.04.2018 307,000 0.50%change in shareholding - - 307,000 0.50%at the end of the year 307,000 0.50% 31.03.2019 307,000 0.50%
B. Non Executive Directors:1 Mr. Raghava Lakshmi Narasimhan
at the beginning of the year - - 01.04.2018 - -change in shareholding - - - -at the end of the year - - 31.03.2019 - -

Panacea Biotec Ltd. 43
Annexure to the Directors’ Report
S. No. Shareholder’s Name Shareholding Date Increase/ Decrease in
Shareholding
Reason Cumulative Shareholding during the year
No. of shares % of total shares of the
Company
No. of shares % of total shares of the
Company2 Mr. Namdeo Narayan Khamitkar
at the beginning of the year - - 01.04.2018 - -change in shareholding - - - -at the end of the year - - 31.03.2019 - -
3 Mr. Krishna Murari Lalat the beginning of the year - - 01.04.2018 - -change in shareholding - - - -at the end of the year - - 31.03.2019 - -
4 Mr. Om Prakash Kelkar*at the beginning of the year - - 01.04.2018 - -change in shareholding - - - -at the end of the year - - 31.03.2019 - -
5 Mrs. Manjula Upadhyayat the beginning of the year - - 01.04.2018 - -change in shareholding - - - -at the end of the year - - 31.03.2019 - -
6 Mr. Mukul Guptaat the beginning of the year - - 01.04.2018 - -change in shareholding - - - -at the end of the year - - 31.03.2019 - -
7 Mr. Ashwini Luthra**at the beginning of the year - - 01.04.2018 - -change in shareholding - - - -at the end of the year - - 31.03.2019 - -
C. Key Managerial Personnel (KMPs):1 Mr. Vinod Goel (Company Secretary)
at the beginning of the year 250 0.00% 01.04.2018 250 0.00%change in shareholding - - 250 0.00%at the end of the year 250 0.00% 31.03.2019 250 0.00%
2 Mr. Devender Gupta (Chief Financial Officer)at the beginning of the year - - 01.04.2018 - -change in shareholding - - - -at the end of the year - - 31.03.2019 - -
* Ceased to be director w.e.f. 21.07.2018 due to his sad demise on 21.07.2018.**Appointed as Non-Executive Independent Director w.e.f. 18.10.2018.
V. INDEBTEDNESSIndebtedness of the Company including interest outstanding/accrued but not due for payment.
(Rs. in million)Particulars Secured Loans excluding
depositsUnsecured Loans Deposits Total Indebtedness
Indebtedness at the beginning of the financial year i) Principal Amount 9,061.62 540.65 - 9,602.27 ii) Interest due but not paid 1.77 143.13 - 144.90 iii) Interest accrued but not due 6.28 13.69 - 19.97 Total (i+ii+iii) 9,069.67 697.47 - 9,767.14 Change in Indebtedness during the financial year Addition - 51.05 - 51.05 Reduction 3,016.69 - - 3,016.69 Net Change (3,016.69) 51.05 - (2,965.64) Indebtedness at the end of the financial year i) Principal Amount 6,045.65 735.68 - 6,781.33 ii) Interest due but not paid - 12.84 - 12.84 iii) Interest accrued but not due 6.01 1.32 - 7.33 Total (i+ii+iii) 6,051.66 749.84 - 6,801.50

Annual Report 2018-1944
Annexure to the Directors’ Report
VI. REMUNERATION OF DIRECTORS AND KEY MANAGERIAL PERSONNELA. Remuneration to Managing Director, Whole-time Directors and/or Manager:
(Rs. in million)S.
No.Particulars of Remuneration Name of MD/WTD/ Manager Total
AmountName Mr. Soshil Kumar Jain
Dr. Rajesh Jain
Mr. Sandeep Jain
Mrs. Sunanda Jain
Mr. Sumit Jain Mr. Ankesh Jain
Designation Chairman Managing Director
Joint Managing
Director
Whole-time Director
Director (Operations &
Projects)
Director (Sales
& Marketing)1 Gross salary
(a) Salary as per provisions of Section 17(1) of the Income-tax Act, 1961
9.60 6.00 5.52 4.80 3.60 1.80 31.32
(b) Value of perquisites u/s 17(2) of the Income-tax Act, 1961
1.59 1.30 1.18 1.00 0.58 0.62 6.27
(c) Profits in lieu of salary under Section 17(3) of Income-tax Act, 1961
- - - - - - -
2 Stock Option - - - - - - - 3 Sweat Equity - - - - - - - 4 Commission - - - - - - -
- as % of profit - - - - - - - - others - - - - - - -
5 Others - - - - - - - Total 11.19 7.30 6.70 5.80 4.18 2.42 37.59
B. Remuneration to other Directors (Rs. in million)
S. No.Particulars of Remuneration Name of Directors
Total Amount
Independent Directors Mr. R. L. Narasimhan
Mr. N. N. Khamitkar
Mr. K. M. Lal
Mr. O.P. Kelkar*
Mrs. Manjula Upadhyay
Mr. Mukul Gupta
Mr. Ashwini Luthra**
1 Fee for attending board / committee meetings 0.33 0.31 0.27 - 0.25 0.25 0.10 1.51 2 Commission - - - - - - - - 3 Others- monthly allowances - - - - - - - -
Total 0.33 0.31 0.27 - 0.25 0.25 0.10 1.51 * Ceased to be director w.e.f. 21.07.2018 due to his sad demise on 21.07.2018.**Appointed as Non-Executive Independent Director w.e.f. 18.10.2018.
C. Remuneration to Key Managerial Personnel other than MD/Manager/WTD:(Rs. in million)
S. No. Particulars of Remuneration Name of Key Managerial Personnel Total AmountName Mr. Vinod Goel Mr. Devender GuptaDesignation Group CFO and Head Legal
& CSCFO & Head IT
1 Gross salary(a) Salary as per provisions of Section 17(1) of the Income-tax Act, 1961 5.60 4.37 9.97
(b) Value of perquisites u/s 17(2) of the Income-tax Act, 1961 0.02 - 0.02
(c) Profits in lieu of salary under Section 17(3) of the Income- tax Act, 1961 - - -
2 Stock Option - - - 3 Sweat Equity - - - 4 Commission - -
- as % of profit - - - - others - - -
5 Others - - - Total 5.62 4.37 9.99
VII. PENALTIES / PUNISHMENT/ COMPOUNDING OF OFFENCES:
During the year 2018-19, there were no penalties/punishment/ compounding of offences under the Companies Act, 2013
For and on behalf of the Board
Place : New Delhi Soshil Kumar JainDated : August 12, 2019 Chairman
Note: 0.0 under “Rs. in millions” represents amount less than Rs.50,000, 0.0 under units represents units less than 50,000 and 0.00% under percentage represents percentage less than 0.01%. Further, the figures shown in the tables may not exactly add up due to rounding off.

Panacea Biotec Ltd. 45
Annexure to the Directors’ Report
For and on behalf of the Board
Place : New Delhi Soshil Kumar JainDated : August 12, 2019 Chairman
ANNEXURE CFORM NO. AOC - 2
[Pursuant to clause (h) of Sub section (3) of Section 134 of the Companies Act, 2013 and Rule 8 (2) of the Companies (Accounts) Rules, 2014]
Form for disclosure of particulars of contracts/arrangements entered into by the Company with the related parties referred to in sub section (1) of Section 188 of the Companies Act, 2013 including certain arms' length transactions under third proviso thereto
1. Details of contracts or arrangements or transactions not at arm’s length basis :
2. Details of material contracts or arrangements or transactions at arm’s length basis:
S. No.
Name of the related party and nature of
relationship
Nature of contracts /
arrangements / transactions
Duration of contracts/
arrangements / transactions
Salient features of contracts/
arrangements / transactions, including
value, if any
Date(s) of approval
by the Board
Amount paid as
advances, if any
Date on which special resolution
was passed in General Meeting u/s 188 (1)
(a) (b) (c) (d) (e) (f ) (g)NIL
S. No.
Name of the related party and nature of
relationship
Nature of contracts /
arrangements / transactions
Duration of contracts/
arrangements / transactions
Salient features of contracts/
arrangements / transactions, including
value, if any
Date(s) of approval
by the Board
Amount (Rs. In
million)
Date on which special resolution
was passed in General Meeting u/s 188 (1)
(a) (b) (c) (d) (e) (f ) (g)NIL
ANNEXURE DStatement pursuant to Section 197(12) of the Companies Act, 2013 read with Rule 5(1) of the Companies (Appointment and Remuneration of Managerial Personnel) Rules, 2014 and forming part of the Directors' Report for the year ended March 31, 2019a. The ratio of the remuneration of each Director to the median remuneration of the employees of the Company for the financial year 2018-19:
b. The percentage increase in remuneration of each Director, Chief Financial Officer, Chief Executive Officer, Company Secretary or Manager, if any, in the financial year 2018-19:
Name of the Director Designation Ratio to median remuneration of employeesMr. Soshil Kumar Jain Chairman 36.22Dr. Rajesh Jain Managing Director 23.64Mr. Sandeep Jain Joint Managing Director 21.70Mrs. Sunanda Jain Whole-time Director 18.78Mr. Sumit Jain Director Operations & Projects 13.54Mr. Ankesh Jain Director Sales & Marketing 7.85
Name of the Director & KMP Designation % increase in remunerationMr. Soshil Kumar Jain Chairman 4.5%Dr. Rajesh Jain Managing Director 0.7%Mr. Sandeep Jain Joint Managing Director 1.6%Mrs. Sunanda Jain Whole-time Director 2.5%Mr. Sumit Jain Director Operations & Projects 1.9%Mr. Ankesh Jain Director Sales & Marketing 5.4%Mr. Devender Gupta Chief Financial Officer and Head Information Technology 9.88%Mr. Vinod Goel Group C.F.O. and Head Legal & Company Secretary 10.13%
For and on behalf of the Board
Place : New Delhi Soshil Kumar JainDated : August 12, 2019 Chairman
c. The percentage increase in the median remuneration of employees in the financial year 2018-19: 10.38%.d. The number of permanent employees on the rolls of the Company: 2,314 as at March 31, 2019.e. Average percentile increase already made in the salaries of employees other than the managerial personnel in the last financial year and its
comparison with the percentile increase in the managerial remuneration and justification thereof and point out if there are any exceptional circumstances for increase in the managerial remuneration: The average percentile decrease in remuneration of employees other than managerial remuneration was 9.71%. The average percentile of the managerial remuneration for the year was decreased by 8.65%.
f. It is hereby affirmed that the remuneration is as per the remuneration policy of the Company.

Annual Report 2018-1946
Annexure to the Directors’ Report
ANNEXURE EStatement pursuant to Section 197(12) of the Companies Act, 2013 read with Rules 5(2) & (3) of the Companies
(Appointment and Remuneration of Managerial Personnel) Rules, 2014 and forming part of the Directors' Report for the year ended March 31, 2019
For and on behalf of the Board
Place : New Delhi Soshil Kumar JainDated : August 12, 2019 Chairman
Notes: 1. Remuneration includes salary, commission on profits, house rent allowance, bonus, Company’s contribution to Provident Fund, Leave Travel Allowance, Medical
Assistance and all allowances paid in cash and monetary value of taxable perquisites wherever applicable and does not include provision for Gratuity/ Retirement Benefit.
2. There was no employee who was employed either throughout the financial year or part thereof, who was holding either by himself or along with the spouse and dependent children 2% or more of the Shares of the Company and drawing remuneration in excess of the remuneration drawn by Managing Director / Joint Managing Director / Whole-time Director of the Company.
3. Mr. Soshil Kumar Jain was the only person who was employed throughout the Financial Year ended March 31, 2019 and was in receipt of remuneration for the year which is more than Rs.10.2 million. The relevant details are given at Sl. No. 1 of the above table.
4. The terms and conditions of employees at Sl. No. 1, 3, 4 & 6 of the above table are as approved by the Board of Directors and Shareholders on the recommendation of Nomination & Remuneration Committee. The employees at Sl. No. 2, 5, 7, 8, 9 & 10 of the above table are paid remuneration as per the policy/rules of the Company.
5. None of the above employees is related to any of the Directors except that Mr. Soshil Kumar Jain, Dr. Rajesh Jain, Mr. Sandeep Jain and Mrs. Sunanda Jain are related to each other.
6. The nature of duties of Chairman, Managing Director, Joint Managing Director and Whole-time Director are as under: Mr. Soshil Kumar Jain, Chairman - Strategic planning, vision and formulation of strategies; Dr. Rajesh Jain, Managing Director - Overall supervision of day-to-day operations with emphasis on strategic planning, R&D and business development; Mr. Sandeep Jain, Joint Managing Director - Overall supervision of day-to-day operations with emphasis on finance, international marketing, regulatory affairs and taxation; and Mrs. Sunanda Jain - Supervision of various activities relating to the Company’s subsidiaries engaged into real estate business.
Top 10 employees as on March 31, 2019 in terms of remuneration drawn during the year: S.
No.Name Designation Remune-
ration (Rs. in
million)
Nature of employment
Qualification Experience (in years)
Date of Commencement of Employment
Age (in
Yrs.)
Particulars of Last Employment:
Name of Employer, Designation,
Period of Service (Years)
1. Mr. Soshil Kumar Jain
Chairman 11.18 Contractual Pharmacist 64 02.02.1984 86 Nil
2. Dr. Sukhjeet Singh Chief Scientific Officer & RA (Pharma)
7.78 Permanent employee
Ph.D 27 17.08.2006 50 Strides Arcolab Limited, VP-Formulation & Development, 1 year
3. Dr. Rajesh Jain Managing Director 7.30 Contractual Ph.D 35 15.11.1984 55 Nil
4. Mr. Sandeep Jain Joint Managing Director
6.70 Contractual Senior Secondary
34 15.11.1984 53 Nil
5. Mr. Gurinder Pal Singh
Sr. V.P. - Acute & Chronic Business
5.87 Permanent employee
B.Sc 25 09.03.2010 52 Cadila Pharma V.P- Sales & Marketing, 2 years
6. Mrs. Sunanda Jain Whole-time Director
5.80 Contractual Graduate in Arts
1 12.03.2018 57 Nil
7. Mr. Vinod Goel Group CFO and Head Legal & Company Secretary
5.61 Permanent employee
M.Com, LLB, ACMA & FCS
32 13.01.1999 54 Prakash Industries Limited, Company Secretary, 9 years
8. Dr. Rajeeva Kumar Mangalum
Plant Head – Pharma & Onco Plant
5.01 Permanent employee
Ph.D 34 20.04.1996 58 Indian Herbs Pvt. Ltd.Production Officer, 5 Years
9. Mr. Kulvinder Sarao Sr. V.P Audit & Compliances (HR)
4.69 Permanent employee
PGD in Personal Management
33 14.01.2005 57 Hero Honda Motors Limited, Head HRM, 3 months
10. Mr. Rajneesh Chatrath
Vice President - Corporate Q. A.
4.50 Permanent employee
M. Sc. 27 30.10.2000 51 ECO-MED Pharmaceuticals, QA-Associate, 4 Months

Panacea Biotec Ltd. 47
Annexure to the Directors’ Report
Secretarial Audit Report for the financial year ended March 31, 2019
ToThe Members,Panacea Biotec Limited,Ambala-Chandigarh Highway,Lalru - 140 501, Punjab
In terms of the provisions of Section 204(1) of the Companies Act, 2013 and Rule 9 of the Companies (Appointment and Remuneration of Managerial Personnel) Rules, 2014, and other applicable provisions, if any, we have conducted the Secretarial Audit of the compliance of applicable statutory provisions and the adherence to good corporate practices by Panacea Biotec Limited, a Company incorporated under the provisions of the Companies Act, 1956, vide CIN L33117PB1984PLC022350 and having its registered office at Ambala-Chandigarh Highway, Lalru-140501, Punjab (hereinafter referred to as “the Company”). Secretarial Audit was conducted in a manner that provided us a reasonable basis for evaluating the corporate conducts/statutory compliances and expressing our opinion thereon.Based on our verification of the Company’s books, papers, minute books, forms and returns filed and other records maintained by the Company and also the information provided by the Company, its officers, agents and authorized representatives during the conduct of the Secretarial Audit, we hereby report that in our opinion, the Company has, during the audit period covering the financial year ended on 31st March, 2019, complied with the statutory provisions listed hereunder and also that the Company has proper Board processes and compliance mechanism in place to the extent, in the manner and subject to the reporting made hereinafter.We have examined the books, papers, minute books, forms and returns filed and other records maintained by the Company for the financial year ended on 31st March, 2019, according to the provisions of: i. The Companies Act, 2013 (the Act) and the rules made
thereunder;ii. The Securities Contracts (Regulation) Act, 1956 (‘SCRA’) and
the rules made thereunder; iii. The Depositories Act, 1996 and the Regulations and Bye-
laws framed thereunder;iv. Foreign Exchange Management Act, 1999 and the rules
and regulations made thereunder to the extent of Foreign Direct Investment, Overseas Direct Investment and External Commercial Borrowings;
v. The following Regulations and Guidelines prescribed under the Securities and Exchange Board of India Act, 1992 (‘SEBI Act’):a. The Securities and Exchange Board of India (Substantial
Acquisition of Shares and Takeovers) Regulations, 2011; b. Securities and Exchange Board of India (Prohibition of
Insider Trading) Regulations, 2015;c. The Securities and Exchange Board of India (Issue of
Capital and Disclosure Requirements) Regulations, 2009 and Securities and Exchange Board of India (Issue
of Capital and Disclosure Requirements) Regulations, 2018;
d. The Securities and Exchange Board of India (Employee Stock Option Scheme and Employee Stock Purchase Scheme) Guidelines, 1999 - Not applicable as the Company has not issued/ proposed to issue any Employee Stock Option Scheme and Employee Stock Purchase Scheme during the financial year under review;
e. The Securities and Exchange Board of India (Issue and Listing of Debt Securities) Regulations, 2008 - Not applicable as the Company has not issued any debt securities during the financial year under review;
f. The Securities and Exchange Board of India (Registrars to an Issue and Share Transfer Agents) Regulations, 1993 regarding the Companies Act and dealing with client;
g. The Securities and Exchange Board of India (Delisting of Equity Shares) Regulations, 2009 - Not applicable as the Company has not delisted/ proposed to delist its equity shares from any stock exchange during the financial year under review.
h. The Securities and Exchange Board of India (Buy-back of Securities) Regulations, 1998 - Not applicable as the Company has not bought back/ propose to buy back any of its securities during the financial year under review.
vi. The management has identified the following laws as specifically applicable to the Company:• Drugs & Cosmetics Act, 1940; • Drugs (Control) Act, 1950;• Narcotic Drugs and Psychotropic Substances Act, 1955;• Dangerous Drugs Act, 1930;• Drugs and Magic Remedies (Objectionable
Advertisement) Act, 1954;• Epidemic Diseases Act, 1897;• Essential Commodities Act, 1955;• The Poisons Act, 1919;• The Pharmacy Act, 1948.
We have also examined compliance with the applicable clauses of the following: i. Secretarial Standards with regard to Meeting of Board of
Directors (SS-1) and General Meetings (SS-2) issued by The Institute of Company Secretaries of India notified by Central Government;
ii. The Listing Agreements entered into by the Company with National Stock Exchange of India Limited and BSE Limited read with SEBI (Listing Obligations and Disclosure Requirements) Regulations, 2015.
During the period under review, the Company has complied with the provisions of the Act, Rules, Regulations, Guidelines, Standards, etc. as mentioned above subject to the following observations: • There are some delays in filing of ECB-2 (monthly return) as
Annexure F

Annual Report 2018-1948
Annexure to the Directors’ Report
required to be filed in terms of Master Circular on External Commercial Borrowings and Trade Credits governed under the provisions of Foreign Exchange Management Act, 1999.
• The Company has paid managerial remuneration for the financial years ended 31st March 2019, 2018, 2017, 2016, 2014 and 2013, which is in excess of the limits specified by the relevant provisions of the Companies Act, 2013 / the Companies Act, 1956 by Rs.154 million for the said years. The Company’s applications to the Central Government seeking approval for payment of such excess remuneration have not been approved and consequently the Company is required to recover the excess amount thus paid for the said years. The Company has recorded an amount of Rs.154 million as recoverable from the directors towards such excess remuneration paid. The Company had submitted applications to the Central Government for waiver of recovery of excess remuneration paid. Further, pursuant to the notification of the effective date of Section 67 of the Companies (Amendment) Act, 2017 amending section 197 - overall maximum managerial remuneration and managerial remuneration in case of absence or inadequacy of profits, of the Companies Act, 2013, the aforesaid applications pending with the Central Government stand abated and the Company is in the process of seeking requisite approvals required in accordance with the provisions of Section 197(10) of the Companies Act, 2013.
We further report that:During the period under review, the Board of Directors of the Company is duly constituted with proper balance of Executive Directors, Non-Executive Directors and Independent Directors.
The changes in the composition of the Board of Directors that took place during the period under review were carried out in compliance with the provisions of the Act.
Adequate notices were given to all directors to schedule the Board Meetings, agenda and detailed notes on agenda were sent adequately in advance, and a system exists for seeking and obtaining further information and clarifications on the agenda items before the meeting and for meaningful participation at the meeting.
Majority decision is carried through while the dissenting members’ views are captured and recorded as part of the minutes, wherever applicable.
We further report that there are adequate systems and processes in the Company commensurate with the size and operations of the Company to monitor and ensure compliance with applicable laws, rules, regulations and guidelines.
We further report that during the audit period, the Company has not entered into/carried out any specific events/actions which may have a major bearing on the Company’s affairs.
For R&D Company Secretaries
Debabrata Deb NathPlace : Delhi PartnerDate : 12th August, 2019 FCS No.:7775
CP No.: 8612
Our report of even date is to be read along with this letter.
1. Maintenance of Secretarial record is the responsibility of the management of the Company. Our responsibility is to express an opinion on these secretarial records based on our audit.
2. We have followed the audit practices and process as were appropriate to obtain reasonable assurance about the correctness of the contents of the Secretarial records. The verification was done on test basis to ensure that correct facts are reflected in Secretarial records. We believe that the process and practices, we followed provide a reasonable basis for our opinion.
3. We have not verified the correctness and appropriateness of financial records and Books of Accounts of the Company.
4. Wherever required, we have obtained the Management representation about the Compliance of laws, rules and regulations and happening of events etc.
5. The Compliance of the provisions of Corporate and other applicable laws, rules, regulations, standards is the responsibility of management. Our examination was limited to the verification of procedure on test basis.
6. The Secretarial Audit report is neither an assurance as to the future viability of the Company nor of the efficacy or effectiveness with which the management has conducted the affairs of the Company.
For R&D Company Secretaries
Debabrata Deb NathPlace : Delhi PartnerDate : 12th August, 2019 FCS No.:7775
CP No.: 8612
Annexure A to the Secretarial Report
ToThe Members,Panacea Biotec Limited,Ambala-Chandigarh Highway,Lalru -140 501, Punjab

Panacea Biotec Ltd. 49
Report on Corporate Governance
1. Company’s Philosophy on Corporate Governance
Corporate Governance is the key attribute in ensuring commitment to values, ethical business conduct, investor’s protection, excellent work environment leading to highest standards of management and maximization of everlasting long-term values. It is about how an organization is being managed. Panacea Biotec beholds Corporate Governance measures as an integral part of business which adds to considerable internal and external values and contributes to business growth.
Panacea Biotec believes in the philosophy of practicing code of Corporate Governance that provides a framework by which the rights and responsibilities of different constituents such as the Board, employees and shareholders are carved out.
The Company believes that timely and accurate disclosure of information, transparency in accounting policies and a strong and independent Board are critical for maintaining good corporate governance, preserving shareholders’ trust and maximizing long-term corporate value. For establishing good corporate governance, the Company has put systems, procedures, policies, practices, standards in place to ensure effective strategic planning, optimum risk management, integrity of internal control and reporting. The Company’s philosophy on Corporate Governance is, thus, concerned with the ethics, values and morals of the Company and its directors who are expected to act in the best interests of the Company and remain accountable to members and other beneficiaries for their actions and properly comply with all the applicable legal and regulatory requirements.
2. Board of Directors
a) Composition, Category & Size of Board:
The Company’s policy is to have an appropriate blend of executive directors and non-executive independent directors, representing a judicious mix of professionalism, knowledge and experience, in line with the management’s commitment for the principle of integrity and transparency in business operations for good corporate governance.
As on March 31, 2019, the Board of Directors of the Company comprised of 12 members including 6 executive directors and 6 non-executive independent directors (including two women directors). The composition of the Board is in conformity with Regulation 17(1) of the SEBI (Listing Obligations & Disclosure Requirements)Regulations, 2015 (“SEBI LODR Regulations”) enjoining optimum combination of executive and non-executive directors, with not less than 50 percent of the Board comprising of non-executive directors and at least one-half comprising of independent directors.
b) Board functioning & procedure:
i) Background:
With a view to institutionalize all corporate affairs and setting up systems and procedures for advance planning for matters requiring discussions and decisions by the Board, the Company has defined
procedures for meetings of the Board of Directors and Committees thereof.
The Board is committed to ensure good governance through a self-governing style of functioning. The directors enjoy complete liberty to express their opinion and decisions are mostly taken on the basis of consensus/majority arrived at after detailed discussions. They are also free to bring up any matter for discussion at the Board Meetings.
ii) Scheduling and Selection of Agenda items:
The Board meets at least four times in a year, with a maximum time gap of 120 days between any two meetings, to discuss and review the quarterly results and other items of agenda, including the minimum information required to be placed before the Board, as per Part A of Schedule II of SEBI LODR Regulations. The Board also meets and conducts additional meetings as and when required and thought fit. The dates for the Board Meetings are decided in advance and timely communicated to the Directors.
The Chairman/Managing Director/Joint Managing Director of the Board and the Company Secretary discuss the items to be included in the agenda. The agenda of the meeting along with relevant supporting documents and explanatory notes is generally circulated in advance (at least one week before the meeting) to all the directors entitled to receive the same, to facilitate meaningful and quality discussions during the meeting. Where it is not practicable to attach any document to the agenda, it is tabled before the meeting with specific reference to this effect in the agenda.
iii) Minimum Information placed before the Board Members:
In addition to the regular business items, the Company provides the following information to the Board and/or Board Committees as and when required, either as part of the agenda papers or by way of presentations and discussion material during the meetings:
• Annual operating plans & budgets and any updates;
• Capital budgets and any updates;
• Quarterly results of the Company and its operating divisions or business segments;
• Minutes of meetings of Audit Committee and other committees of the Board;
• Information on recruitment and remuneration of senior officers just below the Board level, including appointment or removal of the Chief Financial Officer and the Company Secretary;
• Show cause, demand, prosecution notices and penalty notices which are materially important;
• Fatal or serious accidents, dangerous occurrences, any material effluent or pollution problems;
• Any material default in financial obligations to and by the Company or substantial non-payment for goods sold by the Company;

Annual Report 2018-1950
The attendance of directors at Board Meetings and last Annual General Meeting (“AGM”) and number of other directorships & committee memberships/chairmanships as on March 31, 2019, is as under:
Note: WTD = Whole-time Director, MD = Managing Director, JMD = Joint Managing Director, NID = Non-Executive & Independent Director.$ Excludes directorship in foreign companies, membership of managing committees of various chambers/bodies/Section 8 companies and the Company.$$ In accordance with Regulation 26(1) of SEBI LODR Regulations, memberships/chairmanships of only Audit Committee and Stakeholders’ Relationship
Committee in all public limited companies (excluding the Company) have been taken into account.* Ceased to be director of the Company w.e.f. 21.07.2018 due to his sad demise on 21.07.2018.** Appointed as Non-Executive Independent Director of the Company w.e.f. 18.10.2018.
Report on Corporate Governance
• Any issue which involves possible public or product liability claims of substantial nature including any judgment or order which may have passed strictures on the conduct of the Company or taken an adverse view regarding another enterprise that can have negative implications on the Company;
• Details of any joint venture or collaboration agreement, if any;
• Transactions, if any, that involve substantial payment towards goodwill, brand equity or intellectual property;
• Any significant labour problems and their proposed solutions;
• Any significant development in human resources/industrial relations front;
• Any sale of investments, subsidiaries, assets which are material in nature and not in the normal course of business;
• Quarterly details of foreign exchange exposures and the steps taken to limit the risks of adverse exchange rate movement, if material; and
• Non-compliance of any regulatory, statutory or listing requirements and shareholders service such as non-payment of dividend, delay in share transfer, etc.
iv) Recording Minutes of the Proceedings:
The minutes of the proceedings of each Board/Committee/Shareholders’ Meetings are recorded. Draft minutes of the Board/Committee meetings are circulated amongst all the members of the Board/Committee for their feedback/comments. The minutes of all the meetings are entered in respective Minutes Books within prescribed time limits.
v) Post Meeting Follow-Up Mechanism:
In adherence to good corporate governance, the important and significant decisions taken at the Board/Committee levels are promptly communicated to the concerned departments. Moreover, the action taken in respect of such decisions is also reported in the form of status report and is placed at the next meeting of the Board/Committee.
vi) Statutory Compliance of Laws:
The Board periodically reviews the compliance report of the laws applicable to the Company as well as steps taken by the Company to rectify the instances of non-compliances if any.
c) Board Meetings and attendance:
During the financial year 2018-19, five (5) Board Meetings were held on May 30, 2018, August 14, 2018, November 14, 2018, February 14, 2019 and February 26, 2019.
S. No.
Name of Directorand Category of Directorship
No. of board
meetings held
Attendance at meetings
during 2018-19
No. of Directorships$ and Committee Memberships/ Chairmanships$$
held in other Companies
Name of the other listed Company(s) in which
director and Category of Directorship
Board AGM Directorships Committee Memberships
Committee Chairmanships
1. Mr. Soshil Kumar Jain, Promoter - WTD - Chairman
5 2 No 3 0 0 Nil
2. Dr. Rajesh Jain, Promoter - MD 5 4 No 3 0 0 Nil3. Mr. Sandeep Jain, Promoter -
JMD5 4 Yes 2 0 0 Nil
4. Mrs. Sunanda Jain, Promoter Group - WTD
5 4 No 1 0 0 Nil
5. Mr. Sumit Jain, Promoter Group - WTD
5 3 No 14 0 0 Nil
6. Mr. Ankesh Jain, Promoter Group - WTD
5 1 No 2 0 0 Nil
7. Mr. K. M. Lal, NID 5 4 No 4 4 1 Hindustan Wires Limited - NIDPolylink Polymers (India) Limited - NID
8. Mrs. Manjula Upadhyay, NID 5 5 No 2 0 0 DTC India Limited - NID9. Mr. Mukul Gupta, NID 5 5 Yes 2 1 1 Federal-Mogul Goetze (India)
Limited - NID10. Mr. N. N. Khamitkar, NID 5 5 Yes 3 2 1 Nil11. Mr. O. P. Kelkar, NID* 1 0 NA NA NA NA NA12. Mr. Ashwini Luthra, NID** 3 2 NA 0 0 0 Nil13. Mr. R. L. Narasimhan, NID 5 5 Yes 3 2 1 Nil

Panacea Biotec Ltd. 51
None of the directors on the Board is a member in more than 10 committees across all the public limited entities in which he/she is a director and/or acts as Chairman of more than 5 committees across all the listed entities in which he/she is a director.None of the independent directors is serving as an independent director in more than 7 listed companies including Panacea Biotec Ltd.
d) Disclosure of relationships between directors inter-se:Mr. Soshil Kumar Jain, Chairman of the Company is the father of Dr. Rajesh Jain & Mr. Sandeep Jain, Father-in-law of Mrs. Sunanda Jain (wife of Late Mr. Ravinder Jain & mother of Mr. Sumit Jain), grandfather of Mr. Sumit Jain (son of Late Mr. Ravinder Jain & Mrs. Sunanda Jain) and Mr. Ankesh Jain (son of Dr. Rajesh Jain).None of the other directors are related to each other.
e) Number of Shares held by Non-Executive Directors: Nilf ) Familiarization programme for the Independent Directors:
The Board members are provided with necessary documents/brochures, reports and internal policies to enable them to familiarise with the Company’s procedures and practices.In terms of the provisions of the SEBI LODR Regulations, the Company has organized various familiarization programmes like plant visit, presentation on various changes in regulatory framework and its impact on the Company etc. for the independent directors. The familiarization programme aims at helping the independent directors to understand the functions and operations of the Company, its management, their roles & responsibilities towards the Company, etc.The details of familiarization programme for independent directors may be accessed on the Company’s website at the link: https://www.panaceabiotec.com/statutory-policies.
g) Key qualifications/skills/expertise/competencies available with the Board:In the context of the Company’s business and activities, the Company requires skills/expertise/competencies in the areas of Science and Innovation, Research & Development, Pharmaceuticals, Technology, Public Health, Entrepreneurship, General Corporate Management, Business Leadership, Strategic Planning, Financial Management, Banking, Risk and Governance, Administration and Human Relations. The Board is satisfied that it is comprised of highly qualified members who are reputed in these skills, experience, diversity, competence and expertise that allow them to make effective contribution to the Board and its Committees. From time to time, members of the Board have also received recognition from the Government, Industry Bodies and Business Associations for the contribution made in their respective areas of expertise.
h) Board confirmation regarding Independent Directors: On the basis of declarations received from the Independent Directors, the Board confirms that in its opinion, the Independent Directors of the Company fulfill the conditions specified in the SEBI LODR Regulations and
are independent of the management.i) Separate Meeting of Independent Directors:
During the year, one meeting of independent directors was held on August 14, 2018 without the attendance of non-independent directors and members of management to review the performance of the senior management, independent and non-independent directors including Chairman and the Board as a whole. All independent directors were present during the above said meeting.They also assess the quality, quantity and timeliness of flow of information between the Company’s management and the Board.The lead independent directors with/or without other independent directors also provided the feedback to the Board about the key elements that emerge out of the meeting.
j) Code of Conduct:The Board has laid down a Code of Conduct for all the Board members and senior management personnel of the Company. The said Code has been communicated to the directors and senior management personnel and is also available on the website of the Company and can be accessed through the link: https://www.panaceabiotec.com/code-of-conduct.Declaration from the Managing Director confirming that the Company has received affirmations from the Board members and the senior management personnel regarding compliance of Code of Conduct during the year under review, is annexed as Annexure - I and forms part of this Report.
k) Brief profile of Directors seeking appointment / reappointment:The brief resume, experience and other details pertaining to the Directors seeking appointment/re-appointment in the ensuing AGM, to be provided in terms of Regulation 36(3) of SEBI LODR Regulations, is furnished below:
i) Mrs. Sunanda JainAge : 57 YearsQualification : Graduate in ArtsProfessional Expertise: She has knowledge and experience in the Company’s matters including activities relating to Company’s subsidiaries in real estate business and is currently responsible for supervision of various activities relating to the Company’s subsidiaries engaged into real estate activities, viz. Radhika Heights Limited and its subsidiaries. She is the wife of Late Mr. Ravinder Jain who ceased to be the Managing Director of the Company due to his sad demise on 21.02.2018 and she has always been the strength behind him. She is also a promoter/director of Lakshmi & Manager Holdings Limited since August, 2011 and is involved in the strategic planning, vision, and formulation of strategies for that company.Inter-se relationship between directors: She is related to Mr. Soshil Kumar Jain, Dr. Rajesh Jain, Mr. Sandeep Jain, Mr. Sumit Jain and Mr. Ankesh Jain.Directorships: She is a director of Lakshmi & Manager
Report on Corporate Governance
Annual Report 2018-1952
Holdings Limited and Ravinder Heights Limited.Committee Membership/Chairmanship: She does not hold Committee Membership/Chairmanship in any Company.Shareholding in the Company: She holds 66,47,300 Equity Shares of Re.1 each, comprising 10.85% of total Equity Share Capital of the Company.
ii) Mr. Sumit JainAge: 38 YearsQualification: Post Graduate Diploma in Business ManagementProfessional Expertise: He has experience of around19 years in the pharmaceutical industry. He joined Panacea Biotec Limited in May, 2003 as Manager (Vaccines) and was appointed as Whole-time Director in July 2005. He is currently acting as Whole-time Director designated as Director (Operations & Projects) and is responsible for the administrative matters of Panacea Biotec’s Lalru and Baddi facilities. He also oversees the Supply Chain Management of the Company. Prior to joining Panacea Biotec, he was associated with the Company’s Subsidiary, Radicura Infra Limited as an Executive Director.Inter-se relationship between directors: He is related to Mr. Soshil Kumar Jain, Dr. Rajesh Jain, Mr. Sandeep Jain, Mrs. Sunanda Jain and Mr. Ankesh Jain.Directorships: He is the Managing Director of Radhika Heights Limited and a director of Radicura Infra Limited, Sunanda Infra Limited, Cabana Structures Limited, Nirmala Buildwell Private Limited, PanEra Biotec Private Limited, Panacea Life Sciences Limited, Lakshmi & Manager Holdings Limited, Nirmala Organic Farms & Resorts Private Limited, Best General Insurance Company Limited, OKI Estates Private Limited, Trinidhi Finance Private Limited, Cabana Construction Private Limited, White Pigeon Estate Private Limited and Ravinder Heights Limited.Committee Membership/Chairmanship: He is a Member of Executive Committee of the Company. Further, he does not hold Committee Membership/Chairmanship in any other company.Shareholding in the Company: He holds 3,58,500 Equity Shares of Re.1 each, comprising 0.59% of total Equity Share Capital of the Company.
iii) Mrs. Manjula UpadhyayAge: 62 YearsQualification: Law GraduateProfessional Expertise: She is a practicing lawyer with rich experience of around 30 years specially in the field of labour laws. She is the Managing Partner of M/s The Protector Law Firm, and Designated Partner of MR LEX CORP LLP (a firm rendering consultancy services to several companies including the Company).Inter-se relationship between directors: She is not related to any other Director of the Company.Directorships: She is a director in DTC India Limited and The Delhi Flour Mills Company Limited.
Committee Membership/Chairmanship: She does not hold Committee Membership/ Chairmanship in any Company.Shareholding in the Company: Nil
3. Audit Committeea) Composition:
The composition of the Audit Committee of the Board of Directors of the Company meets the requirements of Section 177 of the Companies Act, 2013 (“Act”) and Regulation 18 of SEBI LODR Regulations. The composition of the Committee during the year under review was as under:
S. No. Name Position Category1 Mr. R. L. Narasimhan Chairman Independent Director2 Mr. K. M. Lal Member Independent Director3 Mr. N. N. Khamitkar Member Independent Director
The Committee comprises of independent directors who are financially literate persons having vast experience in the area of finance, accounts, strategy & management.The management is responsible for the Company’s internal controls and the financial reporting process, while the statutory auditors are responsible for performing independent audits of the Company’s financial statements in accordance with generally accepted auditing practices and for issuing reports based on such audits. The Board of Directors has entrusted the Audit Committee to supervise these processes and thus ensure accurate and timely disclosures that maintain the transparency, integrity and quality of financial control and reporting.
b) Terms of Reference:The terms of reference and scope of the Audit Committee, inter-alia, includes the following:• To oversight the Company’s financial reporting
process and the disclosure of its financial information to ensure that the financial statements are correct, sufficient and credible;
• To recommend to the Board, the appointment/re-appointment, remuneration and terms of appointment of auditors;
• Approval of payment to statutory auditors for any other services rendered by the statutory auditors;
• Reviewing, with the management, the annual financial statements and auditors’ report thereon before submission to the Board for approval, with particular reference to:- Matters required to be included in the Directors’
Responsibility Statement to be included in the Board’s Report in terms of Section 134(3)(c) of the Act;
- Any changes in accounting policies and practices and reasons for the same;
- Major accounting entries involving estimates based on the exercise of judgment by management;
- Significant adjustments made in the financial statements arising out of audit findings;
- Compliance with listing and other legal requirements relating to financial statements;
- Disclosures of any related party transactions; and
Report on Corporate Governance

Panacea Biotec Ltd. 53
Report on Corporate Governance
- Qualifications/Modified opinion(s) in the draft audit reports.
• Reviewing with the management, the quarterly financial statements before submission to the Board for approval;
• Reviewing with the management, the statement of uses/application of funds raised through an issue (public issue, rights issue, preferential issue, etc.), if any, the statement of funds utilized for purposes other than those stated in the offer document/ prospectus/notice and the report submitted by the monitoring agency monitoring the utilization of proceeds of a public or rights issue, and making appropriate recommendations to the Board to take up steps in this matter;
• Reviewing and monitoring the auditors’ independence and performance, and effectiveness of audit process;
• Approval of or any subsequent modification of transactions of the Company with related parties;
• Scrutiny of inter-corporate loans and investments;• Valuation of undertakings or assets of the Company,
wherever it is necessary;• Evaluation of internal financial controls and risk
management systems;• Reviewing with the management, performance of
statutory and internal auditors and the adequacy of internal control systems;
• Reviewing the adequacy of internal audit function, if any, including the structure of internal audit department, reporting structure coverage and frequency of internal audit;
• Discussions with internal auditors of any significant findings and follow up thereon;
• Reviewing the findings of any internal investigations by the internal auditors into matters where there is suspected fraud or irregularity or a failure of internal control systems of a material nature and reporting the matter to the Board;
• Discussions with statutory auditors before the audit commences, about the nature and scope of audit as well as have post-audit discussion to ascertain any area of concern;
• To look into the reasons for substantial defaults in the payment to the depositors, debenture holders, shareholders (in case of non-payment of declared dividends) and creditors;
• To review the functioning of the Whistle blower Mechanism;
• Approval of appointment of chief financial officer after assessing the qualifications, experience and background, etc. of the candidate;
• To carry out any other function as is mentioned in the terms of reference of the Audit Committee;
• Reviewing the utilization of loans and/or advances from/investment by the Company in the subsidiary exceeding Rs.100 crore or 10% of the asset size of the subsidiary, whichever is lower including existing loans/advances/investments; and
• To carry out any other duties/terms of reference which are incidental/necessary for the fulfillment of the above mentioned terms of reference and any other
function as is mandated by the Board from time to time and / or enforced by any statutory notification, amendment or modification as may be applicable.
c) Review of information by Audit Committee: Apart from other matters, as per Regulation 18(3) of SEBI LODR Regulations, the Audit Committee reviews, to the extent applicable, the following information:• Management discussion and analysis of financial
condition and results of operations;• Statement of significant related party transactions (as
defined by the Audit Committee), submitted by the Management;
• Management letters/letters of internal control weaknesses, if any, issued by statutory auditors;
• Internal Audit Reports relating to internal control weaknesses;
• Appointment, removal and terms of remuneration of the internal auditors; and
• Statement of Deviations, if applicable:a) Quarterly statement of deviation(s) including
report of monitoring agency, if applicable, submitted to stock exchange(s) in terms of Regulation 32(1) of SEBI LODR Regulations.
b) Annual statements of funds utilized for purposes other than those stated in the offer documents/prospectus/notice, if applicable, in terms of Regulation 32(7) of SEBI LODR Regulations.
The Audit Committee is also vested with the following powers:• To investigate into any matter in relation to the items
specified in Section 177 of the Act or referred to it by the Board and for this purpose, the Audit Committee has full access to the information contained in the records of the Company and external professional advice, if necessary;
• To seek information from any employee;• To obtain outside legal or other professional advice;
and• To secure attendance of outsiders with relevant
expertise, if it considers necessary.d) Meetings of Audit Committee and attendance of members:
During the financial year 2018-19, five (5) meetings of the Audit Committee were held on May 29, 2018, August 13, 2018, November 13, 2018, February 14, 2019 and February 26, 2019. The attendance of members of the Audit Committee at these meetings was as follows:
S. No. Name of the Member No. of Meetingsheld attended
1 Mr. R. L. Narasimhan 5 52 Mr. K. M. Lal 5 43 Mr. N. N. Khamitkar 5 5
The Statutory Auditors, Internal Auditors, Associate Director Finance, Chief Financial Officer and D.G.M. Audit & Compliance & Coordinator of Audit Committee are the permanent invitees to the meetings of Audit Committee. Apart from them, Cost Auditors, Joint Managing Director and other officials of the Company attended one or more of the Audit Committee Meetings.The Company Secretary of the Company is acting as the

Annual Report 2018-1954
Secretary to the Audit Committee.The Chairman of the Audit Committee, Mr. R. L. Narasimhan was present at the last AGM of the Company held on September 29, 2018.
4. Nomination and Remuneration Committee a) Composition: The composition of Nomination and
Remuneration Committee of the Board of Directors of the Company meets the requirements of Section 178 of the Act and Regulation 19 of SEBI LODR Regulations. The composition of the Committee during the year under review was as under:
S. No. Name Position Category1 Mr. R. L. Narasimhan Chairman Independent Director2 Mr. K. M. Lal Member Independent Director3 Mr. N. N. Khamitkar Member Independent Director
b) Terms of Reference: The terms of reference of the Nomination and Remuneration Committee, inter-alia, includes the following:• Formulation of the criteria for determining
qualifications, positive attributes and independence of a director and recommend to the Board a policy relating to the remuneration of the directors, key managerial personnel and other employees;
• Formulation of criteria for evaluation of performance of independent directors and the Board of Directors;
• Devising a policy on diversity of the Board of Directors;• Identifying persons who are qualified to become
directors and who may be appointed in senior management in accordance with the criteria laid down and recommend to the Board of Directors their appointment and removal;
• Recommending to the Board whether to extend or continue the term of appointment of the independent director, on the basis of report of performance evaluation of independent directors;
• Recommending to the Board, all remuneration, in whatever form, payable to senior management; and
• To carry out any other duties/terms of reference which are incidental/necessary for the fulfillment of the above mentioned terms of reference and any other function as is mandated by the Board from time to time and / or enforced by any statutory notification, amendment or modification as may be applicable.
c) Meeting of Nomination and Remuneration Committee and attendance of members: During the financial year 2018-19, one (1) meeting of the Nomination and Remuneration Committee was held on August 14, 2018. The attendance of members of the Nomination and Remuneration Committee at the meeting was as follows:
S. No. Name of the Member No. of Meetingsheld attended
1 Mr. R. L. Narasimhan 1 12 Mr. K. M. Lal 1 13 Mr. N. N. Khamitkar 1 1
The Company Secretary of the Company is acting as the Secretary to the Nomination and Remuneration Committee.The Chairman of the Committee, Mr. R. L. Narasimhan
was present at the last AGM of the Company held on September 29, 2018.
d) Performance Evaluation Criteria for Independent Directors: Pursuant to the applicable provisions of the Act and the SEBI LODR Regulations, the Board, in consultation with its Nomination and Remuneration Committee, has formulated a framework containing, inter-alia, the criteria for performance evaluation of the entire Board of the Company, its Committees and individual directors, including independent directors.A structured questionnaire has been prepared, covering various aspects of the functioning of the Board and its Committees, such as adequacy of the constitution & composition of the Board and its Committees, matters addressed in the Board and Committee meetings, processes followed at the meetings, Board’s focus, regulatory compliances and corporate governance, etc. Similarly, for evaluation of individual director’s performance, the questionnaire covers various aspects like his/her profile, contribution in Board and Committee meetings, execution and performance of specific duties, obligations, regulatory compliances and governance, etc.Board members had submitted their response on a scale of 1 (outstanding) to 5 (poor) for evaluating the entire Board, respective Committees of which they are members and of their peer Board members, including Chairman of the Board.The independent directors had met separately without the presence of non-independent directors and the members of management and discussed, inter-alia, the performance of non-independent directors and Board as a whole and the performance of the Chairman of the Company after taking into consideration the views of executive and non-executive directors.The Nomination and Remuneration Committee has also carried out evaluation of each director’s performance.The performance evaluation of the independent directors has been done by the entire Board, excluding the director being evaluated. On the basis of performance evaluation done by the Board, it shall be determined whether to extend or continue their term of appointment, whenever the respective term expires.
e) Remuneration Policy: The Company’s remuneration strategy is market-driven and aims at attracting and retaining high calibre talent. The strategy is in consonance with the existing industry practice and is directed towards rewarding performance, based on review of achievements, on a periodical basis.The key components of the Company’s remuneration policy are: • Compensation will be based on credentials and the
major driver of performance;• Compensation will be competitive and bench
marked with a select group of companies from the pharmaceutical sector; and
• Compensation will be fully transparent and tax compliant.
The details of this policy are available on the Company’s website viz. https://www.panaceabiotec.com
Report on Corporate Governance

Panacea Biotec Ltd. 55
Report on Corporate Governance
5. Remuneration of DirectorsRemuneration of the executive directors consists of basic salary, perquisites and variable portion in the form of commission on profits in the case of Chairman, Managing Director & Joint Managing Director, as approved by the Board of Directors and shareholders of the Company within the limits prescribed in Schedule V to the Act. The Nomination and Remuneration Committee recommends to the Board the compensation package of the executive directors.
a) Remuneration to Executive Directors:
The details of remuneration paid to Chairman/Managing/Joint Managing/Whole-time Directors during the financial year 2018-19 are as under:
(Rs. in million)S. No. Name Designation Salary Allowances/Perquisites Total1. Mr. Soshil Kumar Jain Chairman 9.60 1.59 11.192. Dr. Rajesh Jain Managing Director 6.00 1.30 7.303. Mr. Sandeep Jain Joint Managing Director 5.52 1.18 6.704. Mrs. Sunanda Jain Whole-time Director 4.80 1.00 5.805. Mr. Sumit Jain Director Operations & Projects 3.60 0.58 4.186. Mr. Ankesh Jain Director Sales & Marketing 1.80 0.62 2.42Notes:1. The tenure of office of Chairman/Managing/Joint Managing/Whole-time Directors is for 3 (three) years from their respective date of appointments and can
be terminated by either party by giving three months’ notice in writing or a shorter period as decided mutually. No severance fee is payable on termination of contract.
2. The Company does not have any Stock Option Scheme.3. All elements of remuneration of the Chairman/Managing/Joint Managing/Whole-time Directors, i.e., salary, perquisites and other benefits, etc. are given in Note
42 (C) to the Financial Statements of the Company.4. The above excludes the provision for gratuity and leave encashment, as the same is calculated on overall company basis.
b) Remuneration to Non-Executive Directors:
The non-executive directors are being paid only the sitting fees for attending the meetings of the Board or Committees of the Board of Directors, of such sum as may be approved by the Board of Directors within the overall limits as prescribed under the Act read with the Companies (Appointment and Remuneration of Managerial Personnel) Rules, 2014.
The details of sitting fees paid to the non-executive directors during financial year 2018-19 are as under: (Rs. in million)
S. No. Name Sitting Fees1 Mr. Ashwini Luthra * 0.102 Mr. K. M. Lal 0.273 Mrs. Manjula Upadhyay 0.254 Mr. Mukul Gupta 0.255 Mr. N. N. Khamitkar 0.316 Mr. O. P. Kelkar ** Nil7 Mr. R. L. Narasimhan 0.33
* Appointed as Non-Executive Independent Director w.e.f. 18.10.2018.
** Ceased to be director w.e.f. 21.07.2018 due to his sad demise on 21.07.2018.
The non-executive director is also reimbursed the expenses incurred by him/her for attending the meeting of the Board and/or Committee thereof.
There are no materially significant related party transactions, pecuniary transactions or relationships between the Company and its directors except those disclosed in the Financial Statements for the year ended on March 31, 2019.
None of the non-executive directors holds any shares of the Company.
6. Stakeholders’ Relationship Committeea) Composition:
The composition of Stakeholders’ Relationship Committee of the Board of Directors of the Company meets the requirements of Section 178 of the Act and Regulation 20 of SEBI LODR Regulations.
The composition of the Committee during the year under review was as under:
S. No. Name Position Category1 Mr. K. M. Lal Chairman Independent Director2 Mr. R. L. Narasimhan Member Independent Director3 Mr. Sandeep Jain Member Executive Director
b) Role & Terms of Reference:
The Stakeholders’ Relationship Committee plays an important role in acting as a link between the management and ultimate owners of the Company i.e., the shareholders. The Committee looks after the redressal of investors’ grievances and performance of the Registrar and Transfer Agent and recommends measures for overall improvement in the quality of investor services.The terms of reference of the Stakeholders’ Relationship Committee, inter-alia, includes the following:• Approve issue of duplicate shares / debentures
certificates;• Oversee the performance of the Company’s Registrar
and Transfer Agent;• Monitor implementation and compliance with the
Company’s Code of Conduct for Prohibition of Insider Trading;
• Consider, resolve and monitor various aspects of interest of shareholders, debenture holders and other security holders including the redressal of the grievances of the security holders of the Company
Annual Report 2018-1956
Report on Corporate Governance
Financial Year Date Time Special Resolution(s) passed2017-18 29.09.18 11:30 A.M. • Re-appointment of Mr. Soshil Kumar Jain as Whole-time Director designated as Chairman.
• Re-appointment of Dr. Rajesh Jain as Managing Director.• Re-appointment of Mr. Sandeep Jain as Joint Managing Director.• Appointment of Mrs. Sunanda Jain as Whole-time Director.• Re-appointment of Mr. Sumit Jain as Whole-time Director designated as Director Operations &
Projects.• Re-appointment of Mr. Ankesh Jain as Whole-time Director designated as Director Sales &
Marketing.• Re-appointment of Mr. Raghava Lakshmi Narasimhan as an Independent Director.• Re-appointment of Mr. Namdeo Narayan Khamitkar as an Independent Director.• Re-appointment of Mr. Krishna Murari Lal as an Independent Director.
2016-17 27.09.17 11:30 A.M. No Special Resolution was passed.
2015-16 28.09.16 11:30 A.M. No Special Resolution was passed.
7. General Body Meetings
a) Annual General Meetings:
During the preceding three years, the Company’s Annual General Meetings were held at the Registered Office of the Company situated at Ambala-Chandigarh Highway, Lalru-140501, Punjab. The date and time of the last three Annual General Meetings and the special resolutions passed thereat with requisite majority are as under:
including complaints related to transfer/transmission of shares, non-receipt of annual report, non-receipt of declared dividends, issue of new/duplicate certificates, general meetings etc.;
• Review measures taken for effective exercise of voting rights by shareholders;
• Review adherence to the service standards adopted by the Company in respect of various services being rendered by the Registrar & Share Transfer Agent and recommend methods to upgrade the service standards adopted by the Company;
• Review various measures and initiatives taken by the Company for reducing the quantum of unclaimed dividends and ensuring timely receipt of dividend warrants/annual reports/statutory notices by the shareholders of the company; and
• Carry out any other matter relating to securities of the Company, any other areas of investors’ service and any other function as is mandated by the Board from time to time and / or enforced by any statutory notification, amendment or modification as may be applicable.
Other Terms:• The Company may delegate all or any of the power
to any other employee(s), officer(s), representative(s), consultant(s), professional(s), or agent(s).
• The Committee may invite other directors/officers of the Company to attend the meetings of the Committee as invitees from time to time as and when required.
The Chairman, or in his absence any other member of Committee authorised by him, attends the general meeting of the shareholders of the Company.
c) Meetings of Stakeholders’ Relationship Committee and attendance of members:
During the financial year 2018-19, six (6) meetings of Stakeholders’ Relationship Committee were held on April 12, 2018, May 29, 2018, August 13, 2018, October 05, 2018, November 13, 2018 and February 14, 2019.
The attendance of members of the Stakeholders’ Relationship Committee at these meetings was as follows:
S. No. Name of the Member No. of Meetingsheld attended
1 Mr. K. M. Lal 6 52 Mr. R. L. Narasimhan 6 43 Mr. Sandeep Jain 6 5
The Company Secretary of the Company is acting as the Secretary to the Stakeholders’ Relationship Committee.
Compliance Officer: Mr. Vinod Goel, Group CFO and Head Legal & Company Secretary is the Compliance Officer of the Company pursuant to Regulation 6(1) of SEBI LODR Regulations and is duly assisted by qualified company secretaries.
The Chairman of the Committee, Mr. K. M. Lal was not present at the AGM of the Company held on September 29, 2018 and in his absence other member of the Committee viz. Mr. R. L. Narasimhan, authorized by him, attended the AGM.
d) Investors’ Grievance Redressal: The details of Investors complaints received and resolved
during the financial year 2018-19 are as under:
No. of Investor Complaints
Pending as at April 01, 2018
Received from April 01, 2018 to March 31, 2019
Resolved from April 01, 2018 to March 31, 2019
Pending as at March 31, 2019
NIL NIL NIL NIL
The Company put utmost priority to the satisfaction of its shareholders, which is evident from the fact that no complaint was received by the Company during the year under review. The Company addresses all complaints, suggestions and grievances expeditiously and replies have been sent/issues have been resolved expeditiously, except in case of dispute over facts or other legal constraints.
There were no shares transfers lying pending as on March 31, 2019.

Panacea Biotec Ltd. 57
Report on Corporate Governance
Financial Year Date Time Special Resolution(s) passed2018-19 25.03.19 11:30 A.M. • Increase in the borrowing limits.
• Creation of charge on the assets of the Company to secure borrowings.• Issue of Warrants to the Subscribers on a preferential basis.• Authorising transfer of Pharmaceutical Formulations Business to Wholly Owned Subsidiary of the
Company.• Authorising advancing loans, giving guarantees or securities for loans in connection with loans
taken by wholly owned subsidiary.
b) Extra-ordinary General Meeting:
During the year under review, an Extra-ordinary General Meeting was held at the Registered Office of the Company situated at Ambala-Chandigarh Highway, Lalru-140501, Punjab. The date and time of the Extra-ordinary General Meeting and the special resolutions passed thereat with requisite majority are as under:
c) Postal Ballot:
During the financial year 2018-19, the Company did not pass any resolution through Postal Ballot.
None of the businesses are proposed to be transacted at the ensuing AGM which requires passing of a Special Resolution through Postal Ballot.
8. Means of communicationa) Results: The Quarterly/Half-Yearly/Annual results are published in one or more of the prominent daily newspapers, viz. Business
Standard, New Delhi and Mumbai editions and in Desh Sewak, Chandigarh edition, the local newspaper published in the language of the region in which Registered Office is situated.
b) Intimation to the Stock Exchanges: The Company also intimates/made disclosures to the Stock Exchanges about all price sensitive matters or such matters which, in its opinion, are material and of relevance to the shareholders and subsequently issues a press release on the matter, wherever necessary. The Company also regularly provides information to the stock exchanges as per the requirements of the SEBI LODR Regulations.
c) News Releases, Presentations: Press releases are sent to the Stock Exchanges before sending the same to media and are also displayed on the Company’s website i.e. https://www.panaceabiotec.com.
d) Annual Reports: The Annual Report containing, inter-alia, Audited Financial Statements (Standalone as well as Consolidated), Directors’ Report, Auditors’ Report and other important information is posted/emailed to every shareholder of the Company.
e) Website: The Company’s website, viz. https://www.panaceabiotec.com contains a separate dedicated section ‘Investor Relations’ where shareholders’ information is available and the said section is being regularly updated with the financial results, annual reports, official news releases and other important events.
f ) Presentations to Institutional Investors/analysts: No presentations on Financial Results are made to the Institutional Investors or to the analysts.
g) SEBI Complaints Redressal System (SCORES): The investor complaints are processed by SEBI in a centralized web-based complaints redressal system. The salient features of this system are: Centralized database of all complaints, online upload of Action Taken Reports (ATRs) by concerned companies and online viewing by investors of actions taken on the complaint and its current status.
h) NSE Electronic Application Processing System (NEAPS) and BSE Corporate Compliance & Listing Centre (BSE Listing Centre): NEAPS and BSE Listing Centre are web based application systems for enabling corporates to undertake electronic filing of various periodic compliance related filings like shareholding pattern, results, press releases, etc. All filings made by the Company with the Stock Exchanges are done through NEAPS and BSE Listing Centre.
i) Designated Exclusive email-id: The Company has designated the following email-id for investor servicing: [email protected]. Investors can also mail their queries to Registrar and Transfer Agent at [email protected] or [email protected].
9. General Shareholder Informationa) Company Registration Details: The Company is registered in the State of Punjab, India. The Corporate Identity Number (“CIN”)
allotted to the Company by the Ministry of Corporate Affairs is L33117PB1984PLC022350.
b) Date of AGM: The 35th AGM is to be held on Monday, the 30th day of September 2019, at 11:30 A.M. at the registered office of the Company situated at Ambala-Chandigarh Highway, Lalru - 140501, Punjab.
Posting of Annual Report On or before Friday, September 06, 2019
Last date of receipt of Proxy Form September 28, 2019 before 11:30 A.M.
Remote e-voting Period From Friday, September 27, 2019 (09:00 A.M.) to Sunday, September 29, 2019 (05:00 P.M.)
c) Financial Year: The financial year of the Company covers the period from April 1 to March 31.

Annual Report 2018-1958
Report on Corporate Governance
d) Financial Calendar 2019-20 (tentative):
S. No. Tentative Schedule Tentative Date (on or before)
1. Financial reporting for the quarter ending June 30, 2019 August 14, 2019
2. Financial reporting for the quarter ending September 30, 2019 November 14, 2019
3. Financial reporting for the quarter ending December 31, 2019 February 14, 2020
4. Financial reporting for the quarter ending March 31, 2020 May 30, 2020
5. Annual General Meeting for the year ending March 31, 2020 On or before September 30, 2020
e) Date of Book Closure: The Share Transfer Books and Register of Members of the Company will remain closed from Monday, September 23, 2019 to Monday, September 30, 2019 (both days inclusive).
f ) Dividend Payment Date: Though the Company has earned profits after tax and exceptional items of Rs.265.70 million during the year but keeping in view the fact that the Company has incurred losses before tax & exceptional items of Rs.2,808.01 million and also with a view to conserve cash flows for the Company’s operations, the Board of Directors has decided to invest the amount towards the growth of the Company and not recommended any dividend on the Equity as well as Preference Shares of the Company.
g) Transfer of Unpaid/Unclaimed Dividends and Shares to Investor Education and Protection Fund (IEPF): Pursuant to the provisions of Section 124 of the Act read with Rules made thereunder, as amended from time to time, declared dividends which remained unpaid or unclaimed by the shareholders for a period of seven consecutive years or more is required to be transferred by the company to the IEPF, which has been established by the Central Government. In pursuance of this, the dividend remaining unclaimed in respect of dividends declared upto the financial year 2010-11 have been transferred to the IEPF.
Further, pursuant to the provisions of Section 124(6) of the Act read with Investor Education & Protection Fund Authority (Accounting, Audit, Transfer and Refund) Rules, 2016 as amended from time to time, all shares in respect of which dividend has not been claimed by the concerned shareholders for seven consecutive years or more shall be transferred by the Company into the Demat Account of IEPF Authority. Accordingly, all the shares in respect of which dividends were declared up to the financial year 2010-11 and remained unclaimed for a continuous period of seven years have been transferred to the Demat Account of IEPF Authority.
Details of the shares transferred and held by IEPF Authority as on March 31, 2019 is as under:
S. No. Particulars No. of shares1. No. of shares transferred during the financial year 2017-18 72,8792. No. of shares transferred during the financial year 2018-19 42,4143. Total shares transferred 1,15,2934. Less: Shares transferred back to the Shareholders by the IEPF Authority 155. Aggregate shares held by IEPF Authority 1,15,278
Any person, whose shares and unpaid/unclaimed dividends get transferred to the IEPF may claim the shares and unpaid/unclaimed dividends from the IEPF in accordance with such procedure and on submission of such documents as prescribed.
The voting rights on the shares transferred to IEPF Authority shall remain frozen till the rightful owner claims the shares.
As on the date of this report, 3 shareholders holding 3,000 equity shares have lodged claims with the Company, for which additional documents have been requested by IEPF Authority and the same is under process.
The voting rights on such unclaimed shares shall remain frozen till the rightful owner claims the shares.h) Listing on Stock Exchanges: The Company’s Equity Shares are listed on the following Stock Exchanges:
• The National Stock Exchange of India Limited, Bandra Kurla Complex, Bandra (E), Mumbai-400051 (“NSE”).• BSE Limited, P J Tower, Dalal Street, Fort, Mumbai-400001 (“BSE”).The Company’s Preference Shares are not listed on any Stock Exchange.The Company has paid listing fees for the financial year 2019-20 to both the above stock exchanges and there is no outstanding payment as on date.
i) Stock Code of Equity Shares:• Trade Symbol at NSE is PANACEABIO.• Stock Code at BSE is 531349.• ISIN No. for Dematerialization is INE922B01023.
j) Stock Code of Preference Shares:• ISIN No. for Dematerialization is INE922B04019.

Panacea Biotec Ltd. 59
k) Market Price data: The Monthly High and Low prices of the shares of the Company at BSE and NSE during the year ended March 31, 2019 are as under:Month Share Price (Rs.) at BSE Share Price (Rs.) at NSE
High Low High LowApril, 2018 353.60 266.00 355.05 263.20May, 2018 292.20 216.20 291.50 230.55June, 2018 287.90 218.45 288.25 217.50July, 2018 244.00 208.95 244.35 206.00August, 2018 266.75 222.30 269.10 220.10September, 2018 248.85 168.05 249.90 170.00October, 2018 176.00 143.10 178.00 140.95November, 2018 170.00 145.95 169.80 145.20December, 2018 173.00 138.20 173.80 137.75January, 2019 186.75 146.55 186.60 146.60February, 2019 219.00 139.00 215.95 139.05March, 2019 209.70 164.00 207.70 164.60
Report on Corporate Governance
Share Performance of the Company in comparison to NSE Nifty Share Performance of the Company in comparison to BSE Sensex
m) Registrar and Transfer Agent: Skyline Financial Services Pvt. Ltd. is acting as Registrar & Transfer Agent (“RTA”) for handling the shares related matters, both in physical as well as dematerialized mode. All works relating to equity shares are being done by them. The Shareholders are, therefore, advised to send all their correspondence directly to the RTA. However, for the convenience of shareholders, documents relating to shares received by the Company are forwarded to the RTA for necessary action thereon.
n) Share Transfer System: The authority for transfer, transmission, dematerialisation and transposition of names of the holders of the Company’s shares has been delegated to the Company Secretary and the RTA. The delegated authority generally attends the Share transfer formalities on weekly basis and as and when required to expedite all such matters and redressal of Investors’ grievance, etc., if any. The requests received by the Company/ RTA for registration of transfers, transmission, transposition and dematerialization are processed by RTA (generally within a week of receipt) and transferred expeditiously and the share certificate(s) are returned to the shareholder(s) by registered post. As per the requirement of Regulation 40 (9) of SEBI LODR Regulations, the Company has obtained the half yearly certificates from a Company Secretary in Practice for due compliance of share transfer formalities.
o) Nomination Facility: Pursuant to Section 72 of the Act, members are entitled to make a nomination in respect of shares held by them. The members holding shares in physical form and desirous of making a nomination are requested to send their requests in Form No. SH-13, pursuant to the Rule 19(1) of the Companies (Share Capital and Debentures) Rules, 2014, available on the Company’s website at https://www.panaceabiotec.com or may write to the RTA of the Company. Those holding shares in dematerialized form may contact their respective Depository Participant (DP) to avail the nomination facility.
l) Share Price Performance in comparison to broad based indices - BSE Sensex & NSE NIFTY as on March 31, 2019:
Particulars March 31, 2018 March 31, 2019 Changes in %Panacea Biotec’s Share Price (closing) at BSE 267.10 198.20 -25.79%BSE Sensex Closing Price 32,968.68 38,672.91 17.30%Panacea Biotec’s Share Price (closing) at NSE 267.15 198.05 -25.86%NIFTY Closing Price 10,113.70 11,623.90 14.93%
Apr-18
May-18
Jun-1
8
Jul-18Aug-1
8
Sep-1
8
Oct-18
Nov-18
Dec-18
Jan-19
Feb-19
Mar-19
Apr-18
May-18
Jun-1
8
Jul-18Aug-1
8
Sep-1
8
Oct-18
Nov-18
Dec-18
Jan-19
Feb-1
9
Mar-19

Annual Report 2018-1960
Report on Corporate Governance
s) Distribution of Shareholding as on March 31, 2019:i) Equity Shares:
Category (Amount)From - To
Shareholders Equity Shares heldNumber % of total no.
of ShareholdersNumber % of Shareholding
Upto 2,500 10,651 97.34 23,65,685 3.862,501-5,000 157 1.43 5,72,840 0.945,001-10,000 48 0.44 3,35,062 0.5510,001-20,000 28 0.26 3,91,498 0.6420,001-30,000 10 0.09 2,45,378 0.4030,001-40,000 8 0.07 2,71,949 0.4440,001-50,000 3 0.03 1,35,964 0.2250,001-1,00,000 6 0.05 4,48,518 0.731,00,001 and above 31 0.28 5,64,83,852 92.22Total 10,942 100.00 6,12,50,746 100.00
ii) Preference Shares:Category (Amount)From - To
Shareholders Preference Shares heldNumber % of total no.
of ShareholdersNumber % of Shareholding
1,00,001 and above 3 100.00 1,63,00,000 100.00Total 3 100.00 1,63,00,000 100.00
t) Pattern of Shareholding as on March 31, 2019:i) Equity Shares:
S. No. Category No. of Shares %1. Promoters and Promoter Group 45,074,866 73.592. Institutional Investors (FIIs, Banks & Mutual Funds) 7,57,562 1.243. NRIs / OCB / Foreign Corporate Bodies/ Foreign Portfolio Investors 2,33,801 0.384. Domestic Companies 75,02,653 12.255. Indian Public/ Trust/ PMS/ Others 76,81,864 12.54
Total 6,12,50,746 100.00
ii) Preference Shares:S. No. Category No. of Shares %1 Promoters and Promoter Group 1,63,00,000 100.00
Total 1,63,00,000 100.00
p) Share Certificates in respect of sub-divided Shares: After the sub-division of the Company’s Equity Shares of Rs.10 each into Equity Shares of Re.1 each, in the year 2003, the Company had sent several letters to all the shareholders holding shares of the face value of Rs.10 in physical form, requesting them to exchange their share certificate(s) into new share certificate(s) in respect of shares of face value of Re.1 each.
Members may kindly note that consequent to the sub-division of shares of the Company from Rs.10 to Re.1, the share certificates of the face value of Rs.10 have ceased to be valid for any purpose whatsoever.
Hence, all the shareholders who have not yet sent their request for exchange of share certificates are requested to immediately forward their old share certificate(s) in respect of shares of face value of Rs.10 each (which are no longer tradable) to the Company, along with a request letter duly signed by all the joint holders.
q) Elimination of Duplicate Mailing: The shareholders who are holding shares in more than one folio in identical name or in joint holders’ name in similar order, may send the share certificate(s) along with request for consolidation of holding in one folio to avoid mailing of multiple Annual Reports.
r) Reconciliation of Share Capital Audit: A Practicing Company Secretary carries out reconciliation of share capital audit in each quarter to reconcile the total admitted capital with National Securities Depository Ltd. ("NSDL") and Central Depository Services (India) Ltd. (“CDSL”) and total issued and listed capital. The audit reports confirm that the total issued/paid up capital is in agreement with the total number of equity shares in physical form and the total number of dematerialized shares held with NSDL and CDSL. The Audit Report for each quarter of the Financial Year 2018-19, has been filed with Stock Exchanges within one month of the end of the respective quarter.

Panacea Biotec Ltd. 61
Report on Corporate Governance
u) Share Dematerialization System: The requests for dematerialization of shares are processed by RTA expeditiously and the confirmation in respect of dematerialization of shares is entered by RTA in the depository system of the respective depositories, by way of electronic entries for dematerialization of shares generally on a weekly basis. In case of rejections, the documents are returned under objection to the Depository Participant with a copy to the shareholder and electronic entry for rejection is made by RTA in the Depository System.
v) Dematerialization of Shares and its liquidity: The Company has been among the few top most companies in India in which maximum number of shares have been dematerialized. As on March 31, 2019, 99.58% of the Company’s total Equity Share Capital representing 6,09,94,495 Equity Shares were held in dematerialized form and only 2,56,251 Equity Shares were in paper/physical form.The shareholders holding shares in physical form are requested to get their shares dematerialized at the earliest, as the Company’s shares are required to be compulsorily traded at Stock Exchanges in dematerialized form only.The Shares of the Company are regularly traded at the NSE and the BSE.
w) Disclosure of commodity price risks and commodity hedging activities: The Company’s finished goods i.e. vaccines & pharmaceutical formulations are normally not prone to commodity price risk. They are, in fact, subject to risk of the Government’s intervention in domestic market and competitive scenario in international market. However, the Company’s raw materials are subject to commodity price risks. The Company does not have any hedging activities for the same. The Company is a net foreign exchange earner and like the pharmaceutical sector, faces foreign currency fluctuation risk. Looking at the future long term trend, the Company keeps its position generally open.
x) Plant Locations:i) Pharmaceuticals Formulations and Oncology facilities at Village Malpur, Baddi, Dist. Solan, H.P.-173205, Indiaii) Vaccines Formulations facility at Village Malpur, Baddi, Dist. Solan, H.P.-173205, Indiaiii) Drug Substance for Vaccines facilities at Samalheri, Ambala-Chandigarh Highway, Lalru-140501, Dist. Mohali (S.A.S. Nagar),
Punjab, India.y) Address for correspondence:
For transfer/ Skyline Financial Services Private Limited dematerialisation of shares, D-153 A, 1st Floor, Okhla Indl. Area, Phase-I, New Delhi – 110 020, India.payment of dividend and any Phone : +91-11-40450193-97 other query relating to shares Fax : +91-11- 26812682 E-mail : [email protected], [email protected]
For investors assistance The Company Secretary, Panacea Biotec Limited B-1 Extn./G-3, Mohan Co-operative Indl. Estate, Mathura Road, New Delhi - 110 044, India. Phone : +91-11-41679000 Extn. 2081, 41578024 (D) Fax : +91-11-41679070 E-mail : [email protected] [email protected]
Contact Person : Ms. Shikha Rastogi, Manager - Secretarial & Compliance
For query relating to financial matters Mr. Devender Gupta - Chief Financial Officer & Head Information Technology Panacea Biotec Limited B-1 Extn./G-3, Mohan Co-operative Indl. Estate, Mathura Road, New Delhi - 110 044, India. Phone : +91-11-41679000 Extn. 1225, 41578011 (D) Fax : +91-11-41679066, 41679070 E-mail : [email protected]
z) Credit Rating: The Company has obtained rating from Credit Analysis & Research Ltd. (CARE) during the financial year 2018-19. During the year, CARE has reaffirmed the credit rating of CARE D (Single D) for Long Term Bank Facilities and for Short Term Bank Facilities of the Company. The details of the same have been disclosed in the Directors’ Report forming part of the Annual Report.
10. Other Disclosures:a) Related Party Transactions: All transactions entered into with related parties as defined under the Act and Regulation 23 of the
SEBI LODR Regulations during the financial year 2018-19 were in the ordinary course of business and on an arm’s length basis.The required statements / disclosures with respect to the related party transactions, if any, as prescribed in SEBI LODR Regulations, are placed before the Audit Committee on regular basis with appropriate disclosures and safeguards being implemented to isolate the conflict. Where required, external expert opinions are sought for Board consideration.Further, during the year, there were no materially significant related party transactions with the Company's subsidiaries, promoters, directors or management, their relatives, etc., that may have potential conflict with the interests of the Company at large. The other related party transactions are given in Note No. 42 of the Notes to the Financial Statements for the year ended March 31, 2019 forming part of the Annual Report.

Annual Report 2018-1962
Report on Corporate Governance
In accordance with Regulation 23 of SEBI LODR Regulations, a policy relating to dealing with Related Party Transactions has been formulated by the Company and the policy has been uploaded on the website of the Company & can be accessed through the link: https://www.panaceabiotec.com/statutory-policies
b) Compliances by the Company: BSE Limited imposed a fine amounting to Rs.5,900/- for delay in filing of financial results for financial year ending March 31, 2018 which was subsequently waived off by BSE Limited vide its letter dated January 28, 2019. No other strictures or penalties have been imposed on the Company by either SEBI or Stock Exchanges or any other statutory authority for non-compliance of any matter related to the capital markets during the last three years.
c) Vigil Mechanism: The Company promotes ethical behavior in all its business activities and has put in place a mechanism for reporting instances of illegal or unethical behavior. The Company has a Vigil Mechanism and has implemented a Vigil Mechanism/Whistle Blower Policy in the Company in pursuance of Regulation 22 of SEBI LODR Regulations and no personnel has been denied access to the Audit Committee of the Company. A copy of Vigil Mechanism/Whistle Blower Policy is displayed on the website of the Company & can be accessed through the link: https://www.panaceabiotec.com/statutory-policies
d) Details of utilization of funds raised through preferential allotment or qualified institutions placement as specified under Regulation 32 (7A): The Company has not raised any funds through preferential allotment or qualified institutions placement as specified under Regulation 32(7A)of SEBI LODR Regulations, 2015 during the financial year 2018-19.
e) Certification from Company Secretary in Practice: A certificate has been received from M/s. R&D Company Secretaries, Practising Company Secretaries, confirming that none of the Directors on the Board of the Company have been debarred or disqualified from being appointed or continuing as Directors of Companies by the Securities and Exchange Board of India/ Ministry of Corporate Affairs or any such statutory authority.
f ) Subsidiary Companies: All subsidiary companies are Board managed with their Board of Directors having the rights and obligations to manage such companies in the best interest of their stakeholders. In terms of Regulation 16(1)(c) of SEBI LODR Regulations, the Board of Directors has adopted a policy with regard to determination of material subsidiaries. The policy is displayed on the website of the Company and can be accessed through the link: https://www.panaceabiotec.com/statutory-policies.As on March 31, 2019, Radhika Heights Limited was the material non-listed Indian subsidiary of the Company as its net worth (i.e. paid-up capital and free reserves) exceeded 10% of the consolidated net worth of the Company. The Company’s independent directors viz. Mr. R. L. Narasimhan and Mr. N. N. Khamitkar acted as non-executive directors on the Board of Radhika Heights Limited during the financial year 2018-19.The Audit Committee of the Company reviewed the financial statements, in particular the investments made by its all Indian subsidiary companies.The minutes of Board meetings of Indian subsidiary companies are placed at the Board Meeting of the Company and the significant transactions or arrangements entered into by the unlisted subsidiary companies are periodically informed to the Board.
g) Disclosure of Accounting Treatment: The Company has prepared the financial statements for the year in compliance with the Indian Accounting Standards (‘Ind-AS’) notified by the Ministry of Corporate Affairs. The Significant Accounting Policies applied in preparation of the financial statements as per Ind-AS have been set out in the Notes to financial statements.
h) Risk Management: The Company has a procedure to inform the Board about the risk assessment and minimization procedures. The Company has formulated a Risk Management Policy. The Board of Directors/management periodically reviews the risk management framework of the Company and comes out with strategic risk mitigation measures.
i) Fees paid to the Statutory Auditors: Total fees for all services paid by the Company and its subsidiaries, on a consolidated basis, to statutory auditors of the Company, i.e. M/s. Walker Chandiok & Co. LLP, Chartered Accountants (Regn. No. 001076N/N500013) and other firms in the network entity of which the statutory auditors are a part, during the financial year 2018-19 was Rs.6.75 million.
j) Disclosure under the Sexual Harassment of Women at Workplace (Prevention, Prohibition and Redressal) Act, 2013: The Company is committed to provide a work environment that ensures every employee is treated with dignity, respect and afforded equal treatment. No complaint has been filed during the financial year 2018-19. The details of the same have also been disclosed in the Directors’ Report forming part of the Annual Report.
11. Compliance with mandatory requirements and adoption of non-mandatory requirementsa) Mandatory requirements:
The Company has complied with all mandatory requirements of the SEBI LODR Regulations with regard to corporate governance.M/s. R & D Company Secretaries, have certified that the Company has complied with the mandatory requirements of corporate governance as stipulated under Regulations 17 to 27, clauses (b) to (i) of Regulation 46(2) and para C, D & E of Schedule V of the SEBI LODR Regulations for the financial year ended March 31, 2019.
b) Non-mandatory requirements:The status on the compliance with the non-mandatory recommendations/discretionary requirements as specified in Part E of Schedule II to the SEBI LODR Regulations is as under.i) Shareholders’ rights: The quarterly/ half-yearly/ annual financial results, after they are approved by the Board of Directors, are
sent forthwith to the NSE and BSE, published in the newspapers as mentioned under the heading “Means of Communication” at Sl. No. 8 above and also displayed on the Company’s website viz. https://www.panaceabiotec.com. They are also uploaded electronically on the website of NSE & BSE viz. NSE electronic application processing system (NEAPS) and BSE Corporate Announcement, Compliance & Listing Centre, respectively. The results are not separately circulated to the shareholders.

Panacea Biotec Ltd. 63
Report on Corporate Governance
ii) Reporting of Internal Auditors: The Internal auditors of the Company report directly to the Audit Committee.iii) Prohibition of Insider Trading: The Company has instituted a comprehensive Code of Conduct for its management, staff and
relevant business associates, in compliance with the SEBI (Prohibition of Insider Trading) Regulations, 2015 which is available on the website of the Company viz. https://www.panaceabiotec.com. The Code lays down guidelines, which advises them on procedures to be followed and disclosures to be made while dealing with the Shares of the Company.
12. Disclosure of the compliance with corporate governance requirements as specified in Regulations 17 to 27 and clauses (b) to (i) of Regulation 46(2) of SEBI LODR Regulations:
Sl. No. Regulation No. Particulars Compliance Status (Yes or No)1. 17 Board of Directors Yes2. 18 Audit Committee Yes3. 19 Nomination and Remuneration Committee Yes4. 20 Stakeholders Relationship Committee Yes5. 21 Risk Management Committee N.A.6. 22 Vigil Mechanism Yes7. 23 Related Party Transactions Yes8. 24 Corporate Governance requirements with respect to subsidiaries Yes9. 25 Obligations with respect to Independent Directors Yes10. 26 Obligations with respect to employees including senior management, key
managerial persons, directors and promotersYes
11. 27 Other Corporate Governance requirements Yes12. 46(2)(b) to (i) Website Yes
13. CEO/CFO CertificationThe Managing Director and Chief Financial Officer have certified, in terms of Part B of Schedule II of the SEBI LODR Regulations, to the Board that the Financial Statements present a true and fair view of the Company’s affairs and
are in compliance with the existing accounting standards. The said certification of the Financial Statements and the Cash Flow Statement for the financial year 2018-19 is annexed as Annexure - II to this Report.
For Panacea Biotec Limited
Place : New Delhi Soshil Kumar JainDated : August 12, 2019 Chairman
Annexure - I
Declaration on Code of Conduct
To
The Members of Panacea Biotec Ltd.
I hereby declare that all the Board Members and the Senior Management Personnel of the Company have affirmed the compliance with the provisions of the Code of Conduct for the financial year ended March 31, 2019.
For Panacea Biotec Limited
Place : New Delhi Dr. Rajesh JainDated : August 12, 2019 Managing Director
Annexure to the Report on Corporate Governance

Annual Report 2018-1964
Annexure - IICertificate from Managing Director & Chief Financial Officer
[Regulation 17(8) of the SEBI (Listing Obligations and Disclosure Requirements) Regulations, 2015]
ToThe Board of Directors,Panacea Biotec Limited
We do hereby confirm and certify that:
a) We have reviewed financial statements and the cash flow statement for the financial year ended March 31, 2019 and that, to the best of our knowledge and belief:i) these statements do not contain any materially untrue statement or omit any material fact or contain statements that might
be misleading; andii) these statements together present a true and fair view of the Company’s affairs and are in compliance with existing accounting
standards, applicable laws and regulations.b) There are, to the best of our knowledge and belief, no transactions entered into by the Company during the year which are
fraudulent, illegal or violative of the Company’s Code of Conduct.c) We accept responsibility for establishing and maintaining internal controls for financial reporting and we have evaluated the
effectiveness of the internal control systems of the Company pertaining to financial reporting and we have disclosed to the Auditors and the Audit Committee deficiencies in the design or operation of such internal controls, if any, of which we are aware of and the steps we have taken or propose to take to rectify these deficiencies.
d) We have indicated to the Auditors and the Audit Committee:i) significant changes in internal control over financial reporting during the year;ii) significant changes, if any, in accounting policies during the year and that the same have been disclosed in the notes to the
financial statements; andiii) there has not been any instance, during the year, of significant fraud of which we had become aware and the involvement
therein, if any, of the management or an employee having a significant role in the Company’s internal control system over financial reporting.
For Panacea Biotec Limited
Place : New Delhi Devender Gupta Dr. Rajesh JainDated : August 12, 2019 Chief Financial Officer & Managing Director Head Information Technology
Annexure to the Report on Corporate Governance
COMPLIANCE CERTIFICATE ON CORPORATE GOVERNANCE
To
The Members of Panacea Biotec Limited
We have examined the compliance of conditions of Corporate Governance by Panacea Biotec Limited, for the year ended on 31st March, 2019, as stipulated in Regulations 17 to 27, clauses (b) to (i) of Regulation 46(2) and Paragraphs C, D and E of Schedule V of the Securities and Exchange Board of India (Listing Obligations and Disclosure Requirements) Regulations, 2015 (“SEBI LODR Regulations”).
The compliance of conditions of Corporate Governance is the responsibility of the management. Our examination was limited to review of procedures and implementation thereof, adopted by the Company for ensuring the compliance of the conditions of the Corporate Governance. It is neither an audit nor an expression of opinion on the financial statements of the Company.
In our opinion and to the best of our information and according to the explanations given to us, we certify that the Company has complied with the conditions of Corporate Governance as stipulated in the SEBI LODR Regulations during the year ended on 31st March, 2019.
We further state that such compliance is neither an assurance as to the future viability of the Company nor the efficiency or effectiveness with which the management has conducted the affairs of the Company.
For R & D Company Secretaries
Debabrata Deb NathPlace : New Delhi PartnerDated : August 12, 2019 Membership No. FCS 7775
C.O.P. No. - 8612

Panacea Biotec Ltd. 65
Independent Auditors’ Report
To the Members of Panacea Biotec LimitedReport on the Audit of the Standalone Financial Statements
Opinion1. We have audited the accompanying standalone financial statements of Panacea Biotec Limited (‘the Company’), which comprise
the Balance Sheet as at 31 March 2019, the Statement of Profit and Loss (including Other Comprehensive Income), the Cash Flow Statement and the Statement of Changes in Equity for the year then ended and a summary of the significant accounting policies and other explanatory information.
2. In our opinion and to the best of our information and according to the explanations given to us, the aforesaid standalone financial statements give the information required by the Companies Act, 2013 (‘Act’) in the manner so required and give a true and fair view in conformity with the accounting principles generally accepted in India including Indian Accounting Standards (‘Ind AS’) specified under Section 133 of the Act, of the state of affairs (financial position) of the Company as at 31 March 2019, its profit (financial performance including other comprehensive income), its cash flows and the changes in equity for the year ended on that date.
Basis for Opinion3. We conducted our audit in accordance with the Standards on Auditing specified under section 143(10) of the Act. Our responsibilities
under those standards are further described in the Auditor’s Responsibilities for the Audit of the Financial Statements section of our report. We are independent of the Company in accordance with the Code of Ethics issued by the Institute of Chartered Accountants of India (‘ICAI’) together with the ethical requirements that are relevant to our audit of the financial statements under the provisions of the Act and the rules thereunder, and we have fulfilled our other ethical responsibilities in accordance with these requirements and the Code of Ethics. We believe that the audit evidence we have obtained is sufficient and appropriate to provide a basis for our opinion.
Emphasis of Matters4. We draw attention to the following notes to the standalone financial statements:
a. Note 57 to the standalone financial statements regarding capital advances amounting to Rs.176.80 million given to real estate developer for acquiring certain immovable properties in Dubai where the Company has initiated legal recourse.
b. Note 53 to the standalone financial statements regarding payment of managerial remuneration for the financial years ended 31 March 2019, 2018, 2017, 2016, 2014 and 2013, which is in excess of the limits specified by the relevant provisions of the Companies Act, 2013 / the Companies Act, 1956 by Rs.154 million for the said years. The Company’s applications to the Central Government seeking approval for payment of such excess remuneration have not been approved and consequently the Company is required to recover the excess amount thus paid for the said years. The Company has recorded an amount of Rs.154 million as recoverable from the directors towards such excess remuneration paid. The Company has submitted applications to the Central Government for waiver of recovery of excess remuneration paid. Further, as discussed in aforementioned note, pursuant to the notification of the effective date of Section 67 of the Companies (Amendment) Act, 2017 amending Section 197 - overall maximum managerial remuneration and managerial remuneration in case of absence or inadequacy of profits, of the Companies Act, 2013, the aforesaid applications pending with the Central Government stand abated and the Company is in the process of seeking requisite approvals required in accordance with the provisions of Section 197(10) of the Companies Act, 2013.
Pending the ultimate outcome of the aforesaid matters which is presently unascertainable, no adjustments have been made in the books of accounts. Our opinion is not modified in respect of these matters.
Key Audit Matters5. Key audit matters are those matters that, in our professional judgment, were of most significance in our audit of the standalone
financial statements of the current period. These matters were addressed in the context of our audit of the financial statements as a whole, and in forming our opinion thereon, and we do not provide a separate opinion on these matters.
6. We have determined the matters described below to be the key audit matters to be communicated in our report.
Key audit matter How the matter was addressed in the audit
One-time settlement (‘OTS’) pursuant to Corporate Debt Restructuring (‘CDR’)
Our audit procedures included but were not limited to the following in relation to one-time settlement of debt:
Refer note 18A to the accompanying standalone financial statements.As fully described in note 18A, during the last quarter of the year ended 31 March 2019, 94% of the lenders under the CDR communicated their consent for the Company’s proposal for one-time settlement of debt. This proposal also received an in-principle approval from all the lenders on 29 March 2019.
a) Obtained an understanding of the management process for ensuring completeness, appropriateness of recognition and measurement including disclosure of the OTS transaction as at the year end.
b) Reviewed the minutes of the joint lender forum meetings held during the year ended 31 March 2019, OTS sanction letters and no dues certificates issued by the respective

Annual Report 2018-1966
Independent Auditors’ Report
Pursuant to the CDR, the Company has repaid the borrowings as agreed in the CDR subsequent to the year-end. Accordingly, during the year ended 31 March 2019, the Company has written back the outstanding debt and interest which has been waived off under the CDR and disclosed it as an ‘exceptional item’ in the Standalone Statement of Profit and Loss.We identified this as key audit matter for current year audit owing to the materiality of the amounts involved in this matter, significant efforts involved in accounting assessment by the management for recording the above transaction and also being a matter on which we had various discussions with those charged with governance during the year then ended.
lenders banks pursuant to CDR. Further, reviewed the minutes of the relevant meetings of the Board of Directors of the Company, approving the OTS transaction.
c) Traced the bullet repayment made by the Company to various lenders pursuant to the CDR to the underlying bank statements and remittance documents.
d) Reviewed the assessment performed by the management for accounting this transaction in accordance with Ind AS 109, Financial Instruments and Ind AS 10, Events after the Reporting Date.
e) Re-computed the amounts to be written back pursuant to one-time settlement of debt for the year ended 31 March 2019 and agreed it with the management’s computation.
f ) Evaluated the appropriateness of the disclosures made in the standalone financial statements of the Company with respect to this matter.
Discontinued operationsRefer note 1 and 36 to the accompanying standalone financial statements for the accounting policy and related financial disclosures respectively. During the current year ended 31 March 2019, the management of the Company has identified two business segments as ‘discontinued operations’ and thereby classified the related assets and liabilities as held for sale. A) Divestment of pharmaceutical formulation segment
(“Pharma segment”)As further explained in note 36, the management’s plan of divestment of Pharma segment to its wholly owned subsidiary, Panacea Biotec Pharma Limited (“PBPL”) has been approved by the shareholders of the Company in an extra-ordinary general meeting held on 25 March 2019 and management intends to bring synergies in the existing segments and reprioritize its product portfolios.Consequently, the Company has executed a Business Transfer Agreement (‘BTA’) on 7 April 2019 to transfer by way of a slump sale, the entire identified assets and related liabilities pertaining to Pharma segment to PBPL at their respective book values.
B) Demerger of real estate segment:As further explained in note 36, the Company has decided to demerge its real estate undertaking, comprising certain immoveable properties of the Company and its investment in a wholly owned subsidiary which was intended to deal in real estate.The Board of Directors of the Company have approved the demerger proposal and the demerger scheme at their board meetings held on 26 February 2019 and 30 May 2019 respectively.
Pursuant to the above restructuring by the Company, the management has assessed the Pharma segment and the real estate segment as disposal group and presented as “discontinued operations” in the standalone financial statements of the Company in accordance with the provisions of Indian Accounting Standard 105 – ‘Non-current Assets Held for Sale and Discontinued Operations’.Accordingly, net profit/(loss) from the respective Pharma segment and the real estate segment amounting to Rs.95.8 million and Rs.(49.5) million for the year ended 31 March 2019 has been presented as profit/ (loss) from discontinued
Our audit procedures included, but were not limited to, the following in relation to the discontinued operations:
a) Obtained an understanding of the management process for ensuring classification, measurement, disclosure and allocations for the identified disposal groups.
b) Reviewed the minutes of the respective meetings of the Board of Directors and the shareholders of the Company approving the respective transactions.
c) Assessed management’s conclusions regarding the allocations of the asset, liabilities, income and expenses that are assigned to the discontinued operations for the respective segments.
d) Assessed the appropriateness of the carrying values of assets and liabilities classified as held for sale in accordance with the requirements of Ind AS 105.
e) With respect to matter (a), read the BTA signed between the Company and PBPL for divestment of the Pharma segment.
f ) With respect to matter (b) read the draft demerger scheme to be filed with the National Company Law Tribunal for implementing the demerger.
g) Assessed reasonableness of management’s judgement with respect to the likelihood and expected timing of the implementation of the restructuring.
h) Assessed the appropriateness and adequacy of the related disclosures in the standalone financial statements of the Company in accordance with the applicable accounting standards.
Key audit matter How the matter was addressed in the audit

Panacea Biotec Ltd. 67
Independent Auditors’ Report
operations in the Standalone Statement of Profit and Loss and the related assets /(liabilities) of the Pharma segment and the real estate business are classified as ‘assets / (liabilities) classified as held for sale’ in the Standalone Balance Sheet as at 31 March 2019.We identified this as a key audit matter for current year audit in view of the significance of the impact of these restructuring transactions have on the standalone financial statements including the amounts involved, exercise of management judgments with respect to identification and segregation of assets and liabilities and allocation of corporate income/ expenses to Pharma and real estate segments.
Going concern basis of accounting:Refer note 54 to the accompanying standalone financial statements.The Company has incurred loss before tax amounting to Rs.2,808.0 million for the year ended 31 March 2019 and its current liabilities exceed its current assets by Rs.5,926.1 million. While the above indicates doubts about the Company’s ability to continue as a going concern, as mentioned in aforesaid Note 54 the Company has taken the following mitigating factors in its assessment of going concern basis of accounting:
• Execution of investment agreements dated 6 April 2019 with a new lender to obtain long-term funds upto Rs.9,920 million by way of non-convertible debentures and share warrants to be allotted on preferential basis;
• Settlement of debt and other restructuring activities; and
• Increased operational measures towards vaccine and pharmaceutical formulation business segment.
Management has prepared a cash flow forecast for next year taking into cognizance the above developments including the revised repayment schedule on the new debt and performed a sensitivity analysis of the key assumptions used therein to assess whether the Company would have sufficient working capital to finance its operations and to meet its financial obligations as and when they fall due for at least next twelve months from the end of the current reporting date and concluded that the going concern basis of accounting used for the preparation of accompanying standalone financial statements is appropriate with no material uncertainty.We have considered the assessment of management’s evaluation of going concern basis of accounting as a key audit matter for the current year audit due to the pervasive impact thereof on the standalone financial statements and the significant judgments and assumptions that are inherently subjective and dependent on future events, involved in the preparation of cash flow forecasts and the overall conclusion.
Our audit procedures included, but were not limited to, the following in relation to the assessment of appropriateness of going concern basis of accounting:a) Obtained an understanding of the management’s process
for identifying all the events or conditions that could impact the Company’s ability to continue as a going concern and the process followed to assess the mitigating factors for such events or conditions. Also, obtained an understanding around the methodology adopted by the Company to assess their future business performance, prepare a robust cash flow forecast.
b) Evaluated the design and tested the operating effectiveness of key controls around aforesaid identification of events or conditions and mitigating factors and controls around cash flow forecast prepared by the management.
c) Reconciled the cash flow forecast to the future business plan of the Company as approved by the Board of Directors
d) In order to corroborate management’s future business plans and to identify potential contradictory information, we read the minutes of the Board of Directors and discussed the same with the management and Audit Committee.
e) Tested the appropriateness of key assumptions adopted by the management in preparation of the cash flow forecasts such as growth rates, expenditure on new products and tested the reasonableness of these assumptions used based on our knowledge and understanding of the business, actual historical results and external data as the case maybe.
f ) Obtained the sensitivity analysis prepared by management and also performed independent sensitivity analysis to test the impact of variation on the cash flows due to change in key assumptions.
g) Reviewed the historical accuracy of the cash flow projections prepared by the management in prior periods.
h) Traced receipt of money through issue of non-convertible debentures subsequent to the year-end to the Company’s bank statements and other supporting documents.
i) Evaluated the appropriateness and adequacy of the going concern disclosures, in the standalone financial statements of the Company.
Key audit matter How the matter was addressed in the audit
Information other than the Financial Statements and Auditor’s Report thereon7. The Company’s Board of Directors is responsible for the other information. The other information comprises the information
included in the Annual Report, but does not include the financial statements and our auditors' report thereon. The Annual Report is expected to be made available to us after the date of this auditors' report.Our opinion on the financial statements does not cover the other information and we will not express any form of assurance conclusion thereon.

Annual Report 2018-1968
In connection with our audit of the financial statements, our responsibility is to read the other information identified above when it becomes available and, in doing so, consider whether the other information is materially inconsistent with the financial statements or our knowledge obtained in the audit or otherwise appears to be materially misstated.When we read the Annual Report, if we conclude that there is a material misstatement therein, we are required to communicate the matter to those charged with governance.
Responsibilities of Management and Those Charged with Governance for the Standalone Financial Statements8. The Company’s Board of Directors is responsible for the matters stated in section 134(5) of the Act with respect to the preparation of
these standalone financial statements that give a true and fair view of the state of affairs (financial position), profit or loss (financial performance including other comprehensive income), changes in equity and cash flows of the Company in accordance with the accounting principles generally accepted in India, including the Ind AS specified under Section 133 of the Act. This responsibility also includes maintenance of adequate accounting records in accordance with the provisions of the Act for safeguarding of the assets of the Company and for preventing and detecting frauds and other irregularities; selection and application of appropriate accounting policies; making judgments and estimates that are reasonable and prudent; and design, implementation and maintenance of adequate internal financial controls, that were operating effectively for ensuring the accuracy and completeness of the accounting records, relevant to the preparation and presentation of the financial statements that give a true and fair view and are free from material misstatement, whether due to fraud or error.
9. In preparing the financial statements, management is responsible for assessing the Company’s ability to continue as a going concern, disclosing, as applicable, matters related to going concern and using the going concern basis of accounting unless management either intends to liquidate the Company or to cease operations, or has no realistic alternative but to do so.
10. The Board of Directors is also responsible for overseeing the Company’s financial reporting process.Auditor’s Responsibilities for the Audit of the Financial Statements11. Our objectives are to obtain reasonable assurance about whether the financial statements as a whole are free from material
misstatement, whether due to fraud or error, and to issue an auditor’s report that includes our opinion. Reasonable assurance is a high level of assurance, but is not a guarantee that an audit conducted in accordance with Standards on Auditing will always detect a material misstatement when it exists. Misstatements can arise from fraud or error and are considered material if, individually or in the aggregate, they could reasonably be expected to influence the economic decisions of users taken on the basis of these financial statements.
12. As part of an audit in accordance with Standards on Auditing, we exercise professional judgment and maintain professional scepticism throughout the audit. We also:• Identify and assess the risks of material misstatement of the financial statements, whether due to fraud or error, design and
perform audit procedures responsive to those risks, and obtain audit evidence that is sufficient and appropriate to provide a basis for our opinion. The risk of not detecting a material misstatement resulting from fraud is higher than for one resulting from error, as fraud may involve collusion, forgery, intentional omissions, misrepresentations, or the override of internal control;
• Obtain an understanding of internal control relevant to the audit in order to design audit procedures that are appropriate in the circumstances. Under section 143(3)(i) of the Act, we are also responsible for expressing our opinion on whether the Company has adequate internal financial controls system in place and the operating effectiveness of such controls;
• Evaluate the appropriateness of accounting policies used and the reasonableness of accounting estimates and related disclosures made by management;
• Conclude on the appropriateness of management’s use of the going concern basis of accounting and, based on the audit evidence obtained, whether a material uncertainty exists related to events or conditions that may cast significant doubt on the Company’s ability to continue as a going concern. If we conclude that a material uncertainty exists, we are required to draw attention in our auditor’s report to the related disclosures in the financial statements or, if such disclosures are inadequate, to modify our opinion. Our conclusions are based on the audit evidence obtained up to the date of our auditors' report. However, future events or conditions may cause the Company to cease to continue as a going concern; and
• Evaluate the overall presentation, structure and content of the financial statements, including the disclosures, and whether the financial statements represent the underlying transactions and events in a manner that achieves fair presentation.
13. We communicate with those charged with governance regarding, among other matters, the planned scope and timing of the audit and significant audit findings, including any significant deficiencies in internal control that we identify during our audit.
14. We also provide those charged with governance with a statement that we have complied with relevant ethical requirements regarding independence, and to communicate with them all relationships and other matters that may reasonably be thought to bear on our independence, and where applicable, related safeguards.
15. From the matters communicated with those charged with governance, we determine those matters that were of most significance in the audit of the financial statements of the current period and are therefore the key audit matters. We describe these matters in our auditors' report unless law or regulation precludes public disclosure about the matter or when, in extremely rare circumstances, we determine that a matter should not be communicated in our report because the adverse consequences of doing so would reasonably be expected to outweigh the public interest benefits of such communication.
Independent Auditors’ Report

Panacea Biotec Ltd. 69
For Walker Chandiok & Co LLP Chartered Accountants Firm’s Registration No.: 001076N/N500013
Anupam KumarPlace : New Delhi Partner Date : May 30, 2019 Membership No.: 501531
Report on Other Legal and Regulatory Requirements16. As required by Section 197(16) of the Act, we report that the Company has paid remuneration to its directors during the year
which is in excess of the limits laid down under Section 197 read with Schedule V to the Act.17. As required by the Companies (Auditor’s Report) Order, 2016 (‘the Order’) issued by the Central Government of India in terms of
Section 143(11) of the Act, we give in the Annexure A a statement on the matters specified in paragraphs 3 and 4 of the Order.18. Further to our comments in Annexure A, as required by Section 143(3) of the Act, we report that:
a) we have sought and obtained all the information and explanations which to the best of our knowledge and belief were necessary for the purpose of our audit;
b) in our opinion, proper books of account as required by law have been kept by the Company so far as it appears from our examination of those books;
c) the standalone financial statements dealt with by this report are in agreement with the books of account;d) in our opinion, the aforesaid standalone financial statements comply with Ind AS specified under Section 133 of the Act;e) on the basis of the written representations received from the directors and taken on record by the Board of Directors, none
of the directors is disqualified as on 31 March 2019 from being appointed as a director in terms of Section 164(2) of the Act;f ) we have also audited the internal financial controls over financial reporting (IFCoFR) of the Company as on 31 March 2019 in
conjunction with our audit of the standalone financial statements of the Company for the year ended on that date and our report dated 30 May 2019 as per Annexure B expressed unmodified opinion; and
g) with respect to the other matters to be included in the Auditors' Report in accordance with rule 11 of the Companies (Audit and Auditors) Rules, 2014 (as amended), in our opinion and to the best of our information and according to the explanations given to us: i. the Company, as detailed in note 39(A) to the standalone financial statements, has disclosed the impact of pending
litigation(s) on its financial position as at 31 March 2019;ii. the Company did not have any long-term contracts including derivative contracts for which there were any material
foreseeable losses as at 31 March 2019;iii. there were no amounts which were required to be transferred to the Investor Education and Protection Fund by the
Company during the year ended 31 March 2019; andiv. the disclosure requirements relating to holdings as well as dealings in specified bank notes were applicable for the
period from 8 November 2016 to 30 December 2016, which are not relevant to these standalone financial statements. Hence, reporting under this clause is not applicable.
Independent Auditors’ Report

Annual Report 2018-1970
Annexure To the Auditors’ Report
Name of the statute Nature of dues Amount
(Rs. in million)Amount paid under
Protest (Rs. in million)Period to which the
amount relatesForum where dispute is
pending
Income-tax Act, 1961
Disallowance in respect of certain purchases and expense items
162.2 - Assessment Year 2005-06
Income Tax Appellate Tribunal (ITAT)
Income-tax Act, 1961
Disallowance in respect of certain purchases and expense items
3,300.7 - Assessment Year 2006-07 to 2009-10
Income Tax Appellate Tribunal (ITAT)
Customs Act, 1962
Duty levied on exempted goods 4.0 4.0 Financial Year 2001-02
Custom Excise & Service Tax Appellate Tribunal
Annexure ABased on the audit procedures performed for the purpose of reporting a true and fair view on the financial statements of the Company and taking into consideration the information and explanations given to us and the books of account and other records examined by us in the normal course of audit, and to the best of our knowledge and belief, we report that:
i) a) The Company has maintained proper records showing full particulars, including quantitative details and situation of property, plant and equipment.
b) The Company has a regular program of physical verification of its property, plant and equipment under which property, plant and equipment are verified in a phased manner over a period of three years, which, in our opinion, is reasonable having regard to the size of the Company and the nature of its assets. In accordance with this program, certain property, plant and equipment were verified during the year and no material discrepancies were noticed on such verification; and
c) The title deeds of all the immovable properties (which are included under the head ‘Property, plant and equipment’) are held in the name of the Company.
ii) In our opinion, the management has conducted physical verification of inventory at reasonable intervals during the year, except for goods-in-transit and stocks lying with third parties. For stocks lying with third parties at the year-end, written confirmations have been obtained by the management. No material discrepancies were noticed on the aforesaid verification.
iii) The Company has not granted any loan, secured or unsecured to companies, firms, Limited Liability Partnerships (LLPs) or other parties covered in the register maintained under Section 189 of the Act. Accordingly, the provisions of clauses 3(iii)(a), 3(iii)(b) and 3(iii)(c) of the Order are not applicable.
iv) In our opinion, the Company has complied with the provisions of Sections 185 and 186 of the Act in respect of loans, investments, guarantees and security.
v) In our opinion, the Company has not accepted any deposits within the meaning of Sections 73 to 76 of the Act and the Companies (Acceptance of Deposits) Rules, 2014 (as amended). Accordingly, the provisions of clause 3(v) of the Order are not applicable.
vi) We have broadly reviewed the books of account maintained by the Company pursuant to the Rules made by the Central Government for the maintenance of cost records under sub-section (1) of Section 148 of the Act in respect of Company’s products and are of the opinion that, prima facie, the prescribed accounts and records have been made and maintained. However, we have not made a detailed examination of the cost records with a view to determine whether they are accurate or complete.
vii) a) Undisputed statutory dues including provident fund, employees’ state insurance, income-tax, sales tax, service tax, duty of customs, duty of excise, value added tax, cess and other material statutory dues, as applicable, have generally been regularly deposited to the appropriate authorities. Undisputed amounts payable in respect thereof, which were outstanding at the year-end for a period of more than six months from the date they became payable are as follows:Statement of arrears of statutory dues outstanding for more than six months:
Name of the statute
Nature of the dues Amount (Rs. in million)
Period to which the amount relates
Due Date Date of Payment Remarks, if any
Income-tax Act, 1961
Demand u/s 154/250/153A/ 143(3) of Income-tax Act, 1961
14.5 Assessment Year 2011-12
April 21, 2016 Not yet paid The Company intends to settle the demand with refund of other years.
b) The dues outstanding in respect of income-tax, sales-tax, service-tax, duty of customs, duty of excise and value added tax on account of any dispute, are as follows:
Statement of disputed dues:

Panacea Biotec Ltd. 71
Annexure To the Auditors’ Report
viii) There are no dues payable to debenture-holders. The Company has defaulted in repayment of loans/borrowings to the following banks, financial institutions and governments including interest thereon:
Name of the Bank/ institution Amount of default as on 31 March 2019 (in million)
Period of default
Bank of India – Foreign Currency Loan 576.25 192 days
Bank of India – Foreign Currency Loan 576.25 557 days
Bank of India 11.36 ranging from 10 to 192 days
Canara Bank 2.66 ranging from 10 to 192 days
Edelweiss Asset Reconstruction Company 43.23 ranging from 10 to 192 days
IDBI Bank 0.18 10 days
Indian Overseas Bank 88.26 ranging from 10 to 192 days
State Bank of India 168.24 ranging from 10 to 192 days
Union Bank of India 3.38 ranging from 10 to 192 days
Biotechnology Industrial Research Assistance Council 14.00 ranging from 10 to 192 days
Refer note 47 to the standalone financial statements.
S. No.
Payment made to Amount Paid/provided in excess of limits prescribed
(Rs. in million)
Amount due for recovery as at 31 March 2019
(Rs. in million)
Steps taken to secure the recovery of the amount
(See note a below)
Remarks (if any)
1. Managing/Joint Managing and Whole Time Director
14.3 14.3
The Company is in the process of seeking
necessary approval for waiver of recovery of
excess remuneration paid
Remuneration pertains to year ended March 31, 2013
2. Managing/Joint Managing and Whole Time Director
14.8 14.8 Remuneration pertains to year ended March 31, 2014
3. Whole Time Director 2.6 2.6 Remuneration pertains to year ended March 31, 2016
4. Managing/Joint Managing and Whole Time Director
43.0 43.0 Remuneration pertains to year ended March 31, 2017
5. Managing/Joint Managing and Whole Time Director
41.6 41.6 Remuneration pertains to year ended March 31, 2018
6. Managing/Joint Managing and Whole Time Director
37.6 37.6 Remuneration pertains to year ended March 31, 2019
ix) The Company did not raise moneys by way of initial public offer or further public offer (including debt instruments) and did not have any term loans outstanding during the year. Accordingly, the provisions of clause 3(ix) of the Order are not applicable.
x) No fraud by the Company or on the Company by its officers or employees has been noticed or reported during the period covered by our audit.
xi) The Company has provided and paid managerial remuneration which is not in accordance with the requisite approval mandated by the provisions of Section 197 of the Act read with Schedule V to the Act.
Further as mentioned in Note 53 to the standalone financial statements, the Company has paid managerial remuneration, which is not in accordance with the requisite threshold mandated by the provisions of Companies Act 2013/erstwhile 1956 for the relevant years ended March 31 2019, 2018, 2017, 2016, 2014 and 2013:
a) Pending receipt of necessary approvals, the Company has recorded a receivable amounting to Rs.154.0 million as recoverable from the relevant directors.
xii) In our opinion, the Company is not a Nidhi Company. Accordingly, provisions of clause 3(xii) of the Order are not applicable.
xiii) In our opinion all transactions with the related parties are in compliance with Sections 177 and 188 of Act, where applicable, and the requisite details have been disclosed in the financial statements etc., as required by the applicable Ind AS.
xiv) During the year, the Company has not made any preferential allotment or private placement of shares or fully or partly convertible debentures.
xv) In our opinion, the Company has not entered into any non-cash transactions with the directors or persons connected with them covered under Section 192 of the Act; and
xvi) The Company is not required to be registered under Section 45-IA of the Reserve Bank of India Act, 1934.
For Walker Chandiok & Co LLP Chartered Accountants Firm’s Registration No.: 001076N/N500013
Anupam KumarPlace : New Delhi Partner Date : May 30, 2019 Membership No.: 501531
The details are as follows:

Annual Report 2018-1972
For Walker Chandiok & Co LLP Chartered Accountants Firm’s Registration No.: 001076N/N500013
Anupam KumarPlace : New Delhi Partner Date : May 30, 2019 Membership No.: 501531
Annexure To the Auditors’ Report
Annexure BIndependent Auditors' Report on the Internal Financial Controls under Clause (i) of Sub-section 3 of Section 143 of the Companies Act, 2013 (‘the Act’)
1. In conjunction with our audit of the standalone financial statements of Panacea Biotec Limited (‘the Company’) as at and for the year ended 31 March 2019, we have audited the internal financial controls over financial reporting (‘IFCoFR’) of the Company as at that date.
Management’s Responsibility for Internal Financial Controls
2. The Company’s Board of Directors is responsible for establishing and maintaining internal financial controls based on the internal control over financial reporting criteria established by the Company considering the essential components of internal control stated in the the Guidance Note on Audit of Internal Financial Controls over financial reporting (the “Guidance Note”) issued by the Institute of Chartered Accountants of India (“ICAI”). These responsibilities include the design, implementation and maintenance of adequate internal financial controls that were operating effectively for ensuring the orderly and efficient conduct of the Company’s business, including adherence to the Company’s policies, the safeguarding of its assets, the prevention and detection of frauds and errors, the accuracy and completeness of the accounting records, and the timely preparation of reliable financial information, as required under the Act.
Auditors’ Responsibility
3. Our responsibility is to express an opinion on the Company’s IFCoFR based on our audit. We conducted our audit in accordance with the Standards on Auditing issued by ICAI and deemed to be prescribed under Section 143(10) of the Act, to the extent applicable to an audit of IFCoFR, and the Guidance Note issued by the ICAI. Those Standards and the Guidance Note require that we comply with ethical requirements and plan and perform the audit to obtain reasonable assurance about whether adequate IFCoFR were established and maintained and if such controls operated effectively in all material respects.
4. Our audit involves performing procedures to obtain audit evidence about the adequacy of the IFCoFR and their operating effectiveness. Our audit of IFCoFR includes obtaining an understanding of IFCoFR, assessing the risk that a material weakness exists, and testing and evaluating the design and operating effectiveness of internal control based on the assessed risk. The procedures selected depend on the auditors' judgement, including the assessment of the risks of material misstatement of the financial statements, whether due to fraud or error.
5. We believe that the audit evidence we have obtained is sufficient and appropriate to provide a basis for our audit opinion on the Company’s IFCoFR.
Meaning of Internal Financial Controls over Financial Reporting
6. A company’s IFCoFR is a process designed to provide reasonable assurance regarding the reliability of financial reporting and the preparation of financial statements for external purposes in accordance with generally accepted accounting principles. A company’s IFCoFR include those policies and procedures that (1) pertain to the maintenance of records that, in reasonable detail, accurately and fairly reflect the transactions and dispositions of the assets of the company; (2) provide reasonable assurance that transactions are recorded as necessary to permit preparation of financial statements in accordance with generally accepted accounting principles, and that receipts and expenditures of the company are being made only in accordance with authorisations of management and directors of the company; and (3) provide reasonable assurance regarding prevention or timely detection of unauthorised acquisition, use, or disposition of the company’s assets that could have a material effect on the financial statements.
Inherent Limitations of Internal Financial Controls over Financial Reporting
7. Because of the inherent limitations of IFCoFR, including the possibility of collusion or improper management override of controls, material misstatements due to error or fraud may occur and not be detected. Also, projections of any evaluation of the IFCoFR to future periods are subject to the risk that the IFCoFR may become inadequate because of changes in conditions, or that the degree of compliance with the policies or procedures may deteriorate.
Opinion
8. In our opinion, the Company has, in all material respects, adequate internal financial controls over financial reporting and such controls were operating effectively as at 31 March 2019, based on the internal control over financial reporting criteria established by the Company considering the essential components of internal control stated in the Guidance Note issued by ICAI.

Panacea Biotec Ltd. 73
Balance Sheet As at March 31, 2019
The accompanying notes 1 to 59 are an integral part of the financial statements.This is the Balance Sheet referred to in our report of even date.
For Walker Chandiok & Co LLP For and on behalf of Board of Directors of Panacea Biotec LimitedChartered AccountantsFirm Registration No. 001076N/N500013
Anupam Kumar Soshil Kumar Jain Dr. Rajesh JainPartner Chairman Managing DirectorMembership No. 501531 (DIN 00012812) (DIN 00013053)
Vinod Goel Devender GuptaPlace : New Delhi Group CFO and Head Legal Chief Financial Officer & Date : May 30, 2019 & Company Secretary Head Information Technology
(Rs. in million)
NoteNo.
As atMarch 31, 2019
As atMarch 31, 2018
ASSETSNon-current assets
a) Property, plant and equipment 2.1 4,948.72 8,865.60 b) Capital work-in-progress 2.2 29.52 47.57 c) Intangibles assets 2.3 15.66 43.68 d) Intangible assets under development 2.4 1.52 324.04 e) Financial assets
(i) Investments 3 25.36 3,448.77 (ii) Loans 4 6.34 9.93 (iii) Other financial assets 5 8.86 2.51
f ) Deferred tax assets (net) 6 192.04 219.86 g) Income tax assets 7 10.23 14.41 h) Other non-current assets 8 21.03 222.00
Total non-current assets 5,259.28 13,198.37 Current assets
a) Inventories 9 425.05 1,490.95 b) Financial assets
(i) Trade receivables 10 251.95 1,422.66 (ii) Cash and cash equivalents 11 49.58 65.24 (iii) Other bank balances 12 28.95 52.68 (iv) Loans 13 162.02 149.87 (v) Other financial assets 14 8.77 51.71
c) Other current assets 15 158.23 303.40 Total current assets 1,084.55 3,536.51 Assets classified as held for sale and discontinued operations 36 8,076.52 - Total assets 14,420.35 16,734.88 EQUITY AND LIABILITIESEquity
a) Equity share capital 16 61.25 61.25 b) Other equity 17 4,123.47 3,819.72
Total equity 4,184.72 3,880.97 LiabilitiesNon-current liabilities
a) Financial liabilities(i) Borrowings 18 883.04 5,707.08
b) Provisions 19 134.92 251.24 c) Other non-current liabilities 20 6.81 42.92
Total non-current liabilities 1,024.77 6,001.24 Current liabilities
a) Financial liabilities(i) Borrowings 21 693.85 1,938.21 (ii) Trade payables 22
- Outstanding dues of micro, small and medium enterprises 16.17 34.71 - Outstanding dues of creditors other than above 762.64 2,383.67
(iii) Other financial liabilities 23 5,330.49 2,278.27 b) Other current liabilities 24 110.90 149.88 c) Provisions 25 21.87 67.93 d) Current tax liabilities (net) 26 74.75 -
Total current liabilities 7,010.67 6,852.67 Liabilities directly associated with discontinued operations 36 2,200.19 - Total equity and liabilities 14,420.35 16,734.88 Summary of significant accounting policies 1

Annual Report 2018-1974
The accompanying notes 1 to 59 are an integral part of the financial statements.This is the Statement of Profit and Loss referred to in our report of even date.
For Walker Chandiok & Co LLP For and on behalf of Board of Directors of Panacea Biotec LimitedChartered AccountantsFirm Registration No. 001076N/N500013
Anupam Kumar Soshil Kumar Jain Dr. Rajesh JainPartner Chairman Managing DirectorMembership No. 501531 (DIN 00012812) (DIN 00013053)
Vinod Goel Devender GuptaPlace : New Delhi Group CFO and Head Legal Chief Financial Officer & Date : May 30, 2019 & Company Secretary Head Information Technology
(Rs. in million)
NoteNo.
For the year endedMarch 31, 2019
For the year endedMarch 31, 2018
Continuing operationsIncomeRevenue from operations 27 962.10 1,839.80 Other income 28 35.25 125.01 Total income 997.35 1,964.81 ExpensesCost of materials consumed 29 591.33 920.48 Changes in inventories of finished goods, stock-in-trade and work-in-progress 30 172.95 (39.72)Excise duty - 2.63 Employee benefits expense 31 411.58 359.72 Finance costs 32 1,046.33 1,032.28 Depreciation and amortisation expense 33 330.30 336.94 Other expenses 34 1,252.87 677.74 Total expenses 3,805.36 3,290.07 Profit/(loss) before exceptional items and tax (2,808.01) (1,325.26)Exceptional items 35 3,133.49 - Profit/(loss) before tax 325.48 (1,325.26)Tax expense 37
Current tax 74.75 - Deferred tax 31.33 106.42
Total tax expense 106.08 106.42 Profit/(loss) for the year from continuing operations 219.40 (1,431.68)Profit/(loss) before tax from discontinued operations 36 46.30 712.92 Tax expense of discontinued operations - - Profit/(loss) after tax from discontinued operations 46.30 712.92 Profit/(loss) for the year 265.70 (718.76)Other comprehensive incomeItems that will not be reclassified to profit or loss:
Remeasurements of net defined benefit plans (10.01) (21.77)
Income tax on above 3.50 7.61
Total other comprehensive income (net of tax) (6.51) (14.16)
Total comprehensive income for the year 259.19 (732.92)
Earnings per equity share for continuing operations (face value of Re.1 each) 38
- Basic and diluted earnings per equity share (in Rs.) 3.58 (23.37)
Earnings per equity share for discontinued operations (face value of Re.1 each)
- Basic and diluted earnings per equity share (in Rs.) 0.76 11.64
Earnings per equity share (for continuing and discontinued operations) (face value of Re.1 each)
- Basic and diluted earning per equity share (in Rs.) 4.34 (11.73)
Summary of significant accounting policies 1
Statement of Profit and Loss For the Year ended March 31, 2019

Panacea Biotec Ltd. 75
Cash Flow Statement for the Year ended March 31, 2019(Indirect Method)
(Rs. in million)
Note No.
For the year ended March 31, 2019
For the year ended March 31, 2018
A. Cash flow from operating activitiesProfit/(loss) before tax from continuing operations 325.48 (1,325.26)Profit/(loss) before tax from discontinued operations 46.30 712.92 Adjustment forDepreciation and amortisation expense 537.10 570.47 Finance costs 1,046.33 1,032.28 Allowance for expected credit loss and doubtful advances 44.35 72.28 Impairment of non-financial assets - 1.68 Interest income (38.51) (80.81)Bad debts and advances written off 103.31 - Property, plant and equipments written off 318.57 - Loss/(gain) on sale of property, plant and equipment (net) 5.19 0.08 Excess provisions written back (2.92) (44.97)Unrealized foreign exchange loss (net) 168.80 53.01 Dividend income (0.03) (0.02)Intangibles assets under development provided /written off 233.86 - Provision for impairment of investment 38.56 - Adjustment on settlement of debts (refer note 55) (3,133.49) - Operating profit before working capital changes (307.10) 991.66 Changes in working capitalInventories 730.90 (86.77)Trade receivables 429.70 246.94 Other financial assets 24.23 (2.27)Loans (33.51) (46.66)Other current assets (30.52) 354.60 Trade payables 195.47 177.73 Other financial liabilities (2.51) 38.91 Other current liabilities (11.44) (59.92)Provisions 72.15 110.90 Cash flow from operating activities post working capital changes 1,067.37 1,725.13 Income tax (paid)/refund (net) 4.18 (4.54)Net cash flow from operating activities (A) 1,071.55 1,720.59
B. Cash flow from investing activitiesPurchase of property, plant and equipment and intangible assets (including capital work in progress, intangibles under development, capital advances and creditors for capital goods) (46.70) (150.06)
Proceeds from sale of property, plant and equipment - 0.13 Interest received 6.42 73.65 Dividend received 0.03 0.02 Investment in shares of subsidiary (1.00) (79.73)Realisation on disposal of assets held for sale - 136.49 Investments in bank deposits having original maturity of more than three months (42.06) (7.80)Net cash used in investing activities (B) (83.31) (27.30)
C. Cash flow from financing activitiesProceeds from non-current borrowings - 57.97 Repayment of non-current borrowings (155.39) (348.15)Proceeds from current borrowings - 40.00 Repayment of current borrowings (192.13) (298.28)Interest paid (637.02) (1,088.22)Net cash used in financing activities (C) (984.54) (1,636.68)
Increase /(Decrease) in net cash and cash equivalents (A+B+C) 3.70 56.61 Cash and cash equivalents at the beginning of the year 65.24 8.63 Changes in cash and cash equivalents pertaining to discontinued operations (19.36) - Cash and cash equivalents at the end of the year (refer note 11) 49.58 65.24 Summary of significant accounting policies 1
The accompanying notes 1 to 59 are an integral part of the financial statements.This is the Cash Flow Statement referred to in our report of even date.
For Walker Chandiok & Co LLP For and on behalf of Board of Directors of Panacea Biotec LimitedChartered AccountantsFirm Registration No. 001076N/N500013
Anupam Kumar Soshil Kumar Jain Dr. Rajesh JainPartner Chairman Managing DirectorMembership No. 501531 (DIN 00012812) (DIN 00013053)
Vinod Goel Devender GuptaPlace : New Delhi Group CFO and Head Legal Chief Financial Officer & Date : May 30, 2019 & Company Secretary Head Information Technology

Annual Report 2018-1976
Statement of Changes in Equity for the year ended March 31, 2019
The accompanying notes 1 to 59 are an integral part of the financial statements.This is the Statement of Changes in Equity referred to in our report of even date.
For Walker Chandiok & Co LLP For and on behalf of Board of Directors of Panacea Biotec LimitedChartered AccountantsFirm Registration No. 001076N/N500013
Anupam Kumar Soshil Kumar Jain Dr. Rajesh JainPartner Chairman Managing DirectorMembership No. 501531 (DIN 00012812) (DIN 00013053)
Vinod Goel Devender GuptaPlace : New Delhi Group CFO and Head Legal Chief Financial Officer & Date : May 30, 2019 & Company Secretary Head Information Technology
A. Equity share capital(Rs. in million)
Opening Balance as at April 01, 2017 61.25
Changes during the year -
Closing balance as at March 31, 2018 61.25
Change during the year -
Closing balance as at March 31, 2019 61.25
B. Other equity(Rs. in million)
Equity component
of compound financial
instruments
Reserves and surplus
Total Retained earnings
General reserve
Securities premium account
Capital redemption
reserve
Foreign currency monetary item
translation difference account
Balance as at April 1, 2017 96.39 2,216.43 364.99 897.05 1,022.34 (100.25) 4,496.95 Profit/(Loss) for the year - (718.76) - - - - (718.76)Other comprehensive income for the year (net of tax) - (14.16) - - - - (14.16)
Total comprehensive income for the year - (732.92) - - - - (732.92)Movement during the period - - - - - 55.69 55.69 Balance as at March 31, 2018 96.39 1,483.51 364.99 897.05 1,022.34 (44.56) 3,819.72 Balance as at April 1, 2018 96.39 1,483.51 364.99 897.05 1,022.34 (44.56) 3,819.72 Profit/(Loss) for the year - 265.70 - - - - 265.70 Other comprehensive income for the year (net of tax) - (6.51) - - - - (6.51)
Total comprehensive income for the year - 259.19 - - - - 259.19 Movement during the period - - - - - 44.56 44.56 Balance as at March 31, 2019 96.39 1,742.70 364.99 897.05 1,022.34 - 4,123.47
Summary of significant accounting policies (Refer note 1)

Panacea Biotec Ltd. 77
1. Corporate information
Panacea Biotec Limited (Corporate identification number: L33117PB1984PLC022350) (“PBL” or “the Company”) is a public company incorporated and domiciled in India. The Company’s shares are listed with Bombay Stock Exchange Limited and National Stock Exchange of India Limited. The Company is one of India’s leading research based biotechnology companies engaged in the business of research, development, manufacture and marketing of branded pharmaceutical formulations and vaccines.
The Company has its registered place of business at Ambala-Chandigarh Highway Lalru-140501, Punjab, India.
1.1 Basis of preparation
The financial statements of the Company have been prepared in accordance with Indian Accounting Standards (“Ind AS”) as notified by Ministry of Corporate Affairs pursuant to Section 133 of the Companies Act, 2013 (the “Act”) read with Rule 3 of the Companies (Indian Accounting Standards) Rules, 2015 as amended from time to time.
The financial statements are separate financial statement of the Company. The Company has also prepared consolidated financial statement for the year ended March 31, 2019 in accordance with Ind AS 110 which were also approved by the Board of Directors, along with these financial statements on May 30, 2019. Revision to the financial statements is permitted by the Board of Directors after obtaining necessary approvals or at the instance of regulatory authorities, as per provision of the Act.
For all periods up to and including the year ended March 31, 2017, the Company prepared its financial statements in accordance with accounting standards notified under Section 133 of the Act, read together with paragraph 7 of the Companies (Accounts) Rules, 2014 which is considered as “Previous GAAP”. The financial statements for the year ended March 31, 2018 were the first Ind AS financial statements of the Company.
The financial results have been prepared on a historical cost basis, except for the following assets and liabilities which have been measured at fair value:
• Certain financial assets and liabilities measured at fair value (refer accounting policy regarding financial instruments); and
• Defined benefit plans – plan assets measured at fair value.
New and amended standards adopted by the Company:
The Company has applied the following standards and amendments for the first time for their annual reporting period commencing April 1, 2018:
• Ind AS 115, Revenue from Contracts with Customers
• Amendment to Ind AS 20, Accounting for Government Grants and Disclosure of Government Assistance
• Appendix B, Foreign Currency Transactions and Advance Consideration to Ind AS 21, the Effects of Changes in Foreign Exchange Rates
• Amendment to Ind AS 12, Income Taxes
• Amendment to Ind AS 40, Investment Property
• Amendment to Ind AS 28, Investments in Associates and Joint Ventures and Ind AS 112, Disclosure of Interests in Other Entities
These amendments did not have any impact on the amounts recognised in prior periods and are not expected to significantly affect the current or future periods.
1.2 Use of estimates and judgements
The preparation of the financial statements in conformity with Ind AS requires management to make estimates, judgments and assumptions. These estimates, judgments and assumptions affect the application of accounting policies and the reported amounts of assets and liabilities, the disclosures of contingent assets and liabilities at the date of the financial statements and reported amounts of revenues and expenses during the period. Application of accounting policies that require critical accounting estimates involving complex and subjective judgments and the use of assumptions in these financial statements have been disclosed in note 1.4. Accounting estimates could change from period to period. Actual results could differ from those estimates. Appropriate changes in estimates are made as management becomes aware of changes in circumstances surrounding the estimates. Changes in estimates are reflected in the financial statements in the period in which changes are made and, if material, their effects are disclosed in the notes to the financial statements.
1.3 Significant accounting policies
The significant accounting policies that are used in the preparation of these financial statements are summarised below. These accounting policies are consistently used throughout the periods presented in the financial statements.
a) Current versus non-current classification
The Company presents assets and liabilities in the balance sheet based on current/ non-current classification. An asset is treated as current when it is:
• Expected to be realised or intended to be sold or consumed in normal operating cycle*
• Held primarily for the purpose of trading
• Expected to be realised within twelve months after the reporting period, or
• Cash or cash equivalent unless restricted from being exchanged or used to settle a liability for at least twelve months after the reporting period.
All other assets are classified as non-current.
A liability is current when:
• It is expected to be settled in normal operating cycle*
• It is held primarily for the purpose of trading
Summary of Significant Accounting Policies for the year ended March 31, 2019

Annual Report 2018-1978
• It is due to be settled within twelve months after the reporting period, or
• There is no unconditional right to defer the settlement of the liability for at least twelve months after the reporting period.
The Company classifies all other liabilities as non-current.
Deferred tax assets and liabilities are classified as non-current assets and liabilities.
*Based on the nature of products and the time between acquisition of assets for processing and their realisation in cash and cash equivalents, the Company has ascertained its operating cycle as 12 months for the purpose of current or non-current classification of assets and liabilities.
b) Inventory
Inventories are valued as follows:
Raw material, components, stores and spares
Raw materials (including packing materials), components, stores and spares are valued at lower of cost or net realisable value. However, materials and other items held for use in the production of inventories are not written down below cost if the finished products in which they will be incorporated are expected to be sold at or above cost. Cost of raw materials, components and stores and spares is determined on a weighted average basis. Stores and spares having useful life of more than twelve months are capitalised as “Property, plant and equipment” and are depreciated prospectively over their remaining useful lives in accordance with Ind AS 16.
Work in progress and finished goods
Work in progress and finished goods are valued at lower of cost or net realisable value. Cost includes raw material cost and a proportion of direct and indirect overheads up to estimated stage of completion. Cost is determined on a weighted average basis.
Traded goods
Traded goods are valued at lower of cost or net realisable value. Cost includes cost of purchase and other cost incurred in bringing the inventories to their present location and condition. Cost is determined on weighted average basis.
Net realisable value is the estimated selling price in the ordinary course of business, less estimated costs of completion and estimated costs necessary to make the sale.
c) Property, plant and equipment
Recognition and initial measurement
All items of property, plant and equipment are initially measured at cost. The cost comprises purchase price, borrowing cost if capitalisation criteria are met and directly attributable cost of bringing the asset to its working condition for the intended use. Any trade discount and rebates are deducted in arriving at the purchase price. Subsequent to initial recognition, property, plant and equipment other than freehold land are measured at cost less accumulated depreciation and accumulated impairment losses. Subsequent costs are included in the asset’s carrying amount or recognised as a separate asset, as appropriate, only when it is probable that future economic benefits attributable to such subsequent cost associated with the item will flow to the Company. All other repair and maintenance costs are recognised in statement of profit or loss as incurred.
The cost of replacing part of an item of property, plant and equipment is recognised in the carrying amount of the item if it is probable that the future economic benefits embodied within the part will flow to the Company and its cost can be measured reliably. The costs of repairs and maintenance are recognised in the statement of profit and loss as incurred.
Advances paid towards the acquisition of property, plant and equipment outstanding at each reporting date is disclosed as capital advances under non-current assets.
Capital work-in-progress included in property, plant and equipment are not depreciated as these assets are not yet available for use.
Subsequent measurement (depreciation and useful lives)
Depreciation on property, plant and equipment is provided on the straight line method arrived on the basis of the useful life prescribed under Schedule II of the Act. The following useful life of assets has been determined by the Company:
Particulars Useful lifeBuilding – factory 30 yearsBuilding – Non-factory 60 yearsPlant and Equipment 15 years and 20 yearsFurniture and fixtures 10 yearsVehicles 8 yearsOffice equipment 5 yearsComputer equipment 3 years and 6 years
i) Freehold land has an unlimited useful life and therefore is not depreciated.
ii) Leasehold land is amortised over the period of lease
iii) Leasehold improvements are amortised over the initial period of lease or useful life, whichever is shorter.
The residual values, useful lives and method of depreciation are reviewed at each financial year end and adjusted prospectively, if appropriate.
Where, during any financial year, any addition has been made to any asset, or where any asset has been sold, discarded, demolished or destroyed, or significant components replaced; depreciation on such assets is calculated on a pro rata basis as individual assets with specific useful life from the month of such addition or, as the case may be, up to the month on which such asset has been sold, discarded, demolished or destroyed or replaced.
Summary of Significant Accounting Policies for the year ended March 31, 2019

Panacea Biotec Ltd. 79
De-recognition
An item of property, plant and equipment and any significant part initially recognised is de-recognised upon disposal or when no future economic benefits are expected from its use or disposal. Any gain or loss arising on de-recognition of the asset (calculated as the difference between the net disposal proceeds and the carrying amount of the asset) is included in the statement of profit and loss when the asset is derecognized.
d) Intangible assets
Recognition and initial measurement
Research and development costs
Expenditure on the research phase of projects is recognised as an expense as incurred. Costs that are directly attributable to a project’s development phase are recognised as intangible assets, provided the Company can demonstrate the following:
• the technical feasibility of completing the intangible asset so that it will be available for use.
• its intention to complete the intangible asset and use or sell it
• its ability to use or sell the intangible asset
• how the intangible asset will generate probable future economic benefits
• the availability of adequate technical, financial and other resources to complete the development and to use or sell the intangible asset.
• its ability to measure reliably the expenditure attributable to the intangible asset during its development.
Development costs not meeting these criteria for capitalisation are expensed as incurred.
Directly attributable costs include employee costs incurred on development of prototypes along with an appropriate portion of relevant overheads and borrowing costs
Other intangibles
Intangible assets acquired separately are measured on initial recognition at cost. Following initial recognition, intangible assets are carried at cost less accumulated amortisation and accumulated impairment losses, if any. Internally generated intangible assets, excluding product development costs, are not capitalised and expenditure is reflected in the statement of profit and loss in the year in which the expenditure is incurred.
Intangible assets under development are not amortized as these assets are not yet available for use. These assets are evaluated for potential impairment on an annual basis or when there are indications that the carrying value is not recoverable.
Subsequent measurement (Amortisation and useful lives)
All finite-lived intangible assets, including internally developed intangible assets, are accounted for using the cost model whereby capitalised costs are amortised on a straight-line basis over their estimated useful lives. Residual values and useful lives are reviewed at each reporting date and any change in the same is accounted for prospectively. The following useful lives are applied:
Intangible assets Amortisation periodPatents, trademarks and designs 7 yearsProduct development 5 YearsTechnical know-how 5 yearsSoftware 5 yearsWebsites 2 years
De-recognition
Gains or losses arising from de-recognition of an intangible asset are measured as the difference between the net disposal proceeds and the carrying amount of the asset and are recognised in the statement of profit or loss when the asset is derecognised.
e) Assets classified as held-for-sale
Assets are classified as held-for-sale if their carrying amount will be recovered principally through a sale transaction rather than through continuing use and a sale is considered highly probable. They are measured at the lower of their carrying amount and fair value less costs to sell.
Assets classified as held for sale are not depreciated or amortised. Interest and other expenses attributable to the liabilities of a disposal group classified as held-for-sale continue to be recognised. Assets classified as held-for-sale are presented separately from the other assets in the balance sheet. The liabilities of a disposal group classified as held-for-sale are presented separately from other liabilities in the balance sheet.
f ) Impairment of non-financial assets
The carrying amounts of the Company’s non-financial assets, other than inventories and deferred tax assets are reviewed at each reporting date to determine whether there is any indication of impairment. If any such indication exists, then the asset’s recoverable amount is estimated. Goodwill and intangible assets that have indefinite lives or that are not yet available for use are tested for impairment annually; their recoverable amount is estimated annually each year at the reporting date.
For the purpose of impairment testing, assets are grouped together into the smallest group of assets that generates cash inflows from continuing use that are largely independent of the cash inflows of other assets or groups of assets (the ‘cash-generating unit’). The recoverable amount of an asset or cash-generating unit is the greater of its value in use or its fair value less costs to sell. In assessing value in use, the estimated future cash flows are discounted to their present value using a pre-tax discount rate that reflects current market assessments of the time value of money and the risks specific to the asset. The goodwill acquired in a business combination is, for the purpose of impairment testing, allocated to cash-generating units that are expected to benefit from the synergies of the combination.
Summary of Significant Accounting Policies for the year ended March 31, 2019

Annual Report 2018-1980
Summary of Significant Accounting Policies for the year ended March 31, 2019
Intangibles with indefinite useful lives are tested for impairment individually.
An impairment loss is recognised if the carrying amount of an asset or its cash-generating unit exceeds its estimated recoverable amount. Impairment losses recognised in respect of cash-generating units are allocated first to reduce the carrying amount of any goodwill allocated to the units and then to reduce the carrying amount of the other assets in the unit on a pro-rata basis. Impairment losses are recognised in the statement of profit and loss.
Impairment losses recognised in prior periods are assessed at each reporting date for any indications that the loss has decreased or no longer exists. An impairment loss is reversed if there has been a change in the estimates used to determine the recoverable amount. An impairment loss is reversed only to the extent that the asset’s carrying amount does not exceed the carrying amount that would have been determined, net of depreciation or amortisation, if no impairment loss had been recognised.
g) Borrowing costs
Borrowing costs directly attributable to the acquisition, construction or production of an asset that necessarily takes a substantial period of time to get ready for its intended use or sale are capitalised as part of the cost of the asset. All other borrowing costs are expensed in the period in which they occur. Borrowing cost consists of interest, ancillary costs and other costs in connection with the borrowing and also includes exchange differences to the extent regarded as an adjustment to the borrowing costs.
h) Foreign and presentation currency
The financial statements are presented in Indian Rupees (INR), which is also the Company’s functional and presentation currency
Foreign Currencies
Transactions and balances
Initial recognition : Transactions in foreign currencies are initially recorded by the Company at its functional currency spot rates at the date the transaction first qualifies for recognition.
Subsequent measurement : Monetary assets and liabilities denominated in foreign currencies are translated at the functional currency spot rates of exchange at the reporting date.
Exchange differences arising on settlement or translation of monetary items are recognised in the statement of profit or loss in the year in which they arise.
Non-monetary items that are measured in terms of historical cost in a foreign currency are translated using the exchange rates at the dates of the initial transactions. Non-monetary items measured at fair value in a foreign currency are translated using the exchange rates at the date when the fair value is determined. The gain or loss arising on translation of non-monetary items measured at fair value is treated in line with the recognition of the gain or loss on the change in fair value of the item (i.e. translation differences on items whose fair value gain or loss is recognised in Other Comprehensive Income (“OCI”) or profit or loss are also recognised in OCI or profit or loss, respectively).
Exchange differences arising on other long-term foreign currency monetary items are accumulated in the “Foreign Currency Monetary Item Translation Difference Account” and amortised over the remaining life of the concerned monetary item.
All other exchange differences are charged to the statement of profit and loss.
i) Leases
Company as a lessee
A lease is classified at the inception date as a finance lease or an operating lease. A lease that transfers substantially all the risks and rewards incidental to ownership to the Company is classified as a finance lease.
Finance leases are capitalised at the commencement of the lease at the inception date fair value of the leased Asset or, if lower, at the present value of the minimum lease payments. Lease payments are apportioned between finance charges and reduction of the lease liability so as to achieve a constant rate of interest on the remaining balance of the liability. Finance charges are recognised in finance costs in the statement of profit and loss. Contingent rentals are recognised as expenses in the periods in which they are incurred. Lease management fees, legal charges and other initial direct costs are capitalised.
A leased asset is depreciated over the useful life of the asset. However, if there is no reasonable certainty that the Company will obtain ownership by the end of the lease term, the asset is depreciated over the shorter of the useful life of the asset and the lease term.
Operating lease payments are recognised as an expense in the statement of profit and loss on a straight-line basis over the lease term, except in case where lease rentals are structured to increase in line with expected general inflation to compensate for the lessor's expected inflationary cost.
Company as a lessor
Leases in which the Company does not transfer substantially all the risks and rewards of ownership of an asset are classified as operating leases. Rental income from operating lease is recognised on a straight-line basis over the term of the relevant lease. Initial direct costs incurred in negotiating and arranging an operating lease are added to the carrying amount of the leased asset and recognised over the lease term on the same basis as rental income. Contingent rents are recognised as revenue in the period in which they are earned.
Leases are classified as finance leases when substantially all of the risks and rewards of ownership transfer from the Company to the lessee. Amounts due from lessees under finance leases are recorded as receivables at the Company’s net investment in the leases. Finance lease income is allocated to accounting periods so as to reflect a constant periodic rate of return on the net investment outstanding in respect of the lease.
j) Fair value measurement
Fair value is the price that would be received to sell an asset or paid to transfer a liability in an orderly transaction between market participants at the measurement date. The fair value measurement is based on the presumption that the transaction to sell the asset or transfer the liability takes place either:
• In the principal market for the asset or liability, or

Panacea Biotec Ltd. 81
• In the absence of a principal market, in the most advantageous market for the asset or liability
The principal or the most advantageous market must be accessible by the Company.
The fair value of an asset or a liability is measured using the assumptions that market participants would use when pricing the asset or liability, assuming that market participants act in their economic best interest.
A fair value measurement of a non-financial asset takes into account a market participant’s ability to generate economic benefits by using the asset in its highest and best use or by selling it to another market participant that would use the asset in its highest and best use.
Company uses valuation techniques that are appropriate in the circumstances and for which sufficient data are available to measure fair value, maximizing the use of relevant observable inputs and minimizing the use of unobservable inputs.
All assets and liabilities for which fair value is measured or disclosed in the financial results are categorized within the fair value hierarchy, described as follows, based on the lowest level input that is significant to the fair value measurement as a whole:
Level 1 — Quoted (unadjusted) market prices in active markets for identical assets or liabilities
Level 2 — Valuation techniques for which the lowest level input that is significant to the fair value measurement is directly or indirectly observable
Level 3 — Valuation techniques for which the lowest level input that is significant to the fair value measurement is unobservable
For assets and liabilities that are recognized in the financial statements on a recurring basis, Company determines whether transfers have occurred between levels in the hierarchy by re-assessing categorization (based on the lowest level input that is significant to the fair value measurement as a whole) at the end of each reporting period or each case.
k) Revenue recognition
Revenue is measured at fair value of the consideration received or receivable, exclusive of any trade discounts, volume rebates and any taxes or duties collected on behalf of the government which are levied on sales such as GST, sales tax, value added tax, etc. The Company has concluded that it is the principal in all of its revenue arrangements since it is the primary obligor in all the revenue arrangements as it has pricing latitude and is also exposed to inventory and credit risks.
The Company applies the revenue recognition criteria to each separately identifiable component of the Revenue transaction as set out below:
Sale of goods
Revenue from sale of goods is recognised when all the significant risks and rewards of ownership in the goods are transferred to the buyer as per the terms of the contract, there is neither continuing managerial involvement with the goods nor effective control over the goods sold, it is probable that economic benefits will flow to the Company, the costs incurred or to be incurred in respect of the transaction can be measured reliably and the amount of revenue can be measured reliably.
Revenue from services rendered is recognised in the statement of profit and loss over the period the underlying services are performed.
Dividend income: Dividend income is recognised at the time when right to receive the payment is established, which is generally when the shareholders approve the dividend.
Interest income: Interest income is recorded on accrual basis using the effective interest rate (“EIR”) method.
Royalty income: Royalty is recognized on an accrual basis based on actual sale of product by the licensee and in accordance with the terms of the relevant agreement.
Research and license fees income: Research and license fees income is recognized on an accrual basis based on actual sale of product by the licensee and in accordance with the term of the relevant agreement.
Export incentives: Export entitlements from government authorities are recognised in the statement of profit and loss when the right to receive credit as per the terms of the scheme is established in respect of the exports made by the Company, and where there is no significant uncertainty regarding the ultimate collection of the relevant export proceeds.
l) Financial instruments
Recognition and initial measurement
Financial assets and financial liabilities are recognised when the Company becomes a party to the contractual provisions of the instrument and are measured initially at fair value adjusted for transaction costs, except for those carried at fair value through profit or loss which are measured initially at fair value.
Subsequent measurement
Financial assets
i) Financial assets carried at amortised cost – A financial instrument is measured at amortised cost if both the following conditions are met:
• The asset is held within a business model whose objective is to hold assets for collecting contractual cash flows, and
• Contractual terms of the asset give rise on specified dates to cash flows that are solely payments of principal and interest (“SPPI”) on the principal amount outstanding.
After initial measurement, such financial assets are subsequently measured at amortised cost using the effective interest method.
ii. Investments in equity instruments of subsidiaries and joint ventures - Investments in equity instruments of subsidiaries and joint ventures are accounted for at cost in accordance with Ind AS 27 Separate Financial Statements.
iii. Financial assets at fair value
• Investments in equity instruments other than above - Investments in equity instruments which are held for trading are generally classified as at fair value through profit or loss (“FVTPL”). For all other equity instruments, the Company makes irrevocable
Summary of Significant Accounting Policies for the year ended March 31, 2019
Annual Report 2018-1982
Summary of Significant Accounting Policies for the year ended March 31, 2019
choice upon initial recognition, on an instrument to instrument basis, to classify the same either as at fair value through other comprehensive income (“FVOCI”) or fair value through profit or loss FVTPL.
If the Company decides to classify an equity instrument as at FVOCI, then all fair value changes on the instrument, excluding dividends, are recognised in the OCI. There is no recycling of the amounts from OCI to profit or loss, even on sale of investment. However, the Company transfers the cumulative gain or loss within equity. Dividends on such investments are recognised in the statement of profit or loss unless the dividend clearly represents a recovery of part of the cost of the investment.
Equity instruments included within the FVTPL category are measured at fair value with all changes recognised in the profit or loss.
De-recognition of financial assets
A financial asset is primarily de-recognised when the rights to receive cash flows from the asset have expired or the Company has transferred its rights to receive cash flows from the asset.
Financial liabilities
Subsequent to initial recognition, all non-derivative financial liabilities, other than derivative liabilities, are subsequently measured at amortised cost using the effective interest method.
De-recognition of financial liabilities
A financial liability is de-recognised when the obligation under the liability is discharged or cancelled or expires. When an existing financial liability is replaced by another from the same lender on substantially different terms, or the terms of an existing liability are substantially modified, such an exchange or modification is treated as the de-recognition of the original liability and the recognition of a new liability. The difference in the respective carrying amounts is recognised in the statement of profit and loss.
Offsetting of financial instruments
Financial assets and financial liabilities are offset and the net amount is reported in the balance sheet if there is a currently enforceable legal right to offset the recognised amounts and there is an intention to settle on a net basis, to realize the assets and settle the liabilities simultaneously.
Impairment of financial assets
The Company assesses on a forward looking basis the expected credit losses associated with its assets carried at amortised cost. The impairment methodology applied depends on whether there has been a significant increase in credit risk. Note 58 details how the Company determines whether there has been a significant increase in credit risk.
For trade receivables only, the Company applies the simplified approach permitted by Ind AS 109 Financial Instruments, which requires expected lifetime losses to be recognised from initial recognition of the receivables.
m) Investment in subsidiaries and joint ventures
Investments in subsidiaries and joint ventures are carried at cost less accumulated impairment losses, if any. Where an indication of impairment exists, the carrying amount of the investment is assessed and written down immediately to its recoverable amount. On disposal of these investments, the difference between net disposal proceeds and the carrying amounts are recognised in the statement of profit and loss.
n) Post-employment and other employee benefits
Provident fund
Retirement benefit in the form of provident fund is a defined contribution scheme. The Company has no obligation, other than the contribution payable to the provident fund. The Company recognizes contribution payable to the provident fund scheme as an expense, when an employee renders the related service. The Company has no obligation other than the contribution payable to the Provided Fund. If the contribution already paid exceeds the contribution due for services received before the balance sheet date, then excess is recognised as an asset to the extent that the pre-payment will lead to, for example, a reduction in future payment or a cash refund.
Gratuity
A defined benefit plan is a post-employment benefit plan other than a defined contribution plan. The Company’s net obligation in respect of the gratuity plan (administered through the Life Insurance Corporation of India), which is a defined benefit plan, is calculated by estimating the ultimate cost to the entity of the benefit that employees have earned in return for their service in the current and prior periods. This requires an entity to determine how much benefit is attributable to the current and prior periods and to make estimates (actuarial assumptions) about demographic variables and financial variables that will affect the cost of the benefit. The cost of providing benefits under the defined benefit plan is determined on the basis of actuarial valuation using the projected unit credit method. Actuarial gains/losses resulting from re-measurements of the liability are included in other comprehensive income.
Compensated absences
Compensated absences, which are expected to be utilized within the next 12 months, is treated as short term employee benefit. The Company measures the expected cost of such absences as the additional amount that it expects to pay as a result of the unused entitlement that has accumulated at the reporting date.
The Company treats compensated absences expected to be carried forward beyond twelve months, as long-term employee benefit for measurement purposes. Such long-term compensated absences are provided for based on the actuarial valuation using the projected unit credit method at the year-end. Actuarial gains/losses are immediately taken to the statement of profit and loss and are not deferred.
Other short-term benefits
Expense in respect of other short-term benefits is recognized on the basis of amount paid or payable for the period during which services are rendered by the employees.
o) Earnings per share
Basic earnings per share is calculated by dividing the net profit or loss for the period attributable to equity shareholders (after deducting

Panacea Biotec Ltd. 83
Summary of Significant Accounting Policies for the year ended March 31, 2019
attributable taxes) by the weighted average number of equity shares outstanding during the period. The weighted average number of equity shares outstanding during the period is adjusted for events including a bonus issue.
For the purpose of calculating diluted earnings per share, the net profit or loss for the period attributable to equity shareholders and the weighted average number of shares outstanding during the period are adjusted for the effects of all dilutive potential equity shares.
p) Taxes
Tax expense recognized in statement of profit and loss comprises the sum of deferred tax and current tax except the ones recognized in other comprehensive income or directly in equity.
Current tax is determined as the tax payable in respect of taxable income for the year and is computed in accordance with the applicable tax regulations. Current income tax relating to items recognized outside profit or loss is recognized outside profit or loss (either in other comprehensive income or in equity).
Minimum Alternate Tax (‘MAT’) credit entitlement is recognized as an asset only when and to the extent there is convincing evidence that normal income tax will be paid during the specified period. In the year in which MAT credit becomes eligible to be recognized as an asset, the said asset is created by way of a credit to the statement of profit and loss and presented as MAT credit entitlement. This is reviewed at each balance sheet date and the carrying amount of MAT credit entitlement is written down to the extent it is not reasonably certain that normal income tax will be paid during the specified period.
Deferred tax is recognized in respect of temporary differences between carrying amount of assets and liabilities for financial reporting purposes and corresponding amount used for taxation purposes. Deferred tax assets on unrealised tax loss are recognized to the extent that it is probable that the underlying tax loss will be utilised against future taxable income. This is assessed based on the Company’s forecast of future operating results, adjusted for significant non-taxable income and expenses and specific limits on the use of any unused tax loss. Unrecognized deferred tax assets are re-assessed at each reporting date and are recognized to the extent that it has become probable that future taxable profits will allow the deferred tax asset to be recovered.
Deferred tax assets and liabilities are measured at the tax rates that are expected to apply in the year when the asset is realised or the liability is settled, based on tax rates (and tax laws) that have been enacted or substantively enacted at the reporting date. Deferred tax relating to items recognized outside statement of profit and loss is recognized outside statement of profit or loss (either in other comprehensive income or in equity).
q) Government grants
Grants from the government are recognised at their fair value where there is reasonable assurance that the grant will be received and the group will comply with all the conditions.
Government grants related to the income are deferred and recognised in statement of profit and loss over the period necessary to match them with the cost that are intended to compensate and presented within other income.
Government grants related to property plant and equipment are included in the non-current liabilities as deferred income and are credited to profit and loss on a straight line basis over the expected life of the related assets and presented within other income.
r) Segment reporting
Operating segments are reported in a manner consistent with the internal reporting provided to the chief operating decision maker.
Identification of segments
In accordance with Ind AS 108 – Operating Segment, the operating segments used to present segment information are identified on the basis of information reviewed by the Company’s management to allocate resources to the segments and assess their performance. An operating segment is a component of the Company that engages in business activities from which it earns revenues and incurs expenses, including revenues and expenses that relate to transactions with any of the Company’s other components. Results of the operating segments are reviewed regularly by the Board of director (chairman and chief financial officer) which has been identified as the chief operating decision maker (CODM), to make decisions about resources to be allocated to the segment and assess its performance and for which discrete financial information is available.
Allocation of common costs
Common allocable costs are allocated to each segment accordingly to the relative contribution of each segment to the total common costs.
Unallocated items
Unallocated items include general corporate income and expense items which are not allocated to any business segment.
Segment accounting policies
The Company prepares its segment information in conformity with the accounting policies adopted for preparing and presenting the financial results of the Company as a whole.
s) Cash and cash equivalents
Cash and cash equivalent in the balance sheet comprise cash at banks and on hand and short-term deposits with an original maturity of three months or less, which are subject to an insignificant risk of changes in value.
t) Provisions, contingent liabilities and contingent assets
Provisions are recognised when present obligations as a result of past events will probably lead to an outflow of economic resources from the Company and they can be estimated reliably. Timing or amount of the outflow may still be uncertain. A present obligation arises from the presence of a legal or constructive obligation that has resulted from past events.
Provisions are measured at the best estimate of expenditure required to settle the present obligation at the reporting date, based on the most reliable evidence, including the risks and uncertainties associated with the present obligation.
In those cases where the possible outflow of economic resource as a result of present obligations is considered improbable or remote, or

Annual Report 2018-1984
the amount to be provided for cannot be measured reliably, no liability is recognised in the balance sheet.
Any amount that the Company can be virtually certain to collect from a third party with respect to the obligation is recognised as a separate asset up to the amount of the related provisions. All provisions are reviewed at each reporting date and adjusted to reflect the current best estimate.
Contingent assets are not recognized in the financial statements.
1.4 Significant management judgments in applying accounting policies and estimation uncertainty The preparation of the Company’s financial statements requires management to make judgments, estimates and assumptions that affect the reported amounts of revenues, expenses, assets and liabilities and the related disclosures.
Significant management judgments
Research and developments costs - Management monitors progress of internal research and development projects by using a project management system. Significant judgment is required in distinguishing research from the development phase. Development costs are recognised as an asset when all the criteria are met, whereas research costs are expensed as incurred. Management also monitors whether the recognition requirements for development costs continue to be met. This is necessary due to inherent uncertainty in the economic success of any product development.
Recognition of deferred tax assets - The extent to which deferred tax assets can be recognized is based on an assessment of the probability of the future taxable income against which the deferred tax assets can be utilised.
Provisions, contingent liabilities and contingent assets – The Company is the subject of legal proceedings and tax issues covering a range of matters, which are pending in various jurisdictions. In view of the uncertainty inherent in such matters, it is difficult to predict the final outcome of such matters. The cases and claims against the Company often raise difficult and complex factual and legal issues, which are subject to many uncertainties, including but not limited to the facts and circumstances of each particular case and claim, the jurisdiction and the differences in applicable law. In the normal course of business, management consults with legal counsel and certain other experts on matters related to litigation and taxes. The Company accrues a liability when it is determined that an adverse outcome is probable and the amount of the loss can be reasonably estimated.
Impairment of financial assets – At each balance sheet date, based on historical default rates observed over expected life, the management assesses the expected credit loss on outstanding financial assets.
Evaluation of indicators for impairment of assets – The evaluation of applicability of indicators of impairment of assets requires assessment of several external and internal factors which could result in deterioration of recoverable amount of the assets.
Significant estimates
Useful lives of depreciable/amortisable assets – Management reviews its estimate of the useful lives of depreciable/amortisable assets at each reporting date, based on the expected utility of the assets. Uncertainties in these estimates relate to technical and economic obsolescence that may change the utility of certain software, IT equipment and other plant and equipment.
Defined benefit obligation – Management’s estimate of the DBO is based on a number of critical underlying assumptions such as standard rates of inflation, mortality, discount rate and anticipation of future salary increases. Variation in these assumptions may significantly impact the DBO amount and the annual defined benefit expenses.
Fair value measurements
Management applies valuation techniques to determine the fair value of financial instruments (where active market quotes are not available). This involves developing estimates and assumptions consistent with how market participants would price the instrument.
1.5 Standard issued but not yet effective:a) Ind AS 116 ‘Leases’: On 30th March, 2019, the Ministry of Corporate Affairs has notified Ind AS 116: Leases. Ind AS 116 will replace the existing
leases standard, Ind AS 17, Leases, and related interpretations. The standard sets out the principles for the recognition, measurement, presentation and disclosure of leases for both parties to a contract i.e., the lessee and the lessor. Ind AS 116 introduces a single lessee accounting model and requires the lessee to recognise assets and liabilities for all leases with a term of more than twelve months, unless the underlying asset is of low value. Currently, operating lease expenses are charged to the profit or Loss. The standard also contains enhanced disclosure requirements for lessees. Ind AS 116 substantially carries forward the lessor accounting requirements in Ind AS 17. The effective date for the adoption of Ind AS 116 is annual periods beginning on or after 1st April, 2019.
b) Ind AS 12 ‘Taxes’: On 30th March, 2019, the Ministry of Corporate Affairs has notified Ind AS 12, Appendix C, Uncertainty over Income Tax Treatments which is to be applied while performing the determination of taxable profit (or loss), tax bases, unused tax losses, unused tax credits and tax rates, when there is uncertainty over income tax treatments under Ind AS 12. According to the appendix, companies need to determine the probability of the relevant tax authority accepting each tax treatment, or group of tax treatments, that the companies have used or plan to use in their income tax filing which has to be considered to compute the most likely amount or the expected value of the tax treatment when determining taxable profit (tax loss), tax bases, unused tax losses, unused tax credits and tax rates.
Dividend distribution tax: On 30th March, 2019, the Ministry of Corporate Affairs issued amendments to the guidance in Ind AS 12, Income Taxes, in connection with accounting for dividend distribution taxes. The amendment clarifies that an entity shall recognise the income tax consequences of dividends in profit or loss, other comprehensive income or equity according to where the entity originally recognised those past transactions or events.
The effective date for adoption of Ind AS 12 is annual periods beginning on or after April 1, 2019. The Company will adopt the standard on 1st April, 2019. The Company is currently evaluating the effect of these amendments on the financial statements.
c) Amendment to Ind AS 19, plan amendment, curtailment or settlement: On 30th March, 2019, the Ministry of Corporate Affairs issued amendments to Ind AS 19, Employee Benefits, in connection with accounting for plan amendments, curtailments and settlements. Effective date for application of this amendment is annual period beginning on or after 1st April, 2019. The Company does not have any impact on account of this amendment.
Summary of Significant Accounting Policies for the year ended March 31, 2019

Panacea Biotec Ltd. 85
Notes to the financial statements for the year ended March 31, 2019
Notes : a) Plant and equipment includes plant and machinery amounting to Rs.Nil (March 31, 2018: Rs.0.86 million) (net block) lying with third parties.b) Property, plant and equipment pledged as security: Refer note 43 for information on assets pledged and mortgaged as security.c) Contractual commitments: Refer note 39(B) for information on contractual commitments related to property, plant and equipment.
2.1 Property, plant and equipment(Rs. in million)
Description Freehold land
Leasehold land
Building Plant and equipment
Furniture and fittings
Vehicles Office equipment
Computer equipment
Total
Gross carrying valueAs at April 1, 2017 2,370.74 291.85 4,150.41 6,842.35 343.80 110.48 224.22 195.11 14,528.96
Additions - - 1.31 52.49 0.37 - 0.37 1.85 56.39 Disposals - - - 0.20 - 1.88 1.74 - 3.82
As at March 31, 2018 2,370.74 291.85 4,151.72 6,894.64 344.17 108.60 222.85 196.96 14,581.53 Additions - - - 0.61 0.09 - 0.63 1.12 2.45 Disposals - - - 1,276.57 63.40 6.21 56.40 44.42 1,447.00 Transfer to discontinued operations (refer note 36)
428.41 141.81 2,053.21 2,388.97 152.71 27.53 84.45 53.43 5,330.52
As at March 31, 2019 1,942.33 150.04 2,098.51 3,229.71 128.15 74.86 82.63 100.23 7,806.46 Accumulated depreciationAs at April 1, 2017 - 21.27 748.90 3,621.35 292.78 93.19 211.15 179.54 5,168.18
Charge for the year - 4.04 101.79 422.16 13.60 5.03 0.95 3.79 551.36 Disposals - - - 0.14 - 1.74 1.73 - 3.61
As at March 31, 2018 - 25.31 850.69 4,043.37 306.38 96.48 210.37 183.33 5,715.93 Charge for the year - 4.04 101.89 400.72 8.45 2.90 0.87 3.07 521.94 Disposals - - - 958.76 59.84 5.84 53.55 42.17 1,120.16 Transfer to discontinued operations (refer note 36)
- 13.38 435.99 1,515.51 139.47 26.08 79.41 50.13 2,259.97
As at March 31, 2019 - 15.97 516.59 1,969.82 115.52 67.46 78.28 94.10 2,857.74 Net block as at March 31, 2019 1,942.33 134.07 1,581.92 1,259.89 12.63 7.40 4.35 6.13 4,948.72 Net block as at March 31, 2018 2,370.74 266.54 3,301.03 2,851.27 37.79 12.12 12.48 13.63 8,865.60
2.2 Capital work-in-progress(Rs. in million)
Description Amount As at April 1, 2017 59.77 Add: addition during the year 44.19 Less: capitalisation during the year (56.39)As at March 31, 2018 47.57 Add: addition during the year 9.66 Less: Disposal - Less: capitalisation during the year (2.45)Transfer to discontinued operations (refer note 36) (25.26)As at March 31, 2019 29.52
Notes :i) The capital work-in-progress relates to construction and installation of property, plant and equipment.ii) Refer note 43 for information on assets pledged and mortgaged as security.

Annual Report 2018-1986
Notes to the financial statements for the year ended March 31, 2019
Note :Intangible assets pledged as security: Refer note 43 for information on assets pledged and mortgaged as security.
2.4 Intangible assets under development(Rs. in million)
Description Amount As at April 1, 2017 217.06 Add: addition during the year 110.41 Less: capitalisation during the year (3.43)As at March 31, 2018 324.04 Add: addition during the year 39.23 Less: Disposal (222.13)Less: capitalisation during the year - Transfer to discontinued operations (refer note 36) (139.62)As at March 31, 2019 1.52
Notes :i) The intangible under development relates to product registration, patent, technical know-how and software.ii) Refer note 43 for information on assets pledged and mortgaged as security.
2.3 Intangible assets(Rs. in million)
Description Patent, trademark and copyrights
Softwares Websites Product development
Total
Gross carrying valueAs at April 1, 2017 74.31 236.33 9.20 520.65 840.49
Additions - 1.19 - 2.24 3.43 Disposals - - - - -
As at March 31, 2018 74.31 237.52 9.20 522.89 843.92 Additions - - - - - Disposals 6.60 11.25 - 12.21 30.06 Transfer to discontinued operations (refer note 36)
18.55 21.24 - 441.00 480.79
As at March 31, 2019 49.16 205.03 9.20 69.68 333.07 Accumulated amortisationAs at April 1, 2017 68.95 217.97 9.20 485.00 781.12
Charge for the year 1.14 7.76 - 10.22 19.12 Disposals - - - - -
As at March 31, 2018 70.09 225.73 9.20 495.22 800.24 Charge for the year 1.01 7.09 - 7.07 15.17 Disposals 3.78 9.51 - 5.49 18.78 Transfer to discontinued operations (refer note 36)
18.16 20.08 440.98 479.22
As at March 31, 2019 49.16 203.23 9.20 55.82 317.41 Net block as at March 31, 2019 - 1.80 - 13.86 15.66 Net block as at March 31, 2018 4.22 11.79 - 27.67 43.68

Panacea Biotec Ltd. 87
Notes to the financial statements for the year ended March 31, 2019
(Rs. in million)
As atMarch 31, 2019
As atMarch 31, 2018
3. Investments (non-current)Carried at costInvestments in equity instruments
A. Investment in equity instruments of subsidiary companies (unquoted):a) 4,776,319 (March 31, 2018: 4,776,319) equity shares of Re.1 each, fully paid up in Radhika Heights
Limited (refer note 36(ii)) 3,385.65 3,385.65
b) 1,000 (March 31, 2018: 1,000) equity shares of USD 0.01 each, fully paid up in Rees Investments Limited (refer note 56) 0.00 0.00
c) 6,000 (March 31, 2018: 6,000) equity shares of CHF 100 each, fully paid up in Panacea Biotec (International) S.A. Switzerland (refer note 56) 34.36 34.36
d) 419,767 (March 31, 2018: 419,767) equity shares of Rs.10 each, fully paid in PanEra Biotec Private Limited 4.20 4.20
e) 90,000 (March 31, 2018: 90,000) equity shares of Rs.10 each, fully paid up in Adveta Power Private Limited 0.90 0.90
f ) 1,000,000 (March 31, 2018: Nil) equity shares of Re.1 each, fully paid up in Panacea Biotec Pharma Limited (refer note 36(i)) 1.00 -
3,426.11 3,425.11 Less: Provision for impairment 38.56 - Less: transferred to discontinued operations (refer note 36) 3,385.65 -
1.90 3,425.11 B. Investment in equity instruments of Joint venture company (unquoted):
a) 2,295,910 (March 31, 2018: 2,295,910) equity shares of Rs.10 each, fully paid up in Chiron Panacea Vaccines Private Limited (under liquidation) 22.96 22.96
22.96 22.96 Carried at fair value through profit and loss (Refer note 48)
C. Investment in equity instruments of other entities (unquoted):a) 20,250 (March 31, 2018: 20,250) equity shares of Rs.10 each fully paid up in Shivalik Solid Waste
Management Limited) 0.20 0.20
b) 50,000 (March 31, 2018: 50,000) equity shares of Rs.10 each fully paid up in Mohali Green Environment Private Limited 0.50 0.50
0.70 0.70 Less: transferred to discontinued operations (refer note 36) 0.20 -
0.50 0.70 Total investments 25.36 3,448.77 Aggregate amount of unquoted investments 25.36 3,448.77 Aggregate amount of impairment in value of investments 38.56 -
4. Loans (non-current)Unsecured, considered goodSecurity deposits 6.34 9.93 Unsecured, considered doubtfulLoans to related parties (refer note (i) and (ii) below) 74.69 289.10
81.03 299.03 Less : allowance for doubtful loans (74.69) (289.10)Total 6.34 9.93 Notes:i) Refer note 48 and 49 for disclosure of fair value in respect of financial assets measured at amortised
cost and disclosure for financial risk management for assessment of expected credit losses.ii) Refer note 42 for related party disclosure. Loan of Rs.246.50 million as on March 31, 2019, to
Panacea Biotec Germany GmbH is included in the assets held for discontinued operations.
5. Other financial assets (non-current)Bank deposits with maturity of more than 12 months 8.86 2.51 Total 8.86 2.51 Notes:i) Fixed deposits amounting to Rs.8.86 million (March 31, 2018: Rs.2.51 million) are pledged/
deposited with banks and various Government authorities for tender, bank guarantee, margin money etc.
ii) Refer note 48 and 49 for disclosure of fair value in respect of financial assets measured at amortised cost and disclosure for financial risk management for assessment of expected credit losses.

Annual Report 2018-1988
Notes to the financial statements for the year ended March 31, 2019
(Rs. in million)
As atMarch 31, 2019
As atMarch 31, 2018
6. Deferred tax assets (net)Deferred tax liabilities arising on account of
Property, plant and equipment and intangible assets 1,465.88 1,762.80 Capital expenditure on research and development 8.44 105.93 Others - 0.77
1,474.32 1,869.50 Deferred tax assets arising on account of
Expenditure allowed on payment basis 407.06 425.54 Unabsorbed business losses and depreciation 1,051.76 1,385.86 Minimum alternative tax credit entitlement 192.04 219.87 Others 15.50 58.09
1,666.36 2,089.36 Total 192.04 219.86 Note: Refer note 37 for changes in deferred tax balances.
7. Income tax assets (net)Advance taxes 1,712.14 1,716.31 Less: provision for taxes (1,701.91) (1,701.90)Total 10.23 14.41
8. Other non-current assets(Unsecured, considered good)Capital advances 3.20 180.33 Balances with statutory authorities 17.83 40.28 Prepaid expenses - 1.39 Total 21.03 222.00 Note: Refer note 43 for information on assets pledged and mortgaged as security.
9. Inventories(lower of cost or net realisable value)Raw materials (including packing materials) 177.75 721.15 Finished goods 117.63 345.18 Traded goods - 77.95 Work-in-progress 75.17 218.72 Stores and spares 54.50 127.95 Total 425.05 1,490.95 Note: Refer note 43 for information on assets pledged and mortgaged as security.
10. Trade receivablesUnsecured, considered good 308.36 1,462.69 Unsecured, considered doubtful 8.50 21.79
316.86 1,484.48 Less: allowance for expected credit loss (56.41) (40.03)Less: allowance for doubtful debts (8.50) (21.79)Total 251.95 1,422.66 Note: Refer note 48 and 49 for disclosure of fair value in respect of financial assets measured at amortised cost and disclosure for financial risk management for assessment of expected credit losses.
11. Cash and cash equivalentsBalances with banks
- in current accounts 49.34 64.35 - in exchange earners' foreign currency accounts - 0.46
Cash on hand 0.24 0.43 Total 49.58 65.24
12. Other bank balancesDeposits with original maturity for more than 3 months but less than 12 months (refer note (i) below) 28.95 52.56 Unpaid dividend accounts (refer note (ii) below) - 0.12 Total 28.95 52.68 Notes:i) Fixed deposits amounting to Rs.28.95 million (March 31, 2018: Rs.52.56 million) are pledged/ deposited with banks and various Government
authorities for tender, bank guarantee, margin money etc.ii) Not available for use by the Company as these represent corresponding unpaid/unclaimed dividend liabilities.

Panacea Biotec Ltd. 89
Notes to the financial statements for the year ended March 31, 2019
(Rs. in million)
As atMarch 31, 2019
As atMarch 31, 2018
13. Loans (current)Unsecured, considered good
Security deposits 2.21 18.06 Loan to employees (refer note 53) 159.81 131.81
Unsecured, considered doubtfulLoans to related parties (refer note 42) 585.16 585.16
747.18 735.03 Less : allowance for doubtful loans (refer note 42) (585.16) (585.16)Total 162.02 149.87 Note: Refer note 48 and 49 for disclosure of fair value in respect of financial assets measured at amortised cost and disclosure for financial risk management for assessment of expected credit losses.
14. Other financial assets (current)Unsecured, considered goodInsurance claim receivables - 1.23 Export benefits receivable 8.77 42.68 Others - 7.80 Total 8.77 51.71 Notes:i) Refer note 48 and 49 for disclosure of fair value in respect of financial assets measured at amortised
cost and disclosure for financial risk management for assessment of expected credit losses.ii) Refer note 43 for information on assets pledged and mortgaged as security.
15. Other current assets(Unsecured, considered good, unless otherwise stated)Prepaid expenses 8.26 43.79 Balances with statutory authorities 74.52 107.29 Advance to suppliers - considered good 75.45 152.32 - considered doubtful 33.97 41.44
192.20 344.84 Less: allowance for doubtful advances (33.97) (41.44)Total 158.23 303.40 Note: Refer note 43 for information on assets pledged and mortgaged as security.
16. Share capitala) Authorised
i) 125,000,000 (March 31, 2018: 125,000,000) Equity Shares of Re.1 each 125.00 125.00 ii) 110,000,000 (March 31, 2018: 110,000,000) Preference Shares of Rs.10 each 1,100.00 1,100.00
1,225.00 1,225.00 b) Issued, subscribed and fully paid up
61,250,746 (March 31, 2018: 61,250,746) Equity Shares of Re.1 each 61.25 61.25 Total 61.25 61.25
c) Terms/right attached to equity shares: The Company has only one class of equity shares having a par value of Re.1 per share. Each holder of equity shares is entitled to one vote per share.
The Company declares and pays dividends in Indian Rupees. The dividend if any, proposed by the Board of Directors is subject to the approval of the shareholders in the ensuing Annual General Meeting. The Board of Directors has not proposed any dividend for current year and previous year.
In the event of liquidation of the Company, the holders of equity shares will be entitled to receive remaining assets of the Company, after distribution of all preferential amounts including preference shares. The distribution will be in proportion to the number of equity shares held by the equity shareholders.
d) Reconciliation of number of equity shares:As at March 31, 2019 As at March 31, 2018
No of shares Rs. in million No of shares Rs. in million Equity shares at the beginning of the year 61,250,746 61.25 61,250,746 61.25 Changes during the year - - - - Equity shares at the end of the year 61,250,746 61.25 61,250,746 61.25

Annual Report 2018-1990
Notes to the financial statements for the year ended March 31, 2019
f) Terms attached to 0.5% cumulative non-convertible and non-participating redeemable preference shares: The Company has only one class of preference shares having a par value of Rs.10 per share. The Company declares and pays dividends in Indian
Rupees. The dividend, if any, proposed by the Board of Directors is subject to the approval of the shareholders in the ensuing Annual General Meeting. The Board of Directors has not proposed any dividend for current year and previous year.
The preference shares were initially issued for a period of 10 years w.e.f. January 6, 2015, with an option with the Company as well as preference shareholders for early redemption of preference shares, provided CDR debts (refer note 18(A)) are fully serviced and the Company comes out from the purview of CDR system. The terms of preference shares have been amended on April 08, 2019 so as to enhance the tenure from 10 years to 15 years with an option with the Company as well as preference shareholders for early redemption of preference shares, provided the secured debt obligations with respect to debentures issued by the Company are fully serviced by the Company as per the agreed terms with the new investor. In the event of liquidation of the Company, the holders of preference shares will be entitled to receive the remaining assets of the Company after distribution of all preferential amounts, in preference to the equity shareholders. The distribution will be in proportion to the number of preference shares held by the preference shareholders. Also refer note 18(D).
e) Details of shareholders holding more than 5% of equity shares in the Company:
As at March 31, 2019 As at March 31, 2018 No of shares % holding No of shares % holding
Mr. Soshil Kumar Jain 5,000,000 8.16% 5,000,000 8.16%Dr. Rajesh Jain 6,213,500 10.14% 6,213,500 10.14%Mr. Sandeep Jain 4,792,100 7.82% 4,792,100 7.82%Mrs. Sunanda Jain 6,647,300 10.85% 6,647,300 10.85%Ravinder Jain (HUF) 4,135,000 6.75% 4,135,000 6.75%Rajesh Jain (HUF) 3,750,799 6.12% 4,046,617 6.61%Sandeep Jain (HUF) 4,105,000 6.70% 4,105,000 6.70%Serum Institute of India Pvt. Ltd. 5,774,732 9.43% 5,774,732 9.43%Mr. Adar Cyrus Poonawala 3,157,034 5.15% 3,157,900 5.16%The above information has been furnished as per the shareholders' detail available with the Company at the year end.
(Rs. in million)
As atMarch 31, 2019
As atMarch 31, 2018
17. Other equity*Equity component of compound financial instruments (refer note 16 (f ) to (i) and 18(D)) 96.39 96.39 Reserves and Surplus:
Retained earnings 1,742.70 1,483.51 General reserve 364.99 364.99 Security premium account 897.05 897.05 Capital redemption reserve 1,022.34 1,022.34 Foreign currency monetary item translation difference account - (44.56)
Total 4,123.47 3,819.72 * For changes in balances of reserves, refer to the Statement of Changes in Equity.
i) Detail of preference shareholders holding more than 5% of 0.5% cumulative non-convertible and non-participating redeemable preference share capital:
Name of personsAs at March 31, 2019 As at March 31, 2018
No of shares % holding No of shares % holdingMr. Soshil Kumar Jain 6,570,000 40.31% 6,570,000 40.31%Dr. Rajesh Jain 6,570,000 40.31% 6,570,000 40.31%Mr. Sandeep Jain 3,160,000 19.38% 3,160,000 19.38%The above information has been furnished as per the shareholders detail available with the Company at the year end.
g) Reconciliation of 0.5% cumulative non-convertible and non-participating redeemable preference shares:
h) No equity/preference shares have been bought back nor any bonus share or shares have been issued for consideration other than cash during the period of five years immediately preceding the reporting date except for issue of preference shares by conversion of loan in financial year 2014-15 amounting to Rs.163,000,000. Further, as per the proposed Scheme of Arrangement with respect to demerger of Demerged Undertaking (refer note 36), 1,63,000 preference shares shall stand cancelled including all the accrued rights therein upon implementation of the said Scheme of Arrangement and completion of related compliances, the Transferee Company shall issue equivalent number of preference shares to the preference shareholders.
As at March 31, 2019 As at March 31, 2018 No of shares Rs. in million No of shares Rs. in million
Preference shares at the beginning of the year 16,300,000 163.00 16,300,000 163.00 Changes during the year - - - - Preference shares at the end of the year 16,300,000 163.00 16,300,000 163.00
Nature and purpose of other reservesGeneral reserve: The Company has transferred a portion of the net profit before declaring dividend to general reserve pursuant to the provisions of the erstwhile Companies Act, 1956. Mandatory transfer to general reserve is not required under the Act.Securities premium account: represents premium received on issue of shares. The reserve is utilised in accordance with the provisions of the Act.Capital redemption reserve: created in accordance with provisions of the Act for the buy back of equity shares from the market.Foreign currency monetary item translation difference account : Exchange difference arising on long term foreign currency monetary items related to foreign currency term loan.Other comprehensive income: The Company has recognised remeasurements benefits on defined benefits plans through other comprehensive income.

Panacea Biotec Ltd. 91
(Rs. in million)
As atMarch 31, 2019
As atMarch 31, 2018
18. Borrowings (non-current)Term loans from banks (secured)Foreign currency term loans from banks (refer note (A), (B) and (E) below)
Bank of India 1,136.70 1,627.27 Rupee loans
Term loan from banks (refer note (A), (B) and (E) below)Indian Overseas Bank 660.57 915.00 State Bank of India [loan - I] 894.45 1,400.07 State Bank of India [loan - II] 450.13 704.70
Working capital term loan (refer note (A), (B) and (E) below)Axis Bank - 4.39 Bank of India 33.70 54.31 Canara Bank 21.35 33.41 IDBI Bank 14.97 15.76 Indian Overseas Bank 29.96 41.59 State Bank of India 334.50 523.19 Union Bank of India 26.02 40.72
Funded interest term loan (refer note (A), (B) and (E) below)Axis Bank - 3.02 Bank of India 82.70 134.68 Canara Bank 12.94 20.29 IDBI Bank 10.28 10.82 Indian Overseas Bank 162.67 225.33 State Bank of India 376.15 622.51 Union Bank of India 15.59 24.46
Rupee Term loans from others Biotechnology Industrial Research Assistance Council ("BIRAC") (secured) (refer note (C) (1) and (2) below) 59.50 61.00
Department of Science & Technology ("DST") (unsecured) (refer note (C) (3) below) 8.00 8.00 Edelweiss Assets Reconstruction Co. Ltd. ("EARC") [loan - I] (secured) (refer note (A), (B) and (E) below) 883.57 1,005.76
EARC [loan - II] (secured) (refer note (A), (B) and (E) below) 127.13 129.80 Technology Development Board ("TDB") (secured) (refer note (C) (4) below) 57.98 57.98
Unsecured:Liability component of compound financial instruments
16,300,000 (March 31, 2018: 16,300,000) 0.5% cumulative non-convertible and non-participating redeemable preference shares of Rs.10 each (refer note (D) below) 105.44 94.60
Loan from related parties (refer note (C) (5) below and note 47) 266.80 - Loan from bodies corporate (refer note (C) (5) below and note 47) 421.82 -
6,192.92 7,758.66 Less: current maturities of non-current borrowings (disclosed under note 23) (5,309.88) (2,051.58)Total 883.04 5,707.08
Notes to the financial statements for the year ended March 31, 2019
Notes:Rate of interest - The Company’s long term borrowings are at an effective weighted average rate of 11% (March 31, 2018: 11%) per annum.(A) Loans under Corporate Debt Restructuring (CDR):
1 All the long-term loans and sustainable working capital borrowings from the banks have been restructured under the CDR package approved by the Corporate Debt Restructuring Empowered Group (CDR- EG) on September 24, 2014, except foreign currency term loan from Bank of India.
2 During the year, the CDR Lenders have considered the CDR scheme as failed CDR and exit from CDR due to non-compliance with the pending conditions but not due to default for payment of principal/ interest as per agreed terms of CDR. Consequently, the CDR Lenders classified the Company’s account as non-performing asset. The Company has reached bilateral settlements of its debts with each CDR lender individually. In view of above, all the loans from CDR Lenders have been considered as current and considered as part of current maturities of non-current borrowings. Also refer note 55.
(B) Securities for the non-current loans and sustainable working capital borrowings:1 The long-term borrowings, except rupee term loans from BIRAC, TDB and DST have been secured by way of :
i) first pari-passu charge over entire fixed assets (both present and future) of the Company, by way of mortgage of the immovable properties and hypothecation of all movable fixed assets; and
ii) second pari passu charge over entire current assets (both present and future) of the Company, by way of hypothecation and/or pledge of all current assets including all receivable, finished goods, raw materials, work in progress, consumable stores and spares, book debts and bills receivable.
2 The sustainable working capital facilities (fund based, non-fund based, buyer credits etc.) have been secured by way of:i) first pari-passu charge over entire current assets (both present and future) of the Company, by way of hypothecation and/or pledge of all current
assets including all receivable, finished goods, raw materials, work in progress, consumable stores and spares, book debts, bills receivable; and ii) second pari-passu charge over entire fixed assets (both present and future) of the Company, by way of mortgage of the immovable properties and
hypothecation of all movable fixed assets.3 The long-term borrowings and sustainable working capital facilities, restructured under the CDR package, have been additionally secured by personal
guarantees and pledge of equity shares of the Company held by three promoter directors of the Company viz. Mr. Soshil Kumar Jain, Dr. Rajesh Jain and Mr. Sandeep Jain. The personal guarantee and pledge of equity shares of the Company held by Mr. Ravinder Jain and Mr. Sumit Jain were pending during the year. In the meantime, Mr. Ravinder Jain ceased to be promoter and director due to his demise on February 21, 2018.
5 The details of immovable properties of the Company mortgaged in favour of SBI CAP Trustee Co. Ltd. (acting as trustee on behalf of the CDR Lenders) to secure the long-term borrowings and sustainable working capital borrowings as mentioned above, are as under:
4 The long-term loans and working capital facilities from State Bank of India and EARC (loan I) are additionally secured by way of mortgage of personal property of promoter directors, viz. Mr. Soshil Kumar Jain, Dr. Rajesh Jain and Mr. Sandeep Jain.

Annual Report 2018-1992
Notes to the financial statements for the year ended March 31, 2019
(Rs. in million)
As atMarch 31, 2019
As atMarch 31, 2018
Value of preference shares issued 163.00 163.00 Equity component of preference shares (refer note (i) below) (96.39) (96.39)
66.61 66.61 Interest expense (refer note (ii) below) 10.84 9.73 Opening interest accrued 27.99 18.26 Non-current borrowings 105.44 94.60Notes: i) The equity component is the difference between fair value of liability component computed at the effective interest rate of 11% p.a. and the value of preference
shares issued, which is presented as a separate component of equity under Statement of Changes in Equity.ii) Interest expense is calculated by applying the effective interest rate of 11% p.a. to the liability component
(E) Refer note 47 for defaults of repayment of loans and interest thereon.(F) Refer note 43 for information on assets pledged and mortgaged as security.
i. All parcels of lands admeasuring 96 Bighas 19 Biswa situated at Village Samelheri, Tehsil Dera bassi, District S.A.S. Nagar (Mohali), Punjab;ii. All parcels of land admeasuring 93 Bighas, 12 Biswa and 10 Biswansi situated at Village Samelheri, Tehsil Derabassi, District S.A.S. Nagar (Mohali),
Punjab;iii. All parcels of land admeasuring 26 Bighas 3 biswas comprised in various Khewat/Khatoni Numbers, situated at Village Manpura, Tehsil Baddi,
District Solan, Himachal Pradesh;iv. All parcels of land admeasuring 91 Bighas 1 Biswa, comprised in various Khewat/Khatoni Numbers situated at Village Malpur, Tehsil Baddi, District
Solan, Himachal Pradesh;v. All parcels of Land bearing Plot No. E-4, Phase-2, Area measuring 9435.66 Sq.Yds., situated at Industrial Area S.A.S. Nagar, District S.A.S. Nagar
(Mohali), Punjab;vi. Flat number 3, 4, 203 and 303 situated at Elite Heights Apartment, at municipal no. 6-3-1238/15/1 & 6-3-1238/16 survey no. 32/1, at Somajiguda,
Hyderabad, Telangana;vii. Industrial plot no. A-24, A-25 and A-27 having land measuring 718.92 sq yds each at Block B-1 Extension and Industrial plot no. E-12 having land
measuring 1,372.52 sq yds at Block B-1, situated at Mohan Co-operative Industrial Estate, Mathura Road, New Delhi;viii. Plot no.35 & 36 measuring 900 sq. yds. each at Silver City Main, Village Bishanpura, MC Zirakpur, Tehsil Dera Bassi, District SAS Nagar (Mohali),
Punjab;ix. 80 flats, i.e., 20 flats comprising in block A-2 bearing no: 101 to 104, 201 to 201, 301 to 304, 401 to 404 & 501 to 504 each having super area 1495
sqft and 60 flats in block B-10, B-11, B-12 bearing no. 101 to 104, 201 to 201, 301 to 304, 401 to 404 & 501 to 504 each having super area 1161 sqft (30 flats) and super area 1186 sq ft (30 flats) in building built on land measuring 28 bigha 11 biswa in khewat khatoni no: 89/91 comprised in khasra no: 1747 (4-12), khewat khatoni no: 168/194 khasra no: 1970/1746 (1-15), 1971/1746 (3-0), 1748 (9-0) khewat khatoni no: 339/333 khasra no: 1749 (4-11), 1750 (5-13), kitas 6, village Bhatoli Kalan, Hadbast no. 214, Pargna Dharampura, Tehsil Baddi, District Solan, H.P.
x. Flat no. 201 at Samarpan Complex, village Chakala, Taluka Andheri (East), Mumbai;xi. Flat no. 401, 601 in A-wing and Flat no. 214 in C-wing situated at Progressive’s Signature Tower, plot no: 53/54 sector-6, Ghansoli, Navi Mumbai;xii. Residential premises no. 703, 704, 903, 904 and 1001 to 1004 in wing “B” of Sagar Heights Building F; and Commercial premises no. 707 to 712, 714
to 718, 808 to 812 and 814 to 818 in Sagar Tech Plaza- Building A, all situated at CTS no . 721/A, 721B, & 721/1 survey no: 14,15,2052, at village Mohili, Andheri Kurla Road, Andheri (East), Mumbai; and
xiii. Industrial plot no. Gen-72/3, land measuring 5518 sqmts in the Trans Thane Creek Industrial Area, Navi Mumbai.(C) Repayment terms and security of the loans outside the CDR Scheme:
1. Rupee term loan from BIRAC for H1N1 influenza vaccine project, with amount outstanding of Rs.49.00 million (March 31, 2018: Rs.70.00 million), was rescheduled in the financial year 2015-16. It is repayable in ten equal half-yearly instalments commencing from March 31, 2017. This loan is secured by way of hypothecation of all equipment, apparatus, machineries, machineries spares, tools and other accessories, goods and/or other movable property (both present and future) of the Company by way of first charge on pari-passu basis.
2. Rupee term loan from BIRAC for Streptococcus pneumococcal conjugate vaccine project, with amount outstanding of Rs.10.50 million (March 31, 2018: Rs.12.00 million), is repayable in ten equal half-yearly instalments commencing from May 29, 2017 and is secured by way of hypothecation of all equipment, apparatus, machineries, machineries spares, tools and other accessories, goods and/or other movable property (both present and future) of the Company by way of first charge on pari-passu basis.
3. The unsecured rupee term loan from DST of Rs.8.00 million (March 31, 2018: Rs.8.00 million), is for specific project and is repayable in ten equal annual instalments commencing from September 2012.
4. Rupee term loan from TDB of Rs.57.98 million as at March 31, 2018 (Rs.57.98 million) is for Dengue vaccine project and is repayable in nine equal half-yearly instalments commencing from July 1, 2020 and is secured by way of (i) first pari-passu charge on the whole of the moveable properties of the Company including its movable plant and machinery, machinery spares, tools and accessories and other movables both present and future except book debts; and (ii) mortgage of immovable properties of the Company being land admeasuring 1011.11 sq. yards, situated at Plot no. 37, Sector 21-A, Urban Estate, Faridabad, Haryana.
5. Loan from related parties and loan from bodies corporate mentioned above are payable after April 7, 2024. (D) Liability component of compound financial instruments:
i) Further to note 16(f ), the Company had issued 16,300,000 0.5% cumulative non-convertible and non-participating redeemable Preference shares of Rs. 10 each to the three promoters viz. Mr. Soshil Kumar Jain, Dr. Rajesh Jain and Mr. Sandeep Jain. The preference shares are presented in the balance sheet as follows:
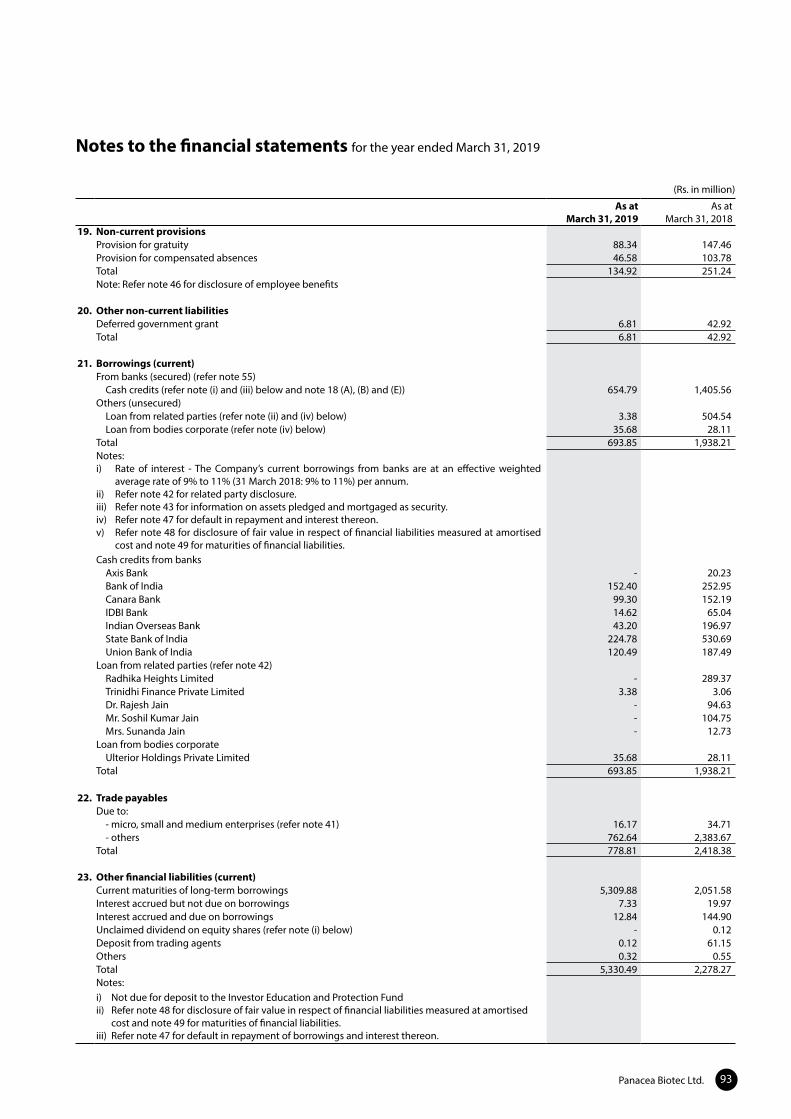
Panacea Biotec Ltd. 93
Notes to the financial statements for the year ended March 31, 2019
(Rs. in million)
As atMarch 31, 2019
As atMarch 31, 2018
19. Non-current provisionsProvision for gratuity 88.34 147.46 Provision for compensated absences 46.58 103.78 Total 134.92 251.24 Note: Refer note 46 for disclosure of employee benefits
20. Other non-current liabilitiesDeferred government grant 6.81 42.92 Total 6.81 42.92
21. Borrowings (current)From banks (secured) (refer note 55)
Cash credits (refer note (i) and (iii) below and note 18 (A), (B) and (E)) 654.79 1,405.56 Others (unsecured)
Loan from related parties (refer note (ii) and (iv) below) 3.38 504.54 Loan from bodies corporate (refer note (iv) below) 35.68 28.11
Total 693.85 1,938.21 Notes:i) Rate of interest - The Company’s current borrowings from banks are at an effective weighted
average rate of 9% to 11% (31 March 2018: 9% to 11%) per annum.ii) Refer note 42 for related party disclosure.iii) Refer note 43 for information on assets pledged and mortgaged as security.iv) Refer note 47 for default in repayment and interest thereon.v) Refer note 48 for disclosure of fair value in respect of financial liabilities measured at amortised
cost and note 49 for maturities of financial liabilities.Cash credits from banks
Axis Bank - 20.23 Bank of India 152.40 252.95 Canara Bank 99.30 152.19 IDBI Bank 14.62 65.04 Indian Overseas Bank 43.20 196.97 State Bank of India 224.78 530.69 Union Bank of India 120.49 187.49
Loan from related parties (refer note 42)Radhika Heights Limited - 289.37 Trinidhi Finance Private Limited 3.38 3.06 Dr. Rajesh Jain - 94.63 Mr. Soshil Kumar Jain - 104.75 Mrs. Sunanda Jain - 12.73
Loan from bodies corporate Ulterior Holdings Private Limited 35.68 28.11
Total 693.85 1,938.21
22. Trade payablesDue to:
- micro, small and medium enterprises (refer note 41) 16.17 34.71 - others 762.64 2,383.67
Total 778.81 2,418.38
23. Other financial liabilities (current)Current maturities of long-term borrowings 5,309.88 2,051.58 Interest accrued but not due on borrowings 7.33 19.97 Interest accrued and due on borrowings 12.84 144.90 Unclaimed dividend on equity shares (refer note (i) below) - 0.12 Deposit from trading agents 0.12 61.15 Others 0.32 0.55 Total 5,330.49 2,278.27 Notes:i) Not due for deposit to the Investor Education and Protection Fundii) Refer note 48 for disclosure of fair value in respect of financial liabilities measured at amortised
cost and note 49 for maturities of financial liabilities.iii) Refer note 47 for default in repayment of borrowings and interest thereon.

Annual Report 2018-1994
Notes to the financial statements for the year ended March 31, 2019
28. Other incomeIncome from investments
Dividend income - 0.02 Interest income from:
Banks deposits 4.50 3.97 Loans given to subsidiaries 7.46 73.46 Others 1.69 2.10
OthersExcess provisions written back - 1.84 Government grant income 10.34 9.20 Lease rent 5.97 34.26 Gain on sale of property, plant and equipment (net) 0.51 - Miscellaneous 4.78 0.16
Total 35.25 125.01
29. Cost of materials consumed Raw materials and packing materials Opening stock 399.21 332.30 Add : Purchases during the year 369.87 987.39
769.08 1,319.69 Less : Closing stock 177.75 399.21 Total 591.33 920.48
30. Changes in inventories of finished goods, stock in trade and work-in-progressOpening Stock
Finished goods 210.50 234.93 Work-in-progress 153.54 89.39
Total 364.04 324.32
(Rs. in million)
As atMarch 31, 2019
As atMarch 31, 2018
24. Other current liabilitiesAdvances from customers 101.73 103.40 Income received in advance - 0.76 Deferred government grant 0.84 6.57 Statutory liabilities 8.33 39.15 Total 110.90 149.88
25. Provisions (current)Provision for compensated absences 21.87 67.93 Total 21.87 67.93
26. Current tax liabilities (net)Provision for minimum alternate tax 74.75 -
74.75 -
For the year endedMarch 31, 2019
For the year endedMarch 31, 2018
27. Revenue from operationsSale of products (net)
Manufactured goods 957.28 1,818.35 Other operating revenue
Export benefits 4.54 21.38 Scrap sale 0.28 0.07
Total 962.10 1,839.80 Note: Effective from April 1, 2018, the Company has adopted Ind AS 115 “Revenue from Contracts with Customers” using the cumulative effect (comparatives for previous financial year have not been restated). The application of Ind AS 115 did not have any significant impact on recognition and measurement of revenue in the financial statements of the Company.

Panacea Biotec Ltd. 95
Notes to the financial statements for the year ended March 31, 2019
(Rs. in million)
For the year endedMarch 31, 2019
For the year endedMarch 31, 2018
Closing stockFinished goods 115.92 210.50 Work-in-progress 75.17 153.54
Total 191.09 364.04 Changes in inventories ((Increase)/Decrease)
Finished goods 94.58 24.43 Work-in-progress 78.37 (64.15)
Total 172.95 (39.72)
31. Employee benefits expenseSalary and wages 391.07 252.15 Contribution to provident and other funds (refer note 46) (1.35) 94.99 Staff welfare expenses 21.86 12.58 Total 411.58 359.72
32. Finance costsInterest expense 849.69 991.17 Other borrowing costs 196.64 41.11 Total 1,046.33 1,032.28
33. Depreciation and amortisation expenseDepreciation on tangible property, plant and equipment 317.12 323.03 Amortisation of intangible assets 13.18 13.91 Total 330.30 336.94
34. Other expenses Analytical testing and trial 13.05 26.06 Advertising and sales promotion 10.31 8.45 Allowance for expected credit loss and doubtful advances 43.46 79.37 Contract manufacturing 7.00 33.68 Consumption of stores and spares 89.51 51.76 Commission on sales 8.26 10.23 Directors' sitting fees 1.50 1.68 Freight and forwarding 22.33 37.90 Insurance 16.21 14.26 Legal and professional 51.25 36.25 Loss on sale of property, plant and equipment (net) - 0.04 Loss on foreign exchange transactions and translations (net) 151.79 60.22 Power and fuel 227.18 209.38 Printing and stationery 5.53 2.71 Postage and communication 5.95 5.13 Payment to auditors (refer note 36(d)) 2.93 1.75 Provision for service tax receivable - 5.73 Repair and maintenance :
Buildings 4.23 2.48 Plant and machinery 25.19 16.81 Others 21.72 8.30
Rent 10.95 5.11 Royalty - 0.16 Rates and taxes 5.83 11.33 Staff training and recruitment 2.21 1.70 Travelling and conveyance 19.35 15.90 Vehicle running and maintenance 12.21 7.90 Subscription 3.54 5.72 Bad debts and advances written off 18.46 - Provision for impairment of Investment 4.20 - Meetings and conferences 3.12 0.98 Intangibles assets under development provided /written off 147.78 - Property, plant and equipments written off 296.92 - Security charges 14.43 10.17 Office expenses 0.23 0.22 Miscellaneous 6.24 6.36 Total 1,252.87 677.74

Annual Report 2018-1996
Notes to the financial statements for the year ended March 31, 2019
(Rs. in million)
For the year endedMarch 31, 2019
For the year endedMarch 31, 2018
35. Exceptional itemsAdjustment on settlement of debts (refer note 55) 3,133.49 - Total 3,133.49 -
(Rs. in million)
For the year ended March 31, 2019
For the year ended March 31, 2018
a) Analysis of profit / (loss) from discontinued operationsProfit / (loss) for the year from discontinued operationsRevenue from operations 3,479.53 3,935.74 Other income 45.95 51.15 Total Income 3,525.48 3,986.89 ExpensesCost of Materials consumed 814.16 873.66 Purchases of stock-in-trade 91.93 183.49 Changes in inventories of finished goods, stock-in-trade and work-in-progress 128.35 32.10 Excise duty - 31.04 Employee benefits expense 1,007.86 1,007.66 Finance costs - -Depreciation and amortisation expense 206.80 233.53 Other expenses 1,436.66 912.49 Total expenses 3,685.76 3,273.97 Profit/(loss) before exceptional items and tax (160.28) 712.92 Exceptional items* 206.58 - Profit/(loss) before tax from discontinued operations 46.30 712.92 Tax expense - - Profit/(loss) after tax from discontinued operations 46.30 712.92
*During the year, the Company has received an amount of Rs.206.58 million as legal proceedings avoidance settlement fee, as per the terms of the Settlement Agreement entered into by the Company and its partner, Apotex, with Celgene Corporation, USA for settlement of disputes regarding patents covering Abraxane drug product and the Company's ANDA for paclitaxel protein bound particles for injectable suspension, 100mg/vial, a generic version of Abraxane.
b) Net cash flows attributable to the discontinued operationsNet cash (outlfows) / inflows from operating activities 1,378.92 -Net cash used in investing activities (3,801.45) -Net cash (outlfows) / inflows from financing activities - -Net cash (outlfows) / inflows (2,422.53) -
36. Discontinued Operationsi) Slump sale of Pharmaceutical business: On February 26, 2019, as part of the business reorganization, the Board of Directors have approved
transfer of pharmaceutical formulations business including related research and development activities and natural products extraction activities (referred to as ‘Pharma business’) to a recently incorporated wholly owned subsidiary, Panacea Biotec Pharma Limited (‘PBPL’), with an objective to segregate the different businesses of the Company to ensure smooth functioning of each business in the future. The divestment has been approved by the shareholders of the Company in their Extra-ordinary General Meeting held on March 25, 2019. Accordingly, the activities of the Pharma business of the Company, that are considered as disposal group, are presented as a discontinued operation in accordance with the provisions of Indian Accounting Standard 105 – ‘Non-current Assets Held for Sale and Discontinued Operations’. The assets / liabilities of the Pharma business amounting to Rs.4,195.73 million and Rs.2,183.39 million respectively are classified as ‘Assets classified as held for sale and discontinued operations’ and “Liabilities directly associated with assets classified as held for sale and discontinued operations” respectively. Subsequent to the year end, to implement the above divesture, the Company has executed a Business Transfer Agreement (‘BTA’) with PBPL to transfer Pharma business to PBPL, together with all tangible assets (except R&D center and natural products extraction facility at Lalru) and all intangible assets as specified in the BTA in relation to the pharmaceutical formulations business including pharmaceutical formulations facility at Baddi, Himachal Pradesh, as a going concern through slump sale.
ii) Demerger of Real estate business: On February 26, 2019 and May 30, 2019, the Board of directors have approved a scheme of arrangement for demerger of its real estate business comprising wholly owned subsidiary Radhika Heights Limited (‘RHL’) alongwith its step down subsidiaries and two real estate properties from PBL (‘Demerged Undertaking’) to its wholly-owned subsidiary (‘Transferee Company’). Upon implementation of the demerger scheme and completion of related compliances, the Transferee Company (Ravinder Heights Limited) shall issue one equity share of Re.1 each for each equity share held by the equity shareholders of the Company as on the record date fixed on that behalf and the said equity shares shall be listed at the BSE and NSE in compliance with the applicable SEBI Regulations. In accordance with the provisions of Indian Accounting Standard 105 – ‘Non-current Assets Held for Sale and Discontinued Operations’. The assets / liabilities of the real estate business have been disclosed under “Assets classified as held for sale and discontinued operations” / “Liabilities directly associated with assets classified as held for sale and discontinued operations” in the Standalone and Consolidated Statement of Assets and Liabilities.
iii) Financial performance and cash flows for the Pharmaceutical business and the Real estate business:

Panacea Biotec Ltd. 97
Notes to the financial statements for the year ended March 31, 2019
(Rs. in million)
As at March 31, 2019
As at March 31, 2018
c) Book value of assets and liabilities of discontinued operationsProperty, plant and equipment and intangible assets (including CWIP) 3,237.00 - Investments 3,385.85 - Other non-current financial assets 7.12 - Other non-current assets 257.73 - Inventories 335.00 - Trade receivable 619.09 - Cash and cash equivalents 19.37 - Other current financial assets 95.96 - Other current assets 119.40 - Total assets 8,076.52 - Non-current liabilities (Provisions) 202.07 - Other non-current liabilities 31.39 - Trade payables 1,836.04 - Other financial liabilities 55.95 - Other current liabilities 32.27 - Current liabilities - provisions 42.47 - Total liabilities 2,200.19 - Net assets 5,876.33 -
d) Payment to auditors*As auditor- Audit fee 2.60 2.60 - Limited review fee 2.40 2.40 In other capacity- Certification and other matters 1.42 0.19 - Reimbursement of out of pocket expenses 0.33 0.17
Total 6.75 5.36 * excludes service tax / goods and service tax
(Rs. in million)
For the year endedMarch 31, 2019
For the year endedMarch 31, 2018
37. Income taxIncome tax expense consists of the following :Current TaxMinimum alternative tax (MAT) for current year 74.75 - Deferred taxMinimum alternative tax (MAT) credit adjustment/(entitlement) 27.83 98.81 Deferred tax expense/(credit) 3.50 7.61 Total income tax 106.08 106.42 Reconciliation of the estimated tax expense at statutory income tax rate to income tax expense reported in the statement of profit and loss is as follows:Profit/(loss) before income taxes from continuing operations 325.48 (1,325.26)Profit/(loss) before income taxes from discontinued operations 46.30 712.92 Profit/(loss) before income taxes from continuing and discontinued operations 371.78 (612.34)At Company’s statutory income tax rate of 34.944% (March 31, 2018: 34.608%) 129.91 (211.92)Adjustments in respect of current income taxMinimum alternative tax (MAT) for current year 74.75 - Deferred tax not created on unused losses (126.41) 221.59 Minimum alternative tax (MAT) credit adjustment/(entitlement) 27.83 98.81 Others - (2.06)Total 106.08 106.42

Annual Report 2018-1998
Notes to the financial statements for the year ended March 31, 2019
(Rs. in million)Significant components of net deferred tax assets and liabilities for the year ended March 31, 2019 are as follow:
Opening balance Recognised/ reversed through
profit and loss
Recognised/ reversed
through other comprehensive
income
Closing balance
Deferred tax liabilities arising out of:Property, plant and equipment and intangible assets 1,762.80 (296.92) - 1,465.88 Capital expenditure on research and development 105.93 (97.49) - 8.44 Others 0.77 (0.77) - -
1,869.50 (395.18) - 1,474.32 Deferred tax assets arising out of:Expenditure allowed on payment basis 425.54 (18.48) - 407.06 Effect of unabsorbed business loss and depreciation 1,385.86 (334.10) - 1,051.76 Minimum alternative tax credit entitlement 219.87 (27.83) - 192.04 Others 58.10 (46.10) 3.50 15.50
2,089.37 (426.51) 3.50 1,666.36 Net deferred assets/(liabilities) 219.87 (31.33) 3.50 192.04
Significant components of net deferred tax assets and liabilities for the year ended March 31, 2018 are as follow: Opening balance Recognised/
reversed through profit and loss
Recognised/ reversed
through other comprehensive
income
Closing balance
Deferred tax assets/liabilities in relation to :Deferred tax liabilities arising out of:Property, plant and equipment and intangible assets 1,951.65 (188.85) - 1,762.80 Capital expenditure on research and development 74.36 31.57 - 105.93 Others 1.60 (0.83) - 0.77
2,027.61 (158.11) - 1,869.50 Deferred tax assets arising out of:Expenditure allowed on payment basis 467.60 (42.06) - 425.54 Effect of unabsorbed business loss and depreciation 1,511.54 (125.68) - 1,385.86 Minimum alternative tax credit entitlement 318.68 (98.81) - 219.87 Others 48.47 2.02 7.61 58.10
2,346.29 (264.53) 7.61 2,089.37 Net deferred tax assets/ (liabilities) 318.68 (106.42) 7.61 219.87 Tax losses No deferred tax asset has been recognised on these unutilized tax losses as there is no evidence that sufficient taxable profit will be available in future against which they can be utilised.
(Rs. in million)Financial year Year of
expiryAs at
March 31, 2019As at
March 31, 2018Business Loss
2011-12 2019-20 413.76 40.14 2012-13 2020-21 1,542.60 1,542.60 2013-14 2021-22 1,554.28 1,554.28 2015-16 2022-23 - 184.31 2016-17 2024-25 74.67 -2017-18 2025-26 124.49 -
Potential tax benefit 1,296.35 1,160.61 Unabsorbed Depreciation
2016-17 Unlimited - 239.18 Potential tax benefit - 83.58 Long term capital loss
2011-12 2019-20 - 254.21 2013-14 2021-22 - 253.90 2015-16 2023-24 - 2.90 2017-18 2025-26 608.79 -
Potential tax benefit 141.82 117.89 Short term capital loss
2017-18 2025-26 72.98 82.39 Potential tax benefit 25.50 28.51
Deferred tax assets have been recognised to the extent there are sufficient taxable temporary differences.

Panacea Biotec Ltd. 99
Notes to the financial statements for the year ended March 31, 2019
(Rs. in million)
As atMarch 31, 2019
As atMarch 31, 2018
39. Contingent liabilities and commitments (A) Contingent liabilities (to the extent non provided for)
Disputed demands/show cause notices under:Income tax cases (refer note (a) (i), (ii) and (iii) below) 3,462.86 3,462.86 Customs duty cases (refer note (b) below) 4.00 4.00 Service tax (refer note (c) and (d) below) - 72.60 Duty saved under export licenses - 76.95 Labour cases (in view of large number of cases, it is impracticable to disclose each case) 170.00 170.00 Sales Tax / VAT cases (refer note (e) below) 403.73 -
Minimum Alternate Tax (MAT)The Company has unused MAT credit which has been recognised on the basis that recovery is probable in the foreseeable future. MAT credit of Rs.165.41 million, Rs.165.71 million and Rs.69.92 million will expire on March 31, 2025, March 31, 2026 and March 31, 2034 respectively. (Rs. in million)
For the year endedMarch 31, 2019
For the year endedMarch 31, 2018
38. Earnings per shareProfit/(loss) attributable to shareholders from continuing operations 219.40 (1,431.68)Profit/(loss) attributable to shareholders from discontinued operations 46.30 712.92 Weighted average number of equity shares 61,250,746 61,250,746 Face value per equity share (in Rs.) 1.00 1.00 Profit/(loss) per equity share - Basic and diluted earnings per equity share from continuing operations (In Rs.) 3.58 (23.37) - Basic and diluted earnings per equity share from discontinued operations (In Rs.) 0.76 11.64 - Basic and diluted earnings per equity share from continuing and discontinued operations (In Rs.) 4.34 (11.73)
Notes :a) i) Includes income tax demand of Rs.162.22 million in respect to Assessment Year 2005-06. The Income Tax department had issued demand
based on certain grounds related to purchases made by the Company from an overseas vendor. The matter was decided in favour of the Company and the demand was cancelled by CIT (Appeals). However, the Income Tax Department has filed appeal before Income Tax Appellate Tribunal (ITAT) against the order of CIT (Appeals) which is pending at present. The Company believes that it has merit in these cases, hence no provision is required.
ii) A search operation was conducted by the Income Tax Department in the premises of the Company in January 2012 and hence the Company had re-filed the income tax returns for the Assessment Year 2006-07 to 2012-13. During the year ended March 31, 2015, the Income Tax department completed the assessment of the said years, disallowed certain expenses and issued demand of Rs.3,294.90 million (including interest) on various grounds. The Company preferred appeals before the CIT (Appeals) against the orders of the Income Tax department. The appeals were decided in favour of the Company and the demand was cancelled. However, CIT (Appeals) has made certain disallowances with respect to Assessment Year 2010-11 and 2011-12 against which the Company has filed appeals before the ITAT. The Income Tax Department has also filed appeals before ITAT against the orders of CIT (Appeals). The appeals before ITAT are pending at present. Based on legal advice, the Company believes that it has merits in these cases, hence no provision is required.
iii) The income tax department issued a demand of Rs.5.74 million in respect of Assessment Year 2009-10 on the Company due to non-deduction of withholding tax on payment made to a non-resident person towards purchase of immovable property. The Company had filed an appeal before CIT (Appeals) against the order of department but the CIT (Appeals) gave decision in favour of department. The Company has filed an appeal before Income Tax Appellate Tribunal (ITAT) against the order of CIT (Appeals) which is pending at present. The Company believes that it has merit in the case, hence no provision is required.
b) In respect of custom duty demand, the Assessing Officer levied custom duty on certain exempted items imported by the Company. The Company has deposited the entire amount of demand under protest amounting to Rs.4.00 million and the matter is pending before the Customs, Excise and Service Tax Appellate Tribunal (“CESTAT”). The Company believes that it has merit in its case, hence no provision is required.
c) In respect of service tax demands for Financial Year 2003-04 to 2011-12, the Assessing Officer levied service tax on foreign services rendered and delivered outside India by the Company and certain other services on which there was no liability to pay service tax. The cases are currently pending with CESTAT. The CESTAT remanded the matter back to the Commissioner of Service Tax, Delhi for denovo adjudication. Final orders from the CESTAT have been received.
d) In respect of service tax demands for Financial Year 2008-09 to 2010-11, service tax department has disallowed CENVAT Credit of input services availed and distributed by the Company as input service distributor. The hon'ble CESTAT has decided the case in favour of the Company vide its order dated January 22, 2019.
e) In respect of sales tax / VAT demands for Ahmedabad, Delhi, Lucknow, Bangaluru, Patna, Ranchi and Pune, the department has disallowed certain credit/notes and non submission of statutory forms etc. The Company believes that it has merit in these cases and hence no provision is required.
f ) The Company had manufactured and offered supply of certain vaccines which were manufactured against the confirmed order received from the Ministry of Health and Family Welfare (MOH&FW). Some quantities of vaccines were supplied during December 2011, the balance could not be supplied in view of disputes with respect to delivery dates and in the meantime the stock of such vaccines amounting to Rs.74.1 million expired. Further, the Company had also received advance market commitment (AMC) amounting to Rs.100.00 million against these vaccines. The refund of the advance so received (after adjusting the amount receivable against the vaccines already supplied) was demanded back by

Annual Report 2018-19100
Notes to the financial statements for the year ended March 31, 2019
MOH&FW along with interest on account of non-supply of balance quantities of vaccines. In view of above disputes, the Company obtained a stay order from the Hon’ble Delhi High Court against recovery of said amount, till the disputes are finally resolved through arbitration. The Arbitration Award has been pronounced in favour of the Company on March 14, 2019.
(B) Capital and other commitmentsa) Estimated amount of contracts remaining to be executed on capital account, net of advances and not provided in the books are as follows:
(Rs. in million)Particulars As at
March 31, 2019As at
March 31, 2018Property, plant and equipment 36.75 5.78 b) Other commitments :
i) Export commitments of Rs. Nil (March 31, 2018: Rs.488.91 million) under advance licenses schemes and obligation outstanding against EPCG licenses.
ii) The Company has received financial assistance in the form of soft loan under various projects from Department of Biotechnology, Department of Science & Technology and Technology Development Board respectively. As per the terms of related agreements, the Company is also required to incur expenditure in the form of monetary contribution to the relevant projects. The amount of commitment is not quantifiable.
iii) Refer note 40 for commitments relating to lease arrangements.
40. LeasesCompany as a lesseeOperating leasesThe Company has taken various residential, office and godown premises under operating lease agreements. These are generally cancellable and are renewable by mutual consent on mutually agreed terms. There are no sub-lease payments expected to be received under non-cancellable subleases at the balance sheet date and no restriction is imposed by lease arrangements. (Rs. in million)Particulars For the year ended
March 31, 2019 For the year ended
March 31, 2018Lease payments for the year recognised in the statement of profit and loss* 17.55 18.42 *includes Rs.6.60 million (March 31, 2018: Rs.13.31 million) pertaining to discontinued operationsCompany as a lessorOperating leasesThe Company had earlier leased out certain assets situated at Lalru, Punjab on operating lease to PanEra Biotec Private Limited. The said lease deed has been terminated w.e.f. May 25, 2018.There is no uncollectible minimum lease payments receivable at the balance sheet date.Lease income for the year recognised in the statement of profit and loss* 7.02 35.29 *includes Rs.1.05 million (March 31, 2018: Rs.1.03 million) pertaining to discontinued operationsFor assets given under operating lease agreements:i) The Company had earlier leased out certain assets situated at Lalru, Punjab on operating lease to PanEra Biotec Private Limited, the summary of
which is as under: (Rs. in million)Particulars Gross block Accumulated depreciation
As at March 31, 2019
As at March 31, 2018
As at March 31, 2019
As at March 31, 2018
Building - 341.10 - 98.60 Furniture and fittings - 41.18 - 36.21 Office equipment - 21.65 - 19.55 Plant and equipment - 2,215.11 - 1,308.59 Computer equipment - 13.26 - 12.59 Total - 2,632.30 - 1,475.54
ii) The Depreciation expense for such assets is recorded in the Statement of Profit and Loss as follows: (Rs. in million)
Particulars For the year ended March 31, 2019
For the year ended March 31, 2018
Building - 10.68 Furniture and fittings - 1.85 Office equipment - 0.06 Plant and equipment - 135.32 Computer equipment - 0.00 Total - 147.91 The lease agreement has been terminated w.e.f. May 25, 2018

Panacea Biotec Ltd. 101
41. (A) Details of dues to micro, small and medium enterprises as defined under the Micro Small and Medium Enterprises Development Act, 2006 [“MSMED Act”]:
(Rs. in million)S. no.
Particulars As at March 31, 2019 As at March 31, 2018 Principal Interest Principal Interest
i) The principal amount and the interest due thereon remaining unpaid to any supplier as at the end of each accounting year
33.83 9.33* 34.71 6.15*
ii) The amount of interest paid by the buyer in terms of Section 16 of the MSMED Act along with the amounts of the payment made to the supplier beyond the appointed day during each accounting year
69.68 - 66.92 -
iii) The amount of interest due and payable for the period of delay in making payment (which have been paid but beyond the appointed day during the year) but without adding the interest specified under MSMED Act
- - - -
iv) The amount of interest accrued and remaining unpaid at the end of each accounting year
- 9.33* - 6.15*
v) The amount of further interest remaining due and payable even in the succeeding years, until such date when the interest dues as above are actually paid to the small enterprise for the purpose of disallowance as a deductible expenditure under Section 23 of the MSMED Act
- - - -
Note: *Included in “trade payable” in note 22. Principal includes Rs.17.66 million as at March 31, 2019 relating to discontinued operations Interest includes Rs.6.62 million as at March 31, 2019 relating to discontinued operations
(B) Details of loans and advances, in the ordinary course of business, to subsidiaries, associates and companies in which directors are interested (as required under Regulation 34(3) of the SEBI (Listing Obligations and Disclosure Requirements) Regulations, 2015):
(Rs. in million)Particulars As at
March 31, 2019 As at
March 31, 2018 a) Loans to wholly owned subsidiaries (including accrued interest)
i) Rees Investments Limited 585.16 585.16 ii) Panacea Biotec (International) SA 74.69 67.23 iii) Panacea Biotec Germany GmbH 246.50 221.87 Total 906.35 874.26
b) Maximum amount due at any time during the yeari) Rees Investments Limited 585.16 585.16 ii) Panacea Biotec (International) SA 74.69 67.23 iii) Panacea Biotec Germany GmbH 246.50 221.87 Total 906.35 874.26
c) Advance paid against purchase of materials to subsidiariesPanEra Biotec Private Limited 91.68 92.13
d) Allowance for doubtful advances on above loan and interest receivable 906.35 874.26
Notes to the financial statements for the year ended March 31, 2019
42. Related Party DisclosuresAs per Ind AS 24, the disclosure of transactions with related parties are as given below:A. Names of related parties and related party relationships
i) Parties where control exists Subsidiaries: • Radhika Heights Limited (“RHL”) (Wholly-owned subsidiary (“WOS”)
• Ravinder Heights Limited (“RVHL”) (Wholly-owned subsidiary (“WOS”) w.e.f. April 15, 2019)• Cabana Construction Private Limited (Indirect WOS (“IWOS”) through RHL)• Cabana Structures Limited (IWOS through RHL)• Nirmala Buildwell Private Limited (IWOS through RHL)• Nirmala Organic Farms & Resorts Private Limited (IWOS through RHL)• Radicura Infra Limited (IWOS through RHL)• Sunanda Infra Limited (IWOS through RHL)• Rees Investments Limited (“Rees”), Island of Guernsey (WOS) (liquidated on May 23, 2019)• Panacea Biotec (International) SA (“PBS”), Switzerland (WOS)• Panacea Biotec Germany GmbH (“PBGG”), Germany (IWOS through PBS)• Panacea Biotec Pharma Limited ("PBPL") (WOS) (w.e.f. March 22, 2019)• Meyten Realtech Pvt. Ltd. (WOS) (w.e.f. April 12, 2019)• NewRise Healthcare Private Limited (“NewRise”), (Subsidiary until April 18, 2017, WOS during April 19 and April 20, 2017) • Adveta Power Private Limited (“Adveta”)*• PanEra Biotec Private Limited (“PanEra”)** considered as subsidiary for the purpose of consolidation as per Ind AS 110.

Annual Report 2018-19102
ii) Other related parties:a) Joint Ventures: • Chiron Panacea Vaccines Private Limited (“CPV”) (Under liquidation)b) Key Management Personnel:
• Mr. Soshil Kumar Jain - Chairman and Whole-time Director• Mr. Ravinder Jain - Managing Director (upto February 21, 2018)• Dr. Rajesh Jain - Managing Director (Joint Managing Director upto March 11, 2018)• Mr. Sandeep Jain - Joint Managing Director• Mrs. Sunanda Jain - Whole-time Director (w.e.f. March 12, 2018)• Mr. Sumit Jain - Whole-time Director designated as Director Operations & Projects• Mr. Ankesh Jain - Whole-time Director designated as Director Sales & Marketing• Mr. Vinod Goel - Group CFO and Head Legal & Company Secretary• Mr. Devender Gupta - Chief Financial Officer & Head Information Technology• Mr. R. L. Narasimhan - Non-Executive Independent Director• Mr. N. N. Khamitkar - Non-Executive Independent Director• Mr. K. M. Lal - Non-Executive Independent Director• Mr. O. P. Kelkar - Non-Executive Independent Director (upto July 21, 2018)• Mrs. Manjula Upadhyay - Non-Executive Independent Director• Mr. Mukul Gupta - Non-Executive Independent Director• Mr. Ashwini Luthra - Non-Executive Independent Director (w.e.f. October 18, 2018)• Mr. Bhupinder Singh - Non-Executive Independent Director (w.e.f. April 08, 2019)• Mr. Nithin Krishna Kaimal - Non-Executive Director (w.e.f. April 08, 2019)
c) Relatives of Key Management Personnel having transactions with the Company:• Mr. Ashwani Jain, son-in-law of Mr. Soshil Kumar Jain• Mr. Shagun Jain, son-in-law of Mrs. Sunanda Jain• Mrs. Radhika Jain, daughter of Mrs. Sunanda Jain• Mrs. Shilpy Jain, wife of Mr. Sumit Jain and daaughter-in-law of Mrs. Sunanda Jain• Mr. Harshet Jain, son of Dr. Rajesh Jain and brother of Mr. Ankesh Jain
d) Enterprises over which Person(s) (having control or significant influence over the Company / Key management Personnel(s), along with their relatives) are able to exercise significant influence:• Neophar Alipro Limited (“Neophar”)• Lakshmi & Manager Holdings Limited (“LMH”),• Trinidhi Finance Private Limited (“Trinidhi”) subsidiary of LMH• Best General Insurance Company Limited (subsidiary of LMH)• First Lucre Partnership Co. (holding shares in the Company)• White Pigeon Estate Private Limited• OKI Estate Private Limited
Notes to the financial statements for the year ended March 31, 2019
B. Transactions with Subsidiaries and Joint Ventures Companies:(Rs. in million)
S. No. Particulars
Subsidiaries Joint VenturesMarch 31, 2019 March 31, 2018 March 31, 2019 March 31, 2018
I Transactions made during the year:1 Purchase of raw materials
PanEra 221.42 202.43 2 Sale of goods/material
PanEra 0.18 2.48 PBGG 9.46 2.78
3 Recovery of expensesPanEra 0.74 -
4 Reimbursement of expensesPanEra 6.74 17.57
5 Rent paid/ providedRHL 6.91 7.86
6 Rent receivedPanEra 4.20 32.35 CPV 0.36 0.36 Adveta 0.06 - RHL 0.52 0.52
7 Interest incomeRees - 49.18 PBS 7.46 5.65 PBGG 24.63 18.64
8 Interest expenses on loansRHL 27.69 27.65

Panacea Biotec Ltd. 103
(Rs. in million)
S. No. Particulars
Subsidiaries Joint VenturesMarch 31, 2019 March 31, 2018 March 31, 2019 March 31, 2018
9 Provision for impairment of investmentPanEra 4.20 - PBS 34.36 -
II Year end balances:1 Investments
RHL 3,385.65 3,385.65 Rees 0.00 0.00 PBS (refer note 56) 34.36 34.36 PanEra (refer note 3(ii) and 40) 4.20 4.20 Adveta 0.90 0.90 PBPL 1.00 - CPV 22.96 22.96
2 Outstanding loan receivableRees 585.16 535.98 PBS 67.23 61.58 PBGG 221.87 203.23
3 Outstanding loan payableRHL (refer note 18(C)(5) and note 57) 421.83 289.36
4 Interest accrued receivableRees - 49.18 PBS 7.46 5.65 PBGG 24.63 18.64
5 Interest accrued payableRHL - 107.54
6 Allowance for doubtful loans (including accrued interest)Rees 585.16 585.16 PBS 74.69 67.23 PBGG 246.50 221.87
7 Outstanding receivableRHL - 1.98 PBGG 6.62 21.85 PanEra 43.68 77.69 Adveta 0.11 - CPV 0.03 -
8 Outstanding loan and advances, (net)PanEra 91.68 92.13
9 Provision for impairment in subsidiaryPanEra 4.20 - PBS 34.36 -
10 Outstanding payablePanEra 48.01 - PBGG 17.55 17.55 RHL 25.53 20.61
Notes to the financial statements for the year ended March 31, 2019
C. Transactions with Key Management Personnel, their relatives and Enterprises over which Person(s) (having control or significant influence over the Company / Key management personnel(s), along with their relatives) are able to exercise significant influence: (Rs. in million)
S. No.
Particulars Key Management Personnel
Relatives of Key Management
Personnel
Enterprises over which Person(s) (having control or
significant influence over the Company / Key management personnel(s), along with their relatives) are able to exercise
significant influenceMarch 31,
2019March 31,
2018March 31,
2019March 31,
2018March 31,
2019March 31,
2018I) Transactions made during the year:
1 Short-term employee benefitsMr. Soshil Kumar Jain * 11.19 10.70 Mr. Ravinder Jain* - 35.83 Mrs. Sunanda Jain 5.80 0.31 Dr. Rajesh Jain* 7.30 7.25 Mr. Sandeep Jain* 6.70 6.60 Mr. Sumit Jain* 4.18 4.11

Annual Report 2018-19104
(Rs. in million)S. No.
Particulars Key Management Personnel
Relatives of Key Management
Personnel
Enterprises over which Person(s) (having control or
significant influence over the Company / Key management personnel(s), along with their relatives) are able to exercise
significant influenceMarch 31,
2019March 31,
2018March 31,
2019March 31,
2018March 31,
2019March 31,
2018Mr. Ankesh Jain* 2.42 2.30 Mr. Vinod Goel 5.62 5.10 Mr. Devender Gupta 4.37 3.98 Mr. Shagun Jain - 2.06 Mr. Ashwani Jain 3.03 3.03 Mrs. Shilpy Jain 0.35 0.55 Mrs. Radhika Jain 2.14 1.37 Mr. Harshet Jain 0.35 0.60
2 Post-employment benefitsMr. Soshil Kumar Jain * 16.23 23.65 Dr. Rajesh Jain* 10.43 12.95 Mr. Sandeep Jain* 9.64 12.49 Mr. Sumit Jain* 2.95 3.19 Mr. Ankesh Jain* 0.81 0.44 Mr. Vinod Goel 1.33 1.42 Mr. Devender Gupta 0.76 0.53 Mr. Shagun Jain 0.57 0.53 Mr. Ashwani Jain 1.75 1.62 Mrs. Shilpy Jain - 0.11 Mrs. Radhika Jain 0.50 0.29 Mrs. Sunanda Jain 0.24 0.01 Mr. Harshet Jain - -
3 Fee for attending board/committee meetingsMr. R. L. Narasimhan 0.33 0.37 Mr. N. N. Khamitkar 0.31 0.28 Mr. K. M. Lal 0.27 0.37 Mr. O. P. Kelkar - 0.25 Mrs. Manjula Upadhyay 0.25 0.25 Mr. Mukul Gupta 0.25 0.25 Mr. Ashwini Luthra 0.10 - Mr. Bhupinder Singh - -Mr. Nithin Krishna Kaimal - -
4 Rent receivedNeophar 0.18 0.18 Trinidhi 0.22 0.22
5 Interest expensesMr. Soshil Kumar Jain 9.43 9.43 - Mr. Ravinder Jain - 1.15 - Dr. Rajesh Jain 8.88 5.51 - Mrs. Sunanda Jain 1.15 - Trinidhi 0.29 0.29
6 Consultancy Expenses: Mrs. Shilpy Jain 0.48 - 7 Interest converted into loan:
Mr. Soshil Kumar Jain 20.45 - Dr. Rajesh Jain 17.39 - Mrs. Sunanda Jain 8.84 - Trinidhi 1.45 -
8 Loan received: Dr. Rajesh Jain 8.00 40.00 9 Reversal of excess remuneration paid
Mr. Soshil Kumar Jain 11.19 10.70 Mr. Ravinder Jain - 10.22 Mrs. Sunanda Jain 5.80 0.45 Dr. Rajesh Jain 7.30 7.25 Mr. Sandeep Jain 6.70 6.60 Mr. Sumit Jain 4.18 4.11 Mr. Ankesh Jain 2.42 2.30
Notes to the financial statements for the year ended March 31, 2019

Panacea Biotec Ltd. 105
S. No.
Particulars Key Management Personnel
Relatives of Key Management
Personnel
Enterprises over which Person(s) (having control or
significant influence over the Company / Key management personnel(s), along with their relatives) are able to exercise
significant influenceMarch 31,
2019March 31,
2018March 31,
2019March 31,
2018March 31,
2019March 31,
2018II) Year end balances:
1 Loan payable (refer note 18(C)(5))Mr. Soshil Kumar Jain 125.20 104.75 Dr. Rajesh Jain 120.02 94.63 Mrs. Sunanda Jain# 21.57 12.73 Trinidhi 3.38 3.06
2 Interest/Expense payableMr. Soshil Kumar Jain - 11.97 Dr. Rajesh Jain - 9.40 Mrs. Sunanda Jain# - 7.81 Mrs. Shilpy Jain 0.05 - Trinidhi - 1.19
3 Outstanding receivableTrinidhi - - - 0.90
4 Remuneration PayableMr. Soshil Kumar Jain* 1.83 0.89 Dr. Rajesh Jain* 1.23 0.60 Mr. Sandeep Jain* 1.13 0.55 Mr. Sumit Jain* 0.81 0.34 Mr. Ankesh Jain* 0.38 0.19 Mr. Vinod Goel 0.50 0.43 Mr. Devender Gupta 0.76 0.33 Mrs. Sunanda Jain 1.04 0.45 Mr. Shagun Jain - 0.17 Mr. Ashwani Jain 0.58 0.25 Mrs. Shilpy Jain 0.25 0.05 Mrs. Radhika Jain 0.29 0.11 Mr. Harshet Jain - 0.05
* Refer note 53# The outstanding loan payable along with interest payable thereon to late Mr. Ravinder Jain is transferred to his wife Mrs. Sunanda Jain.Note: In respect of personal guarantees given by promoter directors, refer note 18 and 21. The above transactions are in the ordinary course of business.
43. Assets mortgaged/ hypothecated as security for borrowings are as under: (Rs. in million)Particulars Note As at March 31, 2019 As at March 31, 2018Non Current
Property, plant and equipment 2.1 4,948.72 8,865.60 Capital work in progress 2.2 29.52 47.57 Intangible assets 2.3 15.66 43.68 Intangible assets under development 2.4 1.52 324.04 Financial assetsLoans 4 6.34 9.93 Other financial assets 5 8.86 2.51 Other non-current assets 8 21.03 222.00
Total non-current assets 5,031.65 9,515.33 Current Inventories 9 425.05 1,490.95
Financial assetsTrade receivables 10 251.95 1,422.66 Cash and cash equivalents 11 49.58 65.24 Other bank balances 12 28.95 52.56
Loans 13 162.02 149.87 Others financial assets 14 8.77 51.71
Non financial assetsOther current assets 15 158.23 303.40 Total current assets 1,084.55 3,536.39 Assets classified as held for sale and discontinued operations 36 4,690.67 - Total assets mortgaged/ hypothecated as security 10,806.87 13,051.72
Notes to the financial statements for the year ended March 31, 2019
(Rs. in million)

Annual Report 2018-19106
44. Segment information The Company has determined following reportable segments based on the information reviewed by the Company’s management: a. Vaccines b. Formulations c. Research and Development
(A) Information about reportable segments (Rs. in million)Particulars Vaccines Formulations Research and
DevelopmentTotal
For the year ended
March 31, 2019
For the year ended
March 31, 2018
For the year ended
March 31, 2019
For the year ended
March 31, 2018
For the year ended
March 31, 2019
For the year ended
March 31, 2018
For the year ended
March 31, 2019
For the year ended
March 31, 2018
Segment revenue 962.10 1,839.80 3,479.41 3,839.14 0.12 96.60 4,441.63 5,775.54 Other income 5.88 34.79 18.41 49.87 7.20 1.38 31.49 86.04 Total Income 967.98 1,874.59 3,497.82 3,889.01 7.32 97.98 4,473.12 5,861.58 Less: Income from discontinued operations - - 3,497.82 3,889.01 2.92 97.88 3,500.74 3,986.89 Total Income from continuing operations 967.98 1,874.59 - - 4.40 0.10 972.38 1,874.69 Segment result from continuing operations (1,235.31) 147.14 - - (251.42) (144.50) (1,486.73) 2.64 Unallocated corporate expenses 299.41 385.74 Operating profit/ (loss) (1,786.14) (383.10)Less: Interest and finance charges 1,046.33 1,032.28 Add: Unallocated exceptional items gain/ (loss) 3,133.49 - Add: Other income 24.46 90.12 Profit/(loss) before tax from continuing operations 325.48 (1,325.26)Less: Tax expense 106.08 106.42 Profit/(loss) after tax from continuing operations 219.40 (1,431.68)Profit/(loss) after tax from discontinued operations 46.30 712.92 Profit/(loss) for the year 265.70 (718.76)Other comprehensive income/(loss) (6.51) (14.16)Total other comprehensive income 259.19 (732.92)
Other Information As at March 31,
2019
As at March 31,
2018
As at March 31,
2019
As at March 31,
2018
As at March 31,
2019
As at March 31,
2018
As at March 31,
2019
As at March 31,
2018Segment assets 4,381.31 5,311.79 2,830.44 4,189.40 1,658.36 2,108.40 8,870.11 11,609.59 Transferred to discontinued operations - - 2,830.44 - 1,285.29 - 4,115.73 - Total 4,381.31 5,311.79 - 4,189.40 373.07 2,108.40 4,754.38 11,609.59 Unallocated corporate assets 1,589.45 5,125.29 Total assets 6,342.83 16,734.88 Segment liabilities 692.59 711.46 1,924.99 1,649.95 225.12 257.30 2,842.70 2,618.71 Transferred to discontinued operations - - 1,924.99 - 201.07 - 2,126.06 - Total 692.59 711.46 - 1,649.95 24.05 257.30 716.64 2,618.71 Unallocated corporate liabilities 7,318.80 10,235.20 Total liabilities 692.59 711.46 3,849.98 1,649.95 426.19 257.30 8,035.44 12,853.91
Capital expenditure:Tangible assets 2.27 30.51 6.89 10.30 0.27 0.18 9.43 40.99 Intangible assets - - - 0.79 39.23 111.35 39.23 112.14 Depreciation expense* 270.45 286.06 139.92 149.38 98.11 96.73 508.48 532.17 Amortisation expense* - 0.01 - 0.77 - 11.64 - 12.42 Total 272.72 316.58 146.81 161.24 137.61 219.90 557.14 697.72 Total expenditure for discontinued operations - - 146.81 161.24 87.12 79.65 233.93 240.89
* Note: Excluding unallocated depreciation and amortisation.
(B) Additional information by geographiesa) Revenue as per geographical markets:
Segment Domestic OverseasFor the year ended
March 31, 2019For the year ended
March 31, 2018For the year ended
March 31, 2019For the year ended
March 31, 2018Vaccines 791.40 1,180.27 170.70 659.53 Formulations 2,584.52 2,915.61 894.88 923.54 Research and Development 0.12 4.37 - 92.23 Total 3,376.04 4,100.25 1,065.58 1,675.30 Revenue from discontinued operations 2,584.64 - 894.88 -Total Revenue from continuing operations 791.40 4,100.25 170.70 1,675.30
Notes to the financial statements for the year ended March 31, 2019

Panacea Biotec Ltd. 107
c) Revenue from customers contributing more than 10% of revenue:Segment Domestic Overseas
For the year ended March 31, 2019
For the year ended March 31, 2018
For the year ended March 31, 2019
For the year ended March 31, 2018
Vaccines - - - -Pharma - - - -R&D - - - -Total - - - -
d) All other assets are located in India therefore separate disclosure for other assets is not presented.
45. Research and development expenditure Research and development expenditure incurred by the Company during the financial year are mentioned below:
(Rs. in million)Particulars For the year ended
March 31, 2019For the year ended
March 31, 2018Revenue expenditure (refer note (i) below)
Material consumed 14.52 5.25 Employee benefits expense 149.76 205.20 Other expenses 400.51 187.78 Depreciation and amortisation expense 98.10 108.37
Capital expenditure (refer note (ii) below) 39.50 111.53 Total 702.39 618.13 Notes: i) Includes revenue expenditure of Rs.407.06 million (March 2018: Rs.362.00 million) pertaining to discontinued operations ii) Includes capital expenditure of Rs.23.32 million (March 2018: Rs.99.36 million) pertaining to discontinued operations
46. Employee benefits obligations(A) Defined benefit plan
Risks associated with plan provisionsValuations are based on certain assumptions, which are dynamic in nature and vary over time. As such Company is exposed to various risks as follows:Salary Risk Actual salary increases will increase the plan’s liability. Increase in salary increase rate assumption in future
valuations will also increase the liability.Discount Rate Risk Reduction in discount rate in subsequent valuations can increase the plan’s liability.Mortality and disability Risk Death and disability cases proving lower or higher than assumed in the valuation can impact the liabilities.Withdrawals Risk Actual withdrawals proving higher or lower than assumed withdrawals and change of withdrawal rates at
subsequent valuations can impact plan’s liability.Gratuity (funded)The Company provides for gratuity for employees in India as per the Payment of Gratuity Act, 1972. Employees who are in continuous service for a period of 5 years are eligible for gratuity. The amount of gratuity payable on retirement/termination is the employees last drawn basic salary per month computed proportionately for 15 days salary multiplied for the number of years of service. For the funded plan the group makes contributions to recognised funds in India. The group does not fully fund the liability and maintains a target level of funding to be maintained over a period of time based on estimations of expected gratuity payments.The weighted average duration of the defined benefit obligation as at March 31, 2019 is 14.51 years (March 31, 2018: 10.85 years)The amounts recognised in the balance sheet and the movements in the net defined benefit obligation over the year are as follows:
(Rs. in million) As at March 31,
2019 As at March 31,
2018 a Reconciliation of present value of defined benefit obligation and the fair value of plan assets
Present value of defined benefit obligation as at the end of the year 231.76 213.51 Fair value of plan assets as at the end of the year 38.06 66.05 Net liability position recognised in balance sheet 193.70 147.46
Notes to the financial statements for the year ended March 31, 2019
b) Assets (net) as per geographical markets:Segment Domestic Overseas
As at March 31, 2019
As at March 31, 2018
As at March 31, 2019
As at March 31, 2018
Vaccines 4,370.02 5,311.65 11.29 0.14 Formulations 2,411.44 3,692.89 419.00 496.51 Research and Development 1,656.70 2,106.37 1.66 2.03 Unallocated 5,550.21 5,125.29 - - Total 13,988.37 16,236.20 431.95 498.68 Assets transferred to discontinued operations 7,655.86 - 420.66 - Total 6,332.51 16,236.20 11.29 498.68

Annual Report 2018-19108
d Amount recognised in the statement of profit and loss Current service cost 21.34 16.37 Past service cost - 31.38 Net interest cost 11.21 5.44 Amount recognised in the statement of profit and loss 32.55 53.19
e Change in plan assetsFair value of the plan assets at the beginning of the year 66.05 75.88 Actual return on plan assets 4.17 5.22 Employer contribution 3.81 - Fund management charges (1.14) - Benefits paid for eligible employees (34.83) (15.05)Fair value of the plan assets at the end of the year 38.06 66.05
f Key categories of plan assets as a percentage of the fair value of total plan assets for gratuityInvestment with insurer 100% 100%
g Other comprehensive incomeActuarial loss on arising from change in demographic assumption (6.54) 1.96 Actuarial (gain)/loss on arising from change in financial assumption 46.06 (1.75)Actuarial loss on arising from experience adjustment (30.34) 21.08 Actuarial loss on arising on plan assets 0.84 0.48 Total actuarial loss for the year 10.02 21.77
h Actuarial assumptions Discount rate 7.66% 7.60%Future salary increase 8.00% 5.00%
i Demographic AssumptionRetirement age (years) 60/75 58/75 Mortality rates inclusive of provision for disability 100% 100%Ages Withdrawal Rate (%)Up to 30 years 10.00% 10.00%From 31 to 44 years 5.00% 5.00%Above 44 years 1.00% 1.00%
j Sensitivity analysis for gratuity liabilityImpact of the change in discount ratea) Impact due to increase of 0.50% (19.28) (8.26)b) Impact due to decrease of 0.50% 4.43 8.94 Impact of the change in salary increasea) Impact due to increase of 0.50% 2.67 8.25 b) Impact due to decrease of 0.50% (17.84) (7.74)
k Maturity profile of defined benefit obligationApril 2018 to March 2019 - 48.62 April 2019 to March 2020 31.12 11.20 April 2020 to March 2021 6.28 5.68 April 2021 to March 2022 6.02 8.16 April 2022 to March 2023 12.85 7.13 April 2023 to March 2024 15.37 6.39 April 2024 to March 2025 5.38 - April 2025 onwards 154.74 118.72
Notes to the financial statements for the year ended March 31, 2019
(Rs. in million) As at March 31,
2019 As at March 31,
2018 b Changes in defined benefit obligation
Present value of defined benefit obligation as at the start of the year 213.51 148.39 Acquisition adyjustment 6.84 - Interest cost 16.23 11.13 Current service cost 21.34 16.37 Past service cost - 31.38 Benefits paid for eligible employees (35.34) (15.05)Actuarial loss 9.18 21.29 Present value of defined benefit obligation as at the end of the year 231.76 213.51
c Net interest costInterest cost on defined benefit obligation 16.23 11.13 Interest income on plan assets 5.02 5.69 Net interest cost 11.21 5.44
(B) Defined contribution plansThe Company’s contribution to state governed provident fund scheme, employee state insurance scheme and Labour Welfare Fund scheme are considered as defined contribution plans. The contribution under the schemes is recognised as an expense, when an employee renders the related service. There are no other obligations other than the contribution payable to the respective funds.

Panacea Biotec Ltd. 109
47. On account of continuous losses of the Company, certain delays and defaults, in repayment of loan instalments (including accrued interest thereon) on borrowings have occurred during the year, which are described below. (Rs. in million)
Particulars Amount of total installment*
Due Date Paid On
A. Borrowings from banks (refer note (i) below)Bank of India - Foreign Currency Term Loan ("FCTL") 576.25 30-Sep-17 9-Apr-19Bank of India - FCTL 576.25 30-Sep-18 9-Apr-19Indian Overseas Bank- Term Loan 15.00 30-Jun-18 7-Jul-18Indian Overseas Bank- Term Loan 15.00 30-Sep-18 9-Apr-19Indian Overseas Bank- Term Loan 15.00 31-Dec-18 9-Apr-19Indian Overseas Bank- Term Loan 15.00 31-Mar-19 9-Apr-19State Bank of India- Term Loan - I 5.98 30-Jun-18 18-Jul-18State Bank of India- Term Loan - I 12.19 30-Sep-18 9-Apr-19State Bank of India- Term Loan - I 12.19 31-Dec-18 9-Apr-19State Bank of India- Term Loan - I 12.19 31-Mar-19 9-Apr-19State Bank of India- Term Loan - II 11.64 30-Jun-18 18-Jul-18State Bank of India- Term Loan - II 24.00 30-Sep-18 9-Apr-19State Bank of India- Term Loan - II 24.00 31-Dec-18 9-Apr-19State Bank of India- Term Loan - II 24.00 31-Mar-19 9-Apr-19Canara Bank- Working Capital Term Loan ("WCTL") 0.55 30-Sep-18 9-Apr-19Canara Bank- WCTL 0.55 31-Dec-18 9-Apr-19Canara Bank- WCTL 0.55 31-Mar-19 9-Apr-19IDBI Bank - WCTL 0.26 30-Jun-18 6-Jul-18IDBI Bank - WCTL 0.26 30-Sep-18 28-Dec-18IDBI Bank - WCTL 0.26 31-Dec-18 2-Jan-19State Bank of India- WCTL 8.58 30-Sep-18 9-Apr-19State Bank of India- WCTL 8.58 31-Dec-18 9-Apr-19State Bank of India- WCTL 8.58 31-Mar-19 9-Apr-19Bank of India- WCTL 0.61 31-Mar-18 5-Apr-18Bank of India- WCTL 0.91 30-Sep-18 9-Apr-19Bank of India- WCTL 0.91 31-Dec-18 9-Apr-19Bank of India- WCTL 0.91 31-Mar-19 9-Apr-19Union Bank of India- WCTL 0.67 30-Sep-18 9-Apr-19Union Bank of India- WCTL 0.67 31-Dec-18 9-Apr-19Union Bank of India- WCTL 0.67 31-Mar-19 9-Apr-19Indian Overseas Bank- WCTL 0.70 30-Sep-18 9-Apr-19Indian Overseas Bank- WCTL 0.70 31-Dec-18 9-Apr-19Indian Overseas Bank- WCTL 0.70 31-Mar-19 9-Apr-19Canara Bank- Funded Interest Term Loan ("FITL") 0.33 30-Sep-18 9-Apr-19Canara Bank- FITL 0.33 31-Dec-18 9-Apr-19Canara Bank- FITL 0.33 31-Mar-19 9-Apr-19IDBI Bank - FITL 0.18 30-Jun-18 6-Jul-18IDBI Bank - FITL 0.18 30-Sep-18 28-Dec-18IDBI Bank - FITL 0.18 31-Dec-18 2-Jan-19IDBI Bank - FITL 0.18 31-Mar-19 9-Apr-19State Bank of India- FITL 6.11 30-Jun-18 18-Jul-18State Bank of India- FITL 11.31 30-Sep-18 9-Apr-19State Bank of India- FITL 11.31 31-Dec-18 9-Apr-19State Bank of India- FITL 11.31 31-Mar-19 9-Apr-19Bank of India- FITL 1.92 31-Mar-18 5-Apr-18Bank of India- FITL 2.88 30-Sep-18 9-Apr-19Bank of India- FITL 2.88 31-Dec-18 9-Apr-19Bank of India- FITL 2.88 31-Mar-19 9-Apr-19Union Bank of India- FITL 0.46 30-Sep-18 9-Apr-19Union Bank of India- FITL 0.46 31-Dec-18 9-Apr-19Union Bank of India- FITL 0.46 31-Mar-19 9-Apr-19Indian Overseas bank- FITL 3.72 30-Jun-18 3-Jul-18Indian Overseas bank- FITL 3.72 30-Sep-18 9-Apr-19Indian Overseas bank- FITL 3.72 31-Dec-18 9-Apr-19Indian Overseas bank- FITL 3.72 31-Mar-19 9-Apr-19
B. Other borrowingsEARC - Term Loan I (refer note (i) below) 20.39 31-Dec-18 9-Apr-19EARC - Term Loan I (refer note (i) below) 16.84 25-Mar-19 9-Apr-19EARC - Term Loan II (refer note (i) below) 2.00 30-Sep-18 9-Apr-19EARC - Term Loan II (refer note (i) below) 2.00 31-Dec-18 9-Apr-19EARC - Term Loan II (refer note (i) below) 2.00 31-Mar-19 9-Apr-19Biotechnology Industrial Research Assistance Council (BIRAC) - Loan 1
7.00 30-Sep-18 25-Apr-19
BIRAC - Loan 1 7.00 31-Mar-19 25-Apr-19BIRAC - Loan 2 1.50 29-Nov-18 25-Apr-19Loan from Department of Science & Technology 2.00 21-Sep-18 14-May-19Loan from Directors - Mrs. Sunanda Jain (refer note 42 (C))
21.57 June 2014 to March 2019 converted into long term loan on 6-Apr-19
Loan from Radhika Heights Limited (refer note 57) 421.83 January 2014 to March 2019 converted into long term loan on 6-Apr-19Loan from Trinidhi Finance Private Limited 3.38 December 2013 to March 2019 payment term revised to 30-Sep-19
Notes to the financial statements for the year ended March 31, 2019
Notes: i) Refer note 55. ii) The interest payment on above loans from banks and EARC were also delayed and paid as part of the settlement on April 9, 2019.

Annual Report 2018-19110
Notes to the financial statements for the year ended March 31, 2019
48. Fair value measurements(A) Financial assets and liabilities
The carrying amounts and fair values of financial instruments by class are as follows:(Rs. in million)
As at March 31, 2019 Fair value through profit or loss
Fair value through other comprehensive income
Amortised cost
Financial Assets(i) Investments 0.70 - - (ii) Trade receivables - - 251.95 (iii) Cash and cash equivalents - - 49.58 (iv) Other bank balances - - 28.95 (v) Loans - - 168.36 (vi) Others financial assets - - 17.63 Total 0.70 - 516.47 Financial Liabilities(i) Borrowings - - 6,906.94 (ii) Trade payables - - 778.81 (iii) Other financial liabilities - - 0.44Total - - 7,686.19
As at March 31, 2018 Fair value through profit or loss
Fair value through other comprehensive income
Amortised cost
Financial Assets(i) Investments 0.70 - - (ii) Trade receivables - - 1,422.66 (iii) Cash and cash equivalents - - 65.24 (iv) Other bank balances - - 52.68 (v) Loans - - 159.80 (vi) Others financial assets - - 54.22 Total 0.70 - 1,754.60 Financial Liabilities(i) Borrowings - - 9,861.74 (ii) Trade payables - - 2,418.38 (iii) Other financial liabilities - - 61.82 Total - - 12,341.94 Investment in subsidiaries amounting to Rs.3,426.11 million are measured at cost as per Ind AS 27, ‘Separate Financial Statements’ and hence, not presented here.
(B) Fair values hierarchyFinancial assets and financial liabilities measured at fair value in the balance sheet are categorised into three levels of fair value hierarchy. The three levels are defined based on the observability of significant inputs to the measurement, as follows:The different levels of fair value have been defined below:Level 1: Quoted prices (unadjusted) in an active market for financial instruments.Level 2: Inputs other than quoted prices included within Level 1 that are observable for the assets or liability, either directly or indirectly.Level 3: unobservable inputs for the asset or liability.
B1. Financial assets and liabilities measured at fair value - recurring fair value measurements(Rs. in million)
As at March 31, 2019 Note Level 1 Level 2 Level 3 Investments 3 - 0.70 -
As at March 31, 2018 Note Level 1 Level 2 Level 3 Investments 3 - 0.70 -
B2. Fair value of instruments measured at amortised costParticulars As at March 31, 2019 As at March 31, 2018
Carrying value Fair value Carrying value Fair value Borrowings 6,906.94 6,870.54 9,861.74 9,840.76 The management assessed that fair value of cash and cash equivalents, trade receivables, security deposits, loan to related parties, other financial assets, short term borrowings, trade payables and other current financial liabilities approximate their carrying amounts largely due to the short-term maturities of these instruments. The fair value of the financial assets and liabilities is included at the amount at which the instrument could be exchanged in a current transaction between willing parties, other than in a forced or liquidation sale. The following methods and assumptions were used to estimate the fair values:i) The fair values of the Company’s fixed interest-bearing borrowings are determined by applying discounted cash flows (‘DCF’) method, using
discount rate that reflects the issuer’s borrowing rate as at the end of the reporting period.ii) All the other long term borrowing facilities availed by the Company are variable rate facilities which are subject to changes in underlying
Interest rate indices. Further, the credit spread on these facilities are subject to change with changes in Company's credit worthiness. The management believes that the current rate of interest on these loans are in close approximation from market rates applicable to the Company. Therefore, the management estimates that the fair value of these borrowings are approximate to their respective carrying values.

Panacea Biotec Ltd. 111
Notes to the financial statements for the year ended March 31, 2019
49. Financial risk management
Risk management framework
The Company’s activities expose it to market risk, liquidity risk and credit risk. The management has the overall responsibility for the establishment and oversight of the Company’s risk management framework. This note explains the sources of risk which the entity is exposed to and how the entity manages the risk and the related impact in the financial statements.
(A) Credit risk
Credit risk is the risk that a counterparty fails to discharge its obligation to the Company. The Company’s exposure to credit risk is influenced mainly by cash and cash equivalents, trade receivables and financial assets measured at amortised cost. The Company continuously monitors defaults of customers and other counter parties and incorporates this information into its credit risk controls.
A1. Credit risk management
The Company assesses and manages credit risk based on internal credit rating system. Internal credit rating is performed for each class of financial instruments with different characteristics. The Company assigns the following credit ratings to each class of financial assets based on the assumptions, inputs and factors specific to the class of financial assets.
A: Low credit risk on financial reporting date
B: Moderate credit risk
C: High credit risk
The Company provides for expected credit loss based on the following:
Asset Company Basis of categorisation Provision for expected credit lossLow credit risk Cash and cash equivalents, other bank
balances, loans, trade receivables and other financial assets
12 month expected credit loss
Moderate credit risk Trade receivables Life time expected credit loss or 12 month expected credit loss*
High credit risk Trade receivables and loans Life time expected credit loss or fully provided for
*In respect of trade receivables, the Company recognises a provision for lifetime expected credit losses
Based on business environment in which the Company operates, a default on a financial asset is considered when the counter party fails to make payments within the agreed time period as per contract. Loss rates reflecting defaults are based on actual credit loss experience and considering differences between current and historical economic conditions.
Assets are written off when there is no reasonable expectation of recovery, such as a debtor declaring bankruptcy or a litigation decided against the Company. The Company continues to engage with parties whose balances are written off and attempts to enforce repayment. Recoveries made are recognised in statement of profit and loss. (Rs. in million)
Credit rating Particulars As at March 31, 2019 As at March 31, 2018A: Low credit risk Cash and cash equivalents 49.58 65.24
Other bank balances 28.95 52.68 Loans 168.36 159.80 Other financial assets 17.63 54.22
B: Medium credit risk Trade receivables 308.36 1,462.69 C: High credit risk Trade receivables 8.50 21.79
Loans 659.85 874.26
Cash and cash equivalents and bank deposits
Credit risk related to cash and cash equivalents and bank deposits is managed by only accepting highly rated banks and diversifying bank deposits and accounts in different banks across the country.
Trade receivables
Credit risk related to trade receivables are mitigated by taking bank guarantees/letter of credit, from customers where credit risk is high. The Company closely monitors the credit-worthiness of the debtors through internal systems that are configured to define credit limits of customers, thereby limiting the credit risk to pre-calculated amounts. The Company assesses increase in credit risk on an ongoing basis for amounts receivable that become past due and default is considered to have occurred when amounts receivable become two year past due.
Other financial assets measured at amortised cost
Other financial assets measured at amortized cost includes loans and advances to related parties and employees, security deposits and others. Credit risk related to these other financial assets is managed by monitoring the recoverability of such amounts continuously.
A.2 Expected credit losses for financial assets other than trade receivables
The Company provides for expected credit losses on loans and advances other than trade receivables by assessing individual financial instruments for expectation of any credit losses. Since the Company deals with only high-rated banks and financial institutions, credit risk in respect of cash and cash equivalents, other bank balances and bank deposits is evaluated as very low. In respect of loans, comprising of security deposits, credit risk is considered low because the Company is in possession of the underlying asset. However, in respect of loans comprising loans to related parties, credit risk is evaluated on the basis of credit worthiness of those parties and loss allowance is measured as lifetime expected credit losses. In respect of other financial assets, credit risk is evaluated based on Company’s knowledge of the credit worthiness of those parties and loss allowance is measured as lifetime expected credit losses. The Company does not have any expected

Annual Report 2018-19112
Notes to the financial statements for the year ended March 31, 2019
loss based impairment recognised (except in case of loans to related parties) on such assets considering their low credit risk nature, though incurred loss provisions are disclosed under each sub-category of such financial assets.
As at March 31, 2019 (Rs. in million)Particulars Estimated gross
carrying amount at defaultExpected probability
of defaultExpected credit
lossesCarrying amount
net of impairmentCash and cash equivalents 49.58 0.00% - 49.58 Other bank balances 28.95 0.00% - 28.95 Loans from related parties 659.85 100.00% 659.85 - Loans from others 168.36 0.00% - 168.36 Other financial assets 17.63 0.00% - 17.63
As at March 31, 2018 (Rs. in million)Particulars Estimated gross
carrying amount at defaultExpected probability
of defaultExpected credit
lossesCarrying amount
net of impairmentCash and cash equivalents 65.24 0.00% - 65.24 Other bank balances 52.68 0.00% - 52.68 Loans from related parties 874.26 100.00% 874.26 - Loans from others 159.80 0.00% - 159.80 Other financial assets 54.22 0.00% - 54.22
(Rs. in million)Reconciliation of loss allowance LoansLoss allowance as on April 01, 2017 800.79 Expected loss recognised/(reversed) during the year 73.47 Amounts written off - Loss allowance on March 31, 2018 874.26 Expected loss recognised/(reversed) during the year (214.41)Amounts written off - Loss allowance on March 31, 2019 659.85
A.3 Expected credit loss for trade receivables under simplified approach
The Company recognizes lifetime expected credit losses on trade receivables using a simplified approach, wherein the Company has defined percentage of provision by analysing historical trend of default relevant to each category of customer based on the criteria defined above and such provision percentage determined have been considered to recognise life time expected credit losses on trade receivables (other than those where default criteria are met).
As at March 31, 2019 (Rs. in million)Particulars Not Due 0-30 days
post due31-90 days
post due 91-182 days
post due 183-365 days
post due366-730 days
post due More than 730
days post due Total
Gross carrying amount* 412.68 188.45 61.24 28.81 24.46 4.29 42.65 762.58 Expected loss rate 1.35% 2.00% 2.25% 4.40% 5.50% 10.00% 100.00% 7.40%Expected credit loss** (Loss allowance provision)
5.57 3.77 1.38 1.27 1.35 0.43 42.65 56.41
Carrying amount of trade receivables (net of impairment)
407.11 184.68 59.86 27.54 23.11 3.86 - 706.17
* including Gross carrying amount of Rs.512.39 million pertaining to discontinued operations**ECL provision of Rs.52.15 million pertaining to discontinued operations
As at March 31, 2018 (Rs. in million)Particulars Not Due 0-30 days
post due31-90 days
post due 91-182 days
post due 183-365 days
post due366-730 days
post due More than 730
days post due Total
Gross carrying amount 285.97 350.45 140.23 35.02 8.36 23.44 15.72 859.19 Expected loss rate 1.35% 2.15% 3.49% 2.40% 25.24% 21.72% 100.00% 4.66%Expected credit loss (Loss allowance provision)
3.86 7.52 4.89 0.84 2.11 5.09 15.72 40.03
Carrying amount of trade receivables (net of impairment)
282.11 342.93 135.34 34.18 6.25 18.35 - 819.16

Panacea Biotec Ltd. 113
Changes in allowance for trade receivables(Rs. in million)
Particulars AmountAs at April 1, 2017 90.32 Movement during the year (28.50)As at March 31, 2018 61.82 Loss recognised/(reversed) during the year 3.09 As at March 31, 2019 64.91
(B) Liquidity risk Liquidity risk is the risk that the Company will encounter difficulty in meeting the obligations associated with its financial liabilities that are settled by delivering cash or another financial asset. The Company’s approach to managing liquidity is to ensure as far as possible, that it will have sufficient liquidity to meet its liabilities when they are due. The Company manages its liquidity needs by carefully monitoring scheduled debt servicing payments for long-term financial liabilities as well as cash-outflows due in day-to-day business. Long-term liquidity needs for a 180-day and a 360-day lookout period are identified monthly.Management monitors rolling forecasts of the liquidity position and cash and cash equivalents on the basis of expected cash flows. The Company takes into account the liquidity of the market in which the entity operates.B.1 Contractual Maturities of financial liabilities
The tables below analyse the Company’s financial liabilities based on their contractual maturities. The amounts disclosed in the table are the contractual undiscounted cash flows.
(Rs. in million)March 31, 2019 Less than 1 year 1 - 2 years 2 - 3 years More than 3 years Total(i) Borrowings 6,060.77 80.72 77.07 898.54 7,117.10(ii) Trade payables 778.81 - - - 778.81 (iii) Others 0.44 - - - 0.44 Total 6,840.02 80.72 77.07 898.54 7,896.35
March 31, 2018 Less than 1 year 1 - 2 years 2 - 3 years More than 3 years Total(i) Borrowings 4,822.48 1,444.12 1,600.88 5,230.67 13,098.15 (ii) Trade payables 2,418.38 - - - 2,418.38 (iii) Others 61.82 - - - 61.82 Total 7,302.68 1,444.12 1,600.88 5,230.67 15,578.35
(C) Market risk (i) Interest rate risk The Company’s policy is to minimise interest rate cash flow risk exposures on long-term financing. At the year end, the Company is exposed to changes in market interest rates through bank borrowings at variable interest rates. Other borrowings are at fixed interest rates.The Company’s exposure to interest rate risk on borrowings is as follows:
(Rs. in million)Particulars As at March 31, 2019 As at April 1, 2018Variable rate 6,616.79 8,942.64 Fixed rate 269.98 754.23 Total 6,886.77 9,696.87
The following table illustrates the sensitivity of profit after tax and equity to a possible change in interest rates of +/- 1% in current year (March 31, 2018: +/- 1%). These changes are considered to be reasonably possible based on observation of current market conditions. The calculations are based on a change in the average market interest rate for each period, and the financial instruments held at each reporting date that are sensitive to changes in interest rates. All other variables are held constant.
(Rs. in million)Interest sensitivity* For the year ended
March 31, 2019For the year ended
March 31, 2018Interest rates - increase by 100 basis points (March 31, 2018: 100 basis points) (43.05) (58.48)Interest rates - decrease by 100 basis points (March 31, 2018: 100 basis points) 43.05 58.48
* Holding all other variables constant(ii) Foreign currency riskThe Company is exposed to foreign exchange risk arising from foreign currency transactions, primarily with respect to the USD, EURO, JPY, CAD, GBP and TBH. Foreign exchange risk arises from recognised assets and liabilities denominated in a currency that is not the functional currency of the Company. The Company does not use any derivative instruments to manage its exposure. Also, the Company does not use forward contracts and swaps for speculative purposes.
Notes to the financial statements for the year ended March 31, 2019

Annual Report 2018-19114
(a) Foreign currency denominated financial assets and liabilities, translated at the closing rate, are as follows:Particulars Foreign
currencyAs at March 31, 2019 As at March 31, 2018
Amount in foreign currency
Closing rate
Amount (Rs. in million)
Amount in foreign currency
Closing rate
Amount (Rs. in million)
Financial assetsBalance with banks USD 639 69.15 0.04 5,589 65.17 0.36
Euro 2,732 77.66 0.21 763 80.82 0.06 KZT 52,110 0.21 0.01 52,110 0.21 0.01 RUB 16,460 1.05 0.02 16,556 1.13 0.02
Interest receivable USD 458,684 69.97 32.09 1,127,318 65.17 73.47 Investment in subsidiaries USD 10 47.62 0.00 10 47.62 0.00
CHF 632,911 54.29 34.36 632,911 54.29 34.36 Loan to subsidiaries USD 17,104,110 51.11 874.26 15,976,792 50.12 800.79 Foreign trade receivable Euro 2,337,428 77.66 181.51 2,778,254 80.82 224.53
USD 3,342,438 69.15 231.13 3,899,105 65.17 254.10 Financial liabilitiesForeign trade payable USD 2,546,269 69.16 176.10 2,579,377 65.18 168.12
Euro 1,475,188 77.70 114.62 3,818,755 80.85 308.74 GBP 38,694 90.57 3.50 12,173 92.31 1.12 JPY 2,722,810 0.62 1.70 2,722,810 0.62 1.68 SEK 16,820 7.44 0.13 16,820 7.80 0.13 CAD 43,428 51.54 2.24 14,328 50.68 0.73 THB 5,547 2.18 0.01 5,547 2.09 0.01
Foreign currency loans USD 15,681,865 72.49 1,136.70 25,000,000 65.18 1,629.50 Interest accrued but not due USD - - - 9,612 65.18 0.63 Net exposure
USD 2,677,746 - (175.28) (6,580,175) - (669.52)Euro 864,972 - 67.10 (1,039,738) - (84.15)GBP (38,694) - (3.50) (12,173) - (1.12)CHF 632,911 - 34.36 632,911 - 34.36 RUB 16,460 - 0.02 16,556 - 0.02 THB (5,547) - (0.01) (5,547) - (0.01)SEK (16,820) - (0.13) (16,820) - (0.13)CAD (43,428) - (2.24) (14,328) - (0.73)KZT 52,110 - 0.01 52,110 - 0.01 JPY (2,722,810) - (1.70) (2,722,810) - (1.68)
* Closing exchange rate has been rounded off to two decimal places.
Notes to the financial statements for the year ended March 31, 2019
(b) Sensitivity analysis of change in material foreign currencies on profit/(loss) after taxMarch 31, 2019 March 31, 2018 March 31, 2019 March 31, 2018
Currency Profit for the year +200 bps Profit for the year -200 bpsUSD (2.28) (8.71) 2.28 8.71
Currency Profit for the year +500 bps Profit for the year -500 bpsEURO 2.18 (2.74) (2.18) 2.74
Currency Profit for the year +500 bps Profit for the year -500 bpsGBP (0.11) (0.04) 0.11 0.04
Currency Profit for the year +200 bps Profit for the year -200 bpsJPY (0.02) (0.02) 0.02 0.02
Currency Profit for the year +200 bps Profit for the year -200 bpsCHF (0.03) (0.01) 0.03 0.01
50. Capital management policiesThe Company’s capital management objectives are to ensure the Company’s ability to continue as a going concern as well as to provide an adequate return to shareholders by pricing products and services commensurately with the level of risk.

Panacea Biotec Ltd. 115
The Company monitors capital on the basis of the carrying amount of equity plus its subordinated loan, less cash and cash equivalents as presented on the face of the statement of financial position recognised in other comprehensive income.The Company manages its capital structure and makes adjustments to it in the light of changes in economic conditions and the risk characteristics of the underlying assets. In order to maintain or adjust the capital structure, the Company may adjust the amount of dividends paid to shareholders, return capital to shareholders or issue new shares. The amounts managed as capital by the Company are summarised as follows:
(Rs. in million)Particulars As at March 31, 2019 As at April 1, 2018Non-current borrowings 6,213.09 7,923.53 Current borrowings 693.85 1,938.21 Less: Cash and cash equivalents (49.58) (65.24)Net debt 6,857.36 9,796.50 Total equity 4,184.72 3,880.97 Net debt to equity ratio 163.87% 252.42%
51. Reconciliation of liabilities arising out of financing activitiesThe changes in the Company’s liabilities arising from financing activities can be classified as follows:
(Rs. in million)Particulars Long term borrowings Short term borrowings TotalAs at April 01, 2018 7,758.66 1,938.21 9,696.87 Cash changes: - Proceeds - 8.00 8.00 - Repayment (155.39) (200.13) (355.52)Other non-cash changes: - adjustment on restructuring of debt (2,226.70) (550.64) (2,777.34) - Foreign currency monetary item translation difference account 116.89 - 116.89 - Conversion of short term loan into long term loan 688.62 (688.62) - - Conversion of interest accrued into short term loan - 187.03 - - Notional interest expense recorded on less than market rate loans 10.84 - 10.84 Net debt as at March 31, 2019 6,192.92 693.85 6,699.74
As at April 01, 2017 8,028.72 2,196.49 10,225.21 Cash changes: - Proceeds 57.97 40.00 97.97 - Repayment (348.15) (298.28) (646.43)Other non-cash changes - Foreign currency monetary item translation difference account 8.00 - 8.00 - Impact of effective interest rate adjustment 2.39 - 2.39 - Notional interest expense recorded on less than market rate loans 9.73 - 9.73 Net debt as at March 31, 2018 7,758.66 1,938.21 9,696.87
Notes to the financial statements for the year ended March 31, 2019
52. Subsequent to the year ended March 31, 2019, the Company has:
a. signed investment agreements with India Resurgence Fund (‘IndiaRF’), promoted by Piramal Enterprises Limited and Bain Capital Credit, along with its affiliates (Investors) for obtaining long term funds of upto Rs.9,920.0 million, consequent to approval from shareholders in general meeting held on March 25, 2019. This investment is structured by way of subscription to Non-Convertible Debentures (‘NCDs’) of up to Rs.8,640.0 million and subscription amount of Rs.320.0 million towards share warrants to be allotted on a preferential basis. The subscription amount represents 25% of total amount of Rs.1,280.0 million proposed to be raised upon issuance of equity shares against warrants as per SEBI (Issue of Capital and Disclosure Requirements) Regulations, 2018 (‘ICDR Regulations’). Upon exercise of conversion rights in the warrants, IndiaRF (along with its affiliates) will collectively own 10.4% stake in the equity share capital of the Company on a fully diluted basis;
b. issued and allotted 74,300 unrated, unlisted, redeemable NCDs, having the face value of INR 1 lakh each, aggregating to Rs.7,430.0 million under Series 1A, Series 1B and Series 2 NCDs to the Investors; The NCD Series 1A has maturity period of 12 months, Series 1B 60 months and Series 2 is 18 months from the date of allottment. The NCDs are secured by way of first pari-passu charge over entire fixed assets and current assets of the Company. The NCDs are additionally secured by way of (i) personal guarantees of Dr. Rajesh Jain, Mr. Sandeep Jain and Mr. Ankesh Jain; (ii) pledge of 39,776,227 equity shares held by the promoters and promoter group members and (iv) pledge of equity shares of PBPL held by the Company.
c. issued and allotted 71,11,111 convertible warrants at a price of Rs.180 each on a preferential basis to the Investors, entitling them to subscribe to an equivalent number of equity shares of face value of Re.1 each at a premium of Rs.179 per share as per the provisions of Chapter V of ICDR Regulations.
53. In view of absence of profits during financial years 2013-14 and 2012-13, total remuneration paid to the Managing/ Joint Managing and Whole time Directors exceeded the ceiling prescribed in Section II of Part II of Schedule XIII to the Companies Act, 1956. Further, because of non-compliance to one of the conditions of part II Section II of Schedule V to the Companies Act, 2013, the remuneration paid to a Whole time Director during the year ended March 31, 2016 and remuneration paid to six directors (Managing/ Joint Managing and Whole time Directors) during the year ended March 31, 2017 and 2018 respectively required approval of the Central Government. The Company has also paid managerial remuneration amounting

Annual Report 2018-19116
to Rs.37.6 million during the financial year ended March 31, 2019 for which the Company required prior approval of the Central Government. The Company submitted applications to the Central Government for waiver of recovery of excess remuneration paid in respect of aforesaid periods. However, in view of the recent amendments in the provisions of Section 197 of the Companies Act, 2013 effective from September 12, 2018, whereby the powers of Central Government for approval of payment of managerial remuneration in excess of limits/ waiver of recovery of managerial remuneration recoverable, etc. have been transferred to the shareholders of the Company. Accordingly, the said applications stand abated at the Central Government. The Company has accordingly decided to obtain the necessary approval from its shareholders in due course in compliance with the aforesaid amended provisions of the Companies Act, 2013. Pending such approval, the Company has recorded an amount of Rs.154.0 million as on March 31, 2019 (March 31, 2018: Rs.116.4 million) as recoverable from such directors towards such excess remuneration paid. The Company is confident of obtaining necessary approvals from its shareholders.
54. For the financial year ended March 31, 2019, the Company has incurred a loss (before tax and exceptional items) of Rs.2,808.0 million (2018: loss of Rs.1,325.3 million) from continuing operations. The continuous operating losses had adversely affected the cash flows of the Company. The Company has already taken various measures aimed at improving the financial condition of the Company, inter-alia, deploying funds received from the Investors for scaling up its vaccine as well as pharmaceutical formulations business in India and international markets including ROW countries, USA/EU, etc., besides expediting development of new products and monetization of non-core assets. Based on these measures and continuous efforts to improve the business performance, the management believes that it would be able to generate sustainable cash flows, recoup the erosion in its net worth through profitable operations, discharge its obligations as they fall due and has therefore concluded that the going concern assumption continues to be valid.
55. During the year, the Company has reached bilateral settlements of its debts with each consortium lender individually. Subsequent to the year end, the Company has paid all its debts on April 9, 2019 to the said lenders including ECB from Bank of India pursuant to the said bilateral settlements and obtained ‘no dues’ certificates from such lenders. For the financial year ended March 31, 2019, the Company has written back excess liabilities of Rs.3,133.49 million, which is included as Exceptional Item in the Statement of Profit and Loss.
56. As at March 31, 2019 an amount of Rs.585.16 million (March 31, 2018: Rs.585.16 million) including interest of Rs.45.18 million (March 31, 2018: Rs.45.18 million) was receivable from the Company’s wholly owned subsidiary, Rees Investments Limited (“Rees”). Pursuant to the accumulated losses in Rees and its other subsidiaries, the Company, in earlier years, had assessed that the loan repayment capability of Rees has continued to be adversely affected. Rees was compulsory liquidated and dissolved by the authorities of Guernsey as on May 23, 2019. Accordingly, the Company had created ‘Provision for bad and doubtful advances’ on the aforesaid loan balance, pending approval from the Reserve Bank of India. Further, with a view to make the structure of overseas subsidiaries more efficient and aligned to business objectives and to save management and administrative expenses thereof, the Company has decided to wind up Panacea Biotec (International) SA (“PBS”) also. Accordingly, the Company has created ‘Provision for impairment on its investment in PBS. Owing to accumulated losses in PBS and PBGG, the Company has continued to maintain the provision for bad and doubtful advances in respect of the loans receivable from PBS and PBGG also amounting to Rs.74.69 million and Rs.246.50 million, respectively, as on March 31, 2019 (March 31, 2018: Rs.67.23 million and Rs.221.87 million, respectively) including interest of Rs.7.46 million and Rs.24.63 million, respectively as on March 31, 2019 (March 31, 2018: Rs.5.65 million and Rs.18.64 million, respectively).
57. During the financial year 2007-08, the Company had given an advance of Rs.176.8 million pursuant to the agreement with Ilyas & Mustafa Galadari Management Investment & Development (L.L.C.), U.A.E. (‘the Developer’) for purchase of certain immoveable properties in Dubai. The Developer failed to deliver the said properties to the Company and offered other properties under construction in lieu of the said properties. Owing to continuous delays in completion of construction, the Company has initiated legal recourse and issued a legal notice to the Developer.
During the previous financial year, with a view to restructure the Company’s debt obligations and reduce its interest outlay, the Board of Directors had approved the assignment of its receivables from the Developer to RHL in lieu of adjustment of part of RHL’s loan payable by the Company. The Company has executed the agreement for assignment of this advance to RHL on April 06, 2019. The process of assigning the said receivable to RHL and complying with the applicable provisions of the Foreign Exchange Management Act, 1999 as amended and other applicable laws, is expected to be completed in due course.
In view of ongoing discussions with the Developer and on the basis of the legal advice obtained, the Group believes that it has valid rights to claim the recovery of the advance paid to the Developer, in the form of either a refund or allotment of other properties. The management believes that the advance given to the Developer is fully realisable. Accordingly, no adjustments are considered necessary in the books of accounts.
58. As at March 31, 2019, a cumulative amount of Rs.401.04 million (March 31, 2018 Rs.331.11 million) is available with the Company as ‘MAT Credit Entitlement’ which, based on the then future profitability projections, could have been recovered and set off in subsequent years as per the provisions of Section 115JAA of the Income-tax Act, 1961. However, based on revised estimates of future profitability projections and other factors disclosed under note 52, the management, expects that the recoverable amount of MAT will be Rs.192.04 million as at March 31, 2019 (March 31, 2018: Rs.219.87 million). Accordingly, an amount of Rs.27.83 million (net of MAT credit of Rs.69.92 million) (financial year 2017-18: Rs.98.81 million) has been provided as non-recoverable during the year. The total provision of non recoverable MAT is Rs.209.00 as on March 31, 2019 (March 31, 2018: Rs.111.24 million).
59. 0.00 under “Rs. in million” represents amount less than Rs.50,000 and 0.00 under units represents units less than 50,000. Further, the figures shown in the tables may not exactly add up due to rounding off.
Notes to the financial statements for the year ended March 31, 2019
For Walker Chandiok & Co LLP For and on behalf of Board of Directors of Panacea Biotec LimitedChartered AccountantsFirm Registration No. 001076N/N500013
Anupam Kumar Soshil Kumar Jain Dr. Rajesh JainPartner Chairman Managing DirectorMembership No. 501531 (DIN 00012812) (DIN 00013053)
Vinod Goel Devender GuptaPlace : New Delhi Group CFO and Head Legal Chief Financial Officer & Date : May 30, 2019 & Company Secretary Head Information Technology

Panacea Biotec Ltd. 117
FORM NO. AOC-1(Pursuant to first proviso to sub-section (3) of Section 129 read with Rule 5 of Companies (Accounts) Rules, 2014)
Statement containing salient features of the financial statement of subsidiaries/associate companies/joint ventures
Part A : SubsidiariesFinancial Details of Subsidiary Companies
S. No.
Name of the Company Reporting period of the subsidiary, if different
from parent
Reporting currency
Exchange rate as on Balance Sheet date
As on March 31, 2019 For the year/ period ended March 31, 2019 % of Share
Holding as on March 31, 2019
Share Capital
Reserves & Surplus
Total Assets
Total Liabilities
Details of investment
(except in case of investment in subsidiary)
Turnover (including
other income)
Profit/ (Loss) before
Taxation
Provision for
Taxation
Profit after Taxation
Proposed Dividend
1 2 3 4 5 6 7 8 9 10 11 12 13 14 15
1 Radhika Heights Ltd. 31.03.19 INR 1.00 4.8 2,632.3 2,764.6 127.5 7.0 7.0 12.4 9.2 3.2 - 100% 2 Cabana Construction Pvt. Ltd.* 31.03.19 INR 1.00 0.1 (2.4) 319.5 321.8 - - (0.1) - (0.1) - 100% 3 Cabana Structures Ltd.* 31.03.19 INR 1.00 0.5 (0.5) 0.0 0.0 - - (0.1) - (0.1) - 100% 4 Nirmala Buildwell Pvt. Ltd.* 31.03.19 INR 1.00 0.1 (4.1) 298.7 302.7 - - (0.1) - (0.1) - 100% 5 Nirmala Organic Farms & Resorts
Pvt. Ltd*31.03.19 INR 1.00 0.1 6.7 104.0 97.2 - - (0.6) (0.0) (0.6) - 100%
6 Radicura Infra Ltd.* 31.03.19 INR 1.00 2.0 30.9 497.8 464.9 - - (3.1) (0.7) (2.4) - 100% 7 Sunanda Infra Ltd.* 31.03.19 INR 1.00 0.5 (1.7) 222.4 223.7 - - (0.1) - (0.1) - 100% 8 PanEra Biotec Pvt. Ltd.# 31.03.19 INR 1.00 8.4 (68.6) 48.7 108.9 25.7 221.4 (1.0) - (1.0) - 50% 9 Adveta Power Pvt. Ltd.**# 31.03.19 INR 1.00 1.8 (1.0) 29.3 28.5 - - (0.4) - (0.4) - 50%
10 Panacea Biotec Pharma Ltd.$ 31.03.19 INR 1.00 1.0 - 1.0 - - - - - - - 100% 11 Panacea Biotec (International) SA 31.03.19 CHF 69.41 41.6 (144.7) 1.7 104.7 - - (19.1) (0.0) (19.1) - 100% 12 Rees Investments Ltd.## 31.03.19 US $ 69.15 0.0 (793.7) - 793.7 - - (0.0) - (0.0) - 100% 13 Panacea Biotec (Germany) GmbH*** 31.03.19 Euro 77.66 19.1 (294.3) 199.0 474.2 - 132.2 (20.0) 0.0 (20.0) - 100%
* Indirect subsidiary through Radhika Heights Ltd. ** Indirect subsidiary through PanEra Biotec Pvt. Ltd.*** Indirect subsidiary through Panacea Biotec (International) SA. $ Subsidiary incorporated on March 22, 2019. # Considered as a subsidiary for the purpose of consolidation as per Ind AS 110. ## Liquidated on May 23, 2019Note: The Company has incorporated following subsidiaries during the current financial year:1. Ravinder Heights Ltd. (“RVHL”) (Wholly-owned subsidiary (“WOS”) w.e.f. April 15, 2019)2. Meyten Realtech Pvt. Ltd. (WOS) (w.e.f. April 12, 2019)
Part B: Associates and Joint VenturesStatement pursuant to Section 129 (3) of the Companies Act, 2013 related to Associate Companies and Joint Ventures
(Rs. in million)Joint Venture
Name of Associates/Joint Ventures Chiron Panacea Vaccines Pvt. Ltd. (Under Liquidation)
1. Latest audited Balance Sheet Date 31.03.20192. Shares of Associate/Joint Ventures held by the company on the year end
Number 2,295,910 Amount of Investment in Associates/Joint Venture (Rs. million) 22.96 Extent of Holding % 50%
3. Description of how there is significant influence Note-A4. Reason why the associate/joint venture is not consolidated NA5. Net worth attributable to shareholding as per latest audited Balance Sheet 52.756. Profit/Loss for the year
i. Considered in Consolidation 1.49ii. Not Considered in Consolidation 1.49
Note : A. There is significant influence as the Company holds more than 20% of total share capital.
For and on behalf of Board of Directors of Panacea Biotec Limited
Soshil Kumar Jain Rajesh Jain Chairman Managing Director (DIN 00012812) (DIN 00013053)
Vinod Goel Devender GuptaPlace : New Delhi Group CFO and Head Legal Chief Financial Officer & Date : May 30, 2019 & Company Secretary Head Information Technology
(Rs. in million)

Annual Report 2018-19118
Independent Auditors’ Report on the Consolidated Financial Statements
To the Members of Panacea Biotec Limited
Report on the Audit of the Consolidated Financial Statements
Opinion
1. We have audited the accompanying consolidated financial statements of Panacea Biotec Limited (‘the Holding Company’) and its subsidiaries (the Holding Company and its subsidiaries together referred to as ‘the Group’), and its joint venture, which comprise the Consolidated Balance Sheet as at 31 March 2019, the Consolidated Statement of Profit and Loss (including Other Comprehensive Income), the Consolidated Cash Flow Statement and the Consolidated Statement of Changes in Equity for the year then ended, and a summary of the significant accounting policies and other explanatory information.
2. In our opinion and to the best of our information and according to the explanations given to us and based on the consideration of the reports of the other auditors on separate financial statements and on the other financial information of the subsidiaries and a joint venture the aforesaid consolidated financial statements give the information required by the Companies Act, 2013 (‘Act’) in the manner so required and give a true and fair view in conformity with the accounting principles generally accepted in India including Indian Accounting Standards (‘Ind AS’) specified under Section 133 of the Act, of the consolidated state of affairs (consolidated financial position) of the Group as at 31 March 2019, and its consolidated profit (consolidated financial performance including other comprehensive income), its consolidated cash flows and the consolidated changes in equity for the year ended on that date.
Basis for Opinion
3. We conducted our audit in accordance with the Standards on Auditing specified under Section 143(10) of the Act. Our responsibilities under those standards are further described in the Auditor’s Responsibilities for the Audit of the Consolidated Financial Statements section of our report. We are independent of the Company in accordance with the Code of Ethics issued by the Institute of Chartered Accountants of India (‘ICAI’) together with the ethical requirements that are relevant to our audit of the financial statements under the provisions of the Act and the rules thereunder, and we have fulfilled our other ethical responsibilities in accordance with these requirements and the Code of Ethics. We believe that the audit evidence we have obtained and the audit evidence obtained by the other auditors in terms of their reports referred to in paragraph 16 of the Other Matters section below, is sufficient and appropriate to provide a basis for our opinion.
Emphasis of Matters
4. We draw attention to the following notes to the consolidated financial statements
a) Note 62 to the consolidated financial statements regarding capital advances amounting to Rs.176.80 million given to real estate developer for acquiring certain immovable properties in Dubai where the Holding Company has initiated legal recourse.
b) Note 58 to the consolidated financial statements regarding payment of managerial remuneration for the financial years ended 31 March 2019, 2018, 2017, 2016, 2014 and 2013, which is in excess of the limits specified by the relevant provisions of the Companies Act, 2013 / the Companies Act, 1956 by Rs.154 million for the said years. The Holding Company’s applications to the Central Government seeking approval for payment of such excess remuneration have not been approved and consequently the Holding Company is required to recover the excess amount thus paid for the said years. The Holding Company has recorded an amount of Rs.154 million as recoverable from the directors towards such excess remuneration paid. The Holding Company has submitted applications to the Central Government for waiver of recovery of excess remuneration paid. Further, as discussed in aforementioned note, pursuant to the notification of the effective date of Section 67 of the Companies (Amendment) Act, 2017 amending section 197 - overall maximum managerial remuneration and managerial remuneration in case of absence or inadequacy of profits, of the Companies Act, 2013, the aforesaid applications pending with the Central Government stand abated and the Holding Company is in the process of seeking requisite approvals required in accordance with the provisions of Section 197(10) of the Companies Act, 2013.
Pending the ultimate outcome of the aforesaid matters which is presently unascertainable, no adjustments have been made in the books of accounts. Our opinion is not modified in respect of these matters.
Key Audit Matters
5. Key audit matters are those matters that, in our professional judgment and based on the consideration of the reports of the other auditors on separate financial statements and on the other financial information of the subsidiaries and joint venture, were of most significance in our audit of the consolidated financial statements of the current period. These matters were addressed in the context of our audit of the consolidated financial statements as a whole, and in forming our opinion thereon, and we do not provide a separate opinion on these matters.

Panacea Biotec Ltd. 119
Independent Auditors’ Report on the Consolidated Financial Statements
Key audit matter How the matter was addressed in the audit
One-time settlement (‘OTS’) pursuant to Corporate Debt Restructuring (‘CDR’)
Our audit procedures included but were not limited to the following in relation to one-time settlement of debt:
Refer note 60 to the accompanying consolidated financial statements.As fully described in note 19A, during the last quarter of the year ended 31 March 2019; 94% of the lenders under the CDR communicated their consent for the Holding Company’s proposal for one-time settlement of debt. This proposal also received an 'in-principle' approval from all the lenders on 29 March 2019. Pursuant to the CDR, the Holding Company has repaid the borrowings as agreed in the CDR subsequent to the year-end. Accordingly, during the year ended 31 March 2019; the Holding Company has written back the outstanding debt and interest which has been waived off under the CDR and disclosed it as an ‘exceptional item’ in the Consolidated Statement of Profit and Loss.We identified this as key audit matter for current year audit owing to the materiality of the amounts involved in this matter, significant efforts involved in accounting assessment by the management for recording the above transaction and also being a matter on which we had various discussion with those charged with governance during the year then ended.
a) Obtained an understanding of the management process for ensuring completeness, appropriateness of recognition and measurement including disclosure of the OTS transaction as at the year end;
b) Reviewed the minutes of the joint lender forum meetings held during the year ended 31 March 2019, OTS sanction letters and no dues certificates issued by the respective lenders banks pursuant to CDR. Further, reviewed the minutes of the relevant meetings of the Board of Directors of the Holding Company, approving the OTS transaction;
c) Traced the bullet repayment made by the Holding Company to various lenders pursuant to the CDR to the underlying bank statements and remittance documents;
d) Reviewed the assessment performed by the management for accounting this transaction in accordance with Ind AS 109, Financial Instruments and Ind AS 10, Events after the Reporting Date;
e) Re-computed the amounts to be written back pursuant to one-time settlement of debt for the year ended 31 March 2019 and agreed it with the management’s computations; and
f) Evaluated the appropriateness of the disclosures made in the consolidated financial statements of the Group with respect to this matter.
Discontinued operationsRefer note 1 and 41 to the accompanying consolidated financial statements for the accounting policy and related financial disclosures respectively. During the current year ended 31 March 2019; the management of the Group has identified a business segment as ‘discontinued operation’ and thereby classified the related assets and liabilities as held for sale. Demerger of real estate segment:As further explained in note 41, the Group has decided to demerge its real estate undertaking, comprising certain immoveable properties of the Group and its investment in a wholly owned subsidiary which was intended to deal in real estate.The Board of Directors of the Holding Company have approved the demerger proposal and the demerger scheme at their board meetings held on 26 February 2019 and 30 May 2019 respectively.Pursuant to the above restructuring by the Group, the management has assessed the real estate segment as disposal group and presented as “discontinued operations” in the consolidated financial statements of the Holding Company in accordance with the provisions of Indian Accounting Standard 105 – ‘Non-current Assets Held for Sale and Discontinued Operations’.Accordingly, net profit/(loss) from the real estate segment amounting to Rs.95.8 million and Rs.(49.5) million for the year ended 31 March 2019 has been presented as profit/ (loss) from discontinued operations in the consolidated Statement of Profit and Loss and the related assets /(liabilities) of the real estate business are classified as ‘assets / (liabilities) classified as held for sale’ in the standalone Balance Sheet as at 31 March 2019.
Our audit procedures included, but were not limited to, the following in relation to the discontinued operations:a) Obtained an understanding of the management process
for ensuring classification, measurement, disclosure and allocations for the identified disposal groups;
b) Reviewed the minutes of the respective meetings of the Board of Directors and the shareholders of the Holding Company approving the respective transactions;
c) Assessed management’s conclusions regarding the allocations of the asset, liabilities, income and expenses that are assigned to the discontinued operations for the respective segments;
d) Assessed the appropriateness of the carrying values of assets and liabilities classified as held for sale in accordance with the requirements of Ind AS 105;
e) Read the draft demerger scheme to be filed with the judicial courts for implementing the demerger;
f ) Assessed reasonableness of management’s judgement with respect to the likelihood and expected timing of the implementation of the restructuring; and
g) Assessed the appropriateness and adequacy of the related in the consolidated financial statements of the Holding Company in accordance with the applicable accounting standards.
6. We have determined the matters described below to be the key audit matters to be communicated in our report.

Annual Report 2018-19120
We identified this as a key audit matter for current year audit in view of the significance of the impact of these restructuring transactions have on the consolidated financial statements including the amounts involved and exercise of management judgments with respect to identification and segregation of assets and liabilities and allocation of line items which are corporate in nature pertaining to real estate segment.
Going concern basis of accounting:Refer note 59 to the accompanying consolidated financial statements.The Group has incurred loss before tax amounting to Rs.2,877.83 million for the year ended 31 March 2019 and its current liabilities exceed its current assets by Rs.6,622.85 million. While these above indicate doubts about the Group’s ability to continue as a going concern; as mentioned in aforesaid the Group has taken the following mitigating factors in its assessment of going concern basis of accounting:• Execution of investment agreement dated 8 April 2019
with a new lender to obtain long-term funds upto Rs.9,920 million by way of non-convertible debentures and share warrants to be allotted on preferential basis;
• Settlement of debt and other restructuring activities; and• Increased operational measures towards vaccine and
pharmaceutical formulation business segment.Management has prepared a cash flow forecast for next year taking into cognizance the above developments including the revised repayment schedule on the new debt and performed a sensitivity analysis of the key assumptions used therein to assess whether the Group would have sufficient working capital to finance its operations and to meet its financial obligations as and when they fall due for at least next twelve months from the end of the current reporting date and concluded that the going concern basis of accounting used for the preparation of accompanying consolidated financial statements is appropriate with no material uncertainty.We have considered the assessment of management’s evaluation of going concern basis of accounting as a key audit matter for the current year audit due to the pervasive impact thereof on the financial statements and the significant judgments and assumptions that are inherently subjective and dependent on future events, involved in the preparation of cash flow forecasts and the overall conclusion.
Our audit procedures included, but were not limited to, the following in relation to the assessment of appropriateness of going concern basis of accounting:a) Obtained an understanding of the management’s process
for identifying all the events or conditions that could impact the Group’s ability to continue as a going concern and the process followed to assess the mitigating factors for such events or conditions. Also, obtained an understanding around the methodology adopted by the Group to assess their future business performance, prepare a robust cash flow forecast;
b) Evaluated the design and tested the operating effectiveness of key controls around aforesaid identification of events or conditions and mitigating factors and controls around cash flow forecast prepared by the management;
c) Reconciled the cash flow forecast to the future business plan of the Group as approved by the Board of Directors;
d) In order to corroborate management’s future business plans and to identify potential contradictory information, we read the minutes of the Board of Directors and discussed the same with the management and Audit Committee;
e) Tested the appropriateness of key assumptions adopted by the management in preparation of the cash flow forecasts such as growth rates, expenditure on new products and tested the reasonableness of these assumptions used based on our knowledge and understanding of the business, actual historical results and external data as the case maybe;
f ) Obtained the sensitivity analysis prepared by management and also performed independent sensitivity analysis to test the impact of variation on the cash flows due to change in key assumptions;
g) Reviewed the historical accuracy of the cash flow projections prepared by the management in prior periods;
h) Traced receipt of money through issue of non-convertible debentures subsequent to the year-end to the Holding Company’s bank statements and other supporting documents; and
i) Evaluated the appropriateness and adequacy of the going concern disclosures, in the consolidated financial statements of the Holding Company.
Independent Auditors’ Report on the Consolidated Financial Statements
Key audit matter How the matter was addressed in the audit
Information other than the Consolidated Financial Statements and Auditor’s Report thereon7. The Holding Company’s Board of Directors is responsible for the other information. The other information comprises the
information included in the Annual Report, but does not include the consolidated financial statements and our auditor’s report thereon. The Annual Report is expected to be made available to us after the date of this auditor's report.
Our opinion on the consolidated financial statements does not cover the other information and we will not express any form of assurance conclusion thereon.
In connection with our audit of the consolidated financial statements, our responsibility is to read the other information identified above when it becomes available and, in doing so, consider whether the other information is materially inconsistent with the consolidated financial statements or our knowledge obtained in the audit or otherwise appears to be materially misstated.

Panacea Biotec Ltd. 121
Independent Auditors’ Report on the Consolidated Financial Statements
When we read the Annual Report, if we conclude that there is a material misstatement therein, we are required to communicate the matter to those charged with governance.
Responsibilities of Management and Those Charged with Governance for the Consolidated Financial Statements8. The Holding Company’s Board of Directors is responsible for the matters stated in Section 134(5) of the Act with respect to
the preparation of these consolidated financial statements that give a true and fair view of the consolidated state of affairs (consolidated financial position), consolidated profit or loss (consolidated financial performance including other comprehensive income), consolidated changes in equity and consolidated cash flows of the Group including its joint venture in accordance with the accounting principles generally accepted in India, including the Ind AS specified under Section 133 of the Act. The respective Board of Directors/management of the companies included in the Group and its joint venture are responsible for maintenance of adequate accounting records in accordance with the provisions of the Act for safeguarding of the assets of the Holding Company and for preventing and detecting frauds and other irregularities; selection and application of appropriate accounting policies; making judgments and estimates that are reasonable and prudent; and design, implementation and maintenance of adequate internal financial controls, that were operating effectively for ensuring the accuracy and completeness of the accounting records, relevant to the preparation and presentation of the consolidated financial statements that give a true and fair view and are free from material misstatement, whether due to fraud or error, which have been used for the purpose of preparation of the consolidated financial statements by the Directors of the Holding Company, as aforesaid.
9. In preparing the consolidated financial statements, the respective Board of Directors of the companies included in the Group and of its joint venture are responsible for assessing the ability of the Group and of its joint venture to continue as a going concern, disclosing, as applicable, matters related to going concern and using the going concern basis of accounting unless the Board of Directors either intends to liquidate the Group or to cease operations, or has no realistic alternative but to do so.
10. Those Board of Directors are also responsible for overseeing the financial reporting process of the companies included in the Group and of its joint venture.
Auditor’s Responsibilities for the Audit of the Consolidated Financial Statements11. Our objectives are to obtain reasonable assurance about whether the consolidated financial statements as a whole are free from
material misstatement, whether due to fraud or error, and to issue an auditor’s report that includes our opinion. Reasonable assurance is a high level of assurance, but is not a guarantee that an audit conducted in accordance with Standards on Auditing will always detect a material misstatement when it exists. Misstatements can arise from fraud or error and are considered material if, individually or in the aggregate, they could reasonably be expected to influence the economic decisions of users taken on the basis of these consolidated financial statements.
12. As part of an audit in accordance with Standards on Auditing, we exercise professional judgment and maintain professional scepticism throughout the audit. We also:
• Identify and assess the risks of material misstatement of the consolidated financial statements, whether due to fraud or error, design and perform audit procedures responsive to those risks, and obtain audit evidence that is sufficient and appropriate to provide a basis for our opinion. The risk of not detecting a material misstatement resulting from fraud is higher than for one resulting from error, as fraud may involve collusion, forgery, intentional omissions, misrepresentations, or the override of internal control.
• Obtain an understanding of internal control relevant to the audit in order to design audit procedures that are appropriate in the circumstances. Under Section 143(3)(i) of the Act, we are also responsible for expressing our opinion on whether the Group and its joint venture (covered under the Act) have adequate internal financial controls system in place and the operating effectiveness of such controls.
• Evaluate the appropriateness of accounting policies used and the reasonableness of accounting estimates and related disclosures made by management.
• Conclude on the appropriateness of management’s use of the going concern basis of accounting and, based on the audit evidence obtained, whether a material uncertainty exists related to events or conditions that may cast significant doubt on the ability of the Group and its joint venture to continue as a going concern. If we conclude that a material uncertainty exists, we are required to draw attention in our auditor’s report to the related disclosures in the consolidated financial statements or, if such disclosures are inadequate, to modify our opinion. Our conclusions are based on the audit evidence obtained up to the date of our auditor’s report. However, future events or conditions may cause the Group and its joint venture to cease to continue as a going concern.
• Evaluate the overall presentation, structure and content of the consolidated financial statements, including the disclosures, and whether the consolidated financial statements represent the underlying transactions and events in a manner that achieves fair presentation.
13. We communicate with those charged with governance regarding, among other matters, the planned scope and timing of the audit and significant audit findings, including any significant deficiencies in internal control that we identify during our audit.
14. We also provide those charged with governance with a statement that we have complied with relevant ethical requirements regarding independence, and to communicate with them all relationships and other matters that may reasonably be thought to bear on our independence, and where applicable, related safeguards.

Annual Report 2018-19122
15. From the matters communicated with those charged with governance, we determine those matters that were of most significance in the audit of the consolidated financial statements of the current period and are therefore the key audit matters. We describe these matters in our auditor’s report unless law or regulation precludes public disclosure about the matter or when, in extremely rare circumstances, we determine that a matter should not be communicated in our report because the adverse consequences of doing so would reasonably be expected to outweigh the public interest benefits of such communication.
Other Matter16. We did not audit the financial statements / financial information of 11 subsidiaries, whose financial statements / financial
information reflect total assets of ₹3,227 million and net assets of ₹ 2,220 million as at 31 March 2019, total revenues of ₹ 363 million and net cash outflows amounting to ₹ 20.81 million for the year ended on that date, as considered in the consolidated financial statements. The consolidated financial statements also include the Group’s share of net profit (including other comprehensive income) of ₹ 1.5 million for the year ended 31 March 2019, as considered in the consolidated financial statements, in respect of one joint venture, whose financial statements / financial information have not been audited by us. These financial statements / financial information have been audited by other auditors whose reports have been furnished to us by the management and our opinion on the consolidated financial statements, in so far as it relates to the amounts and disclosures included in respect of these subsidiaries and joint venture, and our report in terms of sub-section (3) of Section 143 of the Act, in so far as it relates to the aforesaid subsidiaries and joint venture, is based solely on the reports of the other auditors.
Our opinion above on the consolidated financial statements, and our report on other legal and regulatory requirements below, are not modified in respect of the above matter with respect to our reliance on the work done by and the reports of the other auditors.
17. We did not audit the financial statements / financial information of two subsidiaries, whose financial statements / financial information reflects total assets of ₹ 1 million and net liabilities of ₹ 793 million as at 31 March 2019, total revenues of Nil and net cash inflows amounting to ₹ 0.98 million for the year ended on that date, as considered in the consolidated financial statements. These financial statements are / financial information are unaudited and have been furnished to us by the management and our opinion on the consolidated financial statements, and matters identified and disclosed under key audit matters section above and our report in terms of sub-section (3) of Section 143 of the Act in so far as it relates to the aforesaid subsidiaries, are based solely on such unaudited financial statements / financial information. In our opinion and according to the information and explanations given to us by the management, these financial statements /financial information are not material to the Group.
Our opinion above on the consolidated financial statements, and our report on other legal and regulatory requirements below, are not modified in respect of the above matter with respect to our reliance on the financial statements/financial information certified by the management.
Report on Other Legal and Regulatory Requirements18. As required by Section 197(16) of the Act, we report that the Holding Company has paid remuneration to its directors during the
year which is in excess of the limits laid down under Section 197 read with Schedule V to the Act.
19. As required by Section 143 (3) of the Act, based on our audit and on the consideration of the reports of the other auditors on separate financial statements and other financial information of the subsidiaries and joint venture, we report, to the extent applicable, that:
a) we have sought and obtained all the information and explanations which to the best of our knowledge and belief were necessary for the purpose of our audit of the aforesaid consolidated financial statements;
b) in our opinion, proper books of account as required by law relating to preparation of the aforesaid consolidated financial statements have been kept so far as it appears from our examination of those books and the reports of the other auditors;
c) the consolidated financial statements dealt with by this report are in agreement with the relevant books of account maintained for the purpose of preparation of the consolidated financial statements;
d) in our opinion, the aforesaid consolidated financial statements comply with Ind AS specified under Section 133 of the Act;
e) on the basis of the written representations received from the directors of the Holding Company and taken on record by the Board of Directors of the Holding Company and the reports of the other statutory auditors of its subsidiary companies, and joint venture company covered under the Act, none of the directors of the Group companies and joint venture company covered under the Act, are disqualified as on 31 March 2019 from being appointed as a director in terms of Section 164(2) of the Act;
f ) with respect to the adequacy of the internal financial controls over financial reporting of the Holding Company, and its subsidiary companies and joint venture company covered under the Act, and the operating effectiveness of such controls, refer to our separate report in ‘Annexure A’; and
g) with respect to the other matters to be included in the Auditor’s Report in accordance with rule 11 of the Companies (Audit and Auditors) Rules, 2014 (as amended), in our opinion and to the best of our information and according to the explanations given to us and based on the consideration of the report of the other auditors on separate financial statements as also the other financial information of the subsidiaries and joint venture.
Independent Auditors’ Report on the Consolidated Financial Statements

Panacea Biotec Ltd. 123
Independent Auditors’ Report on the Consolidated Financial Statements
i. the consolidated financial statements disclose the impact of pending litigations on the consolidated financial position of the Group and its joint venture as detailed in Note 40(A) to the consolidated financial statements;
ii. the Group and its joint venture did not have any long-term contracts including derivative contracts for which there were any material foreseeable losses as at 31 March 2019;
iii. there has been no delay in transferring amounts, required to be transferred, to the Investor Education and Protection Fund by the Holding Company, its subsidiaries and its joint ventures during the year ended 31 March 2019; and
iv. the disclosure requirements relating to holdings as well as dealings in specified bank notes were applicable for the period from 8 November 2016 to 30 December 2016, which are not relevant to these consolidated financial statements. Hence, reporting under this clause is not applicable.
For Walker Chandiok & Co LLP Chartered Accountants Firm’s Registration No.: 001076N/N500013
Anupam KumarPlace : New Delhi Partner Date : May 30, 2019 Membership No.: 501531
Annexure A
Independent Auditors' Report on the Internal Financial Controls under Clause (i) of Sub-section 3 of Section 143 of the Companies Act, 2013 (‘the Act’)
1. In conjunction with our audit of the consolidated financial statements of Panacea Biotec Limited (‘the Holding Company’) and its subsidiaries (the Holding Company and its subsidiaries together referred to as ‘the Group’) and joint venture as at and for the year ended 31 March 2019, we have audited the internal financial controls over financial reporting (‘IFCoFR’) of the Holding Company, its subsidiary companies and joint venture company, which are companies covered under the Act, as at that date.
Management’s Responsibility for Internal Financial Controls
2. The respective Board of Directors of the Holding Company, its subsidiary companies and its joint venture company, which are companies covered under the Act, are responsible for establishing and maintaining internal financial controls based on internal control over financial reporting criteria established by the Company considering the essential components of internal control stated in the Guidance Note on Audit of Internal Financial Controls over Financial Reporting (the “Guidance Note”) issued by the Institute of Chartered Accountants of India (“ICAI”). These responsibilities include the design, implementation and maintenance of adequate internal financial controls that were operating effectively for ensuring the orderly and efficient conduct of the company’s business, including adherence to the company’s policies, the safeguarding of its assets, the prevention and detection of frauds and errors, the accuracy and completeness of the accounting records, and the timely preparation of reliable financial information, as required under the Act.
Auditor’s Responsibility
3. Our responsibility is to express an opinion on the IFCoFR of the Holding Company, its subsidiary companies and its joint venture company, as aforesaid, based on our audit. We conducted our audit in accordance with the Standards on Auditing issued by ICAI and deemed to be prescribed under Section 143(10) of the Act, to the extent applicable to an audit of IFCoFR, and the Guidance Note issued by the ICAI. Those Standards and the Guidance Note require that we comply with ethical requirements and plan and perform the audit to obtain reasonable assurance about whether adequate IFCoFR were established and maintained and if such controls operated effectively in all material respects.
4. Our audit involves performing procedures to obtain audit evidence about the adequacy of the IFCoFR and their operating effectiveness. Our audit of IFCoFR includes obtaining an understanding of IFCoFR, assessing the risk that a material weakness exists, and testing and evaluating the design and operating effectiveness of internal control based on the assessed risk. The procedures selected depend on the auditor’s judgement, including the assessment of the risks of material misstatement of the financial statements, whether due to fraud or error.
5. We believe that the audit evidence we have obtained and the audit evidence obtained by the other auditors in terms of their reports referred to in the Other Matter paragraph below, is sufficient and appropriate to provide a basis for our audit opinion on the IFCoFR of the Holding Company, its subsidiary companies and its joint venture company as aforesaid.

Annual Report 2018-19124
Independent Auditors’ Report on the Consolidated Financial Statements
Meaning of Internal Financial Controls over Financial Reporting
6. A company's IFCoFR is a process designed to provide reasonable assurance regarding the reliability of financial reporting and the preparation of financial statements for external purposes in accordance with generally accepted accounting principles. A company's IFCoFR include those policies and procedures that (1) pertain to the maintenance of records that, in reasonable detail, accurately and fairly reflect the transactions and dispositions of the assets of the company; (2) provide reasonable assurance that transactions are recorded as necessary to permit preparation of financial statements in accordance with generally accepted accounting principles, and that receipts and expenditures of the company are being made only in accordance with authorisations of management and directors of the company; and (3) provide reasonable assurance regarding prevention or timely detection of unauthorised acquisition, use, or disposition of the company's assets that could have a material effect on the financial statements.
Inherent Limitations of Internal Financial Controls over Financial Reporting
7. Because of the inherent limitations of IFCoFR, including the possibility of collusion or improper management override of controls, material misstatements due to error or fraud may occur and not be detected. Also, projections of any evaluation of the IFCoFR to future periods are subject to the risk that the IFCoFR may become inadequate because of changes in conditions, or that the degree of compliance with the policies or procedures may deteriorate.
Opinion
8. In our opinion and based on the consideration of the reports of the other auditors on IFCoFR of the subsidiary companies and its joint venture company, the Holding Company, its subsidiary companies and its joint venture company, which are companies covered under the Act, have in all material respects, adequate internal financial controls over financial reporting and such controls were operating effectively as at 31 March 2019, based on internal control over financial reporting criteria established by the Company considering the essential components of internal control in the Guidance Note issued by ICAI.
Other Matters
9. We did not audit the IFCoFR in so far as it relates to 11 subsidiary companies, which are companies covered under the Act, whose financial statements/financial information reflect total assets of ₹3,023.81 million and net assets of ₹2,598.03 million as at 31 March 2019, total revenues of ₹228.33 million and net cash outflows amounting to ₹ 4.20 million for the year ended on that date, as considered in the consolidated financial statements. The consolidated financial statements also include the Group’s share of net profit {(including other comprehensive income) of ₹1.49 million for the year ended 31 March 2019, in respect of a joint venture company, which is a company covered under the Act, whose IFCoFR have not been audited by us. The IFCoFR in so far as it relates to such subsidiary companies and its joint venture company have been audited by other auditors whose reports have been furnished to us by the management and our report on the adequacy and operating effectiveness of the IFCoFR for the Holding Company, its subsidiary companies and its joint venture company, as aforesaid, under Section 143(3)(i) of the Act in so far as it relates to such subsidiary companies and its joint venture company is based solely on the reports of the auditors of such companies. Our opinion is not modified in respect of this matter with respect to our reliance on the work done by and on the reports of the other auditors.
For Walker Chandiok & Co LLP Chartered Accountants Firm’s Registration No.: 001076N/N500013
Anupam KumarPlace : New Delhi Partner Date : May 30, 2019 Membership No.: 501531

Panacea Biotec Ltd. 125
Consolidated Balance Sheet As at March 31, 2019
(Rs. in million)
NoteNo.
As atMarch 31, 2019
As atMarch 31, 2018
ASSETSNon-current assets
a) Property, plant and equipment 2.1 8,031.08 9,428.75 b) Capital work-in-progress 2.2 83.92 75.20 c) Goodwill - 8.96 d) Other intangible assets 2.3 24.55 52.00 e) Intangible assets under development 2.4 141.15 324.05 f ) Investments accounted for using the equity method 56 52.59 51.77 g) Financial assets
i) Investments 3 0.70 0.70 ii) Loans 4 11.66 10.43 iii) Other financial assets 5 11.19 52.66
h) Deferred tax assets (net) 6 197.90 196.63 i) Income tax assets (net) 7 19.66 49.10 j) Other non-current assets 8 101.94 221.85
Total non-current assets 8,676.34 10,472.10 Current assets
a) Inventories 9 814.27 3,342.06 b) Financial assets
i) Investments 10 - 20.29 ii) Trade receivables 11 887.30 1,360.10 iii) Cash and cash equivalents 12 144.66 164.37 iv) Other bank balances 13 90.14 68.00 v) Loans 14 181.31 353.10 vi) Other financial assets 15 35.70 51.70
c) Other current assets 16 261.08 243.84 Total current assets 2,414.46 5,603.46 Assets classified as held for sale and discontinued operations 41 2,664.40 - Total assets 13,755.20 16,075.56
EQUITY AND LIABILITIESEquity
a) Equity share capital 17 61.25 61.25 b) Other equity 18 3,442.72 3,025.50
Equity attributable to owners of Company 3,503.97 3,086.75 Non-controlling interest (30.09) (29.49)Total equity 3,473.88 3,057.26 LiabilitiesNon-current liabilities
a) Financial liabilitiesBorrowings 19 461.22 5,707.08
b) Provisions 20 397.80 265.39 c) Deferred tax liabilities (net) 6 - 92.57d) Other non-current liabilities 21 39.69 42.92
Total non-current liabilities 898.71 6,107.96 Current liabilities
a) Financial liabilitiesi) Borrowings 22 693.85 1,648.85 ii) Trade payables 23 - Outstanding dues of micro, small and medium enterprises 18.80 34.71 - Outstanding dues of creditors other than above 2,678.30 2,737.24 iii) Other financial liabilities 24 5,395.89 2,222.74
b) Other current liabilities 25 151.39 197.29 c) Provisions 26 64.43 69.43 d) Current tax liabilities (net) 27 74.75 0.08
Total current liabilities 9,077.41 6,910.34 Liabilities directly associated with discontinued operations 41 305.20 - Total equity and liabilities 13,755.20 16,075.56
- - Summary of significant accounting policies 1
The accompanying notes 1 to 64 are an integral part of the consolidated financial statements.This is the Consolidated Balance Sheet referred to in our report of even date.
For Walker Chandiok & Co LLP For and on behalf of Board of Directors of Panacea Biotec LimitedChartered AccountantsFirm Registration No. 001076N/N500013
Anupam Kumar Soshil Kumar Jain Dr. Rajesh JainPartner Chairman Managing DirectorMembership No. 501531 (DIN 00012812) (DIN 00013053)
Vinod Goel Devender GuptaPlace : New Delhi Group CFO and Head Legal Chief Financial Officer & Date : May 30, 2019 & Company Secretary Head Information Technology

Annual Report 2018-19126
Consolidated Statement of Profit and Loss For the Year ended March 31, 2019
(Rs. in million)
NoteNo.
For the year endedMarch 31, 2019
For the year endedMarch 31, 2018
Continuing operationsIncomeRevenue from operations 28 4,566.96 5,961.61 Other income 29 44.83 77.86 Total income 4,611.79 6,039.47 ExpensesCost of materials consumed 30 1,258.67 1,796.29 Purchases of stock-in-trade 31 91.93 183.49 Changes in inventories of finished goods, stock-in-trade and work-in-progress 32 371.83 (107.29)Excise duty - 33.67 Employee benefits expense 33 1,470.80 1,515.92 Finance costs 34 1,048.29 1,005.78 Depreciation and amortisation expense 35 540.02 572.82 Other expenses 36 2,685.67 1,678.21 Total expenses 7,467.21 6,678.89 Profit/(loss) before share of profit of joint venture, exceptional items and tax from continuing operations (2,855.42) (639.42)
Share of profit of joint venture accounted for using the equity method 1.49 2.07 Profit/(loss) before exceptional items and tax from continuing operations (2,853.93) (637.35)Exceptional items 37 3,340.08 - Profit/(loss) before tax from continuing operations 486.15 (637.35)Tax expense 38Current tax 75.47 10.91 Deferred tax 1.60 87.67 Total tax expense 77.07 98.58 Profit/(loss) for the year from continuing operations 409.08 (735.93)Discontinued OperationsProfit/(loss) before tax from discontinued operations 41 (23.90) (24.04)Tax expense of discontinued operations 8.51 - Profit/(loss) after tax from discontinued operations (32.41) (24.04)Profit/(loss) for the year 376.67 (759.97)Other comprehensive incomeA. Items that will not be reclassified to profit or loss:Remeasurements of net defined benefit plans (10.01) (21.83)Income tax relating to items that will not be reclassified to profit or loss 3.50 7.63 B. Items that will be reclassified to profit or loss:Foreign currency translation reserve 1.90 77.24 Income tax relating to items that will be reclassified to profit or loss - - Total other comprehensive income (net of tax) (4.61) 63.04 Total comprehensive income for the year 372.06 (696.93)Profit / (loss) for the yearAttributable to :Owners of Parent 377.27 (739.78)Non-controlling interest 56 (0.60) (20.19)Other Comprehensive income for the yearAttributable to :Owners of Parent 56 (4.61) 63.06 Non-controlling interest - (0.02)Total comprehensive income for the yearOwners of Parent 372.66 (676.72)Non-controlling interest 56 (0.60) (20.21)Earnings per equity share for continuing operations (face value of Re.1 each) 39 - Basic and diluted earnings per equity share (in Rs.) 6.68 (12.02)Earnings per equity share for discontinued operations (face value of Re.1 each) - Basic and diluted earnings per equity share (in Rs.) (0.53) (0.39)Earnings per equity share (for continuing and discontinued operations) (face value of Re.1 each) - Basic and diluted earnings per equity share (in Rs.) 6.15 (12.41)Summary of significant accounting policies 1
The accompanying notes 1 to 64 are an integral part of the consolidated financial statements.This is the Consolidated Statement of Profit and Loss referred to in our report of even date.
For Walker Chandiok & Co LLP For and on behalf of Board of Directors of Panacea Biotec LimitedChartered AccountantsFirm Registration No. 001076N/N500013
Anupam Kumar Soshil Kumar Jain Dr. Rajesh JainPartner Chairman Managing DirectorMembership No. 501531 (DIN 00012812) (DIN 00013053)
Vinod Goel Devender GuptaPlace : New Delhi Group CFO and Head Legal Chief Financial Officer & Date : May 30, 2019 & Company Secretary Head Information Technology

Panacea Biotec Ltd. 127
Consolidated Cash Flow Statement Annexed to the Balance Sheet for the Year ended March 31, 2019(Indirect Method)
(Rs. in million)
Note No.
For the year ended March 31, 2019
For the year ended March 31, 2018
A. Cash flow from operating activitiesProfit/(loss) before tax from continuing operations 486.15 (637.35)Profit/(loss) before tax from discontinued operations (23.90) (24.04)Adjustment forDepreciation and amortisation expense 550.32 585.33 Finance costs 1,048.30 1,005.79 Allowance for expected credit loss and doubtful advances 47.87 2.52 Interest income (10.91) (11.65)Bad debts and advances written off 71.22 - Property, plant and equipments written off 318.57 - Loss/(gain) on sale of property, plant and equipment (net) 5.19 0.08 Excess provisions written back (2.92) (45.18)Unrealized foreign exchange loss (net) 168.70 130.22 Dividend income (1.67) (0.89)Intangibles assets under development provided/written off 233.86 - Adjustment on settlement of debts (refer note 60) (3,133.49) - Operating profit before working capital changes (242.71) 1,004.83 Changes in working capitalInventories 847.63 (188.32)Trade receivables 347.35 44.61 Other financial assets (170.28) (2.25)Loans 163.24 (248.28)Other current assets (78.29) 225.05 Trade payables 75.06 312.74 Other financial liabilities 4.93 41.14 Other current liabilities (47.19) (11.64)Provisions 130.76 41.43 Cash flow from operating activities post working capital changes 1,030.50 1,219.32 Income tax (paid)/refund (net) 18.28 (39.08)Net cash flow from operating activities (A) 1,048.78 1,180.24
B. Cash flow from investing activitiesPurchase of property, plant and equipment and intangible assets (including capital work in progress, intangibles under development, capital advances and creditors for capital goods) (47.83) (152.16)
Proceeds from sale of property, plant and equipment - 0.13 Proceeds from sale of investments 20.29 22.08 Purchase of investment (6.97) (20.00)Investments accounted for using the equity method (0.82) (1.15)Interest received 10.91 (1.47)Dividend received 1.67 0.02 Investment in shares of subsidiary - (79.73)Realisation from sale of subsidiary - 803.95 Investments in bank deposits having original maturity of more than three months (30.77) (18.73)Net cash used in investing activities (B) (53.52) 552.94
C. Cash flow from financing activitiesProceeds from non-current borrowings - 57.97 Repayment of non-current borrowings (155.37) (348.15)Proceeds from current borrowings - 39.96 Repayment of current borrowings (192.13) (298.30)Interest paid (663.90) (1,094.97)Net cash used in financing activities (C) (1,011.40) (1,643.49)Increase /(Decrease) in net cash and cash equivalents (A+B+C) (16.14) 89.69 Cash and cash equivalents at the beginning of the year 164.37 74.68 Movement in cash and cash equivalents pertaining to discontinued operations (3.57) - Cash and cash equivalents at the end of the year (refer note 12) 144.66 164.37 Summary of significant accounting policies 1
The accompanying notes 1 to 64 are an integral part of the consolidated financial statements.This is the Consolidated Cash Flow Statement referred to in our report of even date.
For Walker Chandiok & Co LLP For and on behalf of Board of Directors of Panacea Biotec LimitedChartered AccountantsFirm Registration No. 001076N/N500013
Anupam Kumar Soshil Kumar Jain Dr. Rajesh JainPartner Chairman Managing DirectorMembership No. 501531 (DIN 00012812) (DIN 00013053)
Vinod Goel Devender GuptaPlace : New Delhi Group CFO and Head Legal Chief Financial Officer & Date : May 30, 2019 & Company Secretary Head Information Technology

Annual Report 2018-19128
Consolidated Statement of Changes in Equity for the year ended March 31, 2019
A. Equity share capital(Rs. in million)
Opening Balance as at April 01, 2017 61.25
Changes during the year -
Closing balance as at March 31, 2018 61.25
Change during the year -
Closing balance as at March 31, 2019 61.25
B. Other equity(Rs. in million)
Equity component
of compound
financial instruments
Attributable to owners of Panacea Biotec Limited Other comprehensive
income
Total other equity
Non-controlling
interests
Total Reserves and surplus
Retained earnings
General reserve
Securities premium account
Capital redemption
reserve
Foreign currency
monetary item
translation difference account
Foreign currency
translation account
Balance as at April 1, 2017 96.39 1,116.22 474.99 919.40 1,022.34 (100.25) (33.69) 3,495.40 105.40 3,600.80
Profit/(Loss) for the year - (739.78) - - - - - (739.78) (20.19) (759.97)
Other comprehensive income for the year (net of tax)
- (14.18) - - - - 77.24 63.06 (0.02) 63.04
Total comprehensive income for the year
- (753.96) - - - - 77.24 (676.72) (20.21) (696.93)
Changes during the period - - - - - 55.69 - 55.69 - 55.69
Transferred to retained earning on disposal of subsidiary
- 151.13 - - - - - 151.13 (114.68) 36.45
Balance as at March 31, 2018 96.39 513.39 474.99 919.40 1,022.34 (44.56) 43.55 3,025.50 (29.49) 2,996.01
Balance as at April 1, 2018 96.39 513.39 474.99 919.40 1,022.34 (44.56) 43.55 3,025.50 (29.49) 2,996.01
Profit/(Loss) for the year - 377.27 - - - - - 377.27 (0.60) 376.67
Other comprehensive income for the year (net of tax)
- (6.51) - - - - 1.90 (4.61) - (4.61)
Total comprehensive income for the year
- 370.76 - - - - 1.90 372.66 (0.60) 372.06
Changes during the period - - - - - 44.56 - 44.56 - 44.56
Balance as at March 31, 2019 96.39 884.15 474.99 919.40 1,022.34 - 45.45 3,442.72 (30.09) 3,412.63
Summary of significant accounting policies (Refer note 1)
The accompanying notes 1 to 64 are an integral part of the consolidated financial statements.This is the Consolidated Statement of Changes in Equity referred to in our report of even date.
For Walker Chandiok & Co LLP For and on behalf of Board of Directors of Panacea Biotec LimitedChartered AccountantsFirm Registration No. 001076N/N500013
Anupam Kumar Soshil Kumar Jain Dr. Rajesh JainPartner Chairman Managing DirectorMembership No. 501531 (DIN 00012812) (DIN 00013053)
Vinod Goel Devender GuptaPlace : New Delhi Group CFO and Head Legal Chief Financial Officer & Date : May 30, 2019 & Company Secretary Head Information Technology

Panacea Biotec Ltd. 129
Summary of significant accounting policies for the year ended March 31, 2019
1. Corporate information Panacea Biotec Limited (Corporate identification number: L33117PB1984PLC022350) (“the Holding company”) is a public company incorporated and domiciled in India. The Holding Company’s shares are listed with Bombay Stock Exchange Limited and National Stock Exchange of India Limited. The Holding Company is one of India’s leading research based biotechnology companies engaged in the business of research, development, manufacture and marketing of branded pharmaceutical formulations and vaccines.The Holding Company has its registered place of business at Ambala-Chandigarh Highway Lalru-140501, Punjab, India.The Holding Company, its subsidiaries and its joint venture (jointly referred to as “the Group” herein under) considered in these consolidated financial statements.
1.1 Basis of preparationThe consolidated financial statements (‘Consolidated Financial Statements’) of the Group have been prepared in accordance with Indian Accounting Standards (Ind AS) as notified by Ministry of Corporate Affairs pursuant to section 133 of the Companies Act, 2013 read with Rule 3 of the Companies (Indian Accounting Standards) Rules, 2015 and other relevant provisions of the Act, as amended from time to time.The Consolidated Financial Statements of the Group were approved by the Board of Directors on May 30, 2019. Revision to the financial statements is permitted by the Board of Directors after obtaining necessary approvals or at the instance of regulatory authorities, as per the provision of the Act.For all periods up to and including the year ended March 31, 2017, the Group prepared its consolidated financial statements in accordance with accounting standards notified under the section 133 of the Companies Act 2013, read together with paragraph 7 of the Companies (Accounts) Rules, 2014 which is considered as “Previous GAAP”. The financial statements for the year ended March 31, 2018 are the first Ind AS Financial statements of the Group. The Consolidated Financial Statements have been prepared on a historical cost basis, except for the following assets and liabilities which have been measured at fair value:• Certain financial assets and liabilities measured at fair value (refer accounting policy regarding financial instruments); and• Defined benefit plans – plan assets measured at fair value.New and amended standards adopted by the Group:The Group has applied the following standards and amendments for the first time for their annual reporting period commencing April 1, 2018:• Ind AS 115, Revenue from Contracts with Customers• Amendment to Ind AS 20, Accounting for Government Grants and Disclosure of Government Assistance• Appendix B, Foreign Currency Transactions and Advance Consideration to Ind AS 21, The Effects of Changes in Foreign Exchange Rates• Amendment to Ind AS 12, Income Taxes• Amendment to Ind AS 40, Investment Property• Amendment to Ind AS 28, Investments in Associates and Joint Ventures and Ind AS 112, Disclosure of Interests in Other EntitiesThese amendments did not have any impact on the amounts recognised in prior periods and are not expected to significantly affect the current or future periods.
1.2 Basis of consolidation Subsidiaries Subsidiaries are all entities (including structured entities) over which the Group has control. The Group controls an entity when the Group is exposed to, or has rights to, variable returns from its involvement with the entity and has the ability to affect those returns through its power to direct the relevant activities of the entity. Subsidiaries are fully consolidated from the date on which control is transferred to the Group. They are deconsolidated from the date that control ceases. Profit/ (loss) and Other Comprehensive Income (‘OCI’) of subsidiaries acquired or disposed of during the period are recognised from the effective date of acquisition, or up to the effective date of disposal, as applicable. All the consolidated subsidiaries have a consistent reporting date of March 31, 2019. The Group combines the financial statements of the parent and its subsidiaries line by line adding together like items of assets, liabilities, equity, income and expenses. Inter-company transactions, balances and unrealised gains on transactions between group companies are eliminated. Unrealised losses are also eliminated unless the transaction provides evidence of an impairment of the transferred asset. Accounting policies of subsidiaries have been changed where necessary to ensure consistency with the policies adopted by the Group. Non-controlling interests, presented as part of equity, represent the portion of a subsidiary’s statement of profit and loss and net assets that is not held by the Group. Profit/(loss) and each component of OCI are attributed to the equity holders of the parent company and to the non-controlling interests, even if this results in the non-controlling interests having a deficit balance. The Group attributes total comprehensive income or loss of the subsidiaries between the owners of the parent and the non-controlling interests based on their respective ownership interests. Joint ventures Investments in joint arrangements are classified as either Joint operations or Joint ventures. The classification depends on the contractual rights and obligations of each investor, rather than the legal structure of the Joint arrangement. Joint ventures – Interest in joint venture are accounted for using the equity method, after initially being recognised at cost. The carrying amount of the investment is adjusted thereafter for the post acquisition change in the share of net assets of the investee, adjusted where necessary to ensure consistency with the accounting policies of the Group. The Consolidated Statement of Profit and Loss includes the Group’s share of the results of the operations of the investee. Dividends received or receivable from joint ventures are recognised as a reduction in the carrying amount of the investment. Unrealised gains on transactions between the Group and joint ventures are eliminated to the extent of the Group’s interest in these entities. When the Group’s share of losses in an equity-accounted investment equals or exceeds its interest in the entity, including any other unsecured long-term receivables, the Group does not recognize further losses, unless it has incurred obligations or made payments on behalf of the other entity.
1.3 Use of estimatesThe preparation of the Consolidated Financial statements in conformity with Ind AS requires management to make estimates, judgments and assumptions. These estimates, judgments and assumptions affect the application of accounting policies and the reported amounts of assets and

Annual Report 2018-19130
Summary of significant accounting policies for the year ended March 31, 2019
liabilities, the disclosures of contingent assets and liabilities at the date of the financial statements and reported amounts of revenues and expenses during the period. Application of accounting policies that require critical accounting estimates involving complex and subjective judgments and the use of assumptions in these Consolidated Financial Statements have been disclosed in note 1.5. Accounting estimates could change from period to period. Actual results could differ from those estimates. Appropriate changes in estimates are made as management becomes aware of changes in circumstances surrounding the estimates. Changes in estimates are reflected in the financial statements in the period in which changes are made and, if material, their effects are disclosed in the notes to the financial statements.
1.4 Significant accounting policiesThe significant accounting policies that are used in the preparation of the Consolidated Financial Statements are summarised below. These accounting policies are consistently used throughout the periods presented in the Consolidated Financial Statements.a) Current versus non-current classification
All assets and liabilities have been classified as current or noncurrent as per the Group’s normal operating cycle and other criteria set out in the Schedule III to the 2013 Act. The Group presents assets and liabilities in the balance sheet based on current/ non-current classification. An asset is treated as current when it is:• Expected to be realised or intended to be sold or consumed in normal operating cycle*• Held primarily for the purpose of trading• Expected to be realised within twelve months after the reporting period, or• Cash or cash equivalent unless restricted from being exchanged or used to settle a liability for at least twelve months after the reporting
period.All other assets are classified as non-current. A liability is current when:• It is expected to be settled in normal operating cycle*• It is held primarily for the purpose of trading• It is due to be settled within twelve months after the reporting period, or • There is no unconditional right to defer the settlement of the liability for at least twelve months after the reporting periodThe Group classifies all other liabilities as non-current.Deferred tax assets and liabilities are classified as non-current assets and liabilities.*Based on the nature of products and the time between acquisition of assets for processing and their realisation in cash and cash equivalents, the Group has ascertained its operating cycle as 12 months for the purpose of current or non-current classification of assets and liabilities.
b) InventoryInventories are valued as follows:Raw material, components, stores and sparesRaw materials (including packing materials), components, stores and spares are valued at lower of cost or net realisable value. However, materials and other items held for use in the production of inventories are not written down below cost if the finished products in which they will be incorporated are expected to be sold at or above cost. Cost of raw materials, components and stores and spares is determined on a weighted average basis. Stores and spares having useful life of more than twelve months are capitalised as “Property, plant and equipment” and are depreciated prospectively over their remaining useful lives in accordance with Ind AS 16.Work in progress and finished goodsWork in progress and finished goods are valued at lower of cost or net realisable value. Cost includes raw material cost and a proportion of direct and indirect overheads up to estimated stage of completion. Cost is determined on a weighted average basis.Traded goodsTraded goods are valued at lower of cost or net realisable value. Cost includes cost of purchase and other cost incurred in bringing the inventories to their present location and condition. Cost is determined on weighted average basis.Net realisable value is the estimated selling price in the ordinary course of business, less estimated costs of completion and estimated costs necessary to make the sale.
c) Property, plant and equipmentRecognition and initial measurement Items of property, plant and equipment are measured at cost less accumulated depreciation and accumulated impairment losses. The cost comprises purchase price, borrowing cost if capitalisation criteria are met and directly attributable cost of bringing the asset to its working condition for the intended use. Any trade discount and rebates are deducted in arriving at the purchase price. Subsequent costs are included in the asset’s carrying amount or recognised as a separate asset, as appropriate, only when it is probable that future economic benefits attributable to such subsequent cost associated with the item will flow to the Group. All other repair and maintenance costs are recognised in statement of profit or loss as incurred.The cost of replacing part of an item of property, plant and equipment is recognised in the carrying amount of the item if it is probable that the future economic benefits embodied within the part will flow to the Group and its cost can be measured reliably. The costs of repairs and maintenance are recognised in the statement of profit and loss as incurred.Subsequent measurement (depreciation and useful lives)Depreciation on property, plant and equipment is provided on the straight line method arrived on the basis of the useful life prescribed under Schedule II of the Act. The following useful life of assets has been determined by the Group:

Panacea Biotec Ltd. 131
Particulars Useful lifeBuilding – factory 30 yearsBuilding – Non-factory 60 yearsPlant and Equipment 15 years and 20 yearsFurniture and fixtures 10 yearsVehicles 8 yearsOffice equipment 5 yearsComputer equipment 3 years and 6 years
i) Leasehold land is amortised over the period of lease.ii) Leasehold improvements are amortised over the initial period of lease or useful life, whichever is shorter.The residual values, useful lives and method of depreciation are reviewed at each financial year end and adjusted prospectively, if appropriate.Where, during any financial year, any addition has been made to any asset, or where any asset has been sold, discarded, demolished or destroyed, or significant components replaced; depreciation on such assets is calculated on a pro rata basis as individual assets with specific useful life from the month of such addition or, as the case may be, up to the month on which such asset has been sold, discarded, demolished or destroyed or replaced.De-recognition An item of property, plant and equipment and any significant part initially recognised is de-recognised upon disposal or when no future economic benefits are expected from its use or disposal. Any gain or loss arising on de-recognition of the asset (calculated as the difference between the net disposal proceeds and the carrying amount of the asset) is included in the statement of profit and loss when the asset is derecognized.
d) Intangible assetsRecognition and initial measurementResearch and development costs Expenditure on the research phase of projects is recognised as an expense as incurred. Costs that are directly attributable to a project’s development phase are recognised as intangible assets, provided the Group can demonstrate the following:• the technical feasibility of completing the intangible asset so that it will be available for use.• its intention to complete the intangible asset and use or sell it • its ability to use or sell the intangible asset • how the intangible asset will generate probable future economic benefits • the availability of adequate technical, financial and other resources to complete the development and to use or sell the intangible asset. • its ability to measure reliably the expenditure attributable to the intangible asset during its development.Development costs not meeting these criteria for capitalisation are expensed as incurred. Directly attributable costs include employee costs incurred on development of prototypes along with an appropriate portion of relevant overheads and borrowing costsOther intangiblesIntangible assets acquired separately are measured on initial recognition at cost. Following initial recognition, intangible assets are carried at cost less accumulated amortisation and accumulated impairment losses, if any. Internally generated intangible assets, excluding product development costs, are not capitalised and expenditure is reflected in the statement of profit and loss in the year in which the expenditure is incurred.Subsequent measurement (Amortisation and useful lives)All finite-lived intangible assets, including internally developed intangible assets, are accounted for using the cost model whereby capitalised costs are amortised on a straight-line basis over their estimated useful lives. Residual values and useful lives are reviewed at each reporting date and any change in the same is accounted for prospectively. The following useful lives are applied:
Intangible assets Amortisation periodPatents, trademarks and designs 7 yearsProduct development 5 YearsTechnical know-how 5 yearsSoftware 5 yearsWebsites 2 years
De-recognitionGains or losses arising from de-recognition of an intangible asset are measured as the difference between the net disposal proceeds and the carrying amount of the asset and are recognised in the statement of profit or loss when the asset is derecognised.
e) Assets classified as held-for-saleAssets are classified as held-for-sale if their carrying amount will be recovered principally through a sale transaction rather than through continuing use and a sale is considered highly probable. They are measured at the lower of their carrying amount and fair value less costs to sell.Assets classified as held for sale are not depreciated or amortised. Interest and other expenses attributable to the liabilities of a disposal group classified as held-for-sale continue to be recognised. Assets classified as held-for-sale are presented separately from the other assets in the balance sheet. The liabilities of a disposal group classified as held-for-sale are presented separately from other liabilities in the balance sheet.
Summary of significant accounting policies for the year ended March 31, 2019

Annual Report 2018-19132
Summary of significant accounting policies for the year ended March 31, 2019
f) Impairment of non-financial assetsThe carrying amounts of the Group’s non-financial assets, other than inventories and deferred tax assets are reviewed at each reporting date to determine whether there is any indication of impairment. If any such indication exists, then the asset’s recoverable amount is estimated. Goodwill and intangible assets that have indefinite lives or that are not yet available for use are tested for impairment annually; their recoverable amount is estimated annually each year at the reporting date.For the purpose of impairment testing, assets are grouped together into the smallest group of assets that generates cash inflows from continuing use that are largely independent of the cash inflows of other assets or groups of assets (the ‘cash-generating unit’). The recoverable amount of an asset or cash-generating unit is the greater of its value in use or its fair value less costs to sell. In assessing value in use, the estimated future cash flows are discounted to their present value using a pre-tax discount rate that reflects current market assessments of the time value of money and the risks specific to the asset. The goodwill acquired in a business combination is, for the purpose of impairment testing, allocated to cash-generating units that are expected to benefit from the synergies of the combination. Intangibles with indefinite useful lives are tested for impairment individually. An impairment loss is recognised if the carrying amount of an asset or its cash-generating unit exceeds its estimated recoverable amount. Impairment losses recognised in respect of cash-generating units are allocated first to reduce the carrying amount of any goodwill allocated to the units and then to reduce the carrying amount of the other assets in the unit on a pro-rata basis. Impairment losses are recognised in the statement of profit and loss. Impairment losses recognised in prior periods are assessed at each reporting date for any indications that the loss has decreased or no longer exists. An impairment loss is reversed if there has been a change in the estimates used to determine the recoverable amount. An impairment loss is reversed only to the extent that the asset’s carrying amount does not exceed the carrying amount that would have been determined, net of depreciation or amortisation, if no impairment loss had been recognised.
g) Borrowing costsBorrowing costs directly attributable to the acquisition, construction or production of an asset that necessarily takes a substantial period of time to get ready for its intended use or sale are capitalised as part of the cost of the asset. All other borrowing costs are expensed in the period in which they occur. Borrowing cost also includes exchange differences to the extent regarded as an adjustment to the borrowing costs.
h) Foreign and presentation currency The Consolidated Financial Statements are presented in Indian Rupees (INR), which is also the functional and presentation currency of the Holding Company. Foreign currenciesTransactions and balancesInitial recognitionTransactions in foreign currencies are initially recorded in functional currency spot rates at the date the transaction first qualifies for recognition. Subsequent measurementMonetary assets and liabilities denominated in foreign currencies are translated at the functional currency spot rates of exchange at the reporting date.Exchange differences arising on settlement or translation of monetary items are recognised in the statement of profit or loss in the year in which they arise.Non-monetary items that are measured in terms of historical cost in a foreign currency are translated using the exchange rates at the dates of the initial transactions. Non-monetary items measured at fair value in a foreign currency are translated using the exchange rates at the date when the fair value is determined. The gain or loss arising on translation of non-monetary items measured at fair value is treated in line with the recognition of the gain or loss on the change in fair value of the item (i.e. translation differences on items whose fair value gain or loss is recognised in Other Comprehensive Income (“OCI”) or profit or loss are also recognised in OCI or profit or loss, respectively).Exchange differences arising on other long-term foreign currency monetary items are accumulated in the “Foreign Currency Monetary Item Translation Difference Account” and amortised over the remaining life of the concerned monetary item.All other exchange differences are charged to the statement of profit and loss.Translation of a foreign operation Functional and reporting currencies of foreign operations are different from the reporting currency of the Holding Company. For all the foreign operations of the Group, all assets and liabilities (excluding share capital and opening reserves and surplus) are translated into INR using the exchange rate prevailing at the reporting date. Share capital, opening reserves and surplus at historical rates. Revenues, costs and expenses are translated using the average exchange rate during the reporting period. The resultant currency translation difference is recognized as foreign currency translation reserve under the head ‘other equity’.
i) LeasesGroup as a lesseeA lease is classified at the inception date as a finance lease or an operating lease. A lease that transfers substantially all the risks and rewards incidental to ownership to the Group is classified as a finance lease.Finance leases are capitalised at the commencement of the lease at the inception date fair value of the leased Asset or, if lower, at the present value of the minimum lease payments. Lease payments are apportioned between finance charges and reduction of the lease liability so as to achieve a constant rate of interest on the remaining balance of the liability. Finance charges are recognised in finance costs in the statement of profit and loss. Contingent rentals are recognised as expenses in the periods in which they are incurred. Lease management fees, legal charges and other initial direct costs are capitalised.A leased asset is depreciated over the useful life of the asset. However, if there is no reasonable certainty that the Group will obtain ownership by the end of the lease term, the asset is depreciated over the shorter of the useful life of the asset and the lease term.Operating lease payments are recognised as an expense in the statement of profit and loss on a straight-line basis over the lease term, except in case where lease rentals are structured to increase in line with expected general inflation to compensate for the lessor's expected inflationary cost.

Panacea Biotec Ltd. 133
Summary of significant accounting policies for the year ended March 31, 2019
Group as a lessor Leases in which the Group does not transfer substantially all the risks and rewards of ownership of an asset are classified as operating leases. Rental income from operating lease is recognised on a straight-line basis over the term of the relevant lease. Initial direct costs incurred in negotiating and arranging an operating lease are added to the carrying amount of the leased asset and recognised over the lease term on the same basis as rental income. Contingent rents are recognised as revenue in the period in which they are earned.Leases are classified as finance leases when substantially all of the risks and rewards of ownership transfer from the Group to the lessee. Amounts due from lessees under finance leases are recorded as receivables at the Group’s net investment in the leases. Finance lease income is allocated to accounting periods so as to reflect a constant periodic rate of return on the net investment outstanding in respect of the lease.
j) Fair value measurementFair value is the price that would be received to sell an asset or paid to transfer a liability in an orderly transaction between market participants at the measurement date. The fair value measurement is based on the presumption that the transaction to sell the asset or transfer the liability takes place either:• In the principal market for the asset or liability, or• In the absence of a principal market, in the most advantageous market for the asset or liabilityThe principal or the most advantageous market must be accessible by the Group.The fair value of an asset or a liability is measured using the assumptions that market participants would use when pricing the asset or liability, assuming that market participants act in their economic best interest.A fair value measurement of a non-financial asset takes into account a market participant’s ability to generate economic benefits by using the asset in its highest and best use or by selling it to another market participant that would use the asset in its highest and best use.Group uses valuation techniques that are appropriate in the circumstances and for which sufficient data are available to measure fair value, maximizing the use of relevant observable inputs and minimizing the use of unobservable inputs.All assets and liabilities for which fair value is measured or disclosed in the financial results are categorized within the fair value hierarchy, described as follows, based on the lowest level input that is significant to the fair value measurement as a whole:Level 1 — Quoted (unadjusted) market prices in active markets for identical assets or liabilities.Level 2 — Valuation techniques for which the lowest level input that is significant to the fair value measurement is directly or indirectly observable.Level 3 — Valuation techniques for which the lowest level input that is significant to the fair value measurement is unobservable.For assets and liabilities that are recognized in the financial statements on a recurring basis, Group determines whether transfers have occurred between levels in the hierarchy by re-assessing categorization (based on the lowest level input that is significant to the fair value measurement as a whole) at the end of each reporting period or each case.
k) Revenue recognitionRevenue is measured at fair value of the consideration received or receivable, exclusive of any trade discounts, volume rebates and any taxes or duties collected on behalf of the government which are levied on sales such as sales tax, value added tax, etc. The Group has concluded that it is the principal in all of its revenue arrangements since it is the primary obligor in all the revenue arrangements as it has pricing latitude and is also exposed to inventory and credit risks.The Group applies the revenue recognition criteria to each separately identifiable component of the Revenue transaction as set out below:Sale of goods Revenue from sale of goods is recognised when all the significant risks and rewards of ownership in the goods are transferred to the buyer as per the terms of the contract, there is neither continuing managerial involvement with the goods nor effective control over the goods sold, it is probable that economic benefits will flow to the Group, the costs incurred or to be incurred in respect of the transaction can be measured reliably and the amount of revenue can be measured reliably.Revenue from services rendered is recognised in the statement of profit and loss over the period the underlying services are performed.Dividend incomeDividend income is recognised at the time when right to receive the payment is established, which is generally when the shareholders approve the dividend.Interest incomeInterest income is recorded on accrual basis using the effective interest rate (“EIR”) method.Royalty incomeRoyalty is recognized on an accrual basis based on actual sale of product by the licensee and in accordance with the terms of the relevant agreement.Research and license fees incomeResearch and license fees income is recognized on an accrual basis based on actual sale of product by the licensee and in accordance with the term of the relevant agreement.Export incentivesExport entitlements from government authorities are recognised in the statement of profit and loss when the right to receive credit as per the terms of the scheme is established in respect of the exports made by the Group, and where there is no significant uncertainty regarding the ultimate collection of the relevant export proceeds.
l) Financial instruments Recognition and initial measurementFinancial assets and financial liabilities are recognised when the Group becomes a party to the contractual provisions of the instrument and are measured initially at fair value adjusted for transaction costs, except for those carried at fair value through profit or loss which are measured initially at fair value.

Annual Report 2018-19134
Summary of significant accounting policies for the year ended March 31, 2019
Subsequent measurement Financial assets i. Financial assets carried at amortised cost – A financial instrument is measured at amortised cost if both the following conditions are met:
• The asset is held within a business model whose objective is to hold assets for collecting contractual cash flows, and • Contractual terms of the asset give rise on specified dates to cash flows that are solely payments of principal and interest (SPPI) on the
principal amount outstanding. After initial measurement, such financial assets are subsequently measured at amortised cost using the effective interest method.
ii. Financial assets at fair value• Investments in equity instruments other than above –Investments in equity instruments which are held for trading are generally
classified as at fair value through profit or loss (FVTPL). For all other equity instruments, the Group makes irrevocable choice upon initial recognition, on an instrument to instrument basis, to classify the same either as at fair value through other comprehensive income (FVOCI) or fair value through profit or loss (FVTPL). If the Group decides to classify an equity instrument as at FVOCI, then all fair value changes on the instrument, excluding dividends, are recognised in the other comprehensive income (OCI). There is no recycling of the amounts from OCI to profit or loss, even on sale of investment. However, the Group transfers the cumulative gain or loss within equity. Dividends on such investments are recognised in the statement of profit or loss unless the dividend clearly represents a recovery of part of the cost of the investment. Equity instruments included within the FVTPL category are measured at fair value with all changes recognised in the profit or loss.
• Investments in mutual funds – Investments in mutual funds in scope of Ind-AS 109 are measured at fair value through profit or loss (FVTPL).
De-recognition of financial assets A financial asset is primarily de-recognised when the rights to receive cash flows from the asset have expired or the Group has transferred its rights to receive cash flows from the asset. Financial liabilities Subsequent to initial recognition, all non-derivative financial liabilities, other than derivative liabilities, are subsequently measured at amortised cost using the effective interest method.De-recognition of financial liabilities A financial liability is de-recognised when the obligation under the liability is discharged or cancelled or expires. When an existing financial liability is replaced by another from the same lender on substantially different terms, or the terms of an existing liability are substantially modified, such an exchange or modification is treated as the de-recognition of the original liability and the recognition of a new liability. The difference in the respective carrying amounts is recognised in the statement of profit and loss. Offsetting of financial instruments Financial assets and financial liabilities are offset and the net amount is reported in the balance sheet if there is a currently enforceable legal right to offset the recognised amounts and there is an intention to settle on a net basis, to realize the assets and settle the liabilities simultaneously. Impairment of financial assetsThe Group assesses on a forward looking basis the expected credit losses associated with its assets carried at amortised cost. The impairment methodology applied depends on whether there has been a significant increase in credit risk. Note 50 details how the Group determines whether there has been a significant increase in credit risk. For trade receivables only, the Group applies the simplified approach permitted by Ind AS 109 Financial Instruments, which requires expected lifetime losses to be recognised from initial recognition of the receivables.
m) Post-employment and other employee benefitsProvident fundRetirement benefit in the form of provident fund is a defined contribution scheme. The Group has no obligation, other than the contribution payable to the provident fund. The Group recognizes contribution payable to the provident fund scheme as an expense, when an employee renders the related service. The Group has no obligation other than the contribution payable to the Provided Fund. If the contribution already paid exceeds the contribution due for services received before the balance sheet date, then excess is recognised as an asset to the extent that the pre-payment will lead to, for example, a reduction in future payment or a cash refund.GratuityA defined benefit plan is a post-employment benefit plan other than a defined contribution plan. The Group net obligation in respect of the gratuity plan (administered through Life Insurance Corporation of India), which is a defined benefit plan, is calculated by estimating the ultimate cost to the entity of the benefit that employees have earned in return for their service in the current and prior periods. This requires an entity to determine how much benefit is attributable to the current and prior periods and to make estimates (actuarial assumptions) about demographic variables and financial variables that will affect the cost of the benefit. The cost of providing benefits under the defined benefit plan is determined on the basis of actuarial valuation using the projected unit credit method. Actuarial gains/losses resulting from re-measurements of the liability are included in other comprehensive income.Compensated absencesCompensated absences, which are expected to be utilized within the next 12 months, is treated as short term employee benefit. The Group measures the expected cost of such absences as the additional amount that it expects to pay as a result of the unused entitlement that has accumulated at the reporting date.The Group treats accumulated leave expected to be carried forward beyond twelve months, as long-term employee benefit for measurement purposes. Such long-term compensated absences are provided for based on the actuarial valuation using the projected unit credit method at the year-end. Actuarial gains/losses are immediately taken to the statement of profit and loss and are not deferred.Other short-term benefits

Panacea Biotec Ltd. 135
Summary of significant accounting policies for the year ended March 31, 2019
Expense in respect of other short-term benefits is recognized on the basis of amount paid or payable for the period during which services are rendered by the employees.
n) Earnings per shareBasic earnings per share is calculated by dividing the net profit or loss for the period attributable to equity shareholders (after deducting attributable taxes) by the weighted average number of equity shares outstanding during the period. The weighted average number of equity shares outstanding during the period is adjusted for events including a bonus issue.For the purpose of calculating diluted earnings per share, the net profit or loss for the period attributable to equity shareholders and the weighted average number of shares outstanding during the period are adjusted for the effects of all dilutive potential equity shares.
o) TaxesTax expense recognized in statement of profit and loss comprises the sum of deferred tax and current tax except the ones recognized in other comprehensive income or directly in equity.Current tax is determined as the tax payable in respect of taxable income for the year and is computed in accordance with relevant tax regulations. Current income tax relating to items recognized outside profit or loss is recognized outside profit or loss (either in other comprehensive income or in equity). Minimum alternate tax (‘MAT’) credit entitlement is recognized as an asset only when and to the extent there is convincing evidence that normal income tax will be paid during the specified period. In the year in which MAT credit becomes eligible to be recognized as an asset, the said asset is created by way of a credit to the statement of profit and loss and presented as MAT credit entitlement. This is reviewed at each balance sheet date and the carrying amount of MAT credit entitlement is written down to the extent it is not reasonably certain that normal income tax will be paid during the specified period. Deferred tax is recognized in respect of temporary differences between carrying amount of assets and liabilities for financial reporting purposes and corresponding amount used for taxation purposes. Deferred tax assets on unrealised tax loss are recognized to the extent that it is probable that the underlying tax loss will be utilised against future taxable income. This is assessed based on the Group’s forecast of future operating results, adjusted for significant non-taxable income and expenses and specific limits on the use of any unused tax loss. Unrecognized deferred tax assets are re-assessed at each reporting date and are recognized to the extent that it has become probable that future taxable profits will allow the deferred tax asset to be recovered. Deferred tax assets and liabilities are measured at the tax rates that are expected to apply in the year when the asset is realised or the liability is settled, based on tax rates (and tax laws) that have been enacted or substantively enacted at the reporting date. Deferred tax relating to items recognized outside statement of profit and loss is recognized outside statement of profit or loss (either in other comprehensive income or in equity).
p) Government grantsGrants from the government are recognised at their fair value where there is reasonable assurance that the grant will be received and the group will comply with all the conditions.Government grants related to the income are deferred and recognised in statement of profit and loss over the period necessary to match them with the cost that are intended to compensate and presented within other income.Government grants related to property plant and equipment are included in the non-current liabilities as deferred income and are credited to profit and loss on a straight line basis over the expected life of the related assets and presented within other income.
q) Segment reportingOperating segments are reported in a manner consistent with the internal reporting provided to the chief operating decision maker. Identification of segmentsIn accordance with Ind AS 108 – Operating Segment, the operating segments used to present segment information are identified on the basis of information reviewed by the Group’s management to allocate resources to the segments and assess their performance. An operating segment is a component of the Group that engages in business activities from which it earns revenues and incurs expenses, including revenues and expenses that relate to transactions with any of the other components. Results of the operating segments are reviewed regularly by the Board of Directors (chairman and chief financial officer) which has been identified as the chief operating decision maker (CODM), to make decisions about resources to be allocated to the segment and assess its performance and for which discrete financial information is available.Allocation of common costsCommon allocable costs are allocated to each segment accordingly to the relative contribution of each segment to the total common costs. Unallocated itemsUnallocated items include general corporate income and expense items which are not allocated to any business segment.Segment accounting policiesThe Group prepares its segment information in conformity with the accounting policies adopted for preparing and presenting the financial results of the Group as a whole.
r) Cash and cash equivalentsCash and cash equivalent in the balance sheet comprise cash at banks and on hand and short-term deposits with an original maturity of three months or less, which are subject to an insignificant risk of changes in value.
s) Provisions, contingent liabilities and contingent assetsProvisions are recognised when present obligations as a result of past events will probably lead to an outflow of economic resources from the Group and they can be estimated reliably. Timing or amount of the outflow may still be uncertain. A present obligation arises from the presence of a legal or constructive obligation that has resulted from past events.Provisions are measured at the best estimate of expenditure required to settle the present obligation at the reporting date, based on the most reliable evidence, including the risks and uncertainties associated with the present obligation.In those cases, where the possible outflow of economic resource as a result of present obligations is considered improbable or remote, or the amount to be provided for cannot be measured reliably, no liability is recognised in the balance sheet.

Annual Report 2018-19136
Summary of significant accounting policies for the year ended March 31, 2019
Any amount that the Group can be virtually certain to collect from a third party with respect to the obligation is recognised as a separate asset up to the amount of the related provisions. All provisions are reviewed at each reporting date and adjusted to reflect the current best estimate.Contingent assets are not recognised.
1.5 Significant management judgments in applying accounting policies and estimation uncertainty The preparation of the Group financial statements requires management to make judgments, estimates and assumptions that affect the reported amounts of revenues, expenses, assets and liabilities and the related disclosures.Significant management judgmentsResearch and developments costs - Management monitors progress of internal research and development projects by using a project management system. Significant judgment is required in distinguishing research from the development phase. Development costs are recognised as an asset when all the criteria are met, whereas research costs are expensed as incurred. Management also monitors whether the recognition requirements for development costs continue to be met. This is necessary due to inherent uncertainty in the economic success of any product development.Recognition of deferred tax assets - The extent to which deferred tax assets can be recognized is based on an assessment of the probability of the future taxable income against which the deferred tax assets can be utilised. Provisions, contingent liabilities and contingent assets – The Group is the subject of legal proceedings and tax issues covering a range of matters, which are pending in various jurisdictions. In view of the uncertainty inherent in such matters, it is difficult to predict the final outcome of such matters. The cases and claims against the Group often raise difficult and complex factual and legal issues, which are subject to many uncertainties, including but not limited to the facts and circumstances of each particular case and claim, the jurisdiction and the differences in applicable law. In the normal course of business, management consults with legal counsel and certain other experts on matters related to litigation and taxes. The Group accrues a liability when it is determined that an adverse outcome is probable and the amount of the loss can be reasonably estimated.Impairment of financial assets – At each balance sheet date, based on historical default rates observed over expected life, the management assesses the expected credit loss on outstanding financial assets.Evaluation of indicators for impairment of assets – The evaluation of applicability of indicators of impairment of assets requires assessment of several external and internal factors which could result in deterioration of recoverable amount of the assets. Significant estimatesUseful lives of depreciable/amortisable assets – Management reviews its estimate of the useful lives of depreciable/amortisable assets at each reporting date, based on the expected utility of the assets. Uncertainties in these estimates relate to technical and economic obsolescence that may change the utility of certain software, IT equipment and other plant and equipment. Defined benefit obligation – Management’s estimate of the DBO is based on a number of critical underlying assumptions such as standard rates of inflation, mortality, discount rate and anticipation of future salary increases. Variation in these assumptions may significantly impact the DBO amount and the annual defined benefit expenses. Fair value measurementsManagement applies valuation techniques to determine the fair value of financial instruments (where active market quotes are not available). This involves developing estimates and assumptions consistent with how market participants would price the instrument.
1.6 Standard issued but not yet effective:a) Ind AS 116 ‘Leases’: On 30th March, 2019, the Ministry of Corporate Affairs has notified Ind AS 116: Leases. Ind AS 116 will replace the existing
leases standard, Ind AS 17, Leases, and related interpretations. The standard sets out the principles for the recognition, measurement, presentation and disclosure of leases for both parties to a contract i.e., the lessee and the lessor. Ind AS 116 introduces a single lessee accounting model and requires the lessee to recognise assets and liabilities for all leases with a term of more than twelve months, unless the underlying asset is of low value. Currently, operating lease expenses are charged to the profit or Loss. The standard also contains enhanced disclosure requirements for lessees. Ind AS 116 substantially carries forward the lessor accounting requirements in Ind AS 17. The effective date for the adoption of Ind AS 116 is annual periods beginning on or after 1st April, 2019.
b) Ind AS 12 ‘Taxes’: On 30th March, 2019, the Ministry of Corporate Affairs has notified Ind AS 12, Appendix C, Uncertainty over Income Tax Treatments which is to be applied while performing the determination of taxable profit (or loss), tax bases, unused tax losses, unused tax credits and tax rates, when there is uncertainty over income tax treatments under Ind AS 12. According to the appendix, companies need to determine the probability of the relevanttax authority accepting each tax treatment, or group of tax treatments, that the companies have used or plan to use in their income tax filing which has to be considered to compute the most likely amount or the expected value of the tax treatment when determining taxable profit (tax loss), tax bases, unused tax losses, unused tax credits and tax rates.Dividend distribution tax: On 30th March, 2019, the Ministry of Corporate Affairs issued amendments to the guidance in Ind AS 12, Income Taxes, in connection with accounting for dividend distribution taxes. The amendment clarifies that an entity shall recognise the income tax consequences of dividends in profit or loss, other comprehensive income or equity according to where the entity originally recognised those past transactions or events.The effective date for adoption of Ind AS 12 is annual periods beginning on or after April 1, 2019. The Company will adopt the standard on 1st April, 2019. The Company is currently evaluating the effect of these amendments on the financial statements.
c) Amendment to Ind AS 19, plan amendment, curtailment or settlement: On 30th March, 2019, the Ministry of Corporate Affairs issued amendments to Ind AS 19, Employee Benefits, in connection with accounting for plan amendments, curtailments and settlements. Effective date for application of this amendment is annual period beginning on or after 1st April, 2019. The Company does not have any impact on account of this amendment.

Panacea Biotec Ltd. 137
Notes to the Consolidated Financial Statements for the year ended March 31, 2019
Notes : a) Plant and equipment includes plant and machinery amounting to Rs.Nil (March 31, 2018: Rs.0.86 million) (net block) lying with third parties.b) Property, plant and equipment pledged as security: Refer note 45 for information on assets pledged and mortgaged as security by the Group.c) Contractual commitments: Refer note 40(B) for information on contractual commitments related to property, plant and equipment.* includes depreciation related to discontinued operations (refer note 41)
2.1 Property, plant and equipment(Rs. in million)
Description Freehold land
Leasehold land
Building Plant and equipment
Furniture and fittings
Vehicles Office equipment
Computer equipment
Total
Gross carrying value As at April 1, 2017 2,441.49 593.00 4,366.08 6,843.50 344.20 116.79 225.63 196.15 15,126.84 Additions 0.02 - 1.31 52.66 0.37 - 0.47 1.85 56.68 Disposals - - - 0.20 - 1.88 1.74 - 3.82 As at March 31, 2018 2,441.51 593.00 4,367.39 6,895.96 344.57 114.91 224.36 198.00 15,179.70 Additions - - - 0.62 0.09 - 0.65 1.12 2.48 Disposals - - - 1,276.57 63.40 6.21 56.40 44.42 1,447.00 Transfer to discontinued operations (refer note 41)
198.30 - 382.62 5.17 16.45 22.05 19.88 0.74 645.21
As at March 31, 2019 2,243.21 593.00 3,984.77 5,614.84 264.81 86.65 148.73 153.96 13,089.97 Accumulated depreciationAs at April 1, 2017 - 27.65 760.43 3,622.58 292.99 94.83 211.86 180.30 5,190.64 Charge for the year* - 4.04 112.58 422.35 13.62 6.39 1.12 3.82 563.92 Disposals - - - 0.14 - 1.74 1.73 - 3.61 As at March 31, 2018 - 31.69 873.01 4,044.79 306.61 99.48 211.25 184.12 5,750.95 Charge for the year* - 4.04 113.28 400.85 8.47 3.81 1.04 3.08 534.57 Disposals - - - 958.76 59.84 5.84 53.55 42.17 1,120.16 Transfer to discontinued operations (refer note 41)
- - 49.67 3.46 15.22 19.03 18.42 0.67 106.47
As at March 31, 2019 - 35.73 936.62 3,483.42 240.02 78.42 140.32 144.36 5,058.89 Net block as at March 31, 2019 2,243.21 557.27 3,048.15 2,131.42 24.79 8.23 8.41 9.60 8,031.08 Net block as at March 31, 2018 2,441.51 561.31 3,494.38 2,851.17 37.96 15.43 13.11 13.88 9,428.75
2.2 Capital work-in-progress(Rs. in million)
Description Amount As at April 1, 2017 87.00 Add: addition during the year 44.88 Less: capitalisation during the year (56.68)As at March 31, 2018 75.20 Add: addition during the year 11.20 Less: capitalisation during the year (2.48)As at March 31, 2019 83.92
Notes:1. The capital work-in-progress relates to construction and installation of property, plant and equipment.2. Refer note 45 for information on assets pledged and mortgaged as security by the Group.
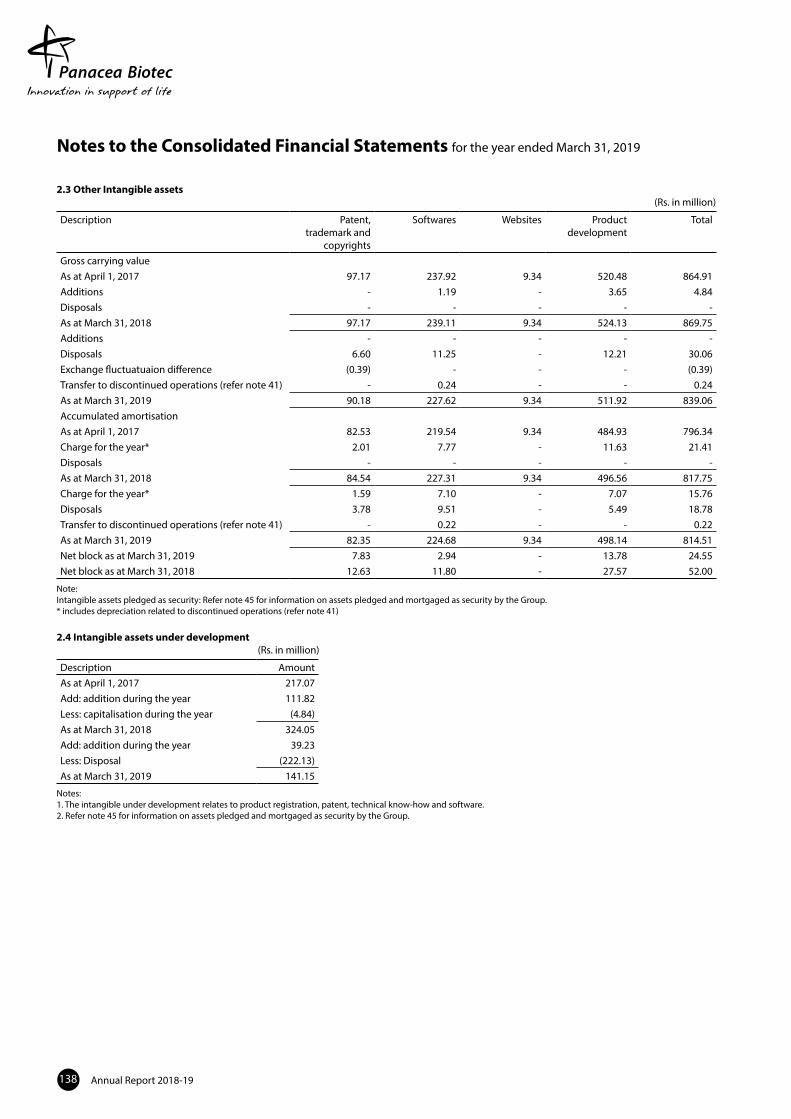
Annual Report 2018-19138
Notes to the Consolidated Financial Statements for the year ended March 31, 2019
Note:Intangible assets pledged as security: Refer note 45 for information on assets pledged and mortgaged as security by the Group.* includes depreciation related to discontinued operations (refer note 41)
2.4 Intangible assets under development(Rs. in million)
Description Amount As at April 1, 2017 217.07 Add: addition during the year 111.82 Less: capitalisation during the year (4.84)As at March 31, 2018 324.05 Add: addition during the year 39.23 Less: Disposal (222.13)As at March 31, 2019 141.15
Notes:1. The intangible under development relates to product registration, patent, technical know-how and software.2. Refer note 45 for information on assets pledged and mortgaged as security by the Group.
2.3 Other Intangible assets(Rs. in million)
Description Patent, trademark and
copyrights
Softwares Websites Product development
Total
Gross carrying valueAs at April 1, 2017 97.17 237.92 9.34 520.48 864.91 Additions - 1.19 - 3.65 4.84 Disposals - - - - - As at March 31, 2018 97.17 239.11 9.34 524.13 869.75 Additions - - - - - Disposals 6.60 11.25 - 12.21 30.06 Exchange fluctuatuaion difference (0.39) - - - (0.39)Transfer to discontinued operations (refer note 41) - 0.24 - - 0.24 As at March 31, 2019 90.18 227.62 9.34 511.92 839.06 Accumulated amortisationAs at April 1, 2017 82.53 219.54 9.34 484.93 796.34 Charge for the year* 2.01 7.77 - 11.63 21.41 Disposals - - - - - As at March 31, 2018 84.54 227.31 9.34 496.56 817.75 Charge for the year* 1.59 7.10 - 7.07 15.76 Disposals 3.78 9.51 - 5.49 18.78 Transfer to discontinued operations (refer note 41) - 0.22 - - 0.22 As at March 31, 2019 82.35 224.68 9.34 498.14 814.51 Net block as at March 31, 2019 7.83 2.94 - 13.78 24.55 Net block as at March 31, 2018 12.63 11.80 - 27.57 52.00

Panacea Biotec Ltd. 139
Notes to the Consolidated Financial Statements for the year ended March 31, 2019
(Rs. in million)
As atMarch 31, 2019
As atMarch 31, 2018
3. Investments (non-current)Carried at costInvestments in equity instruments
A. Carried at fair value through profit and loss (Refer note 52)Investment in equity instruments of other entities (unquoted):
a) 20,250 (March 31, 2018: 20,250) equity shares of Rs. 10 each fully paid up in Shivalik Solid Waste Management Limited)
0.20 0.20
b) 50,000 (March 31, 2018: 50,000) equity shares of Rs. 10 each fully paid up in Mohali Green Environment Private Limited
0.50 0.50
0.70 0.70 Aggregate amount of unquoted investments 0.70 0.70 Aggregate amount of impairment in value of investments - -
4. Loans (non-current)Unsecured, considered goodSecurity deposits 11.66 10.43 Total 11.66 10.43 Notes:i) Refer note 52 and 53 for disclosure of fair value in respect of financial assets measured at amortised cost and
disclosure for financial risk management for assessment of expected credit losses.
ii) Refer note 44 for related party disclosure.
5. Other financial assets (non-current)Bank deposits with maturity of more than 12 months 11.19 52.66 Total 11.19 52.66 Notes:
i) Fixed deposits amounting to Rs.11.19 million (March 31, 2018: Rs.52.66 million) are pledged/deposited with banks and various Government authorities for tender, bank guarantee, margin money etc.
ii) Refer note 52 and 53 for disclosure of fair value in respect of financial assets measured at amortised cost and disclosure for financial risk management for assessment of expected credit losses.
6. Deferred tax assets (net)Deferred tax liabilities arising on account ofProperty, plant and equipment and intangible assets 1,465.88 1,865.64 Capital expenditure on research and development 8.44 105.93 Others - 24.03
1,474.32 1,995.60 Deferred tax assets arising on account ofExpenditure allowed on payment basis 407.06 425.54 Unabsorbed business loss and depreciation 1,051.76 1,385.86 Minimum alternative tax credit entitlement 192.04 230.14 Others 21.36 58.12
1,672.22 2,099.66 Total 197.90 104.06 Note: Refer note 38 for changes in deferred tax balances.Deferred tax assets and liabilities have been offset where they arise in the same legal entity and taxing jurisdiction but not otherwise. Accordingly, the net deferred tax (assets) / liability has been disclosed in the consolidated balance sheet as follows :Deferred tax assets 197.90 196.63 Deferred tax liabilities - 92.57 Deferred tax assets (net) 197.90 104.06

Annual Report 2018-19140
Notes to the Consolidated Financial Statements for the year ended March 31, 2019
(Rs. in million)
As atMarch 31, 2019
As atMarch 31, 2018
7. Income tax assets (net)Advance income tax (net of provision for taxes) 19.66 49.10 Total 19.66 49.10
8. Other non-current assets(Unsecured, considered good)Prepaid expenses - 1.24 Capital advances 3.96 180.33 Balances with statutory authorities 97.98 40.28 Total 101.94 221.85 Note: Refer note 45 for information on assets pledged and mortgaged as security by the Group.
9. Inventories(lower of cost or net realisable value)Raw materials (including packing materials) 395.55 717.60 Finished goods 246.57 428.65 Traded goods 39.77 77.95 Work-in-progress 111.33 262.90 Land under development - 1,680.16 Stores and spares 21.05 174.80 Total 814.27 3,342.06 Note: Refer note 45 for information on assets pledged and mortgaged as security by the Group.
10. Investment - currentCarried at fair value through profit or lossInvestment in mutual funds (quoted):a) Nil units (March 31, 2018: 962,572.107 units of Rs. 10.0778 NAV) in Franklin India Treasury Management Account - Super Institutional Plan Daily Dividend - Option Reinvestment
- 9.70
b) Nil (March 31, 2018: 10,587.165 units of Rs. 1000.7051 NAV) in Franklin India Treasury Management Account - Super Institutional Plan Daily Dividend - Option Reinvestment
- 10.59
Total - 20.29 Aggregate cost of quoted investments - 20.29 Aggregate market value of quoted investments - 20.29
11. Trade receivablesUnsecured, considered good 943.71 1,400.13 Unsecured, considered doubtful 75.95 25.60
1,019.66 1,425.73 Less: allowance for expected credit loss (56.41) (40.03)Less: allowance for doubtful debts (75.95) (25.60)Total 887.30 1,360.10 Notes: i Refer note 52 and 53 for disclosure of fair value in respect of financial assets measured at amortised cost and
disclosure for financial risk management for assessment of expected credit losses.ii) Refer note 45 for information on assets pledged and mortgaged as security by the Group.
12. Cash and cash equivalentsBalances with banks - in current accounts 143.72 163.25 - in exchange earner foreign currency accounts 0.28 0.46 Cash on hand 0.66 0.66 Total 144.66 164.37

Panacea Biotec Ltd. 141
Notes to the Consolidated Financial Statements for the year ended March 31, 2019
(Rs. in million)
As atMarch 31, 2019
As atMarch 31, 2018
13. Other bank balancesDeposits with original maturity for more than 3 months but less than 12 months (refer note (i) below) 90.14 67.88 Unpaid dividend accounts (refer note (ii) below) - 0.12 Total 90.14 68.00 Notes: i) Fixed deposits amounting to Rs.90.14 million (March 31, 2018: Rs.67.88 million) are pledged/deposited with
banks and various Government authorities for tender, bank guarantee, margin money etc.ii) Not available for use by the Group as these represent corresponding unpaid/unclaimed dividend liabilities.
14. Loans (current)Unsecured, considered goodSecurity deposits 14.44 19.03 Loan to employees (refer note 58) 166.87 132.32 Loan to body corporate - 201.75 Total 181.31 353.10 Note:Refer note 52 and 53 for disclosure of fair value in respect of financial assets measured at amortised cost and disclosure for financial risk management for assessment of expected credit losses.
15. Other financial assets (current)Unsecured, considered goodInsurance claim receivables - 1.23 Export benefits receivable 27.48 42.68 Others 8.22 7.79 Total 35.70 51.70 Notes:i) Refer note 52 and 53 for disclosure of fair value in respect of financial assets measured at amortised cost and
disclosure for financial risk management for assessment of expected credit losses.ii) Refer note 45 for information on assets pledged and mortgaged as security by the Group.
16. Other current assets(Unsecured, considered good, unless otherwise stated)Prepaid expenses 32.23 47.73 Balances with statutory authorities 145.08 132.17 Advance to suppliers - considered good 83.77 62.81 - considered doubtful 41.44 41.44
125.21 104.25 Less: allowance for doubtful advances (41.44) (41.44)
83.77 62.81 Others - 1.13 Total 261.08 243.84 Note: Refer note 45 for information on assets pledged and mortgaged as security by the Group.

Annual Report 2018-19142
Notes to the Consolidated Financial Statements for the year ended March 31, 2019
d) Reconciliation of number of equity shares of the Holding Company:As at March 31, 2019 As at March 31, 2018
No. of shares Rs. in million No. of shares Rs. in millionEquity shares at the beginning of the year 61,250,746 61.25 61,250,746 61.25 Changes during the year - - - - Equity shares at the end of the year 61,250,746 61.25 61,250,746 61.25
e) Details of shareholders holding more than 5% of equity shares in the holding company:As at March 31, 2019 As at March 31, 2018
No. of shares % holding No. of shares % holdingMr. Soshil Kumar Jain 5,000,000 8.16% 5,000,000 8.16%Dr. Rajesh Jain 6,213,500 10.14% 6,213,500 10.14%Mr. Sandeep Jain 4,792,100 7.82% 4,792,100 7.82%Mrs. Sunanda Jain 6,647,300 10.85% 6,647,300 10.85%Ravinder Jain (HUF) 4,135,000 6.75% 4,135,000 6.75%Rajesh Jain (HUF) 3,750,799 6.12% 4,046,617 6.61%Sandeep Jain (HUF) 4,105,000 6.70% 4,105,000 6.70%Serum Institute of India Ltd 5,774,732 9.43% 5,774,732 9.43%Mr. Adar Cyrus Poonawala 3,157,034 5.15% 3,157,900 5.16%The above information has been furnished as per the shareholders' detail available with the Holding Company at the year end.
f ) Terms attached to 0.5% cumulative non-convertible and non-participating redeemable preference shares:The Holding Company has only one class of preference shares having a par value of Rs.10 per share. The Holding Company declares and pays dividends in Indian Rupees. The dividend, if any, proposed by the Board of Directors of the Holding Company is subject to the approval of the shareholders in the ensuing Annual General Meeting. The Board of Directors of the Holding Company has not proposed any dividend for current year and previous year.The preference shares were initially issued for a period of 10 years w.e.f. January 6, 2015, with an option with the Holding Company as well as preference shareholders for early redemption of preference shares, provided CDR debts (refer note 19(A)) are fully serviced and the Holding Company comes out from the purview of CDR system. The terms of preference shares have been amended on April 08, 2019 so as to enhance the tenure from 10 years to 15 years with an option with the Holding Company as well as preference shareholders for early redemption of preference shares, provided the secured debt obligations with respect to debentures issued by the Holding Company are fully serviced by the Holding Company as per the agreed terms with the new investor. In the event of liquidation of the Holding Company, the holders of preference shares will be entitled to receive the remaining assets of the Holding Company after distribution of all preferential amounts, in preference to the equity shareholders. The distribution will be in proportion to the number of preference shares held by the preference shareholders. Also refer note 19(D).
g) Reconciliation of 0.5% cumulative non-convertible and non-participating redeemable preference shares of the Holding Company:
As at March 31, 2019 As at March 31, 2018No. of shares Rs. in million No. of shares Rs. in million
Preference shares at the beginning of the year 16,300,000 163.00 16,300,000 163.00 Changes during the year - - - - Preference shares at the end of the year 16,300,000 163.00 16,300,000 163.00
h) No equity/preference shares have been bought back nor any bonus share or shares have been issued for consideration other than cash during the period of five years immediately preceding the reporting date except for issue of preference shares by conversion of loan in financial year 2014-15 amounting to Rs.163,000,000.
(Rs. in million)
As atMarch 31, 2019
As atMarch 31, 2018
17. Share capitala) Authorised
i) 125,000,000 (March 31, 2018: 125,000,000) Equity Shares of Re.1 each 125.00 125.00 ii) 110,000,000 (March 31, 2018: 110,000,000) Preference Shares of Rs.10 each 1,100.00 1,100.00
1,225.00 1,225.00 b) Issued, subscribed and fully paid up
61,250,746 (March 31, 2018: 61,250,746) Equity Shares of Re.1 each 61.25 61.25 Total 61.25 61.25
c) Terms/right attached to equity shares: The Holding Company has only one class of equity shares having a par value of Re.1 per share. Each holder of equity shares is entitled to one vote per share. The Holding Company declares and pays dividends in Indian Rupees. The dividend if any, proposed by the Board of Directors is subject to the approval of the shareholders in the ensuing Annual General Meeting. The Board of Directors of the Holding Company has not proposed any dividend for current year and previous year. In the event of liquidation of the Holding Company, the holders of equity shares will be entitled to receive remaining assets of the Holding Company, after distribution of all preferential amounts including preference shares. The distribution will be in proportion to the number of equity shares held by the equity shareholders.

Panacea Biotec Ltd. 143
i) Detail of preference shareholders holding more than 5% of 0.5% cumulative non-convertible and non-participating redeemable preference share capital:
Name of personsAs at March 31, 2019 As at March 31, 2018
No. of shares % holding No. of shares % holdingMr. Soshil Kumar Jain 6,570,000 40.31% 6,570,000 40.31%Dr. Rajesh Jain 6,570,000 40.31% 6,570,000 40.31%Mr. Sandeep Jain 3,160,000 19.38% 3,160,000 19.38%The above information has been furnished as per the shareholders detail available with the Company at the year end.
Notes to the Consolidated Financial Statements for the year ended March 31, 2019
(Rs. in million)
As atMarch 31, 2019
As atMarch 31, 2018
18. Other equity*Equity component of compound financial instruments (refer note 17 (f ) to (i) and 19(D)) 96.39 96.39 Reserves and Surplus:Retained earnings 884.15 513.39 General reserve 474.99 474.99 Security premium account 919.40 919.40 Capital redemption reserve 1,022.34 1,022.34 Foreign currency monetary item translation difference account - (44.56)Foreign currency translation account 45.45 43.55 Total 3,442.72 3,025.50 * For changes in balances of reserves, refer to the Consolidated Statement of Changes in Equity.
Nature and purpose of other reserves:General reserve: The Holding Company has transferred a portion of the net profit before declaring dividend to general reserve pursuant to the provisions of the erstwhile Companies Act, 1956. Mandatory transfer to general reserve is not required under the Act.Securities premium account: Represents premium received on issue of shares. The balance is utilised in accordance with the provisions of the Act.Capital redemption reserve: Created in accordance with provisions of the Act for the buy back of equity shares from the market.Foreign currency monetary item translation difference account: Exchange difference arising on long term foreign currency monetary items related to foreign currency term loan.Other comprehensive income: The Company has recognised remeasurements benefits on defined benefits plans through other comprehensive income.
As atMarch 31, 2019
As atMarch 31, 2018
19. Borrowings (non-current)Foreign currency term loans from banks (refer note (A), (B) and (E) below)
Bank of India 1,136.70 1,627.27 Rupee term loan from banks (refer note (A), (B) and (E) below)Term loan from banks
Indian Overseas Bank 660.57 915.00 State Bank of India [loan - I] 894.45 1,400.07 State Bank of India [loan - II] 450.13 704.70
Working capital term loanAxis Bank - 4.39 Bank of India 33.70 54.31 Canara Bank 21.35 33.41 IDBI Bank 14.97 15.76 Indian Overseas Bank 29.96 41.59 State Bank of India 334.50 523.19 Union Bank of India 26.02 40.72
Funded interest term loanAxis Bank - 3.02 Bank of India 82.70 134.68 Canara Bank 12.94 20.29 IDBI Bank 10.28 10.82 Indian Overseas Bank 162.67 225.33 State Bank of India 376.15 622.51 Union Bank of India 15.59 24.46
Further, as per the proposed Scheme of Arrangement with respect to demerger of Demerged Undertaking (refer note 41), 1,63,000 preference shares shall stand cancelled including all the accrued rights therein upon implementation of the said Scheme of Arrangement and completion of related compliances, the Transferee Company shall issue equivalent number of preference shares to the preference shareholders.

Annual Report 2018-19144
Notes to the Consolidated Financial Statements for the year ended March 31, 2019
(Rs. in million)
As atMarch 31, 2019
As atMarch 31, 2018
Rupee Term loans from others Biotechnology Industrial Research Assistance Council ("BIRAC") (secured) (refer note (C) (1) and (2) below)
59.50 61.00
Department of Science & Technology ("DST") (unsecured) (refer note (C) (3) below) 8.00 8.00 Edelweiss Assets Reconstruction Co. Ltd ("EARC") [loan - I] (secured) (refer note (A), (B) and (E) below)
883.57 1,005.76
EARC [loan - II] (secured) (refer note (A), (B) and (E) below) 127.13 129.80 Technology Development Board ("TDB") (secured) (refer note (C) (4) below) 57.98 57.98
Unsecured loansLiability component of compound financial instruments16,300,000 (March 31, 2018: 16,300,000) 0.5% cumulative non-convertible and non-participating redeemable preference shares of Rs.10 each (refer note (D) below)
105.44 94.60
Loan from related parties (refer note (C) (5) below and note 44) 266.80 - 5,771.10 7,758.66
Less: current maturities of non-current borrowings (disclosed under note 24) (5,309.88) (2,051.58)
Total 461.22 5,707.08
Notes:Rate of interest - The Company’s long term borrowings are at an effective weighted average rate of 11% (March 31, 2018: 11%) per annum.(A) Loans under Corporate Debt Restructuring (CDR):
1 All the long-term loans and sustainable working capital borrowings from the banks have been restructured under the CDR package approved by the Corporate Debt Restructuring Empowered Group (CDR- EG) on September 24, 2014, except foreign currency term loan from Bank of India.
2 During the year under review: a) the CDR Lenders have considered the CDR scheme as failed CDR and exit from CDR due to non-compliance with the pending conditions but not
due to default for payment of principal/ interest as per agreed terms of CDR. Consequently, the CDR Lenders have classified the Holding Company’s account as non-performing asset.
b) the Holding Company has reached bilateral settlements of its debts with each CDR lender individually. c) In view of above, all the loans from CDR Lenders have been considered as current and considered as part of current maturities of non-current
borrowings.d) Also refer note 60.
(B) Securities for the non-current loans and sustainable working capital borrowings:1 The long-term borrowings, except rupee term loans from BIRAC, TDB and DST have been secured by way of :
i) first pari-passu charge over entire fixed assets (both present and future) of the Company, by way of mortgage of the immovable properties and hypothecation of all movable fixed assets; and
ii) second pari passu charge over entire current assets (both present and future) of the Company, by way of hypothecation and/or pledge of all current assets including all receivable, finished goods, raw materials, work in progress, consumable stores and spares, book debts and bills receivable.
2 The sustainable working capital facilities (fund based, non-fund based, buyer credits etc.) have been secured by way of:i) first pari-passu charge over entire current assets (both present and future) of the Company, by way of hypothecation and/or pledge of all current
assets including all receivable, finished goods, raw materials, work in progress, consumable stores and spares, book debts, bills receivable; and ii) second pari-passu charge over entire fixed assets (both present and future) of the Company, by way of mortgage of the immovable properties and
hypothecation of all movable fixed assets.3 The long-term borrowings and sustainable working capital facilities, restructured under the CDR package, have been additionally secured by personal
guarantees and pledge of equity shares of the Company held by three promoter directors of the Company viz. Mr. Soshil Kumar Jain, Dr. Rajesh Jain and Mr. Sandeep Jain. The personal guarantee and pledge of equity shares of the Company held by Mr. Ravinder Jain and Mr. Sumit Jain were pending during the year. In the meantime, Mr. Ravinder Jain ceased to be promoter and director due to his demise on February 21, 2018.
5 The details of immovable properties of the Company mortgaged in favour of SBI CAP Trustee Co. Ltd. (acting as trustee on behalf of the CDR Lenders) to secure the long-term borrowings and sustainable working capital borrowings as mentioned above, are as under:i. All parcels of lands admeasuring 96 Bighas 19 Biswa situated at Village Samelheri, Tehsil Dera bassi, District S.A.S. Nagar (Mohali), Punjab;ii. All parcels of land admeasuring 93 Bighas, 12 Biswa and 10 Biswansi situated at Village Samelheri, Tehsil Derabassi, District S.A.S. Nagar (Mohali),
Punjab;iii. All parcels of land admeasuring 26 Bighas 3 biswa comprised in various Khewat/Khatoni Numbers, situated at Village Manpura, Tehsil Baddi, District
Solan, Himachal Pradesh;iv. All parcels of land admeasuring 91 Bighas 1 Biswa, comprised in various Khewat/Khatoni Numbers situated at Village Malpur, Tehsil Baddi, District
Solan, Himachal Pradesh;v. All parcels of Land bearing Plot No. E-4, Phase-2, Area measuring 9435.66 Sq.Yds., situated at Industrial Area S.A.S. Nagar, District S.A.S. Nagar
(Mohali), Punjab;
4 The long-term loans and working capital facilities from State Bank of India and EARC (loan I) are additionally secured by way of mortgage of personal property of promoter directors, viz. Mr. Soshil Kumar Jain, Dr. Rajesh Jain and Mr. Sandeep Jain.

Panacea Biotec Ltd. 145
vi. Flat number 3, 4, 203 and 303 situated at Elite Heights Apartment, at municipal no. 6-3-1238/15/1 & 6-3-1238/16 survey no. 32/1, at Somajiguda, Hyderabad, Telangana;
vii. Industrial plot no. A-24, A-25 and A-27 having land measuring 718.92 sq yds each at Block B-1 Extension and Industrial plot no. E-12 having land measuring 1,372.52 sq yds at Block B-1, situated at Mohan Co-operative Industrial Estate, Mathura Road, New Delhi;
viii. Plot no.35 & 36 measuring 900 sq. yds. each at Silver City Main, Village Bishanpura, MC Zirakpur, Tehsil Dera Bassi, District SAS Nagar (Mohali), Punjab;
ix. 80 flats, i.e., 20 flats comprising in block A-2 bearing no: 101 to 104, 201 to 201, 301 to 304, 401 to 404 & 501 to 504 each having super area 1495 sqft and 60 flats in block B-10, B-11, B-12 bearing no. 101 to 104, 201 to 201, 301 to 304, 401 to 404 & 501 to 504 each having super area 1161 sqft (30 flats) and super area 1186 sq ft (30 flats) in building built on land measuring 28 bigha 11 biswa in khewat khatoni no: 89/91 comprised in khasra no: 1747 (4-12), khewat khatoni no: 168/194 khasra no: 1970/1746 (1-15), 1971/1746 (3-0), 1748 (9-0) khewat khatoni no: 339/333 khasra no: 1749 (4-11), 1750 (5-13), kitas 6, village Bhatoli Kalan, Hadbast no. 214, Pargna Dharampura, Tehsil Baddi, District Solan, H.P.
x. Flat no. 201 at Samarpan Complex, village Chakala, Taluka Andheri (East), Mumbai;xi. Flat no. 401, 601 in A-wing and Flat no. 214 in C-wing situated at Progressive’s Signature Tower, plot no: 53/54 sector-6, Ghansoli, Navi Mumbai;xii. Residential premises no. 703, 704, 903, 904 and 1001 to 1004 in wing “B” of Sagar Heights Building F; and Commercial premises no. 707 to 712, 714
to 718, 808 to 812 and 814 to 818 in Sagar Tech Plaza- Building A, all situated at CTS no . 721/A, 721B, & 721/1 survey no: 14,15,2052, at village Mohili, Andheri Kurla Road, Andheri (East), Mumbai; and
xiii. Industrial plot no. Gen-72/3, land measuring 5518 sqmts in the Trans Thane Creek Industrial Area, Navi Mumbai.(C) Repayment terms and security of the loans outside the CDR Scheme:
1. Rupee term loan from BIRAC for H1N1 influenza vaccine project, with amount outstanding of Rs.49.00 million (March 31, 2018: Rs.70.00 million), was rescheduled in the financial year 2015-16. It is repayable in ten equal half-yearly instalments commencing from March 31, 2017. This loan is secured by way of hypothecation of all equipment, apparatus, machineries, machineries spares, tools and other accessories, goods and/or other movable property (both present and future) of the Company by way of first charge on pari-passu basis.
2. Rupee term loan from BIRAC for Streptococcus pneumococcal conjugate vaccine project, with amount outstanding of Rs.10.50 million (March 31, 2018: Rs.12.00 million), is repayable in ten equal half-yearly instalments commencing from May 29, 2017 and is secured by way of hypothecation of all equipment, apparatus, machineries, machineries spares, tools and other accessories, goods and/or other movable property (both present and future) of the Company by way of first charge on pari-passu basis.
3. The unsecured rupee term loan from DST of Rs.8.00 million (March 31, 2018: Rs.8.00 million), is for specific project and is repayable in ten equal annual instalments commencing from September 2012.
4. Rupee term loan from TDB of Rs.57.98 million as at March 31, 2018 (Rs.57.98 million) is for Dengue vaccine project and is repayable in nine equal half-yearly instalments commencing from July 1, 2020 and is secured by way of (i) first pari-passu charge on the whole of the moveable properties of the Company including its movable plant and machinery, machinery spares, tools and accessories and other movables both present and future except book debts; and (ii) mortgage of immovable properties of the Company being land admeasuring 1011.11 sq. yards, situated at Plot no. 37, Sector 21-A, Urban Estate, Faridabad, Haryana.
5. Loan from related parties and loan from bodies corporate mentioned above are payable after April 7, 2024. (D) Liability component of compound financial instruments
Further to note 17 (f ), the Holding Company had issued 16,300,000 0.5% cumulative non-convertible and non-participating redeemable Preference shares of Rs.10 each to the three promoters viz. Mr. Soshil Kumar Jain, Dr. Rajesh Jain and Mr. Sandeep Jain. The preference shares are presented in the balance sheet as follows:
Notes to the Consolidated Financial Statements for the year ended March 31, 2019
(Rs. in million)
Particulars As atMarch 31, 2019
As atMarch 31, 2018
Value of preference shares issued 163.00 163.00 Equity component of preference shares (refer note (i) below) (96.39) 96.39
66.61 259.39 Interest expense (refer note (ii) below) 10.84 9.73 Opening interest accrued 27.99 18.26 Non-current borrowings 105.44 287.38
Notes:i) The equity component is the difference between fair value of liability component computed at the effective interest rate of 11% p.a. and the value of preference
shares issued, which is presented as a separate component of equity under Statement of Changes in Equity.ii) Interest expense is calculated by applying the effective interest rate of 11% p.a. to the liability component.iii) For terms attached to 0.5% cumulative non-convertible and non-participating redeemable preference shares refer note 17 (f ).
(E) Refer note 45 for information on assets pledged and mortgaged as security by the Group.
(F) Refer note 51 for defaults of repayment of loans and interest thereon.

Annual Report 2018-19146
Notes to the Consolidated Financial Statements for the year ended March 31, 2019
(Rs. in million)Particulars As at
March 31, 2019As at
March 31, 201820. Non-current provisions
Provision for gratuity 187.01 153.90 Provision for compensated absences 210.79 111.49 Total 397.80 265.39 Note: Refer note 48 for disclosure of employee benefits obligations
21. Other non-current liabilitiesDeferred government grant 38.20 42.92 Deferred income 1.49 - Total 39.69 42.92
22. Borrowings (current)From banks (secured) Cash credits (refer note (i) & (iii) below, note 19 (A), (B) and (C) and note 60) 654.79 1,405.56 Others (unsecured)Loan from related parties (refer note (ii) and (iv) below) 3.38 215.18 Loan from bodies corporate (refer note (iv) below) 35.68 28.11 Total 693.85 1,648.85
Notes: i) Rate of interest - The Group’s current borrowings from banks are at an effective weighted average rate of 9% to 11% (31 March 2018: 9% to 11%) per annum.ii) Refer note 44 for related party disclosure.iii) Refer note 45 for information on assets pledged and mortgaged as security by the Group.iv) Refer note 51 for defaults of repayment of loans and interest thereon. v) Refer note 52 for disclosure of fair value in respect of financial liabilities measured at amortised cost and note 53 for maturities of financial liabilities.Cash credits from banks
Axis Bank - 20.23 Bank of India 152.40 252.95 Canara Bank 99.30 152.19 IDBI Bank 14.62 65.04 Indian Overseas Bank 43.20 196.97 State Bank of India 224.78 530.69 Union Bank of India 120.49 187.49
Loan from related parties (refer note 44)Trinidhi Finance Private Limited 3.38 3.07 Dr. Rajesh Jain - 94.63 Mr. Soshil Kumar Jain - 104.75 Mrs. Sunanda Jain - 12.73
Loan from bodies corporate Ulterior Holdings Private Limited 35.68 28.11
Total 693.85 1,648.85
23. Trade payablesDue to:- micro, small and medium enterprises (refer note 43) 18.80 34.71 - others 2,678.30 2,737.24 Total 2,697.10 2,771.95

Panacea Biotec Ltd. 147
Notes to the Consolidated Financial Statements for the year ended March 31, 2019
(Rs. in million)
As atMarch 31, 2019
As atMarch 31, 2018
24. Other financial liabilities (current)Current maturities of long-term borrowings 5,309.88 2,051.58 Interest accrued but not due on borrowings 7.33 19.97 Interest accrued and due on borrowings 12.84 37.36 Unclaimed dividend on equity shares (refer note (i) below) - 0.12 Deposit from trading agents 55.85 61.16 Others 9.99 52.55 Total 5,395.89 2,222.74 Notes: i) Not due for deposit to the Investor Education and Protection Fund
ii) Refer note 52 for disclosure of fair value in respect of financial liabilities measured at amortised cost and note 53 for maturities of financial liabilities.
iii) Refer note 51 for defaults of repayment of loans and interest thereon.
25. Other current liabilitiesAdvances from customers 116.58 103.39 Income received in advance 0.76 0.76 Deferred government grant 0.84 6.57 Statutory liabilities 29.82 82.60 Others 3.39 3.97 Total 151.39 197.29
26. Provisions (current)Provision for compensated absences 64.43 68.99 Provision for gratuity - 0.41 Other provisions - 0.03 Total 64.43 69.43
Changes in other provisionsParticulars Other provisionsProvision at March 31, 2018 0.03 Changes during the year (0.03)Provision at March 31, 2019 -
27. Current tax liabilities (net) Provision for tax 74.75 44.96 Less: Advance tax paid - (44.88)Total 74.75 0.08
(Rs. in million)
For the year ended March 31, 2019
For the year ended March 31, 2018
28. Revenue from operationsSale of products
Manufactured goods 4,028.38 5,305.85 Traded goods 441.04 404.26
Sale of servicesContract manufacturing 53.23 56.69
Other operating revenueExport benefits 40.76 64.59 Income from contract research - 16.44 Research and license fees - 110.36 Royalty income 0.71 - Scrap sale 2.84 3.05 Others - 0.37
Total 4,566.96 5,961.61

Annual Report 2018-19148
(Rs. in million)
For the year ended March 31, 2019
For the year ended March 31, 2018
29. Other incomeIncome from investments
Dividend income from equity instruments 0.03 0.02 Interest income from:
Bank deposits 4.86 4.43 Others 1.92 3.85
OthersGain on foreign currency transactions and translations - 6.38 Excess provisions written back 2.92 45.18 Government grant income 14.25 13.12 Lease rent 2.24 2.88 Miscellaneous 18.61 2.00
Total 44.83 77.86
30. Cost of materials consumedRaw materials and packing materials Opening stock 717.60 659.33 Add : Purchases during the year 936.62 1,854.56
1,654.22 2,513.89 Less : Closing stock 395.55 717.60 Total 1,258.67 1,796.29
31. Purchases of traded goodsTraded goods 91.93 183.49 Total 91.93 183.49
32. Changes in inventories of finished goods, stock in trade and work in progressOpening Stock Finished goods 428.65 421.45 Work-in-progress 262.90 170.85 Traded goods 77.95 69.91 Total 769.50 662.21 Closing stock Finished goods 246.57 428.65 Work-in-progress 111.33 262.90 Traded goods 39.77 77.95 Total 397.67 769.50 Changes in inventories ((Increase)/Decrease) Finished goods 182.08 (7.20) Work-in-progress 151.57 (92.05) Traded goods 38.18 (8.04)Total 371.83 (107.29)
33. Employee benefits expenseSalary and wages 1,337.09 1,335.88 Contribution to provident and other funds (refer note 48) 93.62 135.57 Staff welfare expenses 40.09 44.47 Total 1,470.80 1,515.92
34. Finance costsInterest expense 849.69 963.52 Other borrowing costs 198.60 42.26 Total 1,048.29 1,005.78
35. Depreciation and amortisation expenseDepreciation on tangible property, plant and equipment 524.85 551.42 Amortisation of intangible assets 15.17 21.40 Total 540.02 572.82
Notes to the Consolidated Financial Statements for the year ended March 31, 2019

Panacea Biotec Ltd. 149
(Rs. in million)
For the year ended March 31, 2019
For the year ended March 31, 2018
36. Other expenses Analytical testing and trial 27.29 41.63 Advertising and sales promotion 136.44 181.15 Allowance for expected credit loss and doubtful advances 47.87 - Contract manufacturing 35.55 52.15 Consumption of stores and spares 269.11 179.00 Commission on sales 61.72 69.70 Directors' sitting fees 2.35 2.34 Freight and forwarding 114.49 118.98 Insurance 46.85 46.99 Legal and professional 149.15 112.33 Loss on sale of property, plant and equipment (net) 5.19 - Loss on foreign exchange transactions and translations (net) 158.24 63.66 Power and fuel 345.49 335.22 Printing and stationery 9.39 11.74 Postage and communication 27.40 30.21 Payment to auditors (refer note 41) 6.97 5.62 Provision for service tax receivable - 23.84 Repair and maintenance :
Buildings 10.02 18.76 Plant and machinery 44.16 41.08 Others 29.60 33.38
Rent 12.95 14.44 Royalty - 0.52 Rates and taxes 53.36 52.42 Travelling and conveyance 84.78 90.27 Vehicle running and maintenance 27.36 33.95 Bad debts and advances written off 71.22 - Intangibles assets under development provided/written off 233.86 - Property, plant and equipments written off 318.57 - Claims 269.43 - Security charges 26.62 24.75 Office expenses 11.85 12.78 Miscellaneous 48.39 81.30Total 2,685.67 1,678.21
37. Exceptional itemsAdjustment on settlement of debts (refer note 59) 3,133.49 - Litigation settlement fee received* 206.59 - Total 3,340.08 - *During the year, the Holding Company has received an amount of Rs.206.58 million as legal proceedings avoidance settlement fee, as per the terms of the Settlement Agreement entered into by the Holding Company and its partner, Apotex, with Celgene Corporation, USA for settlement of disputes regarding patents covering Abraxane drug product and the Holding Company's ANDA for paclitaxel protein bound particles for injectable suspension, 100mg/vial, a generic version of Abraxane.
Notes to the Consolidated Financial Statements for the year ended March 31, 2019

Annual Report 2018-19150
(Rs. in million)
For the year ended March 31, 2019
For the year ended March 31, 2018
38 Income taxIncome tax expense consists of the following:Current tax expense for the year 75.47 10.91 Deferred taxMinimum alternative tax (MAT) credit adjustment/(entitlement) 27.83 98.84 Deferred tax expense/(credit) (26.23) (11.17)Total income tax 77.07 98.58 Reconciliation of the estimated tax expense at statutory income tax rate to income tax expense reported in the statement of profit and loss is as follows:Profit/(loss) before income taxes from continuing operations 486.15 (637.35)Profit/(loss) before income taxes from discontinued operations (23.90) (24.04)Profit/(loss) before income taxes from continuing and discontinued operations 462.25 (661.39)At Holding Company’s statutory income tax rate of 34.944% (March 31, 2018: 34.608%) 161.53 (228.89)Adjustments in respect of current income taxMinimum alternative tax (MAT) for current year 75.47 - Deferred tax not created on unused losses (187.76) 230.85 Minimum alternative tax (MAT) credit adjustments 27.83 98.84 Others - (2.22)Total 77.07 98.58
Notes to the Consolidated Financial Statements for the year ended March 31, 2019
Significant components of net deferred tax assets and liabilities for the year ended March 31, 2019 are as follows: Opening balance Recognised/
reversed through profit and loss
Recognised/ reversed through other
comprehensive income/ transferred to
discontinued operations
Closing balance
Deferred tax assets/liabilities in relation to:Deferred tax liabilities arising out of:Property, plant and equipment and intangible assets 1,865.64 (399.76) - 1,465.88 Capital expenditure on research and development 105.93 (97.49) - 8.44 Others 24.03 (24.03) - -
1,995.60 (521.28) - 1,474.32 Deferred tax assets arising out of:Expenditure allowed on payment basis 425.54 (18.48) - 407.06 Effect of unabsorbed business loss and depreciation 1,385.86 (334.10) - 1,051.76 Minimum alternative tax credit entitlement 230.14 (38.10) - 192.04 Others 58.12 (129.00) 92.24 21.36
2,099.66 (519.68) 92.24 1,672.22 Net deferred assets/(liabilities) 104.06 1.60 92.24 197.90
Significant components of net deferred tax assets and liabilities for the year ended March 31, 2018 are as follows: Opening balance Recognised/
reversed through profit and loss
Recognised/ reversed
through other comprehensive
income
Closing balance
Deferred tax assets/liabilities in relation to :Deferred tax liabilities arising out of:Property, plant and equipment and intangible assets 2,073.40 (207.76) - 1,865.64 Capital expenditure on research and development 74.36 31.57 - 105.93 Others 24.21 (0.18) - 24.03
2,171.97 (176.37) - 1,995.60 Deferred tax assets arising out of:Expenditure allowed on payment basis 467.60 (42.06) - 425.54 Effect of unabsorbed business loss and depreciation 1,511.54 (125.68) - 1,385.86 Minimum alternative tax credit entitlement 328.98 (98.84) - 230.14 Others 47.95 2.54 7.63 58.12
2,356.07 (264.04) 7.63 2,099.66 Net deferred assets/(liabilities) 184.10 (87.67) 7.63 104.06

Panacea Biotec Ltd. 151
Tax losses No deferred tax asset has been recognised on these unutilized tax losses as there is no evidence that sufficient taxable profit will be available in future against which they can be utilised.
(Rs. in million)Year of expiry
As atMarch 31, 2019
As atMarch 31, 2018
Financial yearBusiness Loss
2011-12 2019-20 413.76 40.14 2012-13 2020-21 1,542.60 1,542.60 2013-14 2021-22 1,554.28 1,554.28 2015-16 2022-23 - 184.31 2016-17 2024-25 74.67 - 2017-18 2025-26 124.49 -
Potential tax benefit 1,296.35 1,160.61 Unabsorbed Depreciation
2016-17 Unlimited - 239.18 Potential tax benefit - 83.58 Long term capital loss
2011-12 2019-20 - 254.21 2013-14 2021-22 - 253.90 2015-16 2023-24 - 2.90 2017-18 2025-26 608.79 -
Potential tax benefit 141.82 117.89 Short term capital loss
2017-18 2025-26 72.98 82.39 Potential tax benefit 25.50 28.51
Deferred tax assets have been recognised to the extent there are sufficient taxable temporary differences.Minimum Alternate Tax (MAT)The Holding Company has unused MAT credit which has been recognised on the basis that recovery is probable in the foreseeable future. MAT credit of Rs.165.41 million, Rs.165.71 million and Rs.69.92 million will expire on March 31, 2025, March 31, 2026 and March 31, 2034 respectively.
(Rs. in million)Particulars As at
March 31, 2019As at
March 31, 201840. Contingent liabilities and commitments(A) Contingent liabilities (to the extent not provided for)
Disputed demands/show cause notices under:a) Income tax cases (refer note (a)(i), (ii) and (iii) below) 3,462.86 3,462.86 b) Customs duty cases (refer note (b) below) 4.00 4.00 c) Service tax (refer note (c) and (d) below) - 72.60 d) Duty saved under export licenses - 76.95 e) Labour cases (in view of large number of cases, it is impracticable to disclose each case) 170.00 170.00 f ) Sales Tax / VAT cases (refer note (e) below) 403.73 -
(Rs. in million)
For the year endedMarch 31, 2019
For the year endedMarch 31, 2018
39. Earnings per share (EPS)Profit/(loss) attributable to shareholders from continuing operations 409.08 (735.93)Profit/(loss) attributable to shareholders from discontinued operations (32.41) (24.04)Weighted average number of equity shares 61,250,746 61,250,746 Face value per equity share (in Rs.) 1.00 1.00 Profit/(loss) per equity share - Basic and diluted earnings per equity share from continuing operations (In Rs.) 6.68 (12.02) - Basic and diluted earnings per equity share from discontinued operations (In Rs.) (0.53) (0.39) - Basic and diluted earnings per equity share from continuing and discontinued operations (In Rs.) 6.15 (12.41)
Notes to the Consolidated Financial Statements for the year ended March 31, 2019

Annual Report 2018-19152
Notes to the Consolidated Financial Statements for the year ended March 31, 2019
Notes :a) i) Includes income tax demand of Rs.162.22 million in respect to Assessment Year (AY) 2005-06. The Income Tax department had issued demand
based on certain grounds related to purchases made by the Holding Company from an overseas vendor. The matter was decided in favour of the Holding Company and the demand was cancelled by CIT (Appeals). However, the Income Tax Department has filed appeal before Income Tax Appellate Tribunal (ITAT) against the order of CIT (Appeals) which is pending at present. The Holding Company believes that it has merit in these cases, hence no provision is required.
ii) A search operation was conducted by the Income Tax Department in the premises of the Holding Company in January 2012 and hence the Holding Company had re-filed the income tax returns for the AY 2006-07 to 2012-13. During the year ended March 31, 2015, the Income Tax department completed the assessment of the said years, disallowed certain expenses and issued demand of Rs. 3,294.90 million (including interest) on various grounds. The Holding Company preferred appeals before the CIT (Appeals) against the orders of the Income Tax department. The appeals were decided in favour of the Holding Company and the demand was cancelled. However, CIT (Appeals) has made certain disallowances with respect to AY 2010-11 and AY 2011-12 against which the Holding Company has filed appeals before the ITAT. The Income Tax Department has also filed appeals before ITAT against the orders of CIT (Appeals). The appeals before ITAT are pending at present. Based on legal advice, the Holding Company believes that it has merits in these cases, hence no provision is required.
iii) The income tax department issued a demand of Rs.5.74 million in respect of AY 2009-10 on the Holding Company due to non-deduction of withholding tax on payment made to a non-resident person towards purchase of immovable property. The Holding Company had filed an appeal before CIT (Appeals) against the order of department but the CIT (Appeals) gave decision in favour of department. The Holding Company has filed an appeal before Income Tax Appellate Tribunal (ITAT) against the order of CIT (Appeals) which is pending at present. The Holding Company believes that it has merit in the case, hence no provision is required.
b) In respect of custom duty demand, the Assessing Officer levied custom duty on certain exempted items imported by the Holding Company. The Holding Company has deposited the entire amount of demand under protest amounting to Rs.4.00 million and the matter is pending before the Customs, Excise and Service Tax Appellate Tribunal (“CESTAT”). The Holding Company believes that it has merit in its case, hence no provision is required.
c) In respect of service tax demands for Financial year (FY) 2003-04 to FY 2011-12, the Assessing Officer levied service tax on foreign services rendered and delivered outside India by the Holding Company and certain other services on which there was no liability to pay service tax. The cases are currently pending with CESTAT. The CESTAT remanded the matter back to the Commissioner of Service Tax, Delhi for denovo adjudication. Final orders from the CESTAT have been received.
d) In respect of service tax demands for FY 2008-09 to FY 2010-11, service tax department has disallowed CENVAT Credit of input services availed and distributed by the Holding Company as input service distributor. The hon'ble CESTAT has decided the case in favour of the Holding Company vide its order dated January 22, 2019.
e) In respect of sales tax / VAT demands for Ahmedabad, Delhi, Lucknow, Bangaluru, Patna, Ranchi and Pune, the department has disallowed certain credit/notes and non submission of statutory forms etc. The Holding Company believes that it has merit in these cases and hence no provision is required.
f ) The Holding Company had manufactured and offered supply of certain vaccines which were manufactured against the confirmed order received from the Ministry of Health and Family Welfare (MOH&FW). Some quantities of vaccines were supplied during December 2011, the balance could not be supplied in view of disputes with respect to delivery dates and in the meantime the stock of such vaccines amounting to Rs.74.1 million expired. Further, the Holding Company had also received advance market commitment (AMC) amounting to Rs.100.00 million against these vaccines. The refund of the advance so received (after adjusting the amount receivable against the vaccines already supplied) was demanded back by MOH&FW along with interest on account of non-supply of balance quantities of vaccines. In view of above disputes, the Holding Company obtained a stay order from the Hon’ble Delhi High Court against recovery of said amount, till the disputes are finally resolved through arbitration. The matter was decided in favour of the Company on March 14, 2019.
g) Radhika Heights Ltd. ("RHL") (initially known as Maxwell Impex (India) Private Limited) owns an industrial Plot bearing No. G-3, Block B-1 Extn., Mohan Co-operative Industrial Estate, Mathura Road, New Delhi, which was earlier allotted to Shri Ramesh Chandra Aggarwal by way of Registered Perpetual Lease deed. Shri Ramesh Chandra Aggarwal formed a company in the name of Maxwell Impex (India) Private Limited and conveyed his perpetual lease/ sublease hold rights in respect of the said plot to it. The entire shareholding of this company was subsequently purchased by Panacea Biotec Limited from the then shareholders of this company during financial year 1999-2000. In 2003, Delhi Development Authority ('DDA') floated a scheme for conversion of leasehold rights in to freehold rights on the basis of General Power of Attorney. RHL applied for conversion of the leasehold rights to freehold rights. RHL received a demand towards unearned increase charges of Rs.100.78 million from DDA without disclosing the nature and the basis of demand. RHL has filed a writ petition with the Hon’ble Delhi High Court which is pending at present. Based on legal advice, the Group believes that it has merits in this case, hence no provision for this demand towards unearned increase charge is currently recorded.
(B) Capital and other commitmentsa) Estimated amount of contracts remaining to be executed on capital account, net of advances and not provided in the books are as follows:
(Rs. in million)Particulars As at
March 31, 2019As at
March 31, 2018Property, plant and equipment 36.75 5.78 b) Other commitments :
i) Export commitments of Rs. Nil (March 31, 2018 : Rs.488.91 million) under advance licenses schemes and obligation outstanding against EPCG licenses.
ii) The Holding Company has received financial assistance in the form of soft loan under various projects from Department of Biotechnology, Department of Science & Technology and Technology Development Board respectively. As per the terms of related agreements, the Holding Company is also required to incur expenditure in the form of monetary contribution to the relevant projects. The amount of commitment is not quantifiable.
iii) Refer note 42 for commitments relating to lease arrangements.

Panacea Biotec Ltd. 153
Notes to the Consolidated Financial Statements for the year ended March 31, 2019
41. Discontinued OperationsSlump sale of Pharmaceutical businessi) On February 26, 2019, as part of the business reorganization, the Board of Directors of the Holding Company have approved transfer of
pharmaceutical formulations business including related research and development activities and natural products extraction activities (referred to as ‘Pharma business’) to a recently incorporated wholly owned subsidiary, Panacea Biotec Pharma Limited (‘PBPL’), with an objective to segregate the different businesses of the Company to ensure smooth functioning of each business in the future. The divestment has been approved by the shareholders of the Company in their extra-ordinary general meeting held on March 25, 2019.Accordingly, the activities of the Pharma business of the Holding Company, that are considered as disposal group, are presented as a discontinued operation in accordance with the provisions of Indian Accounting Standard 105 – ‘Non-current Assets Held for Sale and Discontinued Operations in the Standalone Financial Statements of the Holding Company.Subsequent to the year end, to implement the above divesture, the Holding Company has executed a Business Transfer Agreement (‘BTA’) with PBPL to transfer Pharma business to PBPL, together with all tangible assets (except R&D center and natural products extraction facility at Lalru) and all intangible assets as specified in the BTA in relation to the pharmaceutical formulations business including pharmaceutical formulations facility at Baddi, Himachal Pradesh, as a going concern through slump sale. This transaction has no impact on these Consolidated Financial Statements since PBPL has been consolidated therein.
ii) Demerger of Real estate businessOn February 26, 2019 and May 30, 2019, the Board of directors of the Holding Company have approved a scheme of arrangement for demerger of its real estate business comprising wholly owned subsidiary Radhika Heights Limited (‘RHL’) alongwith its step down subsidiaries and two real estate properties from the Holding Company (‘Demerged Undertaking’) to its wholly-owned subsidiary (‘Transferee Company’). Upon implementation of the demerger scheme and completion of related compliances, the Transferee Company (Ravinder Heights Limited) shall issue one equity share of Re. 1 each for each equity share held by the equity shareholders of the Holding Company as on the record date fixed on that behalf and the said equity shares shall be listed at the BSE and NSE in compliance with the applicable SEBI Regulations. In accordance with the provisions of Indian Accounting Standard 105 – ‘Non-current Assets Held for Sale and Discontinued Operations’. The assets / liabilities of the real estate business have been disclosed under “Assets classified as held for sale and discontinued operations” / “Liabilities directly associated with assets classified as held for sale and discontinued operations” in the Standalone and Consolidated Statement of Assets and Liabilities.
iii) Financial performance and cash flows for the Real estate business:(Rs. in million)
For the year endedMarch 31, 2019
For the year endedMarch 31, 2018
a) Analysis of profit / (loss) from discontinued operationsProfit / (loss) for the year from discontinued operationsRevenue from operations - -Other income 5.77 4.47 Total Income 5.77 4.47ExpensesCost of Materials consumed - - Purchases of stock-in-trade - - Changes in inventories of finished goods, stock-in-trade and work-in-progress - - Excise duty - - Employee benefits expense - Finance costs 0.01 0.01 Depreciation and amortisation expense 10.30 12.51 Other expenses 19.36 15.99 Total expenses 29.67 28.51 Profit/(loss) before exceptional items and tax (23.90) (24.04)Exceptional items - - Profit/(loss) before tax from discontinued operations (23.90) (24.04)Tax expense 8.51 - Profit/(loss) after tax from discontinued operations (32.41) (24.04)
b) Net cash flows attributable to the discontinued operationsNet cash (outflows) / inflows from operating activities 70.50 -Net cash used in investing activities (777.16) -Net cash (outflows) / inflows from financing activities (0.01) -Net cash (outflows) / inflows (706.67) -
c) Book value of assets and liabilities of discontinued operationsProperty, plant and equipment and intangible assets (including CWIP) 538.76 - Goodwill 8.96 -Investments - - Other non-current financial assets 56.66 - Other non-current assets 177.60 - Inventories 1,680.16 - Trade receivable - -

Annual Report 2018-19154
Notes to the Consolidated Financial Statements for the year ended March 31, 2019
(Rs. in million)Particulars As at
March 31, 2019As at
March 31, 2018Cash and cash equivalents 3.57 - Other current financial assets 194.01 - Other current assets 4.68 - Total assets 2,664.40 - Non-current liabilities (Provisions) 11.46 - Deferred tax liabilities 88.74 - Trade payables 152.92 - Other financial liabilities 50.00 - Other current liabilities 2.08 - Total liabilities 305.20 - Net assets 2,359.20 -
d) Payment to auditors*As auditor- Audit fee 2.60 2.60 - Limited review fee 2.40 2.40 In other capacity- Certification and other matters 1.42 0.19 - Reimbursement of out of pocket expenses 0.33 0.17 Total 6.75 5.36 * excludes service tax / goods and service tax
42. LeasesGroup as a lessee:Operating leasesThe Group has taken various residential, office and godown premises under operating lease agreements. These are generally cancellable and are renewable by mutual consent on mutually agreed terms. There are no sublease payments expected to be received under non-cancellable subleases at the balance sheet date and no restriction is imposed by lease arrangements.
(Rs. in million)Particulars For the year ended
March 31, 2019For the year ended
March 31, 2018Lease payments for the year recognised in the consolidated statement of profit and loss 12.95 14.44
Group as a lessorOperating leasesThe Group had earlier leased out certain assets situated at Lalru, Punjab on operating lease to PanEra Biotec Private Limited. The said lease deed has been terminated w.e.f. May 25, 2018.There is no uncollectible minimum lease payments receivable at the balance sheet date. (Rs. in million)Particulars For the year ended
March 31, 2019For the year ended
March 31, 2018Lease income for the year recognised in the consolidated statement of profit and loss 2.24 2.88
For assets given under operating lease agreements:i) The Group had earlier leased out certain assets situated at Lalru, Punjab on operating lease to PanEra Biotec Private Limited, the summary of
which is as under:Gross block Accumulated depreciation
Particulars As atMarch 31, 2019
As atMarch 31, 2018
As atMarch 31, 2019
As atMarch 31, 2018
Building - 341.10 - 98.60 Furniture and fittings - 41.18 - 36.21 Office equipment - 21.65 - 19.55 Plant and equipment - 2,215.11 - 1,308.59 Computer equipment - 13.26 - 12.59 Total - 2,632.30 - 1,475.54
ii) The depreciation expense for such assets is recorded in the Consolidated Statement of Profit and Loss as follows: (Rs. in million)Particulars For the year ended
March 31, 2019For the year ended
March 31, 2018Building - 10.68 Furniture and fittings - 1.85 Office equipment - 0.06 Plant and equipment - 135.32 Computer equipment - 0.00 Total - 147.91
The lease agreement has been terminated w.e.f. May 25, 2018.

Panacea Biotec Ltd. 155
Notes to the Consolidated Financial Statements for the year ended March 31, 2019
43. (A) Details of dues to micro, small and medium enterprises as defined under the Micro Small and Medium Enterprises Development Act, 2006 [“MSMED Act”]: (Rs. in million)S. no.
Particulars As at March 31, 2019 As at March 31, 2018 Principal Interest* Principal Interest*
i) The principal amount and the interest due thereon remaining unpaid to any supplier as at the end of each accounting year
18.80 9.33 34.71 6.15
ii) The amount of interest paid by the buyer in terms of Section 16 of the MSMED Act along with the amounts of the payment made to the supplier beyond the appointed day during each accounting year
69.68 - 66.92 -
iii) The amount of interest due and payable for the period of delay in making payment (which have been paid but beyond the appointed day during the year) but without adding the interest specified under MSMED Act
- - - -
iv) The amount of interest accrued and remaining unpaid at the end of each accounting year - 9.33 - 6.15v) The amount of further interest remaining due and payable even in the succeeding years, until
such date when the interest dues as above are actually paid to the small enterprise for the purpose of disallowance as a deductible expenditure under Section 23 of the MSMED Act
- - - -
Note: *Included in “expense payable” in note 23.
44. Related Party DisclosuresAs per Ind AS 24, the disclosure of transactions with related parties are as given below:(A) Names of related parties and related party relationships
a) Joint Venture: • Chiron Panacea Vaccines Private Limited (“CPV”) (Under liquidation) b) Key Management • Mr. Soshil Kumar Jain - Chairman and Whole-time Director Personnel: • Mr. Ravinder Jain - Managing Director (upto February 21, 2018) • Dr. Rajesh Jain - Managing Director (Joint Managing Director upto March 11, 2018) • Mr. Sandeep Jain - Joint Managing Director • Mrs. Sunanda Jain - Whole-time Director (w.e.f. March 12, 2018) • Mr. Sumit Jain - Whole-time Director • Mr. Ankesh Jain - Whole-time Director • Mr. Vinod Goel - Group CFO and Head Legal & Company Secretary • Mr. Devender Gupta - Chief Financial Officer & Head Information Technology • Mr. R. L. Narasimhan - Non-Executive Independent Director • Mr. N. N. Khamitkar - Non-Executive Independent Director • Mr. K. M. Lal - Non-Executive Independent Director • Mr. O. P. Kelkar - Non-Executive Independent Director (upto July 21, 2018) • Mrs. Manjula Upadhyay - Non-Executive Independent Director • Mr. Mukul Gupta - Non-Executive Independent Director • Mr. Ashwini Luthra - Non-Executive Independent Director (w.e.f. October 18, 2018) • Mr. Bhupinder Singh - Non-Executive Independent Director (w.e.f. April 08, 2019) • Mr. Nithin Krishna Kaimal - Non-Executive Director (w.e.f. April 08, 2019)
c) Relatives of Key Management personnel having transactions with the Group: • Mr. Ashwani Jain, son-in-law of Mr. Soshil Kumar Jain • Mr. Shagun Jain, son-in-law of Mrs. Sunanda Jain • Mrs. Radhika Jain, daughter of Mrs. Sunanda Jain • Mrs. Shilpy Jain, wife of Mr. Sumit Jain and daaughter-in-law of Mrs. Sunanda Jain • Mr. Harshet Jain, son of Dr. Rajesh Jain and brother of Mr. Ankesh Jain
d) Enterprises over which Person(s) (having control or significant influence over the Holding Company / Key management personnel(s), along with their relatives) are able to exercise significant influence: • Neophar Alipro Limited (“Neophar”) • Lakshmi & Manager Holdings Limited (“LMH”), • Trinidhi Finance Private Limited (“Trinidhi”) subsidiary of LMH • Best General Insurance Company Limited (subsidiary of LMH) • First Lucre Partnership Co. (holding shares in the Company) • White Pigeon Estate Private Limited • OKI Estate Private Limited
(B) Transactions with the Joint Venture Company: (Rs. in million)S. No. Particulars As at March 31, 2019 As at March 31, 2018I Transactions made during the year:
1 Rent receivedCPV 0.36 0.36
II Year end balances:1 Investments
CPV 22.96 22.96 2 Outstanding receivable
CPV 0.03 -

Annual Report 2018-19156
Notes to the Consolidated Financial Statements for the year ended March 31, 2019
(C) Transactions with Key Management Personnel, their relatives and Enterprises over which Person(s) (having control or significant influence over the Holding Company / Key management personnel(s), along with their relatives) are able to exercise significant influence:
(Rs. in million)
S. No.
Particulars Key Management Personnel
Relatives of Key Management
Personnel
Enterprises over which Person(s) (having control or significant
influence over the Holding Company / Key management personnel(s), along with their relatives) are able to exercise
significant influenceAs at March
31, 2019As at March 31,
2018As at March
31, 2019As at March 31,
2018As at March
31, 2019As at March 31,
2018I) Transactions made during the year:
1 Short-term employee benefitsMr. Soshil Kumar Jain* 11.19 10.70 Mr. Ravinder Jain* - 35.83 Mrs. Sunanda Jain 5.80 0.31 Dr. Rajesh Jain* 7.30 7.25 Mr. Sandeep Jain* 6.70 6.60 Mr. Sumit Jain* 4.18 4.11 Mr. Ankesh Jain* 2.42 2.30 Mr. Vinod Goel 5.62 5.10 Mr. Devender Gupta 4.37 3.98 Mr. Shagun Jain - 2.06 Mr. Ashwani Jain 3.03 3.03 Mrs. Shilpy Jain 0.35 0.55 Mrs. Radhika Jain 2.14 1.37 Mr. Harshet Jain 0.35 0.60
2 Post-employment benefitsMr. Soshil Kumar Jain* 16.23 23.65 Dr. Rajesh Jain* 10.43 12.95 Mr. Sandeep Jain* 9.64 12.49 Mr. Sumit Jain* 2.95 3.19 Mr. Ankesh Jain* 0.81 0.44 Mr. Vinod Goel 1.33 1.42 Mr. Devender Gupta 0.76 0.53 Mr. Shagun Jain 0.57 0.53 Mr. Ashwani Jain 1.75 1.62 Mrs. Shilpy Jain - 0.11 Mrs. Radhika Jain 0.50 0.29 Mrs. Sunanda Jain 0.24 0.01 Mr. Harshet Jain - -
3 Fee for attending board / committee meetingsMr. R. L. Narasimha 0.33 0.37 Mr. N. N. Khamitkar 0.31 0.28 Mr. K. M. Lal 0.27 0.37 Mr. O. P. Kelkar - 0.25 Mrs. Manjula Upadhyay 0.25 0.25 Mr. Mukul Gupta 0.25 0.25 Mr. Ashwini Luthra 0.10 - Mr. Bhupinder Singh - - Mr. Nithin Krishna Kaimal - -
4 Rent receivedNeophar 0.18 0.18 Trinidhi 0.22 0.22
5 Interest expensesMr. Soshil Kumar Jain 9.43 9.43 Mr. Ravinder Jain - 1.15 Dr. Rajesh Jain 8.88 5.51 Mrs. Sunanda Jain 1.15 - Trinidhi 0.29 0.29

Panacea Biotec Ltd. 157
Notes to the Consolidated Financial Statements for the year ended March 31, 2019
S. No.
Particulars Key Management Personnel
Relatives of Key Management
Personnel
Enterprises over which Person(s) (having control or
significant influence over the Company / Key management personnel(s), along with their relatives) are able to exercise
significant influenceAs at March
31, 2019As at March
31, 2018As at March
31, 2019As at March
31, 2018As at March
31, 2019As at March
31, 2018
6 Consultancy ExpensesMrs. Shilpy Jain 0.48 -
7 Interest converted into loanMr. Soshil Kumar Jain 20.45 - Dr. Rajesh Jain 17.39 - Mrs. Sunanda Jain 8.84 - Trinidhi 1.45 -
8 Loan receivedDr. Rajesh Jain 8.00 40.00
9 Reversal of excess remuneration paid Mr. Soshil Kumar Jain 11.19 10.70 Mr. Ravinder Jain - 10.22 Mrs. Sunanda Jain 5.80 0.45 Dr. Rajesh Jain 7.30 7.25 Mr. Sandeep Jain 6.70 6.60 Mr. Sumit Jain 4.18 4.11 Mr. Ankesh Jain 2.42 2.30
II) Year end balances:1 Loan payable (refer note 19(c)(5))
Mr. Soshil Kumar Jain 125.20 104.75 Dr. Rajesh Jain 120.02 94.63 Mrs. Sunanda Jain# 21.57 12.73 Trinidhi 3.38 3.06
2 Interest/Expense payableMr. Soshil Kumar Jain - 11.97 Dr. Rajesh Jain - 9.40 Mrs. Sunanda Jain# - 7.81 Mrs. Shilpy Jain 0.05 - Trinidhi - 1.19
3 Outstanding receivableTrinidhi - 0.90
4 Remuneration PayableMr. Soshil Kumar Jain* 1.83 0.89 Dr. Rajesh Jain* 1.23 0.60 Mr. Sandeep Jain* 1.13 0.55 Mr. Sumit Jain* 0.81 0.34 Mr. Ankesh Jain* 0.38 0.19 Mr. Vinod Goel 0.50 0.43 Mr. Devender Gupta 0.76 0.33 Mrs. Sunanda Jain 1.04 0.45 Mr. Shagun Jain - 0.17 Mr. Ashwani Jain 0.58 0.25 Mrs. Shilpy Jain 0.25 0.05 Mrs. Radhika Jain 0.29 0.11 Mr. Harshet Jain - 0.05
* Refer note 58
# The outstanding loan payable along with interest payable thereon to late Mr. Ravinder Jain is transferred to his wife Mrs. Sunanda Jain.Note: In respect of personal guarantees given by promoter directors, refer note 19 and note 22. The above transactions are in the ordinary course of business.

Annual Report 2018-19158
45. Assets mortgaged/ hypothecated as security for borrowings are as under:(Rs. in million)
Particulars Note As at March 31, 2019
As at March 31, 2018
Non CurrentProperty, plant and equipment 2.1 7,700.72 8,865.60 Capital work in progress 2.2 54.78 47.57 Intangible assets 2.3 17.23 43.68 Intangible assets under development 2.4 141.15 324.04 Financial assetsLoans 4 11.41 9.93 Other financial assets 5 10.92 2.51 Other non-current assets 8 101.95 222.00
Total non-current assets pledged as security 8,038.16 9,515.33 Current
Inventories 9 760.05 1,490.95 Financial assets
Trade receivables 11 871.04 1,422.66 Cash and cash equivalents 12 68.95 65.24 Other bank balances 13 86.33 52.56 Loans 14 181.13 149.87 Others financial assets 15 27.48 51.71
Non financial assetsOther current assets 16 277.61 303.40
Total current assets pledged as security 2,272.59 3,536.39Assets classified as held for sale and discontinued operations 41 496.12 - Total assets mortgaged and pledged as security 10,806.87 13,051.72
Notes to the Consolidated Financial Statements for the year ended March 31, 2019
46. Segment information
The Company has determined following reportable segments based on the information reviewed by the Company's management:a. Vaccines b. Formulationsc. Research and Developmentd. Real estate
(A) Information about reportable segments (Rs. in million)Particulars Vaccines Formulations Research and
DevelopmentReal Estate Total
For the year ended For the year ended For the year ended For the year ended For the year endedMarch
31, 2019March
31, 2018March
31, 2019March
31, 2018March
31, 2019March
31, 2018March
31, 2019March
31, 2018March
31, 2019March
31, 2018Segment revenue 961.89 1,868.21 3,604.95 3,996.80 0.12 96.60 - - 4,566.96 5,961.61 Other income 6.88 4.21 18.42 56.25 7.20 1.38 5.77 4.45 38.27 66.29 Total Income 968.77 1,872.42 3,623.37 4,053.05 7.32 97.98 5.77 4.45 4,605.23 6,027.90 Less: Income from discontinued operations - - - - - - 5.77 4.45 5.77 4.45 Total Income from continuing operations 968.77 1,872.42 3,623.37 4,053.05 7.32 97.98 - - 4,599.46 6,023.45 Segment result from continuing operations (1,186.86) 175.50 337.11 1,332.21 (655.57) (408.62) - - (1,505.32) 1,099.09 Unallocated corporate expenses 306.88 742.23 Operating profit/ (loss) (1,812.20) 356.86 Less: Interest and finance charges 1,048.29 1,005.78 Add: Unallocated exceptional items gain/ (loss) 3,340.08 - Add: Other income 6.56 11.57 Profit/(loss) before tax from continuing operations
486.15 (637.35)
Less: Tax expense 77.07 98.58 Profit/(loss) after tax from continuing operations 409.08 (735.93)Profit/(loss) after tax from discontinued operations
(32.41) (24.04)
Profit/(loss) for the year 376.67 (759.97)Other comprehensive income/(loss) (4.61) 63.04 Total other comprehensive income 372.06 (696.93)

Panacea Biotec Ltd. 159
Notes to the Consolidated Financial Statements for the year ended March 31, 2019
(B) Additional information by geographiesa) Revenue as per Geographical Markets: (Rs. in million)Segment Domestic Overseas
For the year ended March 31, 2019
For the year ended March 31, 2018
For the year ended March 31, 2019
For the year ended March 31, 2018
Vaccines 791.19 1,208.68 170.70 659.53 Formulations 2,584.52 2,916.01 1,020.43 1,080.79 Research and Development 0.12 4.37 - 92.23 Total 3,375.83 4,129.06 1,191.13 1,832.55 Revenue from discontinued operations - - - - Total Revenue from continuing operations 3,375.83 4,129.06 1,191.13 1,832.55 b) Assets (net) as per geographical markets:Segment Domestic Overseas
As at March 31, 2019
As at March 31, 2018
As at March 31, 2019
As at March 31, 2018
Vaccines 4,336.69 5,345.09 11.29 0.14 Formulations 2,562.74 3,671.07 458.43 721.33 Research and Development 1,656.70 2,106.38 1.66 2.03 Real Estate 2,664.40 2,527.96 - - Corporate (unallocated) 2,063.29 1,701.54 - 0.02 Total 13,283.82 15,352.04 471.38 723.52 Assets transferred to discontinued operations 2,664.40 - - - Total 10,619.42 15,352.04 471.38 723.52 c) Revenue from customers contributing more than 10% of revenue:Segment Domestic Overseas
For the year ended March 31, 2019
For the year ended March 31, 2018
For the year ended March 31, 2019
For the year ended March 31, 2018
Vaccines - - - -Formulations - - - -Research and Development - - - -Real Estate - - - -Total - - - -d) All other assets are located in India therefore separate disclosure for other assets is not presented.
Other Information Vaccines Formulations Research and Development
Real Estate Total
As at March
31, 2019
As at March
31, 2018
As at March
31, 2019
As at March
31, 2018
As at March
31, 2019
As at March
31, 2018
As at March
31, 2019
As at March
31, 2018
As at March
31, 2019
As at March
31, 2018Segment assets 4,347.98 5,345.23 3,021.17 4,392.40 1,658.36 2,108.41 2,664.40 2,527.96 11,691.91 14,374.00 Transferred to discontinued operations 2,664.40 2,664.40 - Total 4,347.98 5,345.23 3,021.17 4,392.40 1,658.36 2,108.41 - 2,527.96 9,027.51 14,374.00 Unallocated corporate assets 2,063.29 1,701.56 Total assets 4,347.98 5,345.23 3,021.17 4,392.40 1,658.36 2,108.41 - 2,527.96 11,090.80 16,075.56 Segment liabilities 754.99 866.95 2,093.58 1,787.89 225.12 257.29 305.20 286.06 3,378.89 3,198.19 Transferred to discontinued operations 305.20 305.20 - Total 754.99 866.95 2,093.58 1,787.89 225.12 257.29 - 286.06 3,073.69 3,198.19 Unallocated corporate liabilities 6,902.43 9,820.11 Total liabilities 754.99 866.95 2,093.58 1,787.89 225.12 257.29 - 286.06 9,976.12 13,018.30
Capital expenditure*:Tangible assets 2.27 30.51 6.89 10.35 0.27 0.18 - 0.23 9.43 41.27 Intangible assets - - - 0.79 39.23 111.35 - 0.02 39.23 112.16 Depreciation expense 270.49 286.13 140.56 149.42 98.11 96.73 10.31 12.50 519.47 544.78 Amortisation expense - 0.01 - 2.93 - 11.64 - 0.01 - 14.59
Total 272.76 316.65 147.45 163.49 137.61 219.90 10.31 12.76 568.13 712.80 Total expenditure for discontinued operations
10.31 12.76 10.31 12.76
* Note: Excluding unallocated capital expediture on tangible assets, intangible assets, depreciation expense and amortisation expense.
47. Research and development expenditure Research and development expenditure incurred by the Group during the financial year are mentioned below:
For the year ended March 31, 2019 For the year ended March 31, 2018Revenue expenditure
Material consumed 14.52 5.25 Employee benefits expense 149.76 205.20 Other expenses 400.51 187.78 Depreciation and amortisation expense 98.10 108.37
Capital expenditure 39.50 111.53 Total 702.39 618.13

Annual Report 2018-19160
Notes to the Consolidated Financial Statements for the year ended March 31, 2019
48. Employee benefits obligations(A) Defined benefit plan
Risks associated with plan provisions Valuations are based on certain assumptions, which are dynamic in nature and vary over time. As such Group is exposed to various risks as follows:
Salary Risk Actual salary increases will increase the plan’s liability. Increase in salary increase rate assumption in future valuations will also increase the liability.
Discount Rate Risk Reduction in discount rate in subsequent valuations can increase the plan’s liability.Mortality and disability Risk Death and disability cases proving lower or higher than assumed in the valuation can impact the liabilities.Withdrawals Risk Actual withdrawals proving higher or lower than assumed withdrawals and change of withdrawal rates at
subsequent valuations can impact plan’s liability.Gratuity (funded)The Group provides for gratuity for employees in India as per the Payment of Gratuity Act, 1972. Employees who are in continuous service for a period of 5 years are eligible for gratuity. The amount of gratuity payable on retirement/termination is the employees last drawn basic salary per month computed proportionately for 15 days salary multiplied for the number of years of service. For the funded plan the group makes contributions to recognised funds in India. The group does not fully fund the liability and maintains a target level of funding to be maintained over a period of time based on estimations of expected gratuity payments. The amounts recognised in the balance sheet and the movements in the net defined benefit obligation over the year are as follows:
(Rs. in million) As at March 31,
2019 As at March 31,
2018 a Reconciliation of present value of defined benefit obligation and the fair value of plan assets
Present value of defined benefit obligation as at the end of the year 241.90 223.62 Fair value of plan assets as at the end of the year 41.36 69.31 Net liability position recognised in balance sheet 200.54 154.31
b Changes in defined benefit obligationPresent value of defined benefit obligation as at the start of the year 223.62 157.01 Acquisition adjustment 6.84 - Interest cost 16.48 11.78 Current service cost 21.38 18.12 Past service cost - 31.38 Benefits paid for eligible employees (35.51) (15.78)Actuarial loss 9.09 21.11 Present value of defined benefit obligation as at the end of the year 241.90 223.62
c Net interest costInterest cost on defined benefit obligation 16.48 11.78 Interest income on plan assets 5.02 5.69 Net interest cost 11.46 6.09
d Amount recognised in the statement of profit and loss Current service cost 21.38 18.12 Past service cost - 31.38 Net interest cost 11.46 6.09 Amount recognised in the statement of profit and loss 32.84 55.59
e Change in plan assetsFair value of the plan assets at the beginning of the year 65.31 75.88 Actual return on plan assets 4.19 5.21 Employer contribution 3.81 - Fund management charges (1.14) - Benefits paid for eligible employees (35.51) (15.78)Fair value of the plan assets at the end of the year 36.66 65.31
f Key categories of plan assets as a percentage of the fair value of total plan assets for gratuityInvestment with insurer 100% 100%
g Other comprehensive incomeActuarial loss on arising from change in demographic assumption (6.55) 1.96 Actuarial (gain)/loss on arising from change in financial assumption 46.06 (1.69)Actuarial loss on arising from experience adjustment (30.34) 21.08 Actuarial loss on arising on plan assets 0.84 0.48 Total actuarial loss for the year 10.01 21.83
h Actuarial assumptions Discount rate 7.66% 7.60%Future salary increase 8.00% 5.00%

Panacea Biotec Ltd. 161
Notes to the Consolidated Financial Statements for the year ended March 31, 2019
i Demographic AssumptionRetirement age (years) 60/75 58/75 Mortality rates inclusive of provision for disability 100% 100%Ages Withdrawal Rate(%)Up to 30 years 10.00% 10.00%From 31 to 44 years 5.00% 5.00%Above 44 years 1.00% 1.00%
j Sensitivity analysis for gratuity liabilityImpact of the change in discount ratea) Impact due to increase of 0.50% (19.28) (8.26)b) Impact due to decrease of 0.50% 4.43 8.94 Impact of the change in salary increasea) Impact due to increase of 0.50% 2.67 8.25 b) Impact due to decrease of 0.50% (17.84) (7.74)
k Maturity profile of defined benefit obligationApril 2018 to March 2019 - 48.62 April 2019 to March 2020 31.12 11.20 April 2020 to March 2021 6.28 5.68 April 2021 to March 2022 6.02 8.16 April 2022 to March 2023 12.85 7.13 April 2023 to March 2024 15.37 6.39 April 2024 to March 2025 5.38 - April 2025 onwards 154.74 118.72
(B) Defined contribution plansThe Group’s contribution to state governed provident fund scheme, employee state insurance scheme and Labour Welfare Fund scheme are considered as defined contribution plans. The contribution under the schemes is recognised as an expense, when an employee renders the related service. There are no other obligations other than the contribution payable to the respective funds.
49. Group informationInformation about subsidiary/entity consolidatedThe Consolidated Financial statements of the Group include entities listed in the table below:S. No. Name of entity Country of Incorporation Proportion (%) of equity interest
Year Ended March 31, 2019 Year Ended March 31, 2018 A. Subsidiaries of Panacea Biotec Limited #1 Radhika Heights Limited India 100.00% 100.00%2 Rees Investment Limited$ Guernsey 100.00% 100.00%3 Panacea Biotec (International) SA Switzerland 100.00% 100.00%4 Panacea Biotec Pharma Limited## India 100.00% -5 PanEra Biotec Private Limited* India 50.00% 50.00%6 Adveta Power Private Limited* India 75.00% 75.00%
Joint Venture1 Chiron Panacea Vaccine Private Limited
(Under Liquidation) India 50.00% 50.00%
# excluding names for step down subsidiaries, since consolidated financial information of these entities is used for preparing these Consolidated Financial Statements.## incorporated on March 22, 2019 * Considered as subsidiary for the purpose of consolidation as per Ind AS 110. $ liquidated on May 23, 2019
50. Additional information, as required under Schedule III of the Companies Act, 2013, of the enterprises consolidated as subsidiaries / entities consolidated: (Rs. in million)S. No.
Name of entity Net assets (total assets minus total liabilities
Share in profit or (loss) Share in other comprehensive income
Share in total comprehensive income
Parent As % of consolidated
net assets
Amount As % of consolidated profit or loss
Amount As % of consolidated
other comprehensive
income
Amount As % of consolidated
total comprehensive
income
Amount
Panacea Biotec Limited# 32.76% 1,137.87 165.67% 624.04 141.21% (6.51) 165.98% 617.53 Subsidiary
1 Radhika Heights Limited 67.91% 2,359.20 -8.46% (31.88) 0.00% - -8.57% (31.88)2 Rees Investment Limited$ -0.06% (1.97) -0.01% (0.05) 0.00% - -0.01% (0.05)3 Panacea Biotec (International) SA 1.76% 61.03 0.61% 2.29 -41.21% 1.90 1.13% 4.19 4 Panacea Biotec Pharma Limited## 0.03% 1.00 0.00% - 0.00% - 0.00% - 5 PanEra Biotec Private Limited* -3.18% (110.59) -57.70% (217.35) 0.00% - -58.42% (217.35)6 Adveta Power Private Limited* 0.79% 27.34 -0.10% (0.38) 0.00% - -0.10% (0.38)
Joint Venture1 Chiron Panacea Vaccine Private
Limited (Under Liquidation) - - 0.00% - 0.00% - 0.00% -
Total 100.00% 3,473.88 100.00% 376.67 100.00% (4.61) 100.00% 372.06 # excluding names for step down subsidiaries, since consolidated financial information of these entities is used for preparing these Consolidated Financial Statements.## incorporated on March 22, 2019 * Considered as subsidiary for the purpose of consolidation as per Ind AS 110. $ liquidated on May 23, 2019
(Rs. in million) As at March 31,
2019 As at March 31,
2018

Annual Report 2018-19162
Notes to the Consolidated Financial Statements for the year ended March 31, 2019
51. On account of continuous losses of the Group, certain delays and defaults, in repayment of loan installments (including accrued interest thereon) on borrowings, have occurred during the year, which are described below.
(Rs. in million)Particulars Amount of
installment*Due Date Paid On
A. Borrowings from banks (refer note (i) below)Bank of India - Foreign Currency Term Loan ('FCTL') 576.25 30-Sep-17 9-Apr-19Bank of India - FCTL 576.25 30-Sep-18 9-Apr-19Indian Overseas Bank- Term Loan 15.00 30-Jun-18 7-Jul-18Indian Overseas Bank- Term Loan 15.00 30-Sep-18 9-Apr-19Indian Overseas Bank- Term Loan 15.00 31-Dec-18 9-Apr-19Indian Overseas Bank- Term Loan 15.00 31-Mar-19 9-Apr-19State Bank of India- Term Loan - I 5.98 30-Jun-18 18-Jul-18State Bank of India- Term Loan - I 12.19 30-Sep-18 9-Apr-19State Bank of India- Term Loan - I 12.19 31-Dec-18 9-Apr-19State Bank of India- Term Loan - I 12.19 31-Mar-19 9-Apr-19State Bank of India- Term Loan - II 11.64 30-Jun-18 18-Jul-18State Bank of India- Term Loan - II 24.00 30-Sep-18 9-Apr-19State Bank of India- Term Loan - II 24.00 31-Dec-18 9-Apr-19State Bank of India- Term Loan - II 24.00 31-Mar-19 9-Apr-19Canara Bank- Working Capital Term Loan ('WCTL') 0.55 30-Sep-18 9-Apr-19Canara Bank- WCTL 0.55 31-Dec-18 9-Apr-19Canara Bank- WCTL 0.55 31-Mar-19 9-Apr-19IDBI Bank - WCTL 0.26 30-Jun-18 6-Jul-18IDBI Bank - WCTL 0.26 30-Sep-18 28-Dec-18IDBI Bank - WCTL 0.26 31-Dec-18 2-Jan-19State Bank of India- WCTL 8.58 30-Sep-18 9-Apr-19State Bank of India- WCTL 8.58 31-Dec-18 9-Apr-19State Bank of India- WCTL 8.58 31-Mar-19 9-Apr-19Bank of India- WCTL 0.61 31-Mar-18 5-Apr-18Bank of India- WCTL 0.91 30-Sep-18 9-Apr-19Bank of India- WCTL 0.91 31-Dec-18 9-Apr-19Bank of India- WCTL 0.91 31-Mar-19 9-Apr-19Union Bank of India- WCTL 0.67 30-Sep-18 9-Apr-19Union Bank of India- WCTL 0.67 31-Dec-18 9-Apr-19Union Bank of India- WCTL 0.67 31-Mar-19 9-Apr-19Indian Overseas Bank- WCTL 0.70 30-Sep-18 9-Apr-19Indian Overseas Bank- WCTL 0.70 31-Dec-18 9-Apr-19Indian Overseas Bank- WCTL 0.70 31-Mar-19 9-Apr-19Canara Bank- Funded Interest Term Loan ('FITL') 0.33 30-Sep-18 9-Apr-19Canara Bank- FITL 0.33 31-Dec-18 9-Apr-19Canara Bank- FITL 0.33 31-Mar-19 9-Apr-19IDBI Bank - FITL 0.18 30-Jun-18 6-Jul-18IDBI Bank - FITL 0.18 30-Sep-18 28-Dec-18IDBI Bank - FITL 0.18 31-Dec-18 2-Jan-19IDBI Bank - FITL 0.18 31-Mar-19 9-Apr-19State Bank of India- FITL 6.11 30-Jun-18 18-Jul-18State Bank of India- FITL 11.31 30-Sep-18 9-Apr-19State Bank of India- FITL 11.31 31-Dec-18 9-Apr-19State Bank of India- FITL 11.31 31-Mar-19 9-Apr-19Bank of India- FITL 1.92 31-Mar-18 5-Apr-18Bank of India- FITL 2.88 30-Sep-18 9-Apr-19Bank of India- FITL 2.88 31-Dec-18 9-Apr-19Bank of India- FITL 2.88 31-Mar-19 9-Apr-19Union Bank of India- FITL 0.46 30-Sep-18 9-Apr-19Union Bank of India- FITL 0.46 31-Dec-18 9-Apr-19Union Bank of India- FITL 0.46 31-Mar-19 9-Apr-19Indian Overseas bank- FITL 3.72 30-Jun-18 3-Jul-18Indian Overseas bank- FITL 3.72 30-Sep-18 9-Apr-19Indian Overseas bank- FITL 3.72 31-Dec-18 9-Apr-19Indian Overseas bank- FITL 3.72 31-Mar-19 9-Apr-19

Panacea Biotec Ltd. 163
Notes to the Consolidated Financial Statements for the year ended March 31, 2019
B. Other borrowingsEARC - Term Loan I (refer note (i) below) 20.39 31-Dec-18 9-Apr-19EARC - Term Loan I (refer note (i) below) 16.84 25-Mar-19 9-Apr-19EARC - Term Loan II (refer note (i) below) 2.00 30-Sep-18 9-Apr-19EARC - Term Loan II (refer note (i) below) 2.00 31-Dec-18 9-Apr-19EARC - Term Loan II (refer note (i) below) 2.00 31-Mar-19 9-Apr-19Biotechnology Industrial Research Assistance Council (BIRAC) - Loan 1
7.00 30-Sep-18 25-Apr-19
BIRAC - Loan 1 7.00 31-Mar-19 25-Apr-19BIRAC - Loan 2 1.50 29-Nov-18 25-Apr-19Loan from Department of Science & Technology 2.00 21-Sep-18 14-May-19Loan from Directors - Mrs. Sunanda Jain (refer note 44 (C)) 21.57 June 2014 to March 2019 converted into long term
loan on 6-Apr-19Loan from Trinidhi Finance Private Limited 3.38 December 2013-March 2019 payment term revised
to 30-Sep-19Note:i) Refer note 60.ii) The interest payment on above loans from banks and EARC were also delayed and paid as part of the settlement on April 9, 2019.
52. Fair value measurementsA. Financial assets and liabilities The carrying amounts and fair values of financial instruments by class are as follows:
(Rs. in million)As at March 31, 2019 Fair value through
profit & loss Fair value through other comprehensive income
Amortised cost
Financial Assetsi) Investments 0.70 - - ii) Trade receivables - - 887.30 (iii) Cash and cash equivalents - - 144.66 (iv) Other bank balances - - 90.14 (v) Loans - - 192.97 (vi) Others financial assets - - 46.89 Total 0.70 - 1,361.96 Financial Liabilities(i) Borrowings - - 6,485.12 (ii) Trade payables - - 2,697.10 (iii) Other financial liabilities - - 65.84 Total - - 9,248.06
(Rs. in million)Particulars Amount of
installment*Due Date Paid On
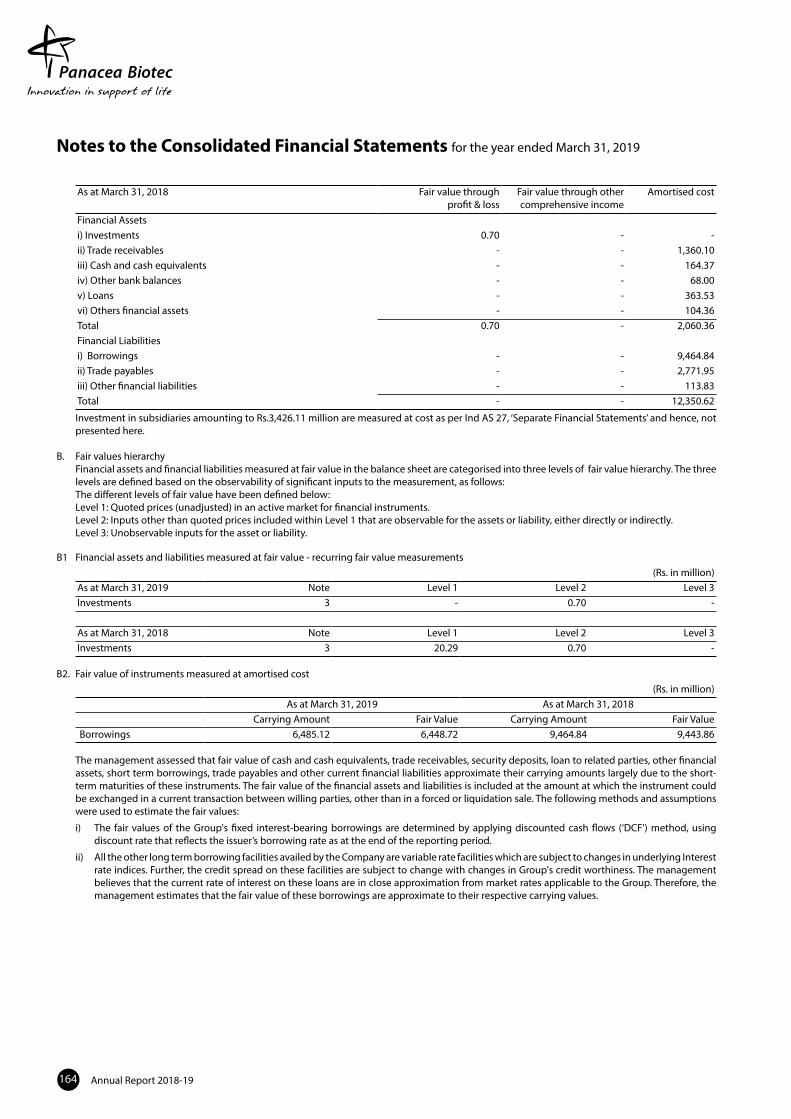
Annual Report 2018-19164
Notes to the Consolidated Financial Statements for the year ended March 31, 2019
As at March 31, 2018 Fair value through profit & loss
Fair value through other comprehensive income
Amortised cost
Financial Assetsi) Investments 0.70 - - ii) Trade receivables - - 1,360.10 iii) Cash and cash equivalents - - 164.37 iv) Other bank balances - - 68.00 v) Loans - - 363.53 vi) Others financial assets - - 104.36 Total 0.70 - 2,060.36 Financial Liabilitiesi) Borrowings - - 9,464.84ii) Trade payables - - 2,771.95iii) Other financial liabilities - - 113.83 Total - - 12,350.62
Investment in subsidiaries amounting to Rs.3,426.11 million are measured at cost as per Ind AS 27, ‘Separate Financial Statements’ and hence, not presented here.
B. Fair values hierarchyFinancial assets and financial liabilities measured at fair value in the balance sheet are categorised into three levels of fair value hierarchy. The three levels are defined based on the observability of significant inputs to the measurement, as follows:The different levels of fair value have been defined below:Level 1: Quoted prices (unadjusted) in an active market for financial instruments.Level 2: Inputs other than quoted prices included within Level 1 that are observable for the assets or liability, either directly or indirectly.Level 3: Unobservable inputs for the asset or liability.
B1 Financial assets and liabilities measured at fair value - recurring fair value measurements(Rs. in million)
As at March 31, 2019 Note Level 1 Level 2 Level 3 Investments 3 - 0.70 -
As at March 31, 2018 Note Level 1 Level 2 Level 3 Investments 3 20.29 0.70 -
B2. Fair value of instruments measured at amortised cost(Rs. in million)
As at March 31, 2019 As at March 31, 2018Carrying Amount Fair Value Carrying Amount Fair Value
Borrowings 6,485.12 6,448.72 9,464.84 9,443.86
The management assessed that fair value of cash and cash equivalents, trade receivables, security deposits, loan to related parties, other financial assets, short term borrowings, trade payables and other current financial liabilities approximate their carrying amounts largely due to the short-term maturities of these instruments. The fair value of the financial assets and liabilities is included at the amount at which the instrument could be exchanged in a current transaction between willing parties, other than in a forced or liquidation sale. The following methods and assumptions were used to estimate the fair values:
i) The fair values of the Group's fixed interest-bearing borrowings are determined by applying discounted cash flows (‘DCF’) method, using discount rate that reflects the issuer’s borrowing rate as at the end of the reporting period.
ii) All the other long term borrowing facilities availed by the Company are variable rate facilities which are subject to changes in underlying Interest rate indices. Further, the credit spread on these facilities are subject to change with changes in Group's credit worthiness. The management believes that the current rate of interest on these loans are in close approximation from market rates applicable to the Group. Therefore, the management estimates that the fair value of these borrowings are approximate to their respective carrying values.

Panacea Biotec Ltd. 165
53. Financial risk management
Risk management framework
The Group's activities expose it to market risk, liquidity risk and credit risk. The management has the overall responsibility for the establishment and oversight of the Group's risk management framework. This note explains the sources of risk which the entity is exposed to and how the entity manages the risk and the related impact in the financial statements.
A. Credit risk
Credit risk is the risk that a counter party fails to discharge its obligation to the Group. The Group's exposure to credit risk is influenced mainly by cash and cash equivalents, trade receivables and financial assets measured at amortised cost. The Group continuously monitors defaults of customers and other counter parties and incorporates this information into its credit risk controls.
A.1 Credit risk management
The Group assesses and manages credit risk based on internal credit rating system. Internal credit rating is performed for each class of financial instruments with different characteristics. The Group assigns the following credit ratings to each class of financial assets based on the assumptions, inputs and factors specific to the class of financial assets:
A: Low credit risk on financial reporting date
B: Moderate credit risk
C: High credit risk
The Group provides for expected credit loss based on the following:
Asset group Basis of categorisation Provision for expected credit lossLow credit risk Cash and cash equivalents, other bank balances, loans,
trade receivables and other financial assets12 month expected credit loss
Moderate credit risk Trade receivables Life time expected credit loss or 12 month expected credit loss*High credit risk Trade receivables and loans Life time expected credit loss or fully provided for
*In respect of trade receivables, the Group recognises a provision for lifetime expected credit losses
Based on business environment in which the Group operates, a default on a financial asset is considered when the counter party fails to make payments within the agreed time period as per contract. Loss rates reflecting defaults are based on actual credit loss experience and considering differences between current and historical economic conditions.
Assets are written off when there is no reasonable expectation of recovery, such as a debtor declaring bankruptcy or a litigation decided against the Group. The Group continues to engage with parties whose balances are written off and attempts to enforce repayment. Recoveries made are recognised in statement of profit and loss.
(Rs. in million)Credit rating Particulars As at March 31, 2019 As at March 31, 2018A: Low credit risk Cash and cash equivalents 144.66 164.37
Other bank balances 90.14 68.00 Loans 192.97 363.53 Other financial assets 46.89 104.36
B: Medium credit risk Trade receivables 943.71 1,400.13 C: High credit risk Trade receivables 75.95 25.60
Cash and cash equivalents and bank deposits
Credit risk related to cash and cash equivalents and bank deposits is managed by only accepting highly rated banks and diversifying bank deposits and accounts in different banks across the country.
Trade receivables
Credit risk related to trade receivables are mitigated by taking bank guarantees/letter of credit, from customers where credit risk is high. The Group closely monitors the credit-worthiness of the debtors through internal systems that are configured to define credit limits of customers, thereby limiting the credit risk to pre-calculated amounts. The Group assesses increase in credit risk on an ongoing basis for amounts receivable that become past due and default is considered to have occurred when amounts receivable become two year past due.
Other financial assets measured at amortised cost
Other financial assets measured at amortized cost includes loans and advances to related parties and employees, security deposits and others (see note 44). Credit risk related to these other financial assets is managed by monitoring the recoverability of such amounts continuously.
A.2 Expected credit losses for financial assets other than trade receivables
The Group provides for expected credit losses on loans and advances other than trade receivables by assessing individual financial instruments for expectation of any credit losses. Since the Group deals with only high-rated banks and financial institutions, credit risk in respect of cash and cash equivalents, other bank balances and bank deposits is evaluated as very low. In respect of loans, comprising of security deposits, credit risk is considered low because the Group is in possession of the underlying asset. However, in respect of loans comprising loans to related parties, credit risk is evaluated on the basis of credit worthiness of those parties and loss allowance is measured as lifetime expected credit losses. In respect of other financial assets, credit risk is evaluated based on Group's knowledge of the credit worthiness of those parties and loss allowance is measured as lifetime expected credit losses. The Group does not have any expected loss based impairment recognised (except in case of loans to related parties) on such assets considering their low credit risk nature, though incurred loss provisions are disclosed under each sub-category of such financial assets.
Notes to the Consolidated Financial Statements for the year ended March 31, 2019

Annual Report 2018-19166
Notes to the Consolidated Financial Statements for the year ended March 31, 2019
(Rs. in million)As at March 31, 2019Particulars Estimated gross carrying
amount at defaultExpected probability of
defaultExpected credit losses Carrying amount net of
impairment provision Cash and cash equivalents 144.66 0.00% - 144.66 Other bank balances 90.14 0.00% - 90.14 Loans 192.97 0.00% - 192.97 Other financial assets 46.89 0.00% - 46.89
As at March 31, 2018Particulars Estimated gross carrying
amount at defaultExpected probability of
defaultExpected credit losses Carrying amount net of
impairment provision Cash and cash equivalents 164.37 0.00% - 164.37 Other bank balances 68.00 0.00% - 68.00 Loans 363.53 0.00% - 363.53 Other financial asset 104.36 0.00% - 104.36
A.3 Expected credit loss for trade receivables under simplified approach
The Group recognizes lifetime expected credit losses on trade receivables using a simplified approach, wherein the Company has defined percentage of provision by analysing historical trend of default relevant to each category of customer based on the criteria defined above and such provision percentage determined have been considered to recognise life time expected credit losses on trade receivables (other than those where default criteria are met).
(Rs. in million)As at March 31, 2019Particulars Not Due 0-30 days
post due31-90 days
post due 91-182 days
post due 183-365 days
post due366-730 days
post due More than 730
days post due Total
Gross carrying amount* 412.68 188.45 61.24 28.81 24.46 4.29 42.65 762.58 Expected loss rate 1.35% 2.00% 2.25% 4.40% 5.50% 10.00% 100.00% 7.40%Expected credit loss** (Loss allowance provision)
5.57 3.77 1.38 1.27 1.35 0.43 42.65 56.41
Carrying amount of trade receivables (net of impairment)
407.11 184.68 59.86 27.54 23.11 3.86 - 706.17
* including Gross carrying amount of Rs.512.39 million pertaining to discontinued operations**ECL provision of Rs.52.15 million pertaining to discontinued operations
As at March 31, 2018Particulars Not Due 0-30 days
post due31-90 days
post due 91-182 days
post due 183-365 days
post due366-730 days
post due More than 730
days post due Total
Gross carrying amount 285.97 350.45 140.23 35.02 8.36 23.44 15.72 859.19 Expected loss rate 1.35% 2.15% 3.49% 2.40% 25.24% 21.72% 100.00% 4.66%Expected credit loss (Loss allowance provision)
3.86 7.52 4.89 0.84 2.11 5.09 15.72 40.03
Carrying amount of trade receivables (net of impairment)
282.11 342.93 135.34 34.18 6.25 18.35 - 819.16
Changes in allowance for trade receivables (Rs. in million)Particulars AmountAs at March 31, 2018 65.63 Loss recognised/(reversed) during the year 66.73 As at March 31, 2019 132.36

Panacea Biotec Ltd. 167
B. Liquidity risk
Liquidity risk is the risk that the Group will encounter difficulty in meeting the obligations associated with its financial liabilities that are settled by delivering cash or another financial asset. The Group's approach to managing liquidity is to ensure as far as possible, that it will have sufficient liquidity to meet its liabilities when they are due. The Group manages its liquidity needs by carefully monitoring scheduled debt servicing payments for long-term financial liabilities as well as cash-outflows due in day-to-day business. Long-term liquidity needs for a 180-day and a 360-day lookout period are identified monthly.
Management monitors rolling forecasts of the liquidity position and cash and cash equivalents on the basis of expected cash flows. The Group takes into account the liquidity of the market in which the entity operates.
B1. Contractual Maturities of financial liabilities
The tables below analyse the Group’s financial liabilities based on their contractual maturities. The amounts disclosed in the table are the contractual undiscounted cash flows.
(Rs. in million)Particulars Less than 1 year 1 - 2 years 2 - 3 years More than 3 years TotalMarch 31, 2019(i) Borrowings 6,023.90 19.00 12.00 430.46 6,485.36 (ii) Trade payables 2,697.10 - - - 2,697.10 (iii) Other financial liabilities 65.84 - - - 65.84 Total 8,786.84 19.00 12.00 430.46 9,248.30 March 31, 2018(i) Borrowings 6,477.10 1,444.12 1,600.88 5,230.67 14,752.77 (ii) Trade payables 2,771.95 - - - 2,771.95 (iii) Other financial liabilities 113.83 - - - 113.83 Total 9,362.88 1,444.12 1,600.88 5,230.67 17,638.55
C. Market Risk
i) Interest Rate risk
The Group’s policy is to minimise interest rate cash flow risk exposures on long-term financing. At the year end, the Group is exposed to changes in market interest rates through bank borrowings at variable interest rates. Other borrowings are at fixed interest rates.
The Group's exposure to interest rate risk on borrowings is as follows:
(Rs. in million)Particulars As at March 31, 2019 As at March 31, 2018Variable rate 6,194.97 8,999.97 Fixed rate 269.98 464.87 Total 6,464.95 9,464.84
The following table illustrates the sensitivity of profit after tax and equity to a possible change in interest rates of +/- 1% in current year (March 31, 2018: +/- 1%). These changes are considered to be reasonably possible based on observation of current market conditions. The calculations are based on a change in the average market interest rate for each period, and the financial instruments held at each reporting date that are sensitive to changes in interest rates. All other variables are held constant.
Interest sensitivity*For the year ended March 31, 2019 For the year ended March 31, 2018
Interest rates - increase by 100 basis points (March 31, 2018: 100 basis points)
(40.30) (58.85)
Interest rates - decrease by 100 basis points (March 31, 2018: 100 basis points)
40.30 58.85
'* Holding all other variables constant
Notes to the Consolidated Financial Statements for the year ended March 31, 2019

Annual Report 2018-19168
Notes to the Consolidated Financial Statements for the year ended March 31, 2019
ii) Foreign Currency RiskThe Group is exposed to foreign exchange risk arising from foreign currency transactions, primarily with respect to the USD, EURO, CHF, JPY, CAD, GBP and TBH. Foreign exchange risk arises from recognised assets and liabilities denominated in a currency that is not the functional currency of the Group. The Group does not use any derivative instruments to manage its exposure. Also, the Group does not use forward contracts and swaps for speculative purposes.a) Foreign currency denominated financial assets and liabilities, translated at the closing rate, are as follows:
(Rs. in million)Particulars As at March 31, 2019 As at March 31, 2018
Foreign Currency
Amount in Foreign Currency
Closing Rate
Amount Amount in Foreign Currency
Closing Rate
Amount
Financial assetsBalance with banks USD 639 69.15 0.04 5,589 65.17 0.36
Euro 931,273 77.66 72.32 1,054,561 80.82 85.23 CHF 22,426 69.41 1.56 76,460 68.50 5.24 KZT 52,110 0.21 0.01 52,110 0.21 0.01 RUB 16,460 1.05 0.02 16,556 1.13 0.02
Foreign trade receivable Euro 2,374,840 77.66 184.42 2,709,121 80.82 218.94 CHF 1,472 69.41 0.10 74,634 68.50 5.11 USD 3,342,438 69.15 231.13 3,899,105 65.17 254.10
Financial liabilitiesForeign trade payable USD 2,546,269 69.16 176.10 2,579,377 65.18 168.12
Euro 2,803,452 77.70 217.83 3,865,266 80.85 312.50 GBP 38,694 90.57 3.50 12,173 92.31 1.12 CHF 92,455 69.41 6.42 118,407 68.50 8.11 JPY 2,722,810 0.62 1.70 2,722,810 0.62 1.68 SEK 16,820 7.44 0.13 16,820 7.80 0.13 CAD 43,428 51.54 2.24 14,328 50.68 0.73 THB 5,547 2.18 0.01 5,547 2.09 0.01
Foreign currency loans USD 15,681,865 72.49 1,136.70 25,000,000 65.18 1,629.50 Interest accrued but not due USD - 72.49 - 9,612 65.18 0.63 Net exposure
USD (14,885,057) - (1,081.63) (23,684,295) - (1,543.78)Euro 502,662 - 38.91 (101,584) - (8.33)GBP (38,694) - (3.50) (12,173) - (1.12)CHF (68,556) - (4.76) 32,688 - 2.24 RUB 16,460 - 0.02 16,556 - 0.02 THB (5,547) - (0.01) (5,547) - (0.01)SEK (16,820) - (0.13) (16,820) - (0.13)CAD (43,428) - (2.24) (14,328) - (0.73)KZT 52,110 - 0.01 52,110 - 0.01 JPY (2,722,810) - (1.70) (2,722,810) - (1.68)
* Closing exchange rate has been rounded off to two decimal places.
b) Sensitivity analysis of change in rates of material foreign currencies on profit/(loss) after tax(Rs. in million)
As at March 31, 2019 As at March 31, 2018 As at March 31, 2019 As at March 31, 2018Currency Profit for the year +200bps Profit for the year -200bps
USD (14.07) (20.09) 14.07 20.09
Currency Profit for the year +500 bps Profit for the year -500 bpsEURO 1.27 (0.27) (1.27) 0.27 GBP (0.11) (0.04) 0.11 0.04
Currency Profit for the year +200bps Profit for the year -200bpsJPY (0.02) (0.02) 0.02 0.02 CHF (0.03) (0.01) 0.03 0.01

Panacea Biotec Ltd. 169
Notes to the Consolidated Financial Statements for the year ended March 31, 2019
54. Capital Management PoliciesThe Group’s capital management objectives are to ensure the Group’s ability to continue as a going concern as well as to provide an adequate return to shareholders by pricing products and services commensurately with the level of risk.The Group monitors capital on the basis of the carrying amount of equity plus its subordinated loan, less cash and cash equivalents as presented on the face of the statement of financial position recognised in other comprehensive income.The Group manages its capital structure and makes adjustments to it in the light of changes in economic conditions and the risk characteristics of the underlying assets. In order to maintain or adjust the capital structure, the Group may adjust the amount of dividends paid to shareholders, return capital to shareholders or issue new shares. The amounts managed as capital by the Group are summarised as follows:
(Rs. in million)Particulars As at March 31, 2019 As at March 31, 2018Non-current borrowings 5,791.27 7,815.99 Current borrowings 693.85 1,648.85 Less: Cash and cash equivalents (144.66) (164.37)Net debt 6,340.46 9,300.47 Total equity 3,473.88 3,057.26 Net debt to equity ratio 182.52% 304.21%
55. Reconciliation of liabilities arising out of financing activities
A. Reconciliation of liabilities arising from financing activities
The changes in the Company’s liabilities arising from financing activities are classified as follows:
(Rs. in million)Particulars Long term borrowings Short term borrowings TotalAs at April 01, 2018 7,758.66 1,648.85 9,407.51 Cash changes: - Proceeds - 8.00 8.00 - Repayment (155.39) (200.13) (355.52)Other non-cash changes - adjustment on restructuring of debt (2,226.70) (550.64) (2,777.34) - Foreign currency monetary item translation difference account 116.87 - 116.87 - Conversion of short term loan into long term loan 266.80 (266.80) - - Conversion of interst accued into short term loan - 54.57 54.57 - Notional interest expense recorded on less than market rate loans 10.84 - 10.84 Net debt as at March 31, 2019 5,771.10 693.85 6,464.95
Particulars Long term borrowings Short term borrowings TotalAs at April 01, 2017 8,028.72 1,907.19 9,935.91 Cash changes: - Proceeds 57.97 39.96 97.93 - Repayment (348.15) (298.30) (646.45)Other non-cash changes - Foreign currency monetary item translation difference account 8.00 - 8.00 - Impact of effective interest rate adjustment 2.39 - 2.39 - Notional interest expense recorded on less than market rate loans 9.73 - 9.73 Net debt as at March 31, 2018 7,758.66 1,648.85 9,407.51

Annual Report 2018-19170
Notes to the Consolidated Financial Statements for the year ended March 31, 2019
56. Interests in other entities
a. Subsidiaries
The Group’s subsidiaries at year end are set out below. Unless otherwise stated, they have share capital consisting solely of equity shares that are held directly by the group, and the proportion of ownership interests held equals the voting rights held by the group. The country of incorporation or registration is also their principal place of business.
Name of entity# Place of business/ country of incorporation
Ownership interest held by the group
Ownership interest held by non-controlling interest
Principal activities
As at March 31, 2019
As at March 31, 2018
As at March 31, 2019
As at March 31, 2018
% % % % Radhika Heights Limited India 100 100 - - Real estate Rees Investments Limited$ Guernsey 100 100 - - Investment Panacea Biotec (Intl.) SA, Switzerland Switzerland 100 100 - - Pharmaceuticals Panacea Biotec Pharma Limited## India 100 - - - Pharmaceuticals PanEra Biotec Private Limited* India 50 50 50 50 Vaccines Adveta Power Private Limited* India 75 75 25 25 Power generation # excluding names for step down subsidiaries, since consolidated financial information of these entities is used for preparing these Consolidated Financial Statements.## incorporated on March 22, 2019 * Considered as subsidiary for the purpose of consolidation as per Ind AS 110. $ liquidated on May 23, 2019
b. Non-controlling interests (NCI)
Set out below is summarised financial information for each subsidiary that has non-controlling interests that are material to the Group. The amounts disclosed for each subsidiary are before inter-company eliminations. (Rs. in million)
Summarised balance sheet PanEra Biotec Private Limited Adveta Power Private LimitedAs at
March 31, 2019As at
March 31, 2018As at
March 31, 2019As at
March 31, 2018 Current assets 37.66 254.85 0.18 0.18 Current liabilities 108.88 311.17 28.49 26.52 Net current assets (71.22) (56.32) (28.31) (26.34) Non-current assets 11.01 11.24 29.15 27.60 Non-current liabilities - 14.15 - - Net non-current assets 11.01 (2.91) 29.15 27.60 Net assets (60.21) (59.23) 0.84 1.26 Accumulated NCI (30.11) (29.62) 0.21 0.32
Summarised statement of profit and loss PanEra Biotec Private Limited Adveta Power Private LimitedAs at
March 31, 2019As at
March 31, 2018As at
March 31, 2019As at
March 31, 2018 Revenue 221.42 211.18 - - Profit of the year (0.97) (40.35) (0.44) (0.07) Other comprehensive income - 0.04 - - Total comprehensive income (0.97) (40.31) (0.44) (0.07) Profit allocated to NCI (0.49) (20.16) (0.11) (0.02) Dividend paid to NCI - - - -
Summarised cash flows PanEra Biotec Private Limited Adveta Power Private LimitedAs at
March 31, 2019As at
March 31, 2018As at
March 31, 2019As at
March 31, 2018 Cash flows from operating activities (18.18) (602.50) 1.52 (0.04) Cash flows from investing activities 11.95 608.24 (1.55) (0.25) Cash flows from financing activities - - - - Net increase/ (decrease) in cash and cash equivalents
(6.23) 5.74 (0.03) (0.29)
c. There are no transactions with non-controlling interests.
d. Interests in joint venture
Set out below are the joint ventures of the Group as at year end which, in the opinion of the directors, are material to the Group. The entities listed below have share capital consisting solely of equity shares, which are held directly by the Group. The country of incorporation or registration is also their principal place of business and the proportion of ownership interest is the same as the proportion of voting rights held.
Name of entity Place of business
% of ownership interest
Relationship Accounting method
Carrying amount
As at March 31, 2019
As at March 31, 2018
Chiron Panacea Vaccines Private Limited (Under Liquidation)*
India 50 Joint Venture Equity method 52.59 51.77
Total equity accounted investments 52.59 51.77
*Unlisted entity – no quoted price available.(i) Contingent liabilities and commitments The Group has Nil contingent liabilities and commitments in respect of joint venture.

Panacea Biotec Ltd. 171
Notes to the Consolidated Financial Statements for the year ended March 31, 2019
57. Subsequent to the year ended March 31, 2019, the Holding Company has:
a. signed investment agreements with India Resurgence Fund (‘IndiaRF’), promoted by Piramal Enterprises Limited and Bain Capital Credit, along with its affiliates (Investors) for obtaining long term funds of upto Rs.9,920.0 million, consequent to approval from shareholders in general meeting held on March 25, 2019. This investment is structured by way of subscription to Non-Convertible Debentures (‘NCDs’) of up to Rs.8,640.0 million and subscription amount of Rs.320.0 million towards share warrants to be allotted on a preferential basis. The subscription amount represents 25% of total amount of Rs.1,280.0 million proposed to be raised upon issuance of equity shares against warrants as per SEBI (Issue of Capital and Disclosure Requirements) Regulations, 2018 (‘ICDR Regulations’). Upon exercise of conversion rights in the warrants, IndiaRF (along with its affiliates) will collectively own 10.4% stake in the equity share capital of the Holding Company on a fully diluted basis;
b. issued and allotted 74,300 unrated, unlisted, redeemable NCDs, having the face value of INR 1 lakh each, aggregating to Rs.7,430.0 million under Series 1A, Series 1B and Series 2 NCDs to the Investors; The NCD Series 1A has maturity period of 12 months, Series 1B 60 months and Series 2 is 18 months from the date of allotment. The NCDs are secured by way of first pari-passu charge over entire fixed assets and current assets of the Holding Company. The NCDs are additionally secured by way of (i) personal guarantees of Dr. Rajesh Jain, Mr. Sandeep Jain and Mr. Ankesh Jain; (ii) pledge of 39,776,227 equity shares held by the promoters and promoter group members and (iii) pledge of equity shares of PBPL held by the Holding Company.
c. issued and allotted 71,11,111 convertible warrants at a price of Rs.180 each on a preferential basis to the Investors, entitling them to subscribe to an equivalent number of equity shares of face value of Re. 1 each at a premium of Rs.179 per share as per the provisions of Chapter V of ICDR Regulations;
58. In view of absence of profits during financial years 2013-14 and 2012-13, total remuneration paid to the Managing/ Joint Managing and Whole time Directors exceeded the ceiling prescribed in Section II of Part II of Schedule XIII to the Companies Act, 1956. Further, because of non-compliance to one of the conditions of part II Section II of Schedule V to the Companies Act, 2013, the remuneration paid to a whole time director during the year ended March 31, 2016 and remuneration paid to six directors (Managing/ Joint Managing and Whole time Directors) during the year ended March 31, 2017 and 2018 respectively required approval of the Central Government. The Company has also paid managerial remuneration amounting to Rs. 37.6 million during the financial year ended March 31, 2019 for which the Company required prior approval of the Central Government. The Company submitted applications to the Central Government for waiver of recovery of excess remuneration paid in respect of aforesaid periods. However, in view of the recent amendments in the provisions of Section 197 of the Companies Act, 2013 effective from September 12, 2018, whereby the powers of Central Government for approval of payment of managerial remuneration in excess of limits/ waiver of recovery of managerial remuneration recoverable, etc. have been transferred to the shareholders of the Company. Accordingly, the said applications stand abated at the Central Government. The Company has accordingly decided to obtain the necessary approval from its shareholders in due course in compliance with the aforesaid amended provisions of the Companies Act, 2013. Pending such approval, the Company has recorded an amount of Rs.154.0 million as on March 31, 2019 (March 31, 2018: Rs.116.4 million) as recoverable from such directors towards such excess remuneration paid. The Company is confident of obtaining necessary approvals from its shareholders.
59. For the financial year ended March 31, 2019, the Group has incurred a loss (before tax and exceptional items) of Rs.2,877.83 million (2018: loss of Rs.661.39 million) from continuing and discontinued operations. The continuous operating losses have adversely affected the cash flows of the Company. The Group has already taken various measures aimed at improving the financial condition of the Company, inter-alia, deploying funds received from the Investors for scaling up its vaccine as well as pharmaceutical formulations business in India and international markets including ROW countries, USA/EU, etc., besides expediting development of new products and monetization of non-core assets. Based on these measures and continuous efforts to improve the business performance, the management believes that it would be able to generate sustainable cash flows, recoup the erosion in its net worth through profitable operations, discharge its obligations as they fall due and has therefore concluded that the going concern assumption continues to be valid.
60. During the year, the Holding Company has reached bilateral settlements of its debts with each consortium lender individually. Subsequent to the year end, the Holding Company has paid all its debts on April 9, 2019 to the said lenders including ECB from Bank of India pursuant to the said bilateral settlements and obtained ‘no dues’ certificates from such lenders. For the financial year ended March 31, 2019, the Holding Company has written back excess liabilities of Rs.3,133.49 million, which is included as Exceptional Item in the Statement of Profit and Loss.
61. Radhika Heights Limited (“RHL”) (Formerly known as Best On Health Limited) along with its four subsidiaries had signed a Term sheet with the developer on 03.09.2012 for development of integrated township on its 108.713 acres land (including 83.044 acres land owned by its four subsidiaries) situated in Village Harsaru and Hyatpur, Gurgaon, Haryana. Further, the Term Sheet was a Preliminary document for the development of the Township over the land. However, due to notification of Master Plan 2031, the Collaboration agreement was signed dated 19.10.2012 and also in between an agreement dated. 04.10.2012 was executed between the parties that in case the land owners resale/ back out/ refrain from abiding by contractual covenants incorporated in the Term Sheet, the developer shall be entitled to estimated/ liquidated compensation equivalent to Rs. 30 Crore from land owners or 10 acres of land in case the Land owners fail to pay this amount during the period of 6 months of breach alongwith refund of any amount made by the developer with the Land Owners. Certain disputes had arisen between the parties and while the negotiations were still on, Bestech India Pvt. Limited (“the Developer”) invoked arbitration by sending Notice on 16.12.2013 to RHL and its four subsidiaries, and filed Section 9 Petition with the Hon’ble District court, Gurgaon, and the matter was then referred to Arbitral Tribunal. The Hon’ble District Court vide its order dated 12.02.2014 granted an interim stay over the Land according to which RHL and its four subsidiaries cannot sell, create any third party rights and interfere in any manner with the land. Further, RHL and its four subsidiaries moved petition with the Hon’ble High Court at Chandigarh seeking cancellation of the stay. In response, the Developer appealed for extension of stay till the decision of Arbitration is granted. After hearing both sides, the Hon’ble High Court at Chandigarh extended the stay over land till the decision of Arbitral Tribunal. In the Arbitral Tribunal proceedings, the developer (Bestech) and RHL & its four subsidiaries have filed their Claim and Counter Claim alongwith their Replies and Rejoinders and RHL and its four subsidiaries filed its amended Counter Claim excluding its claim relating to land of 14 acres for Group Housing development. The developer has filed its reply to the amended counter claim and thereafter RHL and its four subsidiaries have filed rejoinder to such reply. Now the matter is at the cross examination of witnesses of the Developer. The matter is under arbitration and hence subjudiced and is likely to take some time before it is decided. However, liability if any, cannot be quantified at this point of time and in case the liability stands quantified by the Hon’ble Arbitral Tribunal, the same shall be paid in proportion to the lands owned by RHL and its four subsidiaries. The management of RHL is certain and hopeful to receive favorable orders from the Arbitral Tribunal.
62. During the financial year 2007-08, the Holding Company had given an advance of Rs.176.8 million pursuant to the agreement with Ilyas & Mustafa Galadari Management Investment & Development (L.L.C.), U.A.E. (‘the Developer’) for purchase of certain immoveable properties in Dubai.

Annual Report 2018-19172
Notes to the Consolidated Financial Statements for the year ended March 31, 2019
The Developer failed to deliver the said properties to the Holding Company and offered other properties under construction in lieu of the said properties. Owing to continuous delays in completion of construction, the Company has initiated legal recourse and issued a legal notice to the Developer.
During the previous financial year, with a view to restructure the Holding Company’s debt obligations and reduce its interest outlay, the Board of Directors of the Holding Company had approved the assignment of its receivables from the Developer to RHL in lieu of adjustment of part of RHL’s loan payable by the Holding Company. The Holding Company has executed the agreement for assignment of this advance to RHL on April 06, 2019. The process of assigning the said receivable to RHL and complying with the applicable provisions of the Foreign Exchange Management Act, 1999 as amended and other applicable laws, is expected to be completed in due course.
In view of ongoing discussions with the Developer and on the basis of the legal advice obtained, the Group believes that it has valid rights to claim the recovery of the advance paid to the Developer, in the form of either a refund or allotment of other properties. The management believes that the advance given to the Developer is fully realisable. Accordingly, no adjustments are considered necessary in the books of accounts.
63. As at March 31, 2019, a cumulative amount of Rs.411.30 million (March 31, 2018 Rs.341.38 million) is available with the Group as ‘MAT Credit Entitlement’which, based on the then future profitability projections, could have been recovered and set off in subsequent years as per the provisions of Section 115JAA of the Income-tax Act, 1961. However, based on revised estimates of future profitability projections and other factors disclosed under note 52, the management, expects that the recoverable amount of MAT will be Rs.202.30 million as at March 31, 2019 (March 31, 2018: Rs.230.14 million). Accordingly, an amount of Rs.27.83 million (net of MAT credit of Rs.69.92 million) (financial year 2017-18: Rs.98.81 million) has been provided as non-recoverable during the year. The total provision of non receoverable MAT is Rs.209.00 as on March 31, 2019 (March 31, 2018: Rs.111.24 million).
64. 0.00 under “Rs. in million” represents amount less than Rs.50,000 and 0.00 under units represents units less than 50,000. Further, the figures shown in the tables may not exactly add up due to rounding off.
For Walker Chandiok & Co LLP For and on behalf of Board of Directors of Panacea Biotec LimitedChartered AccountantsFirm Registration No. 001076N/N500013
Anupam Kumar Soshil Kumar Jain Dr. Rajesh JainPartner Chairman Managing DirectorMembership No. 501531 (DIN 00012812) (DIN 00013053)
Vinod Goel Devender GuptaPlace : New Delhi Group CFO and Head Legal Chief Financial Officer & Date : May 30, 2019 & Company Secretary Head Information Technology


Panacea Biotec Ltd.CIN: L33117PB1984PLC022350
B-1 Extn./ G-3, Mohan Co-operative Indl. Estate, Mathura Road, New Delhi - 110 044, INDIATel.: +91-11-4167 9000, 4157 8000. Fax: +91-11-4167 9070, 4167 9081
www.panaceabiotec.com