private debt: the opportunity for diversification ... - tiaa · private equity deals and...
TRANSCRIPT
Private debt: The opportunity for diversification with illiquid assets.
Summer 2016
Executive summary
W Private debt has emerged as an asset class addressing institutional investors’ search for yield and lower volatility amid record-low interest rates and market uncertainty.
W Structural changes in fixed-income markets—decreased liquidity and rising asset correlations—are increasing investors’ willingness to trade liquidity for yield.
W Banks pulling back from the middle market have created opportunity for non-bank asset managers to issue direct loans to below-investment-grade companies at higher interest rates.
W Among private debt categories, middle market senior loans and mezzanine debt historically have offered particularly attractive risk-adjusted returns as potential substitutes for traditional assets, including high-yield bonds and equity.
W The private debt market’s complexity requires due diligence in selecting experienced asset managers with a record of success in creating diversified private loan portfolios.
Contents2 Private debt: A potential solution in the search for yield
3 Middle market direct loans: The opportunity for better risk-adjusted returns
9 Mezzanine debt: The advantages of its role in optimizing corporate capital
12 Appendix A: Investment grade private placement loans—an alternative to traditional corporate debt
13 Appendix B: What is private debt?
Heather DavisChief Investment Officer TIAA Global Real Assets
Brian RoelkeHead of TIAA Private Capital
Jason StrifeHead of Private Equity and Junior Capital
Randy SchwimmerHead of Origination and Capital Markets Churchill Asset Management

Private debt: The opportunity for diversification with illiquid assets.
For Institutional Investor Use Only 2
Market challenges spark demand for private debt’s “illiquidity premium”
Private debt is emerging as a potential solution for institutional investors confronting low interest yields and structural changes in fixed-income markets. Investors are turning to alternative credit in search of higher yield, better diversification, and lower risk than offered by traditional asset classes. Senior leveraged loans to middle market companies, in particular, are among the fastest-growing private debt alternatives as banks curtail their exposure to middle market borrowers. Nonetheless, institutional investors remain underinvested in private debt because they lack familiarity with a less-established asset class.
Powerful trends are driving demand for private debt overall and middle market senior loans in particular. First, pension plans and insurance companies are struggling to achieve targeted rates of return amid record-low yields on traditional fixed-income investments. Their capacity to increase risk in search of returns is limited by their liabilities and, for insurance companies, by capital requirements.
Second, structural changes in bond markets, including decreased liquidity and rising asset correlations, are changing how investors think about liquidity and risk. Long-term investors who can buy and hold are more willing to trade liquidity for higher yield—the “illiquidity premium” that has made private debt attractive. There is also willingness to increase exposure to sub-investment-grade private debt with strict covenants and other protections that help to reduce default and loss rates.
Third, banks have curtailed lending to middle market companies following decades of consolidation in the sector and in response to higher capital charges for middle market loans. The middle market—generating more than $10 trillion in combined revenue or about a third of U.S. private-sector GDP1—needs ready access to capital for growth, leveraged buyouts and other needs. Non-bank asset managers are filling the void with direct senior loans to middle market companies that have offered investors both higher yield and lower default risk in exchange for illiquidity.
Private debt offers attractive risk and return characteristicsPrivate debt’s past record of generally higher risk-adjusted returns—and the range of yield and risk characteristics across different categories—make it an attractive alternative to traditional fixed-income and equity investments. Potential advantages include:
W Yields significantly higher than offered by similarly-rated public debt to compensate for illiquidity
W Lower default and loss rates historically compared to public high-yield bonds due to strict covenants, management oversight, and other safeguards
W Diversification benefits based on generally low correlations with traditional assets
W Lower interest-rate risk for leveraged loans using floating-rate structures with lower duration
Investors are turning to alternative credit in search of higher yield, better diversification, and lower risk.

Private debt: The opportunity for diversification with illiquid assets.
For Institutional Investor Use Only 3
Demand for alternatives is driving growth of private debt and direct lendingDemand for alternative investments is driving rapid growth across private debt segments, with the largest increase by far in direct lending to the middle market. Global private debt investment in closed-end funds (excluding broadly-syndicated bank loans) increased by 90% to $561 billion in dry powder and unrealized value between 2010 and 2015.2 (Dry powder represents committed capital not yet invested and unrealized value represents invested capital—the sum is a proxy for assets under management.) Direct lending to middle market companies had the highest growth rate at 292%3—a nearly four-fold increase to $137 billion—that far outpaced the largest three categories of private debt, including distressed debt and mezzanine.
Middle market direct loans: The sweet spot for private debtThe growth of middle market direct loans is expanding the availability of private debt with potential for both higher yields and lower risk to meet institutional investor demand. But investors should understand important distinctions between two broad categories of leveraged loans—broadly syndicated and direct—offering different levels of liquidity, risk and return.
First, we define the middle market4 broadly to include loans up to $500 million, which represent $198 billion, or 22% of the $886 billion in loans tracked by the S&P/LSTA Leveraged Loan Index.5 The vast majority are broadly syndicated loans issued by banks to larger companies with EBITDA6 greater than $50 million. Senior in the capital structure with first claim on the borrower’s assets, syndicated loans are distributed by banks to large groups of institutional investors. Since they are traded on secondary markets, syndicated loans are more liquid—resulting in lower yields and higher volatility, compared to direct loans. Syndicated loans also have experienced higher default and loss rates partly due to less rigorous due diligence and oversight by banks that sell the loans to investors, rather than hold them.
Differences in how direct loans are structured and issued have made this market the sweet spot for investors. Direct loans generally serve smaller companies with EBITDA ranging between $10 million and $50 million and loan facilities up to $250 million. Lenders in this market consist of small groups of generally up to 10 investors—known as “clubs”—that structure loan packages for a single borrower. Private “club” loans are generally held to maturity rather than traded, which has reduced their volatility. Like bank loans, direct loans are senior in the capital structure, but they also benefit from protections that help to reduce credit risk. Three interrelated factors account for the attractiveness of middle market direct loans:
1. The illiquidity premiumDirect loans have enjoyed a return advantage because of the illiquidity premium—typically 100 to 200 basis points over syndicated loans and approaching parity with public high-yield bonds. The extra yield compensates investors for holding loans that are not publicly traded and cannot be sold quickly. Despite their illiquidity, direct loans have offered better default and loss protection than syndicated loans. Issuers generally conduct deep due diligence, work closely with borrowers, and structure loans conservatively with less leverage, higher interest coverage, and tighter covenants. As a result, pension plans and other long-term investors may consider increasing exposure to illiquid assets as a reasonable tradeoff for higher yield and lower volatility.
2. Banks pulling back creates opportunity in direct lendingStructural changes are generating demand for non-bank loans offering attractive investment characteristics. Although banks still dominate corporate lending, they are pulling back from the lower end of the middle market, reducing their exposure to these loans in response to
Middle market direct loans are the sweet spot for investors seeking higher yield and lower risk in exchange for illiquidity.

Private debt: The opportunity for diversification with illiquid assets.
For Institutional Investor Use Only 4
industry consolidation and increased regulation. Facing uncertain financing, middle market companies are willing to pay higher interest rates for access to capital, allowing non-bank lenders to offer higher investment yields. At the same time, banks have shifted toward larger syndicated loans that are heavily traded and subject to market volatility. In contrast, direct loans are generally held to maturity rather than traded, resulting in lower volatility.
3. Private equity dry powder suggests a backlog of demand for direct loansPrivate equity deals and refinancing are expected to generate up to $1 trillion in new loan demand over the next several years. U.S. private equity firms, which sponsor about half of middle market loans, have amassed more than $500 billion of committed capital not yet invested. With a typical equity capitalization of 40%, the available private equity dry powder implies more than $800 billion in new loan demand. In addition, more than $500 billion of maturing middle market loans will require refinancing by 2020.7 Regulatory limits on leveraged lending will prevent many banks from refinancing existing loans, forcing borrowers to turn to non-bank lenders.
To be sure, the global economic slowdown and plunge in oil prices recently have dampened demand for loans. After growing from $150 billion in 2010 to more than $200 billion in 2014, bank loan issuance in the middle market dropped 29% to $143 billion in 2015 and was down 26% in the first half of 2016, compared with a year earlier.8 Market uncertainty cut demand for riskier assets, hurting both private debt fundraising and mergers and acquisitions. Although bank loan issuance remained nearly flat in the second quarter, private debt fundraising doubled to $16 billion—dominated by direct lending funds in the middle market.9
Private debt’s potential to improve portfolio risk-adjusted returns
Diversifying the sources of risk and returnPrivate debt offers institutional investors the potential to improve performance by diversifying the sources of return and risk associated with traditional asset classes. Returns for traditional bonds, for example, are determined by the risk premiums related to credit quality, interest-rates, and inflation. Private debt can offer incremental returns by providing exposure to additional risk premiums: Illiquidity, manager skill in less efficient markets, and structural changes, such as the decline in bank lending.10 Direct loans, for example, can diversify portfolios by providing exposure to the illiquidity premium, reducing reliance on risk factors associated with traditional fixed-income or equity assets. Private debt with floating-rate structures offer the potential to improve yield and reduce interest-rate risk as alternatives to fixed-rate corporate and high-yield debt. They can also help to manage portfolio volatility by reducing reliance on public or private equity assets in an expected low-return environment.
Portfolio analysis: Benefits of combining private debt with traditional assetsTo assess the benefits of private debt, TIAA compared returns, correlations, and portfolio efficient frontiers for two categories of private debt—leveraged loans and mezzanine debt—versus traditional stocks and bonds, including public high-yield debt. For leveraged loans, we consider two segments among syndicated bank loans—larger, broadly syndicated loans and middle market loans—both reported in the S&P/LSTA Leveraged Loan Index.11 There is no publicly available index of returns for the most attractive segment, direct non-bank loans, although we have included comparisons of yield, default, and loss rates. For mezzanine debt, we use a Cambridge Associates index of quarterly returns.12 Our analysis starts with broadly syndicated and middle market loans.
Private equity deals and refinancing are expected to generate up to $1 trillion in new loan demand over the next several years.
Private debt: The opportunity for diversification with illiquid assets.
For Institutional Investor Use Only 5
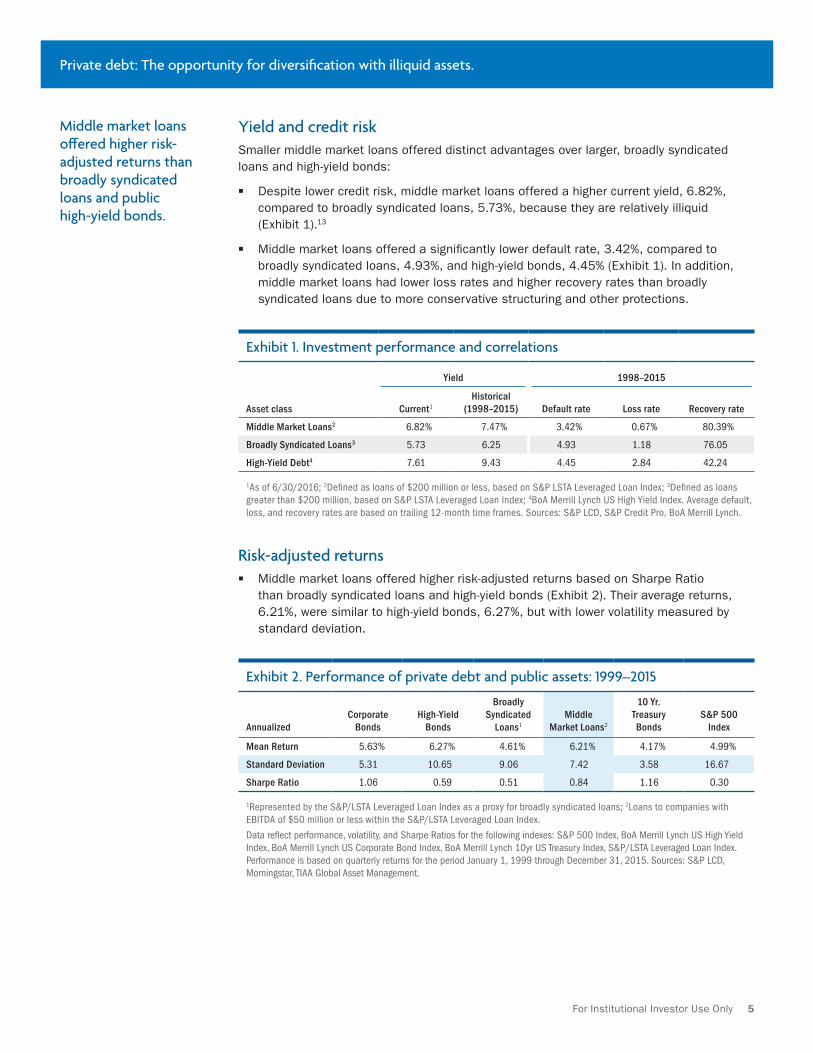
Yield and credit riskSmaller middle market loans offered distinct advantages over larger, broadly syndicated loans and high-yield bonds:
W Despite lower credit risk, middle market loans offered a higher current yield, 6.82%, compared to broadly syndicated loans, 5.73%, because they are relatively illiquid (Exhibit 1).13
W Middle market loans offered a significantly lower default rate, 3.42%, compared to broadly syndicated loans, 4.93%, and high-yield bonds, 4.45% (Exhibit 1). In addition, middle market loans had lower loss rates and higher recovery rates than broadly syndicated loans due to more conservative structuring and other protections.
Exhibit 1. Investment performance and correlations
Yield 1998–2015
Asset class Current1
Historical (1998–2015) Default rate Loss rate Recovery rate
Middle Market Loans2 6.82% 7.47% 3.42% 0.67% 80.39%
Broadly Syndicated Loans3 5.73 6.25 4.93 1.18 76.05
High-Yield Debt4 7.61 9.43 4.45 2.84 42.24
1As of 6/30/2016; 2Defined as loans of $200 million or less, based on S&P LSTA Leveraged Loan Index; 3Defined as loans greater than $200 million, based on S&P LSTA Leveraged Loan Index; 4BoA Merrill Lynch US High Yield Index. Average default, loss, and recovery rates are based on trailing 12-month time frames. Sources: S&P LCD, S&P Credit Pro, BoA Merrill Lynch.
Risk-adjusted returns W Middle market loans offered higher risk-adjusted returns based on Sharpe Ratio
than broadly syndicated loans and high-yield bonds (Exhibit 2). Their average returns, 6.21%, were similar to high-yield bonds, 6.27%, but with lower volatility measured by standard deviation.
Exhibit 2. Performance of private debt and public assets: 1999–2015
AnnualizedCorporate
BondsHigh-Yield
Bonds
Broadly Syndicated
Loans1
Middle Market Loans2
10 Yr. Treasury Bonds
S&P 500 Index
Mean Return 5.63% 6.27% 4.61% 6.21% 4.17% 4.99%
Standard Deviation 5.31 10.65 9.06 7.42 3.58 16.67
Sharpe Ratio 1.06 0.59 0.51 0.84 1.16 0.30
1Represented by the S&P/LSTA Leveraged Loan Index as a proxy for broadly syndicated loans; 2Loans to companies with EBITDA of $50 million or less within the S&P/LSTA Leveraged Loan Index.
Data reflect performance, volatility, and Sharpe Ratios for the following indexes: S&P 500 Index, BoA Merrill Lynch US High Yield Index, BoA Merrill Lynch US Corporate Bond Index, BoA Merrill Lynch 10yr US Treasury Index, S&P/LSTA Leveraged Loan Index. Performance is based on quarterly returns for the period January 1, 1999 through December 31, 2015. Sources: S&P LCD, Morningstar, TIAA Global Asset Management.
Middle market loans offered higher risk-adjusted returns than broadly syndicated loans and public high-yield bonds.
Private debt: The opportunity for diversification with illiquid assets.
For Institutional Investor Use Only 6
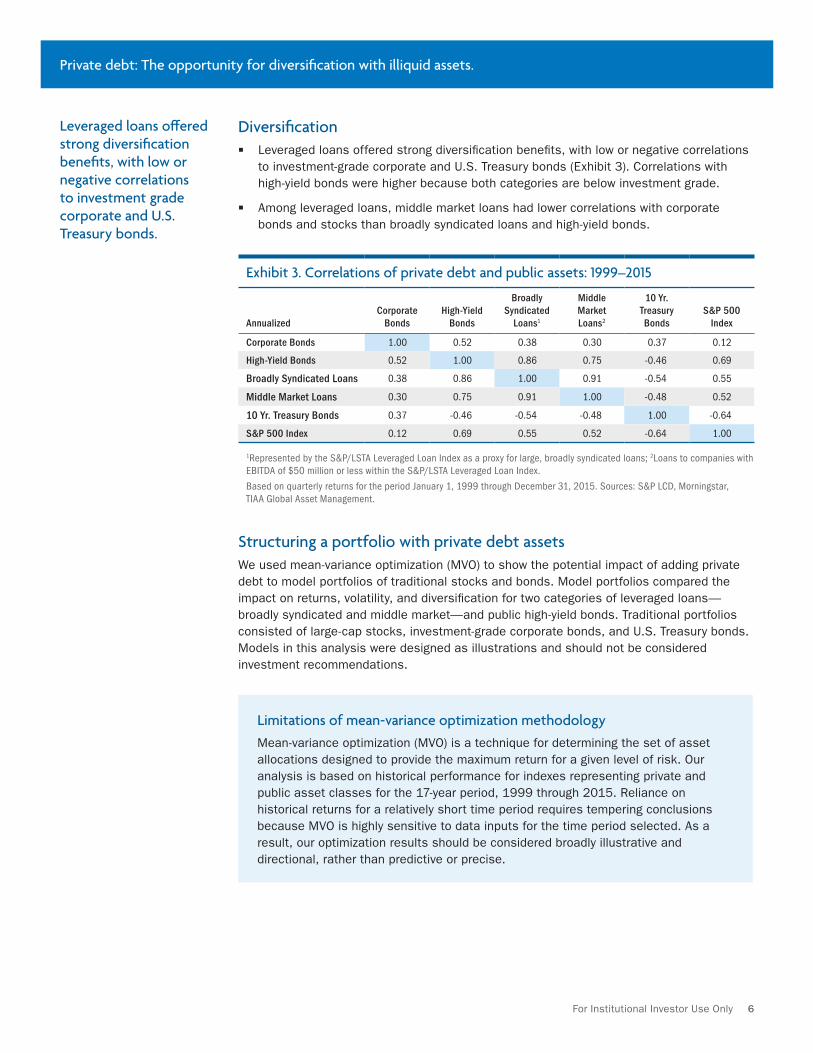
Diversification W Leveraged loans offered strong diversification benefits, with low or negative correlations
to investment-grade corporate and U.S. Treasury bonds (Exhibit 3). Correlations with high-yield bonds were higher because both categories are below investment grade.
W Among leveraged loans, middle market loans had lower correlations with corporate bonds and stocks than broadly syndicated loans and high-yield bonds.
Exhibit 3. Correlations of private debt and public assets: 1999–2015
AnnualizedCorporate
BondsHigh-Yield
Bonds
Broadly Syndicated
Loans1
Middle Market Loans2
10 Yr. Treasury Bonds
S&P 500 Index
Corporate Bonds 1.00 0.52 0.38 0.30 0.37 0.12
High-Yield Bonds 0.52 1.00 0.86 0.75 -0.46 0.69
Broadly Syndicated Loans 0.38 0.86 1.00 0.91 -0.54 0.55
Middle Market Loans 0.30 0.75 0.91 1.00 -0.48 0.52
10 Yr. Treasury Bonds 0.37 -0.46 -0.54 -0.48 1.00 -0.64
S&P 500 Index 0.12 0.69 0.55 0.52 -0.64 1.00
1Represented by the S&P/LSTA Leveraged Loan Index as a proxy for large, broadly syndicated loans; 2Loans to companies with EBITDA of $50 million or less within the S&P/LSTA Leveraged Loan Index.
Based on quarterly returns for the period January 1, 1999 through December 31, 2015. Sources: S&P LCD, Morningstar, TIAA Global Asset Management.
Structuring a portfolio with private debt assetsWe used mean-variance optimization (MVO) to show the potential impact of adding private debt to model portfolios of traditional stocks and bonds. Model portfolios compared the impact on returns, volatility, and diversification for two categories of leveraged loans—broadly syndicated and middle market—and public high-yield bonds. Traditional portfolios consisted of large-cap stocks, investment-grade corporate bonds, and U.S. Treasury bonds. Models in this analysis were designed as illustrations and should not be considered investment recommendations.
Limitations of mean-variance optimization methodologyMean-variance optimization (MVO) is a technique for determining the set of asset allocations designed to provide the maximum return for a given level of risk. Our analysis is based on historical performance for indexes representing private and public asset classes for the 17-year period, 1999 through 2015. Reliance on historical returns for a relatively short time period requires tempering conclusions because MVO is highly sensitive to data inputs for the time period selected. As a result, our optimization results should be considered broadly illustrative and directional, rather than predictive or precise.
Leveraged loans offered strong diversification benefits, with low or negative correlations to investment grade corporate and U.S. Treasury bonds.
Private debt: The opportunity for diversification with illiquid assets.
For Institutional Investor Use Only 7
Observation 1: Private debt improved the risk-adjusted performance of a traditional portfolio of stocks and bonds
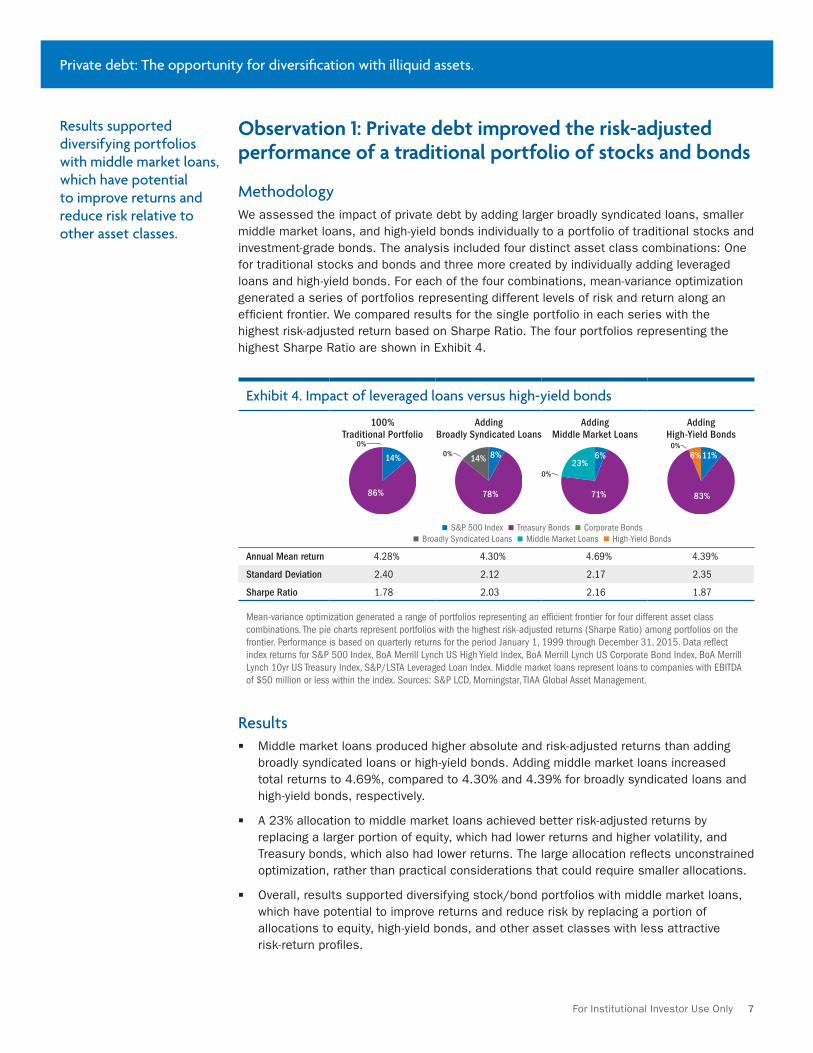
MethodologyWe assessed the impact of private debt by adding larger broadly syndicated loans, smaller middle market loans, and high-yield bonds individually to a portfolio of traditional stocks and investment-grade bonds. The analysis included four distinct asset class combinations: One for traditional stocks and bonds and three more created by individually adding leveraged loans and high-yield bonds. For each of the four combinations, mean-variance optimization generated a series of portfolios representing different levels of risk and return along an efficient frontier. We compared results for the single portfolio in each series with the highest risk-adjusted return based on Sharpe Ratio. The four portfolios representing the highest Sharpe Ratio are shown in Exhibit 4.
Exhibit 4. Impact of leveraged loans versus high-yield bonds
100% Traditional Portfolio
Adding Broadly Syndicated Loans
Adding Middle Market Loans
Adding High-Yield Bonds
86%
14%
78%
8%14%
71%
0% 6%23%
83%
11%6%
W S&P 500 Index W Treasury Bonds W Corporate Bonds W Broadly Syndicated Loans W Middle Market Loans W High-Yield Bonds
Annual Mean return 4.28% 4.30% 4.69% 4.39%
Standard Deviation 2.40 2.12 2.17 2.35
Sharpe Ratio 1.78 2.03 2.16 1.87
Mean-variance optimization generated a range of portfolios representing an efficient frontier for four different asset class combinations. The pie charts represent portfolios with the highest risk-adjusted returns (Sharpe Ratio) among portfolios on the frontier. Performance is based on quarterly returns for the period January 1, 1999 through December 31, 2015. Data reflect index returns for S&P 500 Index, BoA Merrill Lynch US High Yield Index, BoA Merrill Lynch US Corporate Bond Index, BoA Merrill Lynch 10yr US Treasury Index, S&P/LSTA Leveraged Loan Index. Middle market loans represent loans to companies with EBITDA of $50 million or less within the index. Sources: S&P LCD, Morningstar, TIAA Global Asset Management.
Results W Middle market loans produced higher absolute and risk-adjusted returns than adding
broadly syndicated loans or high-yield bonds. Adding middle market loans increased total returns to 4.69%, compared to 4.30% and 4.39% for broadly syndicated loans and high-yield bonds, respectively.
W A 23% allocation to middle market loans achieved better risk-adjusted returns by replacing a larger portion of equity, which had lower returns and higher volatility, and Treasury bonds, which also had lower returns. The large allocation reflects unconstrained optimization, rather than practical considerations that could require smaller allocations.
W Overall, results supported diversifying stock/bond portfolios with middle market loans, which have potential to improve returns and reduce risk by replacing a portion of allocations to equity, high-yield bonds, and other asset classes with less attractive risk-return profiles.
0%0%
0%
0%
Results supported diversifying portfolios with middle market loans, which have potential to improve returns and reduce risk relative to other asset classes.
Private debt: The opportunity for diversification with illiquid assets.
For Institutional Investor Use Only 8
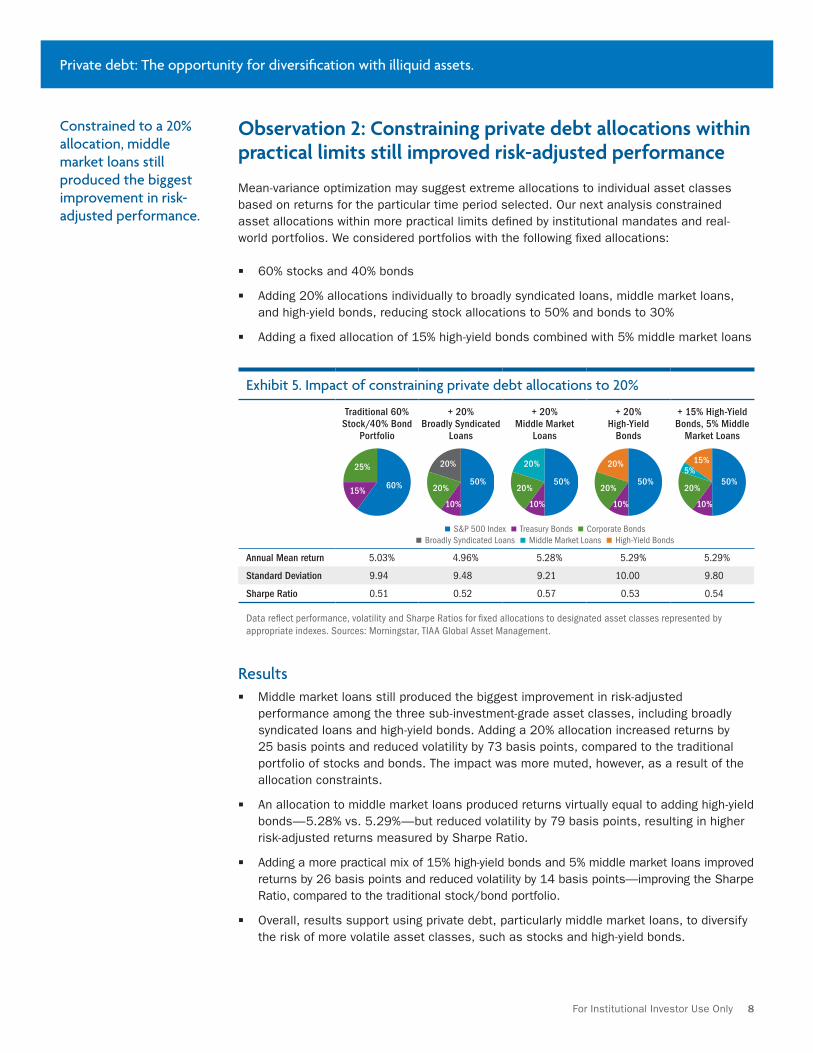
Observation 2: Constraining private debt allocations within practical limits still improved risk-adjusted performance
Mean-variance optimization may suggest extreme allocations to individual asset classes based on returns for the particular time period selected. Our next analysis constrained asset allocations within more practical limits defined by institutional mandates and real-world portfolios. We considered portfolios with the following fixed allocations:
W 60% stocks and 40% bonds
W Adding 20% allocations individually to broadly syndicated loans, middle market loans, and high-yield bonds, reducing stock allocations to 50% and bonds to 30%
W Adding a fixed allocation of 15% high-yield bonds combined with 5% middle market loans
Exhibit 5. Impact of constraining private debt allocations to 20%
Traditional 60% Stock/40% Bond
Portfolio
+ 20% Broadly Syndicated
Loans
+ 20% Middle Market
Loans
+ 20% High-Yield
Bonds
+ 15% High-Yield Bonds, 5% Middle
Market Loans
60%
0%25%
15%50%
0%
10%
20%
20%50%
0%
10%
20%
20%50%
0%
10%
20%
20%50%
5%
10%
15%
20%
W S&P 500 Index W Treasury Bonds W Corporate Bonds W Broadly Syndicated Loans W Middle Market Loans W High-Yield Bonds
Annual Mean return 5.03% 4.96% 5.28% 5.29% 5.29%
Standard Deviation 9.94 9.48 9.21 10.00 9.80
Sharpe Ratio 0.51 0.52 0.57 0.53 0.54
Data reflect performance, volatility and Sharpe Ratios for fixed allocations to designated asset classes represented by appropriate indexes. Sources: Morningstar, TIAA Global Asset Management.
Results W Middle market loans still produced the biggest improvement in risk-adjusted
performance among the three sub-investment-grade asset classes, including broadly syndicated loans and high-yield bonds. Adding a 20% allocation increased returns by 25 basis points and reduced volatility by 73 basis points, compared to the traditional portfolio of stocks and bonds. The impact was more muted, however, as a result of the allocation constraints.
W An allocation to middle market loans produced returns virtually equal to adding high-yield bonds—5.28% vs. 5.29%—but reduced volatility by 79 basis points, resulting in higher risk-adjusted returns measured by Sharpe Ratio.
W Adding a more practical mix of 15% high-yield bonds and 5% middle market loans improved returns by 26 basis points and reduced volatility by 14 basis points—improving the Sharpe Ratio, compared to the traditional stock/bond portfolio.
W Overall, results support using private debt, particularly middle market loans, to diversify the risk of more volatile asset classes, such as stocks and high-yield bonds.
Constrained to a 20% allocation, middle market loans still produced the biggest improvement in risk-adjusted performance.
Private debt: The opportunity for diversification with illiquid assets.
For Institutional Investor Use Only 9
Mezzanine debt: A specialized category of private loans
Mezzanine loans—a more specialized form of private debt usually invested as unsecured subordinated debt or second lien term debt—have unique advantages over other fixed-income sectors. These loans typically are used in leveraged buyout transactions to fill the gap between the sponsor’s equity capitalization and optimal senior debt levels. Mezzanine loans have offered higher yields reflecting their junior debt position, but their performance has implied less risk than spreads would suggest. Market participants attribute this, among other factors, to private equity sponsors’ willingness to support borrowers. As a result, mezzanine debt has demonstrated better risk-adjusted returns than other forms of private and public debt.
Mezzanine loans globally represented $132.5 billion in assets as of December 31, 2015, ranking third after distressed debt and direct lending among five private debt categories tracked by Preqin.14 These specialized loans are more difficult to access and had the slowest growth rate at 38% between 2010 and 2015.
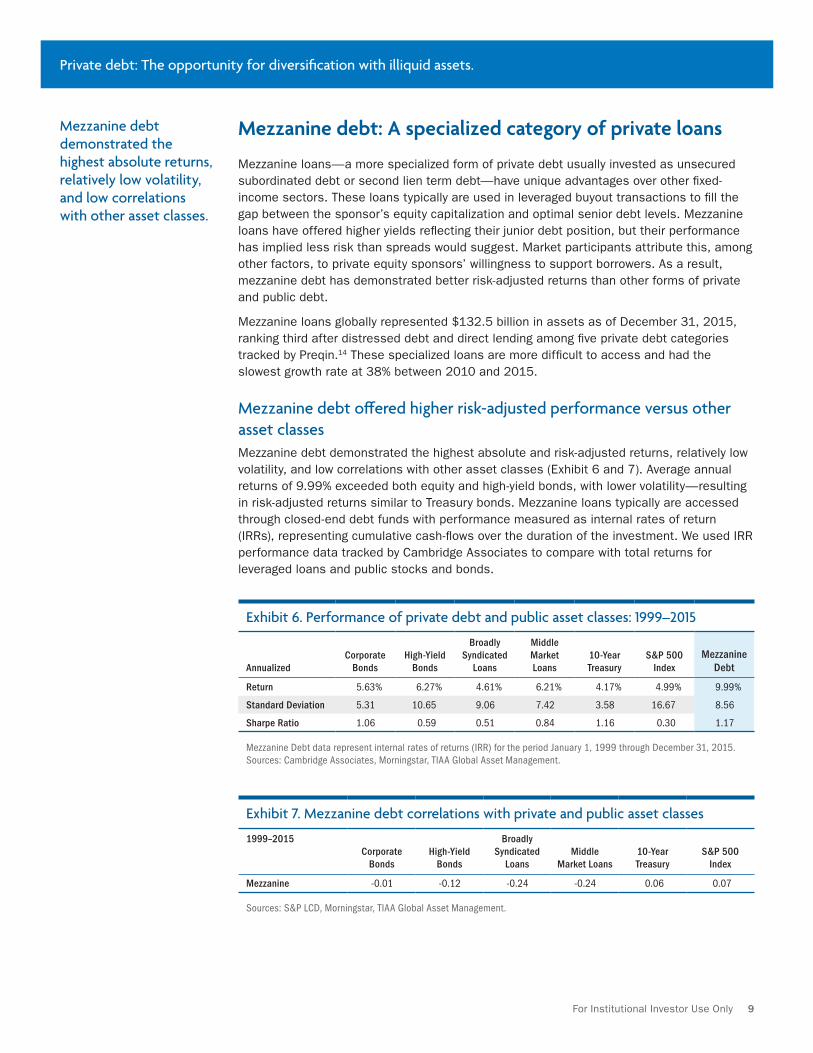
Mezzanine debt offered higher risk-adjusted performance versus other asset classesMezzanine debt demonstrated the highest absolute and risk-adjusted returns, relatively low volatility, and low correlations with other asset classes (Exhibit 6 and 7). Average annual returns of 9.99% exceeded both equity and high-yield bonds, with lower volatility—resulting in risk-adjusted returns similar to Treasury bonds. Mezzanine loans typically are accessed through closed-end debt funds with performance measured as internal rates of return (IRRs), representing cumulative cash-flows over the duration of the investment. We used IRR performance data tracked by Cambridge Associates to compare with total returns for leveraged loans and public stocks and bonds.
Exhibit 6. Performance of private debt and public asset classes: 1999–2015
AnnualizedCorporate
BondsHigh-Yield
Bonds
Broadly Syndicated
Loans
Middle Market Loans
10-Year Treasury
S&P 500 Index
Mezzanine Debt
Return 5.63% 6.27% 4.61% 6.21% 4.17% 4.99% 9.99%
Standard Deviation 5.31 10.65 9.06 7.42 3.58 16.67 8.56
Sharpe Ratio 1.06 0.59 0.51 0.84 1.16 0.30 1.17
Mezzanine Debt data represent internal rates of returns (IRR) for the period January 1, 1999 through December 31, 2015. Sources: Cambridge Associates, Morningstar, TIAA Global Asset Management.
Exhibit 7. Mezzanine debt correlations with private and public asset classes
1999–2015Corporate
BondsHigh-Yield
Bonds
Broadly Syndicated
LoansMiddle
Market Loans10-Year Treasury
S&P 500 Index
Mezzanine -0.01 -0.12 -0.24 -0.24 0.06 0.07
Sources: S&P LCD, Morningstar, TIAA Global Asset Management.
Mezzanine debt demonstrated the highest absolute returns, relatively low volatility, and low correlations with other asset classes.
Private debt: The opportunity for diversification with illiquid assets.
For Institutional Investor Use Only 10
Accounting for mezzanine debt’s attractive risk-return profileSeveral distinct factors are commonly cited as contributors to mezzanine debt’s attractive risk-return profile: support from private equity sponsors, illiquidity and performance sweeteners that offset its higher default risk. Private equity sponsors are deeply involved in optimizing a borrower’s capital structure in their efforts to improve the equity value and credit quality. In addition, lender participation in board-level management provides early warning of distress and enables negotiations with private equity sponsors, helping to reduce defaults and improve recovery rates. Playing a critical role in buyout deals, mezzanine debt is generally held to maturity and rarely traded, which makes it illiquid and accounts for its relatively low volatility. As a result of its subordinate position, mezzanine debt may experience a low recovery rate in the event of default. To offset higher risk, loans are usually structured with higher yields and an equity ownership stake to participate in the borrowing company’s growth, contributing to higher returns.
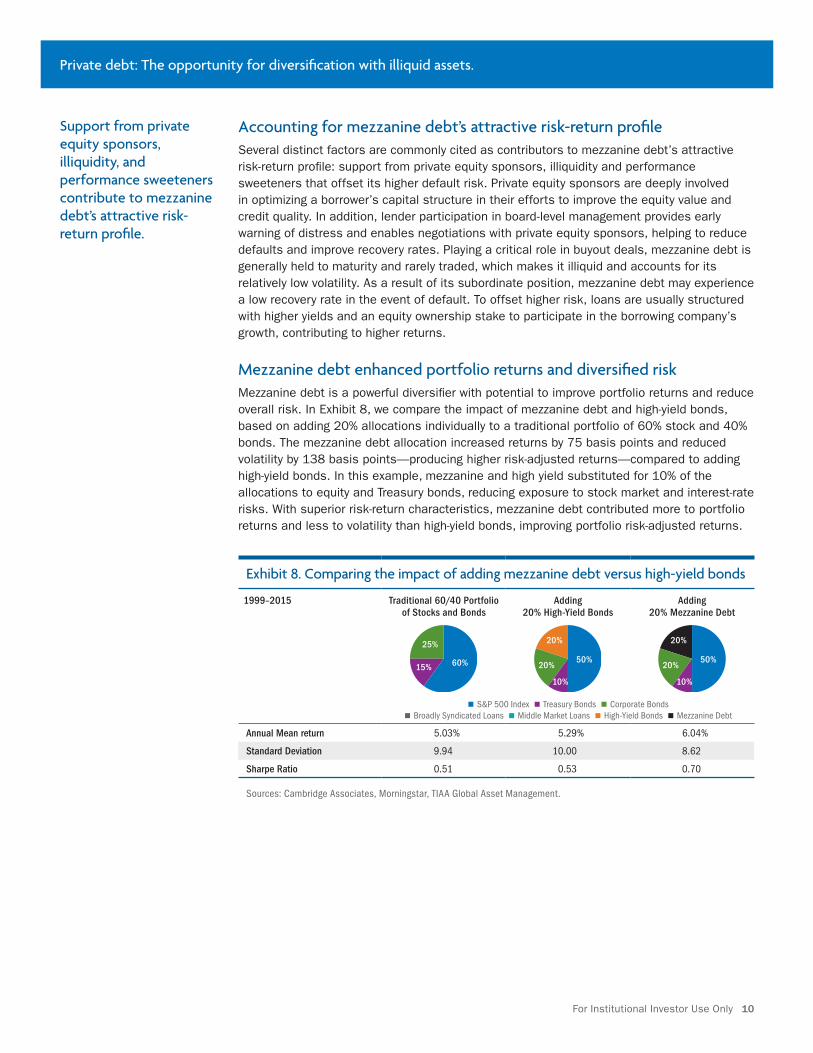
Mezzanine debt enhanced portfolio returns and diversified riskMezzanine debt is a powerful diversifier with potential to improve portfolio returns and reduce overall risk. In Exhibit 8, we compare the impact of mezzanine debt and high-yield bonds, based on adding 20% allocations individually to a traditional portfolio of 60% stock and 40% bonds. The mezzanine debt allocation increased returns by 75 basis points and reduced volatility by 138 basis points—producing higher risk-adjusted returns—compared to adding high-yield bonds. In this example, mezzanine and high yield substituted for 10% of the allocations to equity and Treasury bonds, reducing exposure to stock market and interest-rate risks. With superior risk-return characteristics, mezzanine debt contributed more to portfolio returns and less to volatility than high-yield bonds, improving portfolio risk-adjusted returns.
Exhibit 8. Comparing the impact of adding mezzanine debt versus high-yield bonds
1999–2015 Traditional 60/40 Portfolio of Stocks and Bonds
Adding 20% High-Yield Bonds
Adding 20% Mezzanine Debt
60%15%
25%
50%
10%
20%
20%
50%
10%
20%
20%
W S&P 500 Index W Treasury Bonds W Corporate Bonds W Broadly Syndicated Loans W Middle Market Loans W High-Yield Bonds W Mezzanine Debt
Annual Mean return 5.03% 5.29% 6.04%
Standard Deviation 9.94 10.00 8.62
Sharpe Ratio 0.51 0.53 0.70
Sources: Cambridge Associates, Morningstar, TIAA Global Asset Management.
Support from private equity sponsors, illiquidity, and performance sweeteners contribute to mezzanine debt’s attractive risk-return profile.

Private debt: The opportunity for diversification with illiquid assets.
For Institutional Investor Use Only 11
Risks of investing in private debt
Private debt involves a range of risks that can vary widely depending on the category, the structure of a particular loan, and the asset manager’s experience in selecting less-risky deals. Credit risk is important considering that most private debt categories are below investment grade, although the risk of a credit event can be lower than yield spreads would suggest. Default and loss rates can vary widely depending on the category and deal structure. Some risks, such as illiquidity, may be less important to buy-and-hold investors. Private debt’s complexity and diversity recommend thorough due diligence in understanding specific risks in relation to investment objectives.
Credit riskDepending on category, private debt’s credit risk can be lower than similarly-rated public debt. While default rates have been lower for middle market loans, loss and recovery rates have tended to be significantly better for leveraged loans overall, compared to high-yield bonds (Exhibit 1 on page 5). In general, we believe credit risks tend to be even lower for direct loans arranged through the “club” loan market. Direct loans can benefit from tighter covenants and continuing credit monitoring. Private equity sponsorship also tends to reduce default and loss risks, given the sponsor’s incentive to provide financial and management support.
IlliquidityIlliquidity—the inability to sell a loan quickly—varies among private debt categories. Among leveraged loans, broadly syndicated loans are frequently traded and more liquid. Illiquidity increases for middle market loans, direct “club” loans, and mezzanine debt because they are infrequently traded. Less liquid loans offer higher yields in the form of an “illiquidity premium” attractive to investors for whom liquidity is a lower priority.
Interest-rate riskRisks related to changes in prevailing interest rates vary depending on loan category. Leveraged loans have floating rates that vary based on changes in the underlying base rate, such as LIBOR,15 allowing investors to earn higher coupons as rates rise. Their floating rates imply a lower duration and less risk of loan values being hurt by rising rates. In contrast, mezzanine debt carries fixed rates that subject the loan’s value to greater risk if rates rise.
Conclusions
W Private debt has emerged as an asset class with potential to improve portfolio risk-adjusted returns by offering higher yields in exchange for illiquidity, better diversification, and lower volatility. Institutional investors who are less concerned about liquidity have the potential to earn above-market returns with lower risk.
W Several categories of private debt historically have offered particularly attractive risk-return characteristics, including middle market direct loans and mezzanine debt. With track records offering higher yields and lower default and loss rates, they can serve as alternatives for traditional asset classes, including public corporate and high-yield bonds, and equity.
W Investing in private debt—a complex market lacking transparency—requires due diligence in selecting managers with specialized expertise, a network of industry relationships, and a track record of success in developing diversified private loan portfolios.
Less liquid private debt can offer lower credit risk than yield spreads would suggest due to tighter loan covenants and oversight that reduce default risk and improve recovery rates.
Private debt: The opportunity for diversification with illiquid assets.
For Institutional Investor Use Only 12
Appendix A: Investment grade private placement debt
Private placements represent a distinct category of loans that historically have offered higher yields and lower default risk than traditional fixed-income investments. These loans have a fixed coupon rate and term structure like traditional bonds, but enjoy additional protection through borrower covenants and monitoring. With investment-grade ratings of BBB- or higher, private placement loans are available only to qualified institutional buyers, such as pension plans and insurance companies. Borrowers may choose to issue private placements to take advantage of more flexible financing terms or to keep financial details confidential since no SEC registration is required. When large companies issue both public and private debt, investors may choose the stronger protection offered by private placement loans.
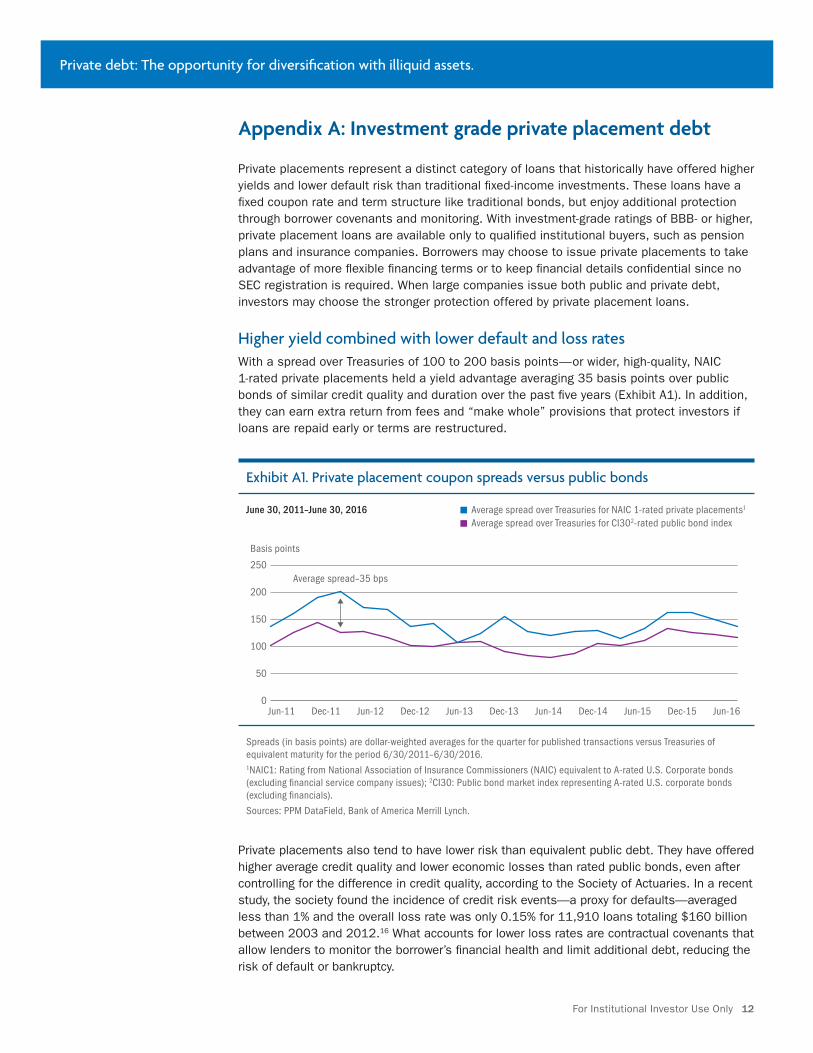
Higher yield combined with lower default and loss ratesWith a spread over Treasuries of 100 to 200 basis points—or wider, high-quality, NAIC 1-rated private placements held a yield advantage averaging 35 basis points over public bonds of similar credit quality and duration over the past five years (Exhibit A1). In addition, they can earn extra return from fees and “make whole” provisions that protect investors if loans are repaid early or terms are restructured.
Exhibit A1. Private placement coupon spreads versus public bonds
June 30, 2011–June 30, 2016 W Average spread over Treasuries for NAIC 1-rated private placements1 W Average spread over Treasuries for CI302-rated public bond index
Spreads (in basis points) are dollar-weighted averages for the quarter for published transactions versus Treasuries of equivalent maturity for the period 6/30/2011–6/30/2016.1NAIC1: Rating from National Association of Insurance Commissioners (NAIC) equivalent to A-rated U.S. Corporate bonds (excluding financial service company issues); 2CI30: Public bond market index representing A-rated U.S. corporate bonds (excluding financials).
Sources: PPM DataField, Bank of America Merrill Lynch.
Private placements also tend to have lower risk than equivalent public debt. They have offered higher average credit quality and lower economic losses than rated public bonds, even after controlling for the difference in credit quality, according to the Society of Actuaries. In a recent study, the society found the incidence of credit risk events—a proxy for defaults—averaged less than 1% and the overall loss rate was only 0.15% for 11,910 loans totaling $160 billion between 2003 and 2012.16 What accounts for lower loss rates are contractual covenants that allow lenders to monitor the borrower’s financial health and limit additional debt, reducing the risk of default or bankruptcy.
Jun-16Dec-15Jun-15Dec-14Jun-14Dec-13Jun-13Dec-12Jun-12Dec-11Jun-110
50
100
200
150
250Average spread–35 bps
Basis points

Private debt: The opportunity for diversification with illiquid assets.
For Institutional Investor Use Only 13
Private placements deals are large—ranging from $20 million to over $1 billion—with high required investment minimums that reduce liquidity, although an active private secondary market can allow investors to sell if necessary. Maturities longer than bank loans make them attractive to institutions, such as insurance companies, with long-term liabilities. Terms are typically 7 to 10 years, but can range from 5 years to more than 30 years.
Overall, private placements offer opportunity to improve the risk-adjusted returns of traditional fixed-income assets, particularly for investors with stable value objectives and limited liquidity needs.
Appendix B: What is private debt?
Private debt encompasses mostly non-investment-grade loans ranging across the capital structure and credit risk spectrum. Categories include leveraged loans, which can be syndicated by banks or issued directly by small investor groups or “clubs,” distressed debt, mezzanine debt/second liens, special situations, and venture debt. Borrowers are mostly private companies or small- to mid-sized public companies requiring capital for leveraged buyouts, acquisitions, balance sheet recapitalization, and organic growth.
A growing niche in fixed incomePrivate debt is a small but growing niche in fixed income, compared to the $40 trillion publicly traded U.S. bond market, including $8 trillion in corporate bonds outstanding.17 Although there are no reliable estimates of overall market size, figures are available for different segments. Private debt assets in closed-end funds spanning five categories, including direct lending and mezzanine, totaled $561 billion as of December 31, 201518 (Exhibit B1). Leveraged loans syndicated by banks are a separate category—the portion tracked in the S&P/LSTA Leveraged Loan Index totaled $886 billion as of June 30, 2016. Total size of the leveraged loan market is likely much larger. Thomson Reuters LPC estimated that $783 billion in syndicated bank loans were issued in 2015 alone, including $143 billion in the middle market and nearly $4 billion in mezzanine debt.
Exhibit B1. Private debt assets under management by category1
$ Billions as of 12/31/2015
Total AUM: $561 billion
$137B
$207B
$133B
$74B$10B W Direct Lending
W Distressed Debt
W Mezzanine
W Special Situations
W Venture Debt
1Includes only closed-end fund assets tracked by Preqin. Source: Preqin Private Debt Research, 2016.
Private debt: The opportunity for diversification with illiquid assets.
For Institutional Investor Use Only 14
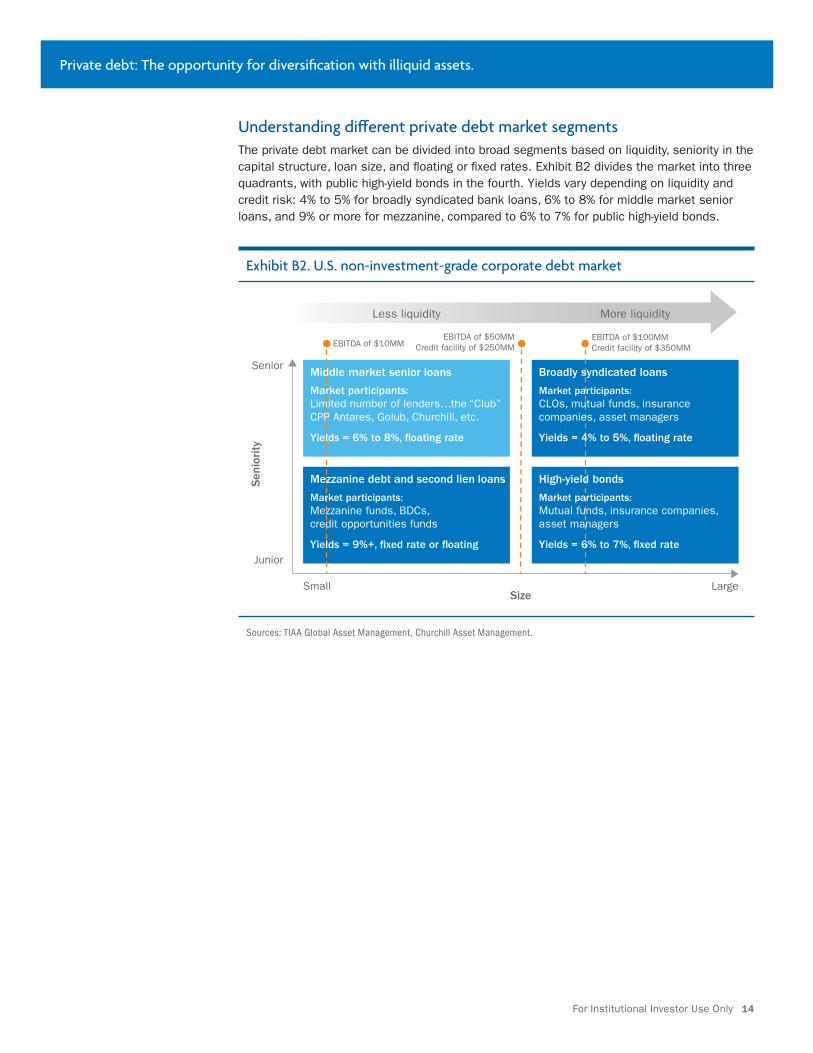
Understanding different private debt market segmentsThe private debt market can be divided into broad segments based on liquidity, seniority in the capital structure, loan size, and floating or fixed rates. Exhibit B2 divides the market into three quadrants, with public high-yield bonds in the fourth. Yields vary depending on liquidity and credit risk: 4% to 5% for broadly syndicated bank loans, 6% to 8% for middle market senior loans, and 9% or more for mezzanine, compared to 6% to 7% for public high-yield bonds.
Exhibit B2. U.S. non-investment-grade corporate debt market
Sources: TIAA Global Asset Management, Churchill Asset Management.
Senior
Junior
SmallSize
Large
Sen
iori
ty
Less liquidity More liquidity
EBITDA of $10MMEBITDA of $50MM
Credit facility of $250MMEBITDA of $100MMCredit facility of $350MM
Middle market senior loans
Market participants: Limited number of lenders…the “Club”CPP Antares, Golub, Churchill, etc.
Yields = 6% to 8%, �oating rate
Broadly syndicated loans
Market participants: CLOs, mutual funds, insurance companies, asset managers
Yields = 4% to 5%, �oating rate
Mezzanine debt and second lien loans
Market participants: Mezzanine funds, BDCs, credit opportunities funds
Yields = 9%+, �xed rate or �oating
High-yield bonds
Market participants: Mutual funds, insurance companies, asset managers
Yields = 6% to 7%, �xed rate

Private debt: The opportunity for diversification with illiquid assets.
For Institutional Investor Use Only 15
1. “Access to Capital: How Small- and Mid-size Businesses are Funding Their Futures,” National Center for the Middle Market, Milken Institute, May 2015.
2. Preqin Private Debt Research, 2016. Growth rates cover the period 12/31/2009 through 12/31/2015.
3. Ibid.
4. Definitions of the “middle market” vary. Thomson Reuters LPC uses a broader definition including loans of up to $500 million. S&P LCD uses a narrower definition including loans to companies with EBITDA of up to $50 million, roughly equating to loans of up to $200 million. This lower end of the middle market represented $8.3 billion in loans outstanding within the S&P/LSTA Leveraged Loan Index as of June 30, 2016.
5. S&P/LSTA Leveraged Loan Index as of June 30, 2016.
6. Earnings before interest, tax, depreciation and amortization (EBITDA) is a measure of a company’s operating performance.
7. Thomson Reuters LPC Middle Market Review, June 30, 2016: “Non-sponsored and sponsored estimated maturities through 2020.”
8. Ibid.
9. Preqin, “Q2 2016 Fundraising Update.”
10. Towers Watson, Perspectives: “Alternative Credit: Credit for the modern investor, 2015.”
11. S&P/LSTA Leveraged Loan Index includes broadly syndicated loans—mostly large loans greater than $200 million and a smaller portion of syndicated middle market loans of $200 million or less. The index was used as a proxy for larger, broadly syndicated loans, while middle market loan data represents only smaller loans in the index.
12. Cambridge Associates, Private Investment Benchmarks: Mezzanine debt index of quarterly internal rate of return (IRR).
13. The comparison is based on yield to maturity as of June 30, 2016. Middle market loans represent loans of $200 million or less and broadly syndicated loans represent loans greater than $200 million, based on the S&P/LSTA Leveraged Loan Index.
14. Preqin Private Debt Research, 2016.
15. The London Interbank Offered Rate (LIBOR) is the average estimated rate that leading banks in London would charge for short-term inter-bank loans. It is a primary benchmark for short-term interest rates globally.
16. Society of Actuaries, January 2016, “2003–2012 Credit Risk Loss Experience Study: Private Placement Bonds.”
17. The Securities Industry and Financial Markets Association (SIFMA), “U.S. Research Quarterly, Q1 2016.”
18. Preqin Private Debt Research, 2016.
The material is for informational purposes only and should not be regarded as a recommendation or an offer to buy or sell any product or service to which this information may relate. Certain products and services may not be available to all entities or persons. Past performance does not guarantee future results.
Investment, insurance and annuity products are not FDIC insured, are not bank guaranteed, are not bank deposits, are not insured by any federal government agency, are not a condition to any banking service or activity, and may lose value.
Investment products may be subject to market and other risk factors. See the applicable product literature, or visit TIAA.org for details.Please note investments in private debt, including leveraged loans, middle market loans, and mezzanine debt, are subject to various risk factors, including credit risk, liquidity risk and interest rate risk.
Churchill Asset Management is a registered investment advisor and majority-owned, indirect subsidiary of Teachers Insurance and Annuity Association of America.
TIAA Global Asset Management provides investment advice and portfolio management services through TIAA and over a dozen affiliated registered investment advisers.

©2016 Teachers Insurance and Annuity Association of America-College Retirement Equities Fund, 730 Third Avenue, New York, NY 10017
For Institutional Investor Use Only.
C33271 536920_700205A15532 (09/16)
Private debt: The opportunity for diversification with illiquid assets.