private wage effects of a large public sector wage increase. the case of hungary Álmos telegdy...
TRANSCRIPT

Private Wage Effects of a Large Public Sector Wage Increase. The Case of Hungary
ÁLMOS TELEGDYInstitute of Economics – HASCentral European University

Motivation: are there public-private wage spillovers?•Very few studies analyzing the interaction of wages
between the private and public sectors (Jacobsen, 1991)•Very hard to identify such effects▫Public and private sectors are typically composed of
diverse industries▫Co-movement of wages of similar workers▫Working hours, tasks, effort can be different▫Self-selection of workers across the sectors
•Without some external movement of wages, only correlations can be established

Motivation of corporations
•Spillovers may exist if ▫Wages are high in the public sector▫Workers are mobile across sectors
•Private sector employers may increase wages to prevent workers from moving▫Even if workers do not move: threat effects

This study
• In September 2002 all public employees’ wages increased ▫Large increase (50 percent)▫Sudden (from one day to another)
•This external shock can help identifying the spillover effect ▫Get rid of the co-movement of wages▫Time span quite short, may assume that there are no
large changes in emploment composition (unobservable)

Wage Policies in Hungary
•Private sector▫Decentralized wage bargaining▫Mostly weak unions
•Public sector▫Wage grid establishing minimum wages by types of
workers▫Wages can deviate from the grid if the institution wants
so and has funding
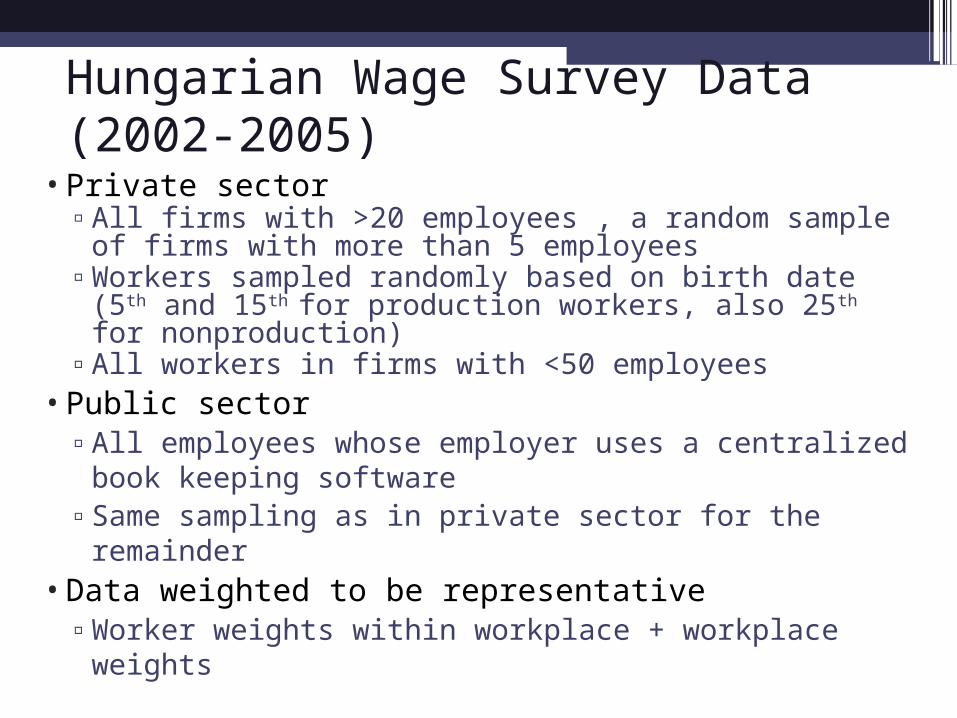
Hungarian Wage Survey Data (2002-2005)
•Private sector▫All firms with >20 employees , a random sample of firms
with more than 5 employees▫Workers sampled randomly based on birth date (5th and
15th for production workers, also 25th for nonproduction)▫All workers in firms with <50 employees
•Public sector▫All employees whose employer uses a centralized book
keeping software▫Same sampling as in private sector for the remainder
•Data weighted to be representative▫Worker weights within workplace + workplace weights
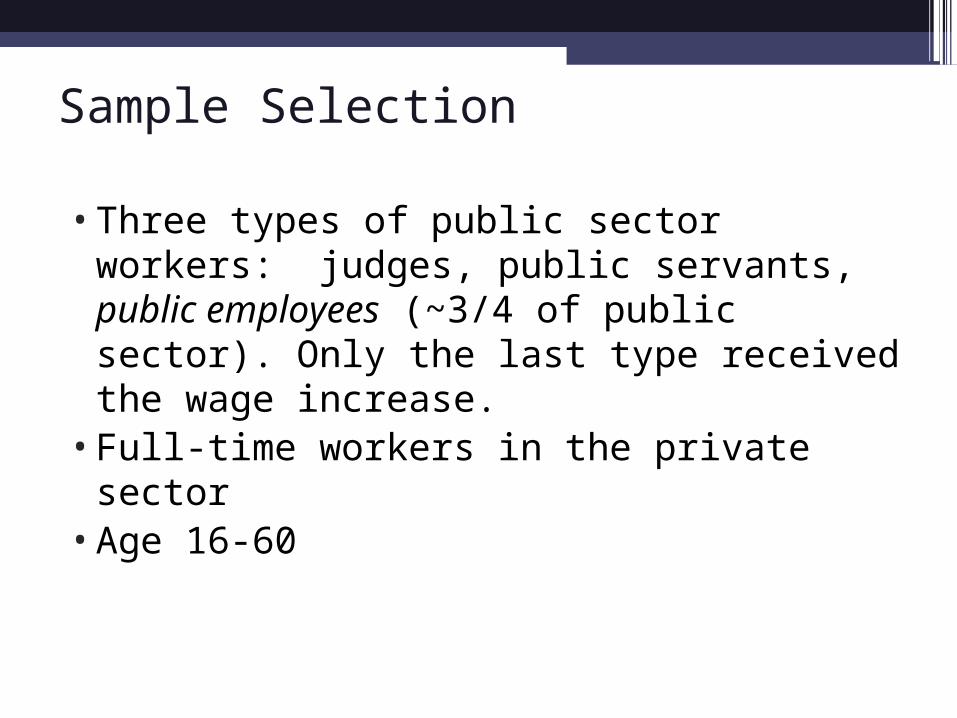
Sample Selection
•Three types of public sector workers: judges, public servants, public employees (~3/4 of public sector). Only the last type received the wage increase.
•Full-time workers in the private sector•Age 16-60
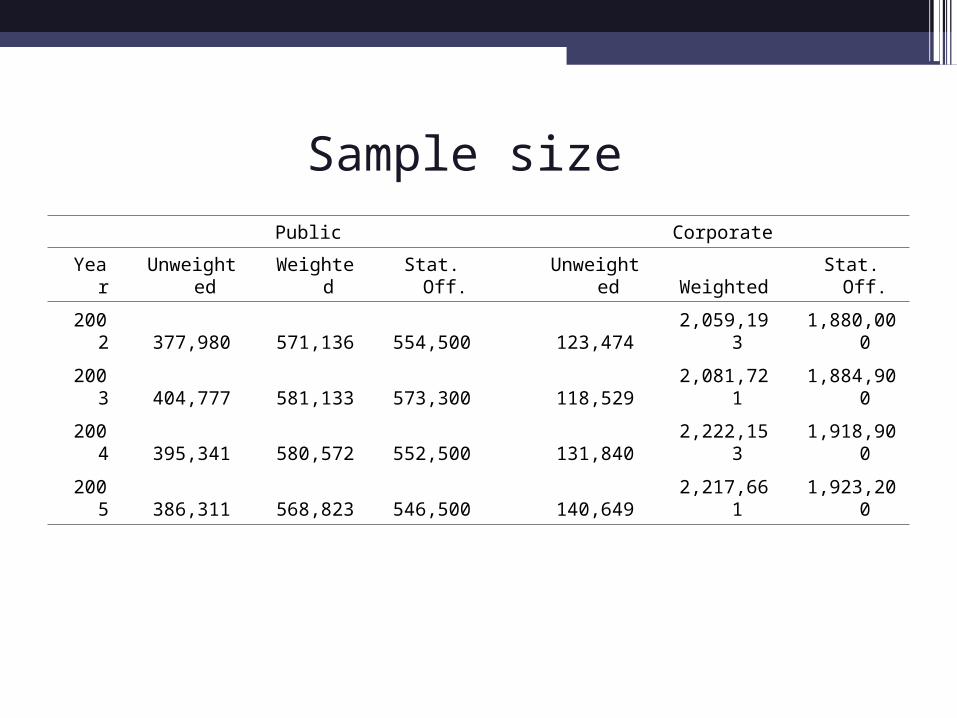
Sample size Public Corporate
Year Unweighted Weighted Stat. Off. Unweighted Weighted Stat. Off.
2002 377,980 571,136 554,500 123,474 2,059,193 1,880,000
2003 404,777 581,133 573,300 118,529 2,081,721 1,884,900
2004 395,341 580,572 552,500 131,840 2,222,153 1,918,900
2005 386,311 568,823 546,500 140,649 2,217,661 1,923,200
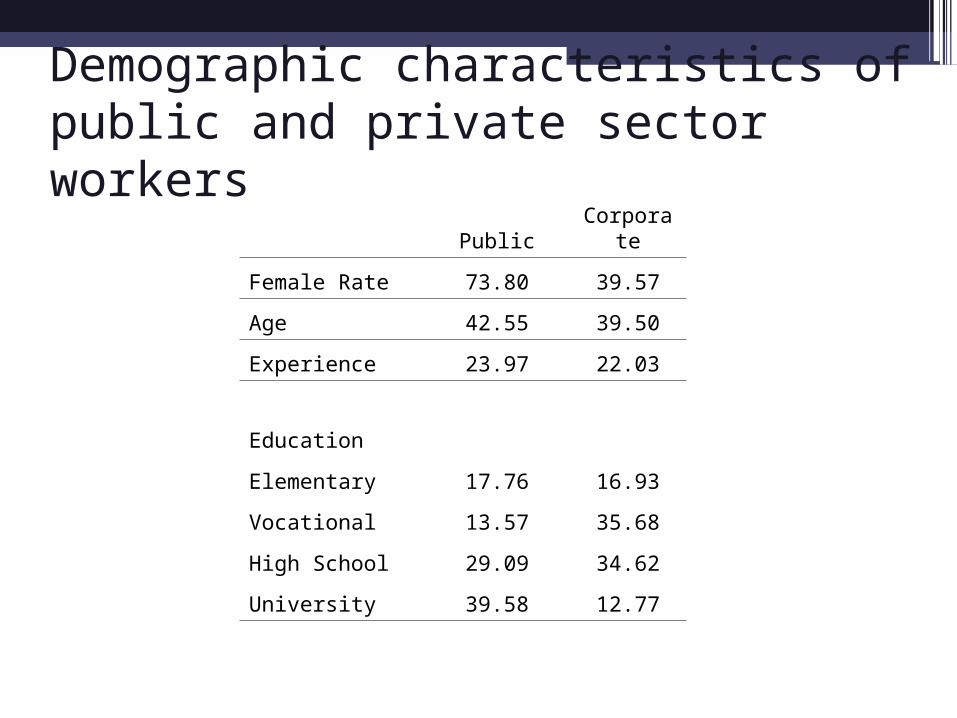
Demographic characteristics of public and private sector workers
Public Corporate
Female Rate 73.80 39.57
Age 42.55 39.50
Experience 23.97 22.03
Education
Elementary 17.76 16.93
Vocational 13.57 35.68
High School 29.09 34.62
University 39.58 12.77
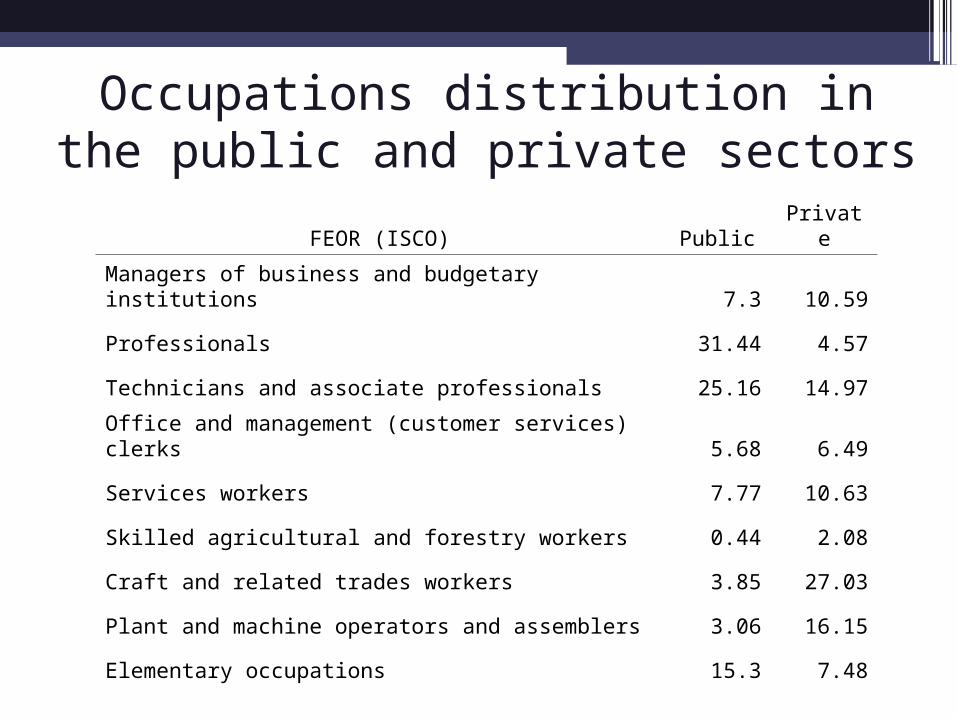
Occupations distribution in the public and private sectors
FEOR (ISCO) Public Private
Managers of business and budgetary institutions 7.3 10.59
Professionals 31.44 4.57
Technicians and associate professionals 25.16 14.97
Office and management (customer services) clerks 5.68 6.49
Services workers 7.77 10.63
Skilled agricultural and forestry workers 0.44 2.08
Craft and related trades workers 3.85 27.03
Plant and machine operators and assemblers 3.06 16.15
Elementary occupations 15.3 7.48

Earnings
•Monthly, from May▫Base salary▫Overtime▫Regular bonuses and premia, commissions, allowances…▫Extraordinary bonuses based on previous year’s records
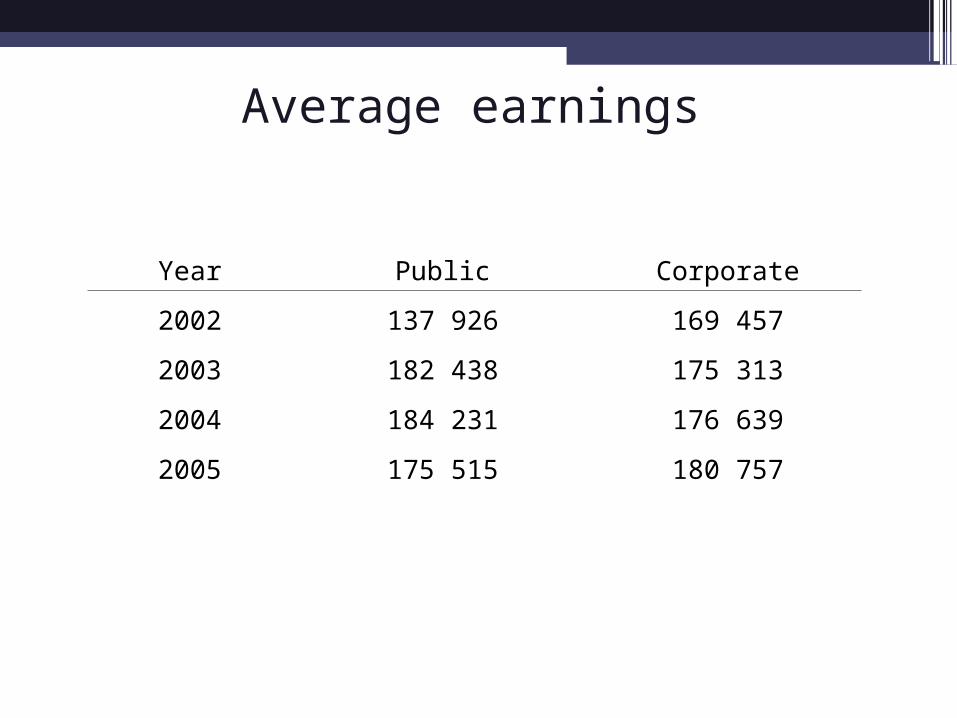
Average earnings
Year Public Corporate
2002 137 926 169 457
2003 182 438 175 313
2004 184 231 176 639
2005 175 515 180 757
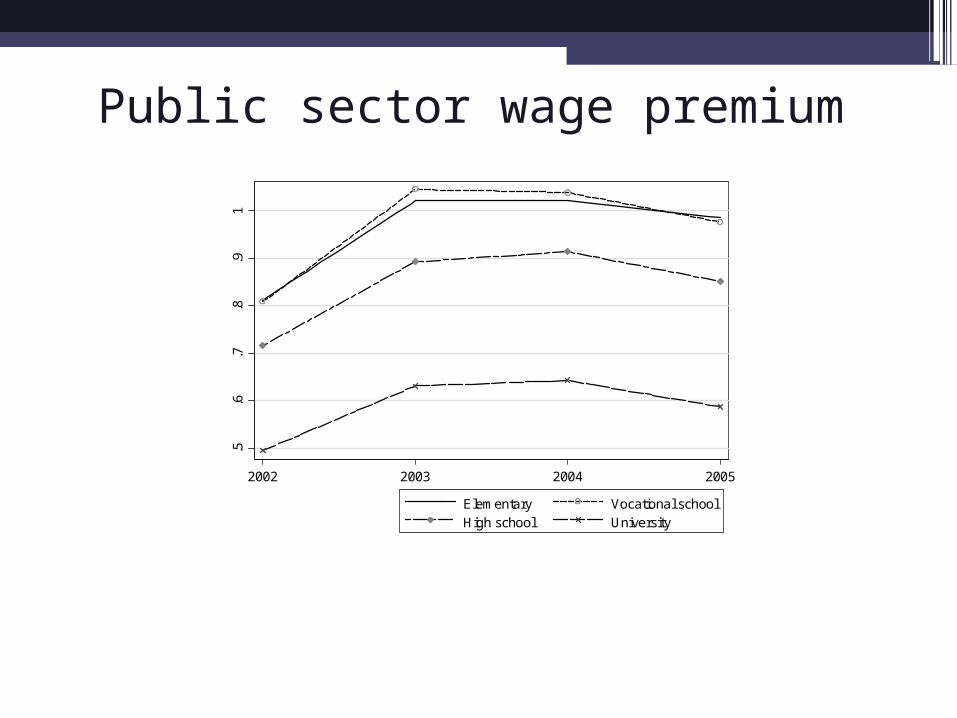
Public sector wage premium
.5.6
.7.8
.91
2002 2003 2004 2005
Elementary Vocational schoolHigh school University

Public sector wage premium from Mincer equation
-.3
-.2
-.1
0.1
.2
2002 2003 2004 2005
Elementary Vocational schoolHigh school University
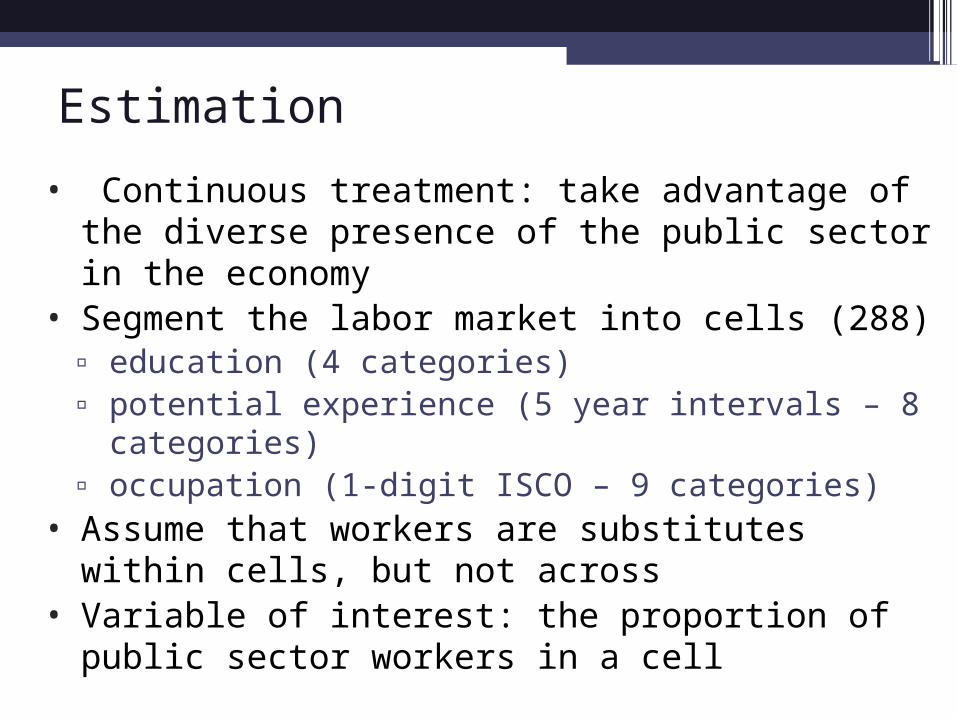
Estimation
• Continuous treatment: take advantage of the diverse presence of the public sector in the economy
• Segment the labor market into cells (288)▫ education (4 categories)▫ potential experience (5 year intervals – 8 categories)▫ occupation (1-digit ISCO – 9 categories)
• Assume that workers are substitutes within cells, but not across
• Variable of interest: the proportion of public sector workers in a cell

Share of public sector in the economy
Year Share Std. Dev. Min Max
2002 0.213 0.203 0.003 0.982
2003 0.213 0.201 0.003 0.858
2004 0.202 0.195 0.003 0.783
2005 0.200 0.196 0.001 0.735

Estimation equation
Use corporate sector employmentMincer equation, augmented by public share:
lnwij = α0 + α1PUBLICj + Σα2kEDUCki + α3Expi + α4Expi 2 +
Σα5lOCCli + α6FEMALEi +Σα7mCOUNTYmi + Σα8tYEARt + εi
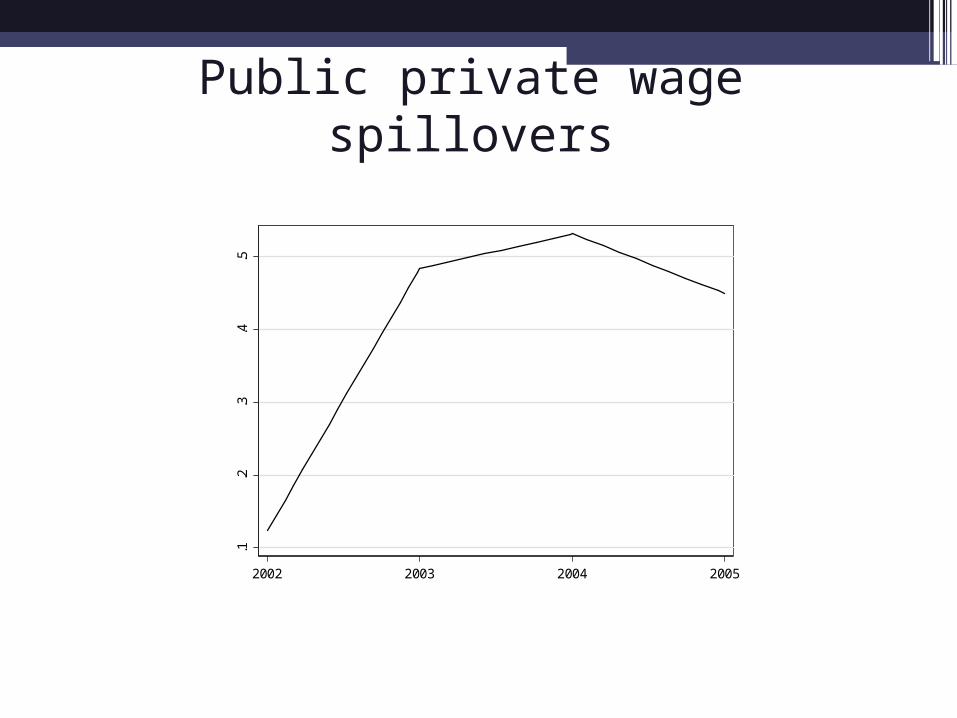
Public private wage spillovers
.1.2
.3.4
.5
2002 2003 2004 2005
Estimation by subgroups
• Some groups are more likely to be affected by the wage increase▫ High proportion of females in the public sector▫ Young workers more mobile

Spillovers by gender.2
5.3
.35
.4.4
5
2002 2003 2004 2005
Male Female

Spillovers by age.2
.3.4
.5.6
2002 2003 2004 2005
Workers over 35 Workers under 35
Other wage effects
• Large minimum wage increase: 100 percent in 1999-2001. If this affected the two sectors differently, it may bias the results.▫ Do the estimations separately for educational groups
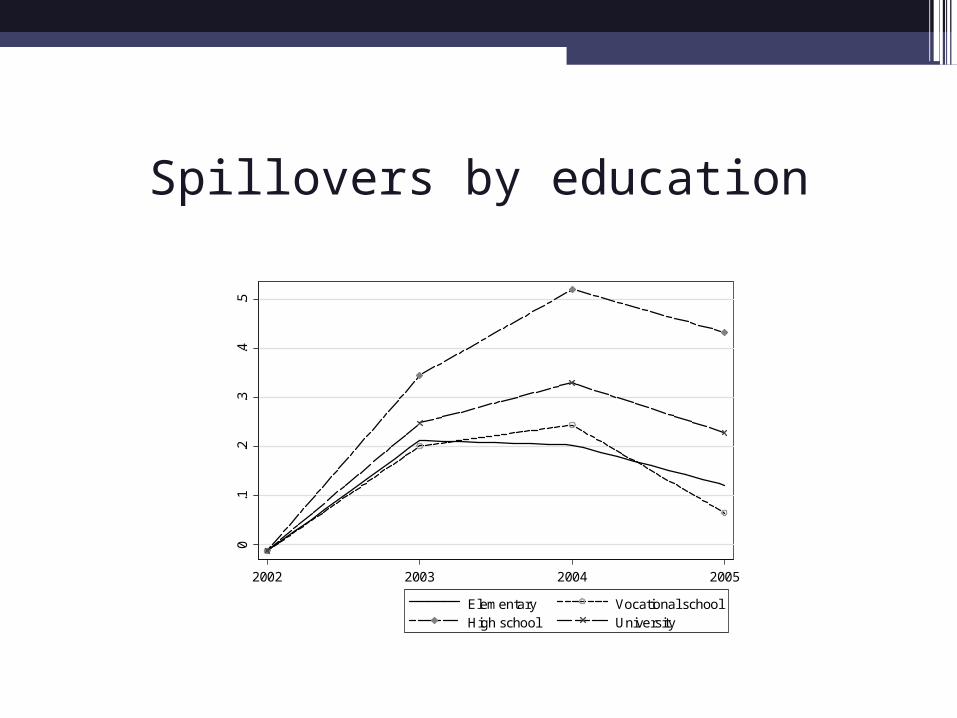
Spillovers by education0
.1.2
.3.4
.5
2002 2003 2004 2005
Elementary Vocational schoolHigh school University

Conclusions
• Identification of public wage spillovers from an external shock
• Wages increase for workers who are more exposed to the public sector