pro-poor service delivery and social identity
TRANSCRIPT
Copyright © UNU-WIDER 2011 * Humboldt University Berlin, e-mail: [email protected] This study has been prepared within the UNU-WIDER project on 'New Approaches to Measuring Poverty and Vulnerability', directed by Jukka Pirttilä and Markus Jäntti. UNU-WIDER gratefully acknowledges the financial contributions to the research programme by the governments of Denmark (Ministry of Foreign Affairs), Finland (Ministry for Foreign Affairs), Sweden (Swedish International Development Cooperation Agency—Sida), and the United Kingdom (Department for International Development). ISSN 1798-7237 ISBN 978-92-9230-518-5
Working Paper No. 2012/55
Pro-poor Service Delivery and Social Identity An Experimental Investigation Ulrike Mueller* May 2012
Abstract
India addressed the requirement for pro-poor service delivery in rural regions by introducing decentralization and affirmative action policies. In order to measure the social preferences of local decision makers, we conducted field experiments which simulated the selection of needy beneficiaries for welfare schemes. While potential recipients with less land were clearly favoured, decision makers also allocated resources to recipients with whom they could identify in terms of caste, gender and political party affiliation. The findings imply that the allocation of resources was not only motivated by neediness, but also by in-group favouritism. However, social identity-based preferences carry the danger of exclusion in providing rural services to the poor.
Keywords: decentralization reforms, service delivery, in-group favouritism, field experiment, India
JEL classification: C93, D30, I38, O12
The World Institute for Development Economics Research (WIDER) was established by the United Nations University (UNU) as its first research and training centre and started work in Helsinki, Finland in 1985. The Institute undertakes applied research and policy analysis on structural changes affecting the developing and transitional economies, provides a forum for the advocacy of policies leading to robust, equitable and environmentally sustainable growth, and promotes capacity strengthening and training in the field of economic and social policy making. Work is carried out by staff researchers and visiting scholars in Helsinki and through networks of collaborating scholars and institutions around the world.
www.wider.unu.edu [email protected]
UNU World Institute for Development Economics Research (UNU-WIDER) Katajanokanlaituri 6 B, 00160 Helsinki, Finland Typescript prepared by Anne Ruohonen at UNU-WIDER The views expressed in this publication are those of the author(s). Publication does not imply endorsement by the Institute or the United Nations University, nor by the programme/project sponsors, of any of the views expressed.
Acknowledgements
This study was conducted within the framework of the multi-country research project ‘Making Rural Services Work for the Poor: the Role of Rural Institutions and their Governance for Agriculture-Led Development’, jointly coordinated by the International Food Policy Research Institute (IFPRI) and Humboldt University Berlin. The primary fieldwork would not have been possible without the immense support and commitment of local research assistants from the Osmania University Hyderabad and the University of Agricultural Sciences Bangalore. The research project was funded by the German Federal Ministry for Economic Cooperation and Development (BMZ), which is gratefully acknowledged.

1
1 Introduction
A major concern in achieving the Millennium Development Goals (MDGs) is the effective provision of services, such as drinking water, education and health, to the poor. Consequently, the question of how services in developing countries are allocated by the public sector has received increasing attention (e.g., World Bank 2004; Keefer and Khemani 2005). Like many other developing countries, India addressed the requirement for pro-poor service delivery in rural areas by promoting decentralized government structures. In 1992, a series of constitutional reforms were passed to revitalize India’s rural local bodies—the so called Panchayati Raj Institutions.1 At the same time, affirmative action policies were introduced in order to integrate members from historically disadvantaged caste groups and women in local decision-making processes.
The main theoretical argument in favour of decentralized governance modes is that local government representatives are more efficient to provide local public goods and are better able to match services with individual preferences (Prud’homme 1995). However, besides the advantages that decentralization offers, the process of service delivery at the local level can be associated with considerable risks. If economic and political power is concentrated in the hands of elites, the delegation of distributional tasks to local representatives may increase the potential for rent-seeking and social exclusion, hence deepening rather than reducing inequalities (Bardhan and Mookherjee 2000; Bardhan 2002).
Various social preferences, such as distributive justice, altruism, inequity aversion, trust and reciprocity underlie the exchange relationship of providing services to the poor (Cárdenas et al. 2009). Against this backdrop, we conducted a lab-in-the-field experiment in rural India to analyze how resources are allocated to needy villagers. Participants for the experiment were recruited based on a stratified random sample that comprised local government representatives and villagers from the federal state of Andhra Pradesh. In a variant of the distributive dictator game (Cárdenas and Sethi 2010) participants were asked to rank a set of five potential beneficiaries based on selected socio-economic characteristics. Potential recipients that were ranked ahead had a greater likelihood of obtaining monetary benefits relative to those that were ranked behind. We estimated the effects of ranker and recipient characteristics on distributive outcomes based on a random utility model.
The experimental findings show that villagers, who owned less land, generally received more favourable treatments from rankers. However, when used in combination with the socio-economic characteristics of rankers, the analysis suggests that in-group favouritism based on gender, political party and caste identity motivated the decision-making behaviour in the ranking task.
1 Panchayat literally means assembly (yat) of five (panch), and Raj refers to governance.

2
2 Decentralized service delivery in India: empirical evidence2
The Indian Constitution (73rd Amendment) Act (1992) mandated the establishment of a uniform three-tier structure of local government comprising councils at village, intermediate and district level. With the introduction of democratic decentralization, these sub-national units of government have been strengthened in terms of political, administrative and fiscal power. The members of the local bodies are responsible for making decisions on a range of rural services and are answerable to their electorates. Apart from the provision of local public goods (e.g., village roads, street lights, drainage, drinking water facilities), they also select eligible villagers for anti-poverty programmes that deliver private benefits (e.g., ration cards, agricultural machinery, housing subsidies). One of the major aims to introduce decentralized government arrangements in India was to bring decision-making closer to the end users in the hope that this would improve service delivery in terms of access and quality.
In the wake of decentralization reforms, the Indian government also adopted affirmative action policies. As a result, seats in local councils are reserved for historically disadvantaged groups according to their population ratio at each administrative level.3 In addition, at least one third of the seats have to be reserved for female council members. The affirmative action policies are expected to alter the distribution of rural services in favour of these non-elite groups.
Empirical analyses of the impacts of decentralization on pro-poor outcomes are still in their infancy, mostly due to a lack of adequate data and proper counterfactuals. It is difficult to draw conclusions as many of the studies are largely descriptive and often indicate correlations rather than causal processes (Bardhan 2005). However, several studies were conducted in India to assess whether giving more voice to the poor effectively results in a more favourable allocation of resources.
In their study on pro-poor targeting of local governments in West Bengal, Bardhan and Mookherjee (2006) observe that villages with an increase in the proportion of poor belonging to scheduled castes or scheduled tribes receive significantly less resources. This may be due to the political discretion of elected officials at higher government levels and varying bargaining strengths of village representatives. In a similar vein, Palaniswamy and Krishnan (2008) find that the inter-village allocation of public good resources in Karnataka is skewed towards villages represented by the politically dominant castes. Female local government representatives, who belong to scheduled castes, receive significantly fewer resources compared to all other women, and compared to men belonging to disadvantaged social groups. The authors conclude that female council members have differential bargaining abilities, which in turn depend on their caste identities.
2 As a comprehensive review of the literature is beyond the scope of this paper, we focus on selected key studies. 3 The Indian constitution defines a schedule of tribes and castes that have been economically and socially disadvantaged. Listed groups are entitled to special protection and positive discrimination through reservations.
3
Chattopadhyay and Duflo (2004) conducted a quantitative study on the impact of reserved seats for women in local councils on the investment in publicly provided goods. Their results indicate that female decision makers in Rajasthan and West Bengal allocate more resources to pro-women services, such as drinking water facilities.4 In south India, it turned out that households from scheduled castes or scheduled tribes benefit more from services when the village council leader shares their group identity (Besley et al. 2004).
While most of the previously reviewed studies focus on gender and caste identity, still little is known about the role of political parties in service provision (World Bank and IFPRI 2010). Yet there exists anecdotal evidence that public goods in Kerala are allocated to villagers who are faithful to the dominant political party (Chathukulam and John 2000). A recent study on southern Indian states indicates that the political party affiliation of villagers has an effect on whether they obtain benefits from poverty alleviation programmes (Markussen 2011). Taken together, the empirical evidence suggests that the social identity of actors influences local institutions to determine the allocation of public resources and the welfare of the poor. However, how exactly multiple identities interact with each other and how these social categories jointly affect distributive decision-making in Indian villages remains an open question.
3 Theoretical motivation
Several researchers highlighted the need to employ a behavioural economics perspective to better understand local actors’ decision-making processes in developing countries (e.g., Bertrand et al. 2004; Duflo 2006; Mullainathan 2005). Such approaches move beyond the model of Homo economicus by acknowledging the fact that, apart from narrow self-interest, various other-regarding preferences influence human behaviour (e.g., Bénabou and Tirole 2006; Ellingsen and Johannesson 2008; Basu 2010). It has also been shown that group identity is an important factor in shaping social preferences (Chen and Li 2009).
3.1 In-group favouritism
Social identity can be defined as ‘that part of an individual's self-concept which derives from his knowledge of his membership of a social group (or groups) together with the value and emotional significance attached to that membership’ (Tajfel 1981: 255). Social categorization processes put people into different categories by labelling them according to some characteristics they possess. Social identity theory (Tajfel and Turner 1979) asserts that members of one group compare their group (in-group) with other groups (out-group) in ways that favour the in-group at the expense of the out-group. This in-group favouritism leads people to behave differently towards the members of their own group compared to those in other groups, even when these groups are
4 However, recent studies show that female local council leaders do not perform any differently compared to their male counterparts when it comes to public goods provision (Ban and Rao 2008; Gajwani and Zhang 2008).

4
artificially created in the lab and when there is no competition for resources between groups (Hogg and Abrams 1988).
In economic analysis, however, the notion of identity has been acknowledged only recently. Akerlof and Kranton (2000, 2010) develop a neoclassical utility function with identity as a motivation for behaviour. In their model, identity relates to different social categories that trigger expectations about norm-conforming behaviour. Consequently, non-compliance with the expected behaviour leads to disutility. They draw on the identity model to explain empirical phenomena in the domains of gender discrimination, the economics of exclusion and poverty (Akerlof and Kranton 2000), the economics of education (Akerlof and Kranton 2002) and contract theory (Akerlof and Kranton 2005).
In the context of service provision in India, the argument of social identity-based in-group favouritism means that local government representatives may attach positive utility to the welfare of beneficiaries who are in-group members but no utility (or negative utility) to the welfare of beneficiaries who are out-group members. In other words, decision makers may have a tendency to allocate resources to those with whom they can identify.
3.2 Multiple social identities
People have got several social identities which may become salient at the same time (Crisp and Hewstone 2006; LeBoeuf et al. 2010). The phenomenon of crossed categorization occurs if persons differ with regard to one social identity category (out-group members) but are similar in another social identity dimension (in-group members). Crossed categorization can produce different outcomes of observed inter-group bias (Crisp et al. 2001). It has been suggested that prejudices and discrimination, pertaining to one of the involved identity dimensions, can be potentially reduced by crossing social categories.
Crossed social categorizations in real-life situations can result in more complex patterns. Studies in the Asian context provide some interesting insights in this regard, since it was found that one of several social identity categories may dominate. For instance, Hewstone et al. (1993) investigated the effects of religion (Muslim and Hindu), nationality (Bangladeshi and Indian) and language (Bengali and Hindi) on evaluation and perceived variability. Persons that were perceived of having the same religion were always rated positively. But, individuals, who did not share the same religion, were evaluated negatively, even if they had the same nationality or spoke the same language. In a similar vein, Hagendoorn and Henke (1991) conducted research in northern India on groups that differed in religion, caste and social status. Their results indicate that religion is again a very strong social identity category which tends to accentuate, rather than overcome, inter-group bias. Thus, the importance of social categories and their cross-cutting effects seem to be highly context-dependent.
5
4 Tapping social identity-based preferences with experimental methods
Typically, issues of discrimination have been investigated with regard to labour, housing and credit markets (Cárdenas et al. 2009). As it is difficult to infer discrimination from survey data, several researchers have employed experimental approaches to explore how individuals may be treated unequally in a way that is related to observable characteristics, such as ethnicity or gender. In the following, we review experimental studies that tested the discriminatory effects of social identity in different non-market economic situations.5
In order to evaluate altruistic behaviour, to measure perceptions of fairness in the allocation of resources and to reveal ‘tastes for discrimination’ (Becker 1957), the dictator game has frequently been used.6 In standard dictator games, player A (dictator) receives a certain amount of money and is then asked to divide this endowment between herself and player B (recipient). If player A is motivated by narrow self-interest, she should keep all the money for herself and allocate nothing to player B. However, Forsythe et al. (1994) found that 70 per cent of the dictators deviate from the predicted Nash equilibrium of donating zero, but leave the recipient with on average 24 per cent of the total endowment. Similar results have been observed in many different dictator game settings.7
There are at least three sources of information which may influence the decision-making process in dictator games (Aguiar et al. 2008: 344): ‘i) information related to the dictator herself, i.e., whether or not the decision is observed by others; ii) information the dictator receives about the recipient; and iii) information derived from the game framing and the language used in the instructions’. The second source of information has often been manipulated by disclosing the identity of recipients in order to measure its effect on allocation decisions. For instance, it was observed that merely revealing the names of recipients generally increases giving in dictator games (Charness and Gneezy 2008).
The introduction of players’ names has been employed in behavioural games in order to make ethnicity salient. Fershtman and Gneezy (2001) conducted dictator games with Eastern Jews and Ashkenazi Jews in Israel, in which the surnames of the players were revealed to convey information about origin. However, the researchers did not find any significant differences in the average offers made to members of these different ethnic groups in Israel. Following a similar experimental design, van der Merwe and Burns (2008) observed that disclosing of the racial identity among students in South Africa had a significant and positive impact on the size of the offers made. White proposers exhibited in-group bias, making significantly higher offers to White partners, while
5 During the last decade, experimental approaches have been increasingly applied to research questions in the field of development economics. See Cárdenas and Carpenter (2008); and Cárdenas (2009) for excellent reviews. Experimental methods have been proven particularly useful to study policy reforms, political economy issues and behavioural dimensions of distributive decisions (Cason and Mui 2003; Humphreys and Weinstein 2009; D’Exelle and Riedl 2008). 6 Kahneman, Knetsch and Thaler (1986) implemented some of the first dictator games. 7 Camerer (2003) provides an overview of key findings from dictator games.

6
Black participants did not vary their offers based on the racial identity of their partners. In their dictator game with third-party punishment, Bernhard et al. (2006) examined the effect of group affiliation on altruism and norm enforcement among two small, native groups from Papua New Guinea. In this modified dictator game there were three players—A (dictator), B (recipient), and C (third party)—where the latter participant could take costly actions to punish the dictator. The results showed that third parties exhibited stronger altruism towards in-group victims (recipients getting less than half of the endowment) and indulged in-group norm violators (dictators choosing to keep more than half of the money for themselves).
Recently, issues of discrimination have also been studied in the domain of public good provision. Habyarimana et al. (2007) implemented a set of experimental games in an urban slum of Uganda to study the effects of ethnic diversity on public good provision. Amongst others, they conducted a variant of the dictator game, in which an anonymous dictator is asked to divide money between herself and two other players. The researchers did not find any evidence that participants exhibited greater degrees of altruism toward in-group members. In other words, there was no taste for discrimination along ethnic lines. However, insights from behavioural games, in which the dictator was no longer anonymous, suggest that co-ethnics cooperated more because they adhered to in-group reciprocity norms which are based on ethnicity. Cárdenas et al. (2009) conducted a series of experimental games in Bogotá to examine pro-social behaviour among public officials who are actually in charge of service provision. Generally, women and displaced people were favoured by decision makers in the games. However, ex-combatants, street recyclers and street vendors triggered decreased pro-social behaviour from those in the role of service providers. The authors conclude that the attributes of public officials and of service recipients together influenced the allocation of resources.
We close this review with experimental studies that provide insights on social identity-based behaviour in the Indian context. The Indian caste system is hereditary, hierarchical, and extremely complex. Despite political attempts to change it, caste membership is an integral part of people’s identity and still plays an important role in Indian society (e.g., Dumont 1970; Carlsson et al. 2009).8 Against this backdrop, Hoff and Pandey (2006) conducted an experimental study that involved a competition to solve mazes among school boys in rural Uttar Pradesh. No significant differences in outcomes were observed when the participants were anonymous. However, once caste membership was publicly announced prior to the games, the number of mazes solved by low caste participants decreased by 20 per cent. Apparently, social identity had an adverse effect on performance due to lost self-confidence and negative expectations of low caste individuals.9 In another study, Hoff et al. (2009) compared the behaviour of high caste and low caste participants in a third party punishment field experiment in North India. High caste compared to low caste individuals sanctioned more severely norm violations that hurt members of their community. The authors explain their results based on social identity theory which predicts lower levels of identification among
8 Many political scientists consider caste as a component of people’s ethnic identity. However, this perspective is contested. See Chandra (2006) for a discussion. 9 The phenomenon that stereotype-based expectations affect performance is known as ‘stereotype threat’ in the social psychology literature.

7
members of groups that are lower in prestige. These findings seem to be in line with insights from a study conducted in West Bengal (Carlsson et al. 2009). The researchers employed a choice experimental approach to investigate the importance of relative income within and between castes among university students. It turned out that participants derived utility through improved social identity from belonging to a caste with higher average income and status.
5 Research design
The study aims at testing the hypothesis that social identity-based preferences mediate the selection of beneficiaries for welfare schemes at the lowest tier of India’s local government system. To measure the effects of multiple social identities on the allocation of resources, an experimental research design was employed, which will be described in greater detail in the following sections.
5.1 Study area
The field study was conducted in Andhra Pradesh, which was among the first federal states to implement decentralization reforms in India. Andhra Pradesh’s long-term experience with local governance is coupled with the predominance of two major political parties, namely the Indian National Congress (INC) and the regional Telugu Desam Party (TDP).10 By and large, the caste composition in Andhra Pradesh corresponds to the social stratification in other Indian states.11 The forward castes, who do not qualify for schemes under India’s affirmative action policies, constitute about 32 per cent of the population.12 The backward classes13, the scheduled castes and scheduled tribes comprise about 36, 16 and 6 per cent of the population respectively. These groups are eligible for reservations and other positive discrimination measures by the government. Muslims and other minorities (10 per cent of the population) do not benefit from affirmative action policies.
Caste and party affiliation in Andhra Pradesh cross-cut to some extent, i.e. members of the same caste often support different parties (Suri et al. 2009). In addition, members of lower castes appear to be more vulnerable because they often lack access to important public goods (Bosher et al. 2007). Taken together, these features provide an ideal setting for our research concern. We deliberately selected Kurnool district, which is characterized by the typical caste-determined social fragmentation of Andhra Pradesh.
10 The Telangana Rashtra Samithi (TRS) is another political party, which supports the demand for a separate federal state and prevails in the Telangana region of Andhra Pradesh. 11 Apart from the scheduled castes and scheduled tribes, no data on caste groups have been collected since the 1931 census. Therefore, the estimations by Vaugier-Chatterjee (2009) are used in presenting the population percentages of different caste groups in Andhra Pradesh. 12 The forward castes include upper castes (Brahmins, Vaishyas) and intermediate castes (Kammas, Reddys, Rajus, Velamas, and Kapus). The latter caste groups have also been labeled as ‘dominant castes’ (Srinivas 1972) as they grew stronger in the political sphere while the upper castes gradually lost their power after independence. 13 In Andhra Pradesh, the term ‘backward classes’ is used, while it is more common to call these caste groups ‘other backward classes’ in other states.
8
Based on cluster sampling, we obtained six Gram Panchayats with a representative share of inhabitants that belonged to the forward caste, backward class and scheduled caste categories.14
5.2 Distributive dictator game
Following the classification outlined in Harrison and List (2004), we conducted a framed field experiment in order to explore how public resources are allocated at the community level. A variant of the distributive dictator game (Cárdenas and Sethi 2010) seemed to be particularly suitable for our research purpose, since it ‘measures preferences for distributive justice, mediated by the characteristics of the beneficiaries, including those not associated with deservedness, but rather with discrimination’ (Cárdenas et al. 2009: 47).
There are two types of participants in the distributive dictator game: i) decision makers (rankers) who allocate resources at no personal cost; and ii) potential recipients of such transfers. Resources are allocated according to the following rules. The decision makers observe information cards with selected attributes of five potential recipients. Next, decision makers are asked to rank the set of five potential beneficiaries in terms of neediness based on the given attributes on the information cards. Potential beneficiaries that are ranked ahead, have a greater likelihood of receiving a fixed monetary transfer compared to those that are ranked behind (Cárdenas and Sethi 2010).
A random number N between 1 and 5 determines the first N recipients who will actually receive the fixed payment. The remaining potential recipients do not get any benefit. Thus, potential recipients who are ranked first, receive the benefit with probability 1.00, the second ranked players get it with probability 0.80, the third with probability 0.60 and so on until the last players in the rank order who obtain the benefit with probability 0.20. As the rankers receive a fixed amount of money for the task, which is independent from any particular ranking, there is no conflict between the material self interests of rankers and particular recipients (ibid.).
In our version of the distributive dictator game, rankers comprised persons with actual local council experience and ordinary villagers. In order to determine the group of potential recipients, we identified 20 respondents in each Gram Panchayat based on a stratified random sample. The sampling of potential recipients was done one day prior to the actual implementation of the field experiment. A short socio-economic questionnaire was administered in order to create information cards with selected attributes of each respondent. The six attributes displayed on the information cards, were gender, age, occupation, land holding size, caste affiliation and political party
14 A Gram Panchayat constitutes the lowest tier of India’s local government system. It is formed on the basis of population and consists of at least one revenue village. Not all Gram Panchayats have got inhabitants that belong to the scheduled tribes and minority groups. Therefore, we did not include these population groups in the sampling strategy for selecting communities.

9
preference (see Figure 1 for an example).15 These attributes had been identified based on previous in-depth case study research in Andhra Pradesh.
Figure 1: Sample information card with English translation
Age:
Occupation:Last name:
Gender:
Party preference: Land size:
57 Male
Reddy Farmer
INC 15 acres
Source: Author's own illustration.
5.3 Experimental procedures
Based on a stratified random sample, sixty villagers were recruited in each Gram Panchayat to perform the role of decision makers. The recruitment was done step-wise, prior to each experimental session. Self-selection to participate in the experiment was not allowed, even if a person’s attributes fitted the sample frame. No family members and close neighbours of potential recipients, to whom the information cards pertained, were recruited for the experiment. On average, ten rankers took part in each experimental session. Care was taken that all experimental sessions in a Gram Panchayat were concluded in the course of one day in order to prevent that people learned about the experiment prior to their participation.
A team of Indian facilitators had been trained to conduct the experiments in the local language Telugu.16 The experimenter and field assistants were the same in all six Gram Panchayats. A lab-in-the field environment was created in schools and other suitable community buildings. Before participating in the experiment, the recruited villagers were requested to sign a consent form. Since the participants were supposed to take
15 The caste affiliations of participants were not directly mentioned in order to prevent unwanted experimenter demand effects. Instead, potential beneficiaries’ last names, which are an indirect predictor for caste, were written on the information cards. For a similar strategy, see Hoff et al. (2009). 16 The experimental protocol is available from the author on request. The instructions were inspired by those used in the original distributive dictator game. I am grateful to Rajiv Sethi and Juan Camilo Cárdenas for having shared their Spanish protocols with me.

10
their decisions in private and confidentially, they were randomly seated in separate cubicles. Communication among rankers was strictly prohibited.
Each participant received a set of five information cards, which they rank-ordered and fixed on a decision sheet. Once the ranking was completed, all decision sheets were collected by the field assistants. The experimenter randomly selected one decision sheet, which formed the basis for payment. For this purpose, a lottery was conducted by drawing a random number between 1 and 5. Consequently, the respective number of Rs. 50 banknotes was transferred to the first N potential recipients in the ranking order. Rankers were told that the actual beneficiaries will be informed of the final decision and will receive their benefit.17 After the experiment had been completed, the decision makers received a fixed payment of Rs. 80.18
A comprehensive post-experimental questionnaire was administered to all rankers in order to find out more about their behaviour in the distributive dictator game. Apart from that, attitudes towards the local government system and fairness perceptions regarding the actual distribution of public resources in every-day life were elicited.
6 Empirical model
The choices of participants in the field experiment were interpreted based on the rank-ordered logit model (ROLM). The ROLM has been employed in the economics literature (Beggs et al. 1981) building on McFadden’s (1974) conditional logit model19. While the conditional logit model fits the data by considering the most preferred choice over a set of alternatives, the ROLM exploits all rank information assuming that each rank is made as part of a sequential decision process. Like multinominal and conditional logit models, the ROLM is grounded in a random utility framework (Allison and Christakis 1994). The indirect utility function consists of two elements
(1) ,
where describes the systematic, observable component of utility, and is the stochastic element. The latter cannot be observed by the researcher.
In our specific case, a villager ranks the recipient, which gives her the highest level of utility of the five alternatives provided, as number one, then chooses the second most preferred from the remaining choices and so on. If she compares recipient j=A to recipient j=B, she will prefer recipient A to B if
(2) , such that
17 We visited all selected beneficiaries after the experiments had been completed and paid them Rs. 50. 18 80 Indian Rupees (Rs.) are equivalent to the daily wage of agricultural workers in India. 19 The ROLM has also been used in the marketing research literature (Punj and Staelin 1978; Chapman and Staelin 1982), where it is known as ‘exploded logit model’.

11
(3) . Following (1) - (3), let Uij be the random utility, which individual i derives from choosing alternative j with the deterministic component Vij and a random element .
Vij, which includes attributes of both the decision maker and the recipients in the choice set, is assumed to be a linear function of the vector Xij, such that:
(4) Vij = , where constitutes a conforming vector of parameters to be estimated.
Consider individual i’s ranking of j= 1,…, J alternatives as Ri = (r1, r2, …, rj), so that the probability of Ri can be specified using the logistic distribution (Beggs et al. 1981) as:
(5)
Based on this probability, for an independent sample of N individual decision makers, the log-likelihood function can be derived as:
(6)
From the different sets of rankings that were created by the decision makers, the average ranking obtained by each potential recipient can be calculated. In this way, it is possible to detect those characteristics which are valued more favourably by the rankers.
7 Results
7.1 Characteristics of the sample population
A total of 353 villagers participated in the distributive dictator game to perform the ranking task in the experiment. Selected characteristics of rankers are presented in Table 1. As literacy was a prerequisite in order to read the information cards, the sample of decision makers was skewed towards young and male participants. The average land holding size of rankers was 4.96 acres, which corresponds to the category of small farmers in India’s land classification system. With 59 per cent the majority of the rankers belonged to the backward classes, 28 per cent were from the scheduled castes and 13 per cent from the forward castes. Most of the rankers worked as farmers, while

12
labour work was the second highest occupation category. 65 per cent of the participants stated that they were in favour of the INC party, and 25 per cent were TDP party followers. The remaining participants had no party preference, were not willing to reveal their favourite party or were followers of some minority parties. 18 per cent of the rankers had experience as local government representatives. They had been in office as presidents, vice-presidents or ward members of local councils as a result of Andhra Pradesh’s Gram Panchayat elections in 1995, 2001, and 2006.
Table 1: Selected characteristics of decision makers (rankers) in sample (N=353)
Mean S.D. Min Max Female 0.18 0.39 0 1 Age 35.19 11.64 19 70 Land size (acres) 4.96 7.64 0 50 Farmer 0.42 0.49 0 1 Labour 0.17 0.37 0 1 Forward castes 0.13 0.34 0 1 Backward classes 0.59 0.49 0 1 Scheduled castes 0.28 0.45 0 1 INC party (self-declared) 0.65 0.48 0 1 TDP party (self-declared) 0.25 0.43 0 1 Local council members 0.18 0.39 0 1 Source: Author's calculations based on primary field data.
Table 2 shows selected characteristics of the 120 potential recipients who had provided their socio-economic profiles for producing the information cards. Since they were not supposed to take any decisions in the experiment, literacy was not compulsory for this group of villagers. Women constituted 50 per cent of the sample. With 5.86 acres, the average land holding size of recipients was slightly larger than the one of rankers. The age of recipients had a similar range as among rankers. The majority of recipients were farmers, followed by labourers. While 20 per cent were members of forward castes, 40 per cent of the recipients belonged to the scheduled castes and backward classes respectively. 67 per cent of the recipients reported to follow the INC party, while 23 per cent were in favour of the TDP party. The remaining recipients had no particular party preference. The share of INC and TDP followers among recipients was similar as among decision makers.
Table 2: Selected characteristics of potential recipients in sample (N=120)
Mean S.D. Min Max Female 0.50 0.50 0 1 Age 41.15 13.44 20 76 Land size (acres) 5.86 9.20 0 60 Farmer 0.39 0.49 0 1 Labour 0.34 0.48 0 1 Forward castes 0.20 0.40 0 1 Backward classes 0.40 0.49 0 1 Scheduled castes 0.40 0.49 0 1 INC party (self-declared) 0.67 0.47 0 1 TDP party (self-declared) 0.23 0.42 0 1 No party preference (self-declared) 0.10 0.30 0 1 Source: Author's calculations based on primary field data.
13
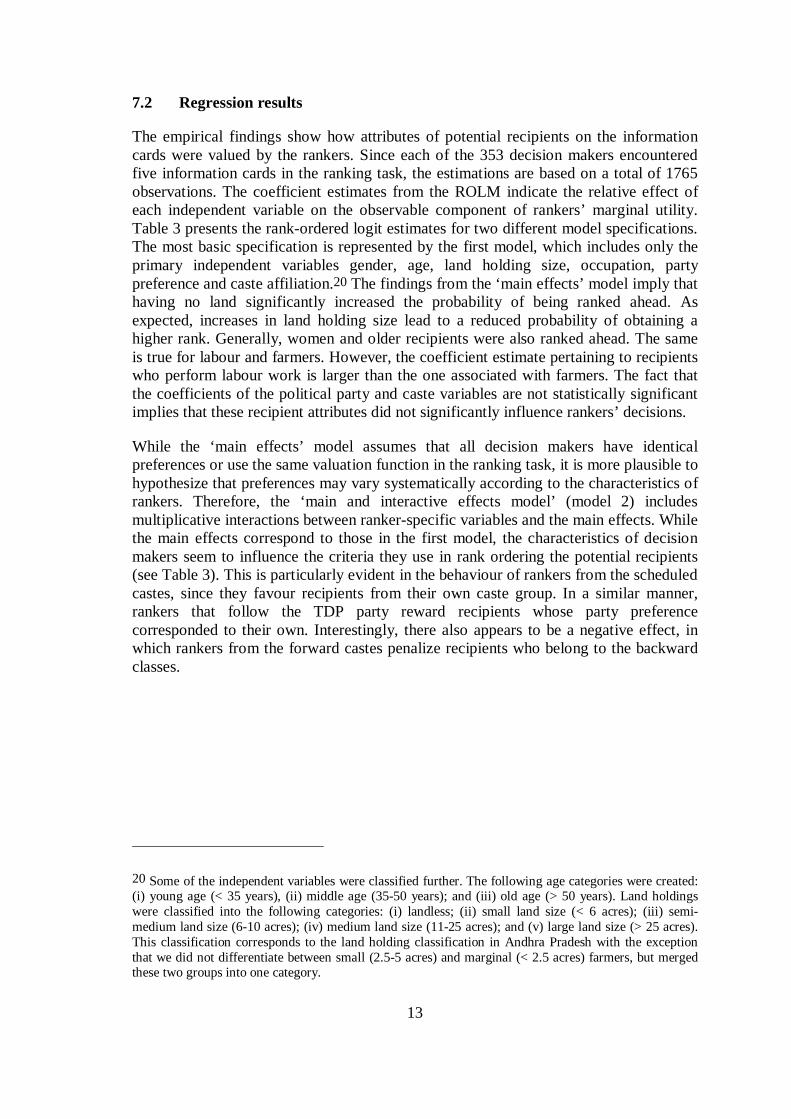
7.2 Regression results
The empirical findings show how attributes of potential recipients on the information cards were valued by the rankers. Since each of the 353 decision makers encountered five information cards in the ranking task, the estimations are based on a total of 1765 observations. The coefficient estimates from the ROLM indicate the relative effect of each independent variable on the observable component of rankers’ marginal utility. Table 3 presents the rank-ordered logit estimates for two different model specifications. The most basic specification is represented by the first model, which includes only the primary independent variables gender, age, land holding size, occupation, party preference and caste affiliation.20 The findings from the ‘main effects’ model imply that having no land significantly increased the probability of being ranked ahead. As expected, increases in land holding size lead to a reduced probability of obtaining a higher rank. Generally, women and older recipients were also ranked ahead. The same is true for labour and farmers. However, the coefficient estimate pertaining to recipients who perform labour work is larger than the one associated with farmers. The fact that the coefficients of the political party and caste variables are not statistically significant implies that these recipient attributes did not significantly influence rankers’ decisions.
While the ‘main effects’ model assumes that all decision makers have identical preferences or use the same valuation function in the ranking task, it is more plausible to hypothesize that preferences may vary systematically according to the characteristics of rankers. Therefore, the ‘main and interactive effects model’ (model 2) includes multiplicative interactions between ranker-specific variables and the main effects. While the main effects correspond to those in the first model, the characteristics of decision makers seem to influence the criteria they use in rank ordering the potential recipients (see Table 3). This is particularly evident in the behaviour of rankers from the scheduled castes, since they favour recipients from their own caste group. In a similar manner, rankers that follow the TDP party reward recipients whose party preference corresponded to their own. Interestingly, there also appears to be a negative effect, in which rankers from the forward castes penalize recipients who belong to the backward classes.
20 Some of the independent variables were classified further. The following age categories were created: (i) young age (< 35 years), (ii) middle age (35-50 years); and (iii) old age (> 50 years). Land holdings were classified into the following categories: (i) landless; (ii) small land size (< 6 acres); (iii) semi-medium land size (6-10 acres); (iv) medium land size (11-25 acres); and (v) large land size (> 25 acres). This classification corresponds to the land holding classification in Andhra Pradesh with the exception that we did not differentiate between small (2.5-5 acres) and marginal (< 2.5 acres) farmers, but merged these two groups into one category.

14
Table 3: Estimation results of main effects and interactive effects models
Model 1 Model 2
Coefficient S. E. Coefficient S. E.
Female 0.210** 0.072 0.221* 0.091 Middle age 0.269** 0.085 0.295*** 0.086 Old age 0.230** 0.088 0.288** 0.089 Landless 1.797*** 0.252 1.807*** 0.256 Small land 1.364*** 0.243 1.291*** 0.247 Semi-medium land 0.662** 0.233 0.589* 0.236 Medium land 0.463 0.249 0.434 0.255 Labour 0.325** 0.100 0.337*** 0.102 Farmer 0.219* 0.100 0.209* 0.102 INC -0.151 0.113 -0.365 0.197 TDP 0.072 0.133 -0.131 0.190 Scheduled castes 0.124 0.111 -0.071 0.137 Backward classes 0.076 0.104 0.138 0.130 FC1 x FC2 0.042 0.272 FC1 x female2 0.029 0.198 FC1 x BC2 -0.503* 0.218 FC1 x INC2 0.435 0.290 FC1 x TDP2 -0.022 0.360 SC1 x SC2 0.786*** 0.233 SC1 x female2 -0.038 0.162 SC1 x BC2 0.065 0.225 SC1 x TDP2 -0.317 0.314 SC1 x INC2 -0.368 0.265 INC1 x INC2 0.295 0.198 TDP1 x TDP2 0.642** 0.246 No. of obs. 1765 1765 LR chi2 260.76 316.69 Prob. > chi2 0.0000 0.0000
Note: FC, forward castes; BC, backward classes; SC, scheduled castes.
Significant at the 1% (***), 5% (**) and 10% (*) levels; variables with subscript 1 refer to characteristics of rankers and those with subscript 2 to recipients.
Source: Author's calculations based on primary field data.
In a next step, the full sample was stratified according to caste and gender groups. Likelihood ratio tests confirmed that the parameter estimates are not identical for the different sub-groups. The rank-ordered logistic regression results in Table 4 indicate both differences and similarities in group-wise ranker behaviour. What stands out is that landless recipients and villagers with small land holding sizes are ranked ahead, independent from rankers’ characteristics. At the same time, the coefficient estimates associated with land-related variables are larger if a ranker is female. While women are ranked higher by female decision makers, the coefficient estimates are smaller and not statistically significant for male decision makers. The coefficient estimates pertaining to female recipients are approximately equal across the different caste groups. It becomes clear that favouritism towards recipients from the own caste affiliation is restricted to rankers who belong to the scheduled castes.
15
Table 4: Main effects model for different caste and gender groups
Forward castes (n = 48)
Backward classes (n = 207)
Scheduled castes (n = 98)
Female (n = 65)
Male (n = 288)
Coeff. S. E. Coeff. S. E. Coeff. S. E. Coeff. S. E. Coeff. S. E.
Female 0.331 0.206 0.231* 0.093 0.213 0.147 0.486** 0.188 0.153 0.079 Middle age 0.124 0.243 0.258* 0.112 0.277 0.163 0.223 0.214 0.297** 0.094 Old age 0.364 0.227 0.184 0.118 0.335 0.176 0.396 0.229 0.192* 0.096 Landless 1.891** 0.671 1.926*** 0.373 1.493*** 0.426 3.485*** 0.809 1.522*** 0.267 Small land 1.257* 0.609 1.449*** 0.363 1.098** 0.418 2.196** 0.783 1.271*** 0.258 Semi-medium land 0.388 0.601 0.826* 0.346 0.263 0.397 0.787 0.720 0.666** 0.249 Medium land 0.559 0.622 0.538 0.380 0.075 0.419 0.682 0.791 0.450 0.264 Labour -0.004 0.290 0.399** 0.125 0.338 0.220 0.440 0.242 0.288* 0.113 Farmer -0.013 0.267 0.258 0.134 0.306 0.201 0.814** 0.254 0.101 0.110 INC 0.348 0.249 -0.172 0.157 -0.551* 0.226 0.494 0.290 -0.278* 0.123 TDP -0.053 0.321 0.057 0.183 -0.185 0.269 0.486 0.342 -0.011 0.146 Scheduled castes 0.123 0.287 -0.106 0.146 0.745** 0.232 -0.160 0.283 0.195 0.122 Backward classes -0.244 0.292 0.103 0.137 0.198 0.211 -0.220 0.253 0.159 0.116 No. of obs. 240 1035 490 325 1440 LR chi2 27.72 159.58 115.26 91.39 198.05 Prob. > chi2 0.0099 0.0000 0.0000 0.0000 0.0000
Significant at the 1% (***), 5% (**) and 10% (*) levels.
Source: Author's calculations based on primary field data.
16
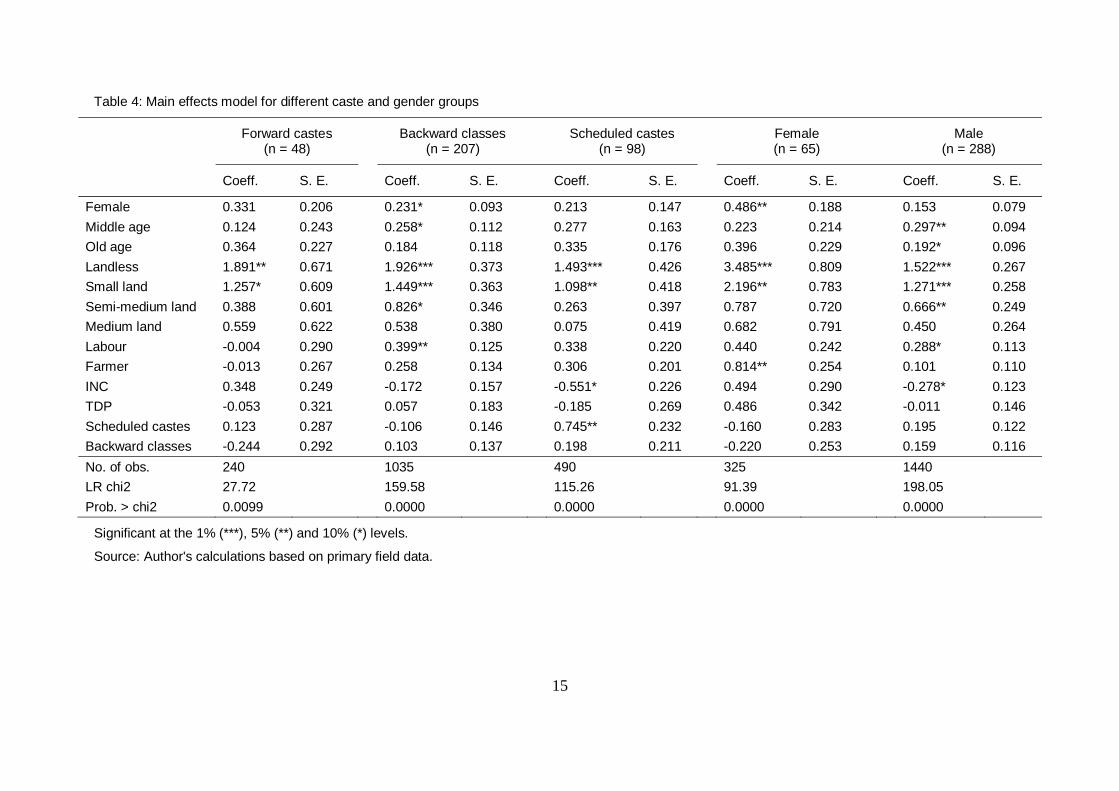
Table 5 compares findings for rankers who have experience with local council work and those who have not. Both sub-groups favour landless recipients with an equal coefficient estimate. The magnitude of the coefficient estimates associated with female and older recipients is larger among rankers with local council experience. In contrast, rankers without local council experience show a stronger preference for labour and farmers. The probability of ranking a recipient from the scheduled castes ahead is clearly higher among local council members. At the same time, the phenomenon of penalizing recipients that follow the INC party is pronounced among rankers in this sub-group.
Table 5: Main effects model for sub-samples with and without local council (GP) experience
GP experience (n = 65) No GP experience (n = 288)
Coefficient S. E. Coefficient S. E.
Female 0.384* 0.182 0.200* 0.080 Middle age 0.638** 0.201 0.185 0.095 Old age 0.538* 0.218 0.185 0.097 Landless 1.833** 0.694 1.833*** 0.272 Small land 1.782** 0.665 1.304*** 0.264 Semi-medium land 1.382* 0.629 0.535* 0.254 Medium land 0.856 0.668 0.430 0.272 Labour 0.200 0.239 0.382*** 0.112 Farmer -0.004 0.252 0.267* 0.109 INC -0.711* 0.310 -0.045 0.122 TDP -0.339 0.346 0.156 0.145 Scheduled castes 0.627* 0.280 0.046 0.122 Backward classes 0.282 0.262 0.063 0.115 No. of obs. 325 1440 LR chi2 65.41 216.11 Prob. > chi2 0.0000 0.0000
Significant at the 1% (***), 5% (**) and 10% (*) levels.
Source: Author's calculations based on primary field data.
The empirical findings have some limitations. As literacy was essential for rankers in order to participate in the experiment, the results largely reflect the decision-making behaviour of young, male and educated villagers. Moreover, the complete ranking of five alternatives, each involving six attributes, may have put considerable cognitive load on participants. Some authors argued that decision makers in choice experiments may spend effort on the upper ranks but pay less attention to the lower ones (e.g., Hausman and Ruud 1987). In other words, people may take later decisions more randomly compared to their first choices. Finally, the research was conducted in one region of the federal state of Andhra Pradesh, so that the observed behaviour cannot be generalized beyond the specific socio-political context.
8 Conclusion and discussion
This study employed a behavioural economics approach to analyze how Indian villagers, including actual local government representatives, allocate public resources to the poor. In order to elicit the social preferences of local decision makers, we conducted a lab-in-the-field experiment in the federal state of Andhra Pradesh. Villagers

17
participated in a ranking exercise and valued potential beneficiaries based on six attributes. Land holding size was clearly the most important criterion to determine the neediness of potential recipients. This main result held true for different sub-groups of decision makers in the sample.
However, we also found significant interaction effects between the characteristics of decision makers and those of potential recipients. In line with social identity theory, we observed in-group favouritism based on gender, political party preference and caste affiliation. In particular, women favoured female recipients, TDP party followers preferred recipients that were affiliated to the same party, and members from the scheduled castes rewarded recipients from their own caste group. Moreover, decision makers from the forward castes seemed to penalize members from the backward classes in the ranking task.
The fact that women and members from the scheduled castes favoured recipients from their own gender and caste group respectively, may be interpreted as a positive effect of the adopted reservation policies. Another explanation for in-group favouritism among scheduled castes is related to sub-caste stratification. While the backward classes and forward castes in Andhra Pradesh comprise various sub-castes, the scheduled castes include only two sub-castes. Although these two sub-castes generally compete with each other, the allocation of resources may evoke solidarity norms that are based on the broader caste category.21 While the forward castes traditionally belonged to the dominant castes, more recently, the backward classes have increasingly entered administrative as well as political positions. Due to their numerical strength and their influence on electoral politics, they have been considered as the newly emerging political elite in Andhra Pradesh (Suri 2002). In view of their diminishing status as an elite group, it might well be that the forward castes particularly punished members from the backward classes in the ranking exercise.
The empirical findings underline the importance of a generally neglected factor in the literature on community governance and distribution in India: variations in local council members’ attachment to political parties. The political party preferences of recipients appeared to play a larger role for local council members than for ordinary villagers. By reserving local council seats for disadvantaged castes, it was hoped that services and resources will be better targeted towards non-elite groups. However, the importance of political party identity in determining beneficiaries may attenuate the expected distributive impact of reservation policies along caste and gender lines.
Political clientelism is often related to decision-making procedures that are based on discrimination rather than on neediness. The same is true if inter-caste relations are characterized by out-group hate. In such cases, social identity-based preferences carry the danger of exclusion in providing rural services to the poor.
21 For a similar argumentation with respect to the effects of reservation policies in Karnataka, see Dunning (2009).

18
References
Aguiar, F., P. Brañas-Garza, and L.M. Miller (2008). ‘Moral Distance in Dictator Games’. Judgment and Decision Making, 3(4): 344-54.
Akerlof, G.A., and R.E. Kranton (2000). ‘Economics and Identity’. Quarterly Journal of Economics, 115(3): 715-53.
Akerlof, G.A., and R.E. Kranton (2002). ‘Identity and Schooling: Some Lessons for the Economics of Education’. Journal of Economic Literature, 40(4): 1167-201.
Akerlof, G.A., and R.E. Kranton (2005). ‘Identity and the Economics of Organizations’. Journal of Economic Perspectives, 19(1): 9-32.
Akerlof, G.A., and R.E. Kranton (2010). Identity Economics. Princeton: Princeton University Press.
Allison, P.D., and N. Christakis (1994). ‘Logit Models for Sets of Ranked Items’. Sociological Methodology, 24: 199-228.
Ban, R., and V. Rao (2008). ‘Tokenism or Agency? The Impact of Women’s Reservations on Village Democracies in South India’. Economic Development and Cultural Change, 56(3): 501-30.
Bardhan, P.K. (2002). ‘Decentralization of Governance and Development’. Journal of Economic Perspectives, 16(4): 185-206.
Bardhan, P.K. (2005). Scarcity, Conflicts, and Cooperation: Essays in the Political and Institutional Economics of Development. Cambridge, MA: MIT Press.
Bardhan, P.K., and D. Mookherjee (2000). ‘Capture and Governance at Local and National Levels’. American Economic Review, 90(2): 135-9.
Bardhan, P.K., and D. Mookherjee (2006). ‘Pro-Poor Targeting and Accountability of Local Governments in West Bengal’. Journal of Development Economics, 79(2): 303-27.
Basu, K. (2010). ‘The Moral Basis of Prosperity and Oppression: Altruism, Other-Regarding Behaviour and Identity’. Economics and Philosophy, 26(2): 189-216.
Becker, G.S. (1957). The Economics of Discrimination. Chicago: University of Chicago Press.
Beggs, S., S. Cardell, and J. Hausman (1981). ‘Assessing the Potential Demand for Electric Cars’. Journal of Econometrics, 17(1): 1-19.
Bénabou, R., and J. Tirole (2006). ‘Incentives and Prosocial Behavior’. American Economic Review, 96(5): 1652-79.
Bernhard, H., E. Fehr, and U. Fischbacher (2006). ‘Group Affiliation and Altruistic Norm Enforcement’. American Economic Review, 96(2): 217-21.
Bertrand, M., S. Mullainathan, and E. Shafir (2004). ‘A Behavioral-Economics View of Poverty’. American Economic Review, 94(2): 419-23.
19
Besley, T., L. Rahman, R. Pande, and V. Rao (2004). ‘The Politics of Public Good Provision: Evidence from Indian Local Governments’. Journal of the European Economic Association, 2 (2-3): 416-26.
Bosher, L., E. Penning-Rowsell, and S. Tapsell (2007). ‘Resource Accessibility and Vulnerability in Andhra Pradesh: Caste and Non-Caste Influences’. Development and Change, 38(4): 615-40.
Camerer, C. (2003). Behavioral Game Theory. Princeton: Princeton University Press.
Cárdenas J.-C., and J. Carpenter (2008). ‘Behavioral Development Economics: Lessons from Field Labs in the Developing World’. Journal of Development Studies, 44(3): 337-64.
Cárdenas, J.-C., N. Candelo, A. Gaviria, S. Polania, and R. Sethi (2009). ‘Discrimination in the Provision of Social Services to the Poor: A Field Experimental Study’. In H. Nopo, A. Chong, and A. Moro (eds), Discrimination in Latin America: An Economic Perspective. Washington, DC: World Bank.
Cárdenas J.-C. (2009). ‘Experiments in Environment and Development’. Annual Review of Resource Economics, 1: 157-82.
Cárdenas, J.-C., and R. Sethi (2010). ‘Resource Allocation in Public Agencies: Experimental Evidence’. Journal of Public Economic Theory, 12(4): 815-36.
Carlsson, F., G. Gupta, and O. Johansson-Stenman (2009). ‘Keeping Up with the Vaishyas? Caste and Relative Standing in India’. Oxford Economic Papers, 61(1): 52-73.
Cason T.N., and V. Mui (2003). ‘Testing Political Economy Models of Reform in the Laboratory’. American Economic Review, 93(2): 208-12.
Chandra, K. (2006). ‘What is Ethnic Identity and Does it Matter?’ Annual Review of Political Science, 9(1): 397-424.
Chapman, R.G., and R. Staelin (1982). ‘Exploiting Rank Ordered Choice Set Data within the Stochastic Utility Model’. Journal of Marketing Research, 19(3): 288-301.
Charness, G., and U. Gneezy (2008). ‘What’s in a Name? Anonymity and Social Distance in Dictator and Ultimatum Games’. Journal of Economic Behavior and Organization, 68(1): 29-35.
Chathukulam, J., and M.S. John (2000). ‘Empowerment of Women Panchayat Members: Learning from Kerala (India)’. Asian Journal of Women Studies, 6(4): 66-101.
Chattopadhyay, R., and E. Duflo (2004). ‘Women as Policy-Makers: Evidence from a Randomized Policy Experiment in India’. Econometrica, 72(5): 1409-43.
Chen, Y., and S.X. Li (2009). ‘Group Identity and Social Preferences’. American Economic Review, 99(1): 431-57.
Crisp, R.J., M. Hewstone, and M. Rubin (2001). ‘Does Multiple Categorization Reduce Intergroup Bias?’ Personality and Social Psychology Bulletin, 27(1): 76-89.
Crisp, R.J., and M. Hewstone (eds) (2006). Multiple Social Categorization: Processes, Models and Applications. Hove: Psychology Press.

20
D’Exelle, B., and A. Riedl (2008). ‘Elite Capture, Political Voice and Exclusion from Aid: An Experimental Study’. IZA Discussion Paper 3673. Bonn: Institute for the Study of Labor.
Duflo, E. (2006). ‘Poor but Rational?’ In A. Banerjee, D. Mookherjee, and R. Bénabou (eds), Understanding Poverty. New York: Oxford University Press.
Dumont, L. (1970). Homo Hierarchicus: The Caste System and Its Implications. Chicago: University of Chicago Press.
Dunning, T. (2009). ‘The Salience of Ethnic Categories: Field and Natural Experimental Evidence from Indian Village Councils’. Unpublished Working Paper. Department of Political Science, Yale University.
Ellingsen, T., and M. Johannesson (2008). ‘Pride and Prejudice: The Human Side of Incentive Theory’. American Economic Review, 98(3): 990-1008.
Fershtman, C., and U. Gneezy (2001). ‘Discrimination in a Segmented Society: An Experimental Approach’. Quarterly Journal of Economics, 116(1): 351-77.
Forsythe, R., J.L. Horowitz, N.E. Savin, and M. Sefton (1994). ‘Fairness in Simple Bargaining Experiments’. Games and Economic Behavior, 6(3): 347-69.
Gajwani K., and X. Zhang (2008). ‘Gender, Caste, and Public Goods Provision in Indian Village Governments’. IFPRI Discussion Paper 807. Washington, DC: International Food Policy Research Institute.
Habyarimana, J., M. Humphreys, D. Posner, and J.M. Weinstein (2007). ‘Why Does Ethnic Diversity Undermine Public Goods Provision?’ American Political Science Review, 101(4): 709-25.
Hagendoorn L., and R. Henke (1991). ‘The Effect of Multiple Category Memberships on Intergroup Evaluations in a North-Indian Context: Class, Caste and Religion’. British Journal of Social Psychology, 30(3): 247-60.
Harrison, G.W., and J.A. List (2004). ‘Field Experiments’. Journal of Economic Literature, 42(4): 1009-55.
Hausman, J.A., and P.A. Ruud (1987). ‘Specifying and Testing Econometric Models for Rank-ordered Data’. Journal of Econometrics, 34(1-2): 83-104.
Hewstone, M., M.R. Islam, and C.M. Judd (1993). ‘Models of Crossed Categorization and Intergroup Relations’. Journal of Personality and Social Psychology, 64(5): 779-93.
Hoff, K., and P. Pandey (2006). ‘Discrimination, Social Identity, and Durable Inequalities’. American Economic Review, 96(2): 206-11.
Hoff, K., M. Kshetramade, and E. Fehr (2009). ‘Caste and Punishment: The Legacy of Caste Culture in Norm Enforcement’. Policy Research Working Paper 5040. Washington, DC: World Bank.
Hogg, M.A., and D. Abrams (1988). Social Identifications: A Social Psychology of Intergroup Relationships and Group Processes. New York: Routledge.
Humphreys, M., and J.M. Weinstein (2009). ‘Field Experiments and the Political Economy of Development’. Annual Review of Political Science, 12: 367-78.

21
Kahneman, D., J.L. Knetsch, and R.H. Thaler (1986). ‘Fairness and the Assumptions of Economics’. Journal of Business, 59(4): 285-300.
Keefer, P., and S. Khemani (2005). ‘Democracy, Public Expenditures and the Poor: Understanding Political Incentives for Providing Public Services’. The World Bank Research Observer, 20(1): 1-27.
LeBoeuf, R.A., E. Shafir, and J.B. Bayuk (2010). ‘The Conflicting Choices of Alternating Selves’. Organizational Behavior and Human Decision Processes, 111(1): 48-61.
Markussen, T. (2011). ‘Inequality and Political Clientelism: Evidence from South India’. Journal of Development Studies, 47(11): 1721-38.
McFadden, D. (1974). ‘Conditional Logit Analysis of Qualitative Choice Behavior’. In P. Zarembka (ed.), Frontiers in Econometrics. New York: Academic Press.
Mullainathan, S. (2005). ‘Development Economics Through the Lens of Psychology’. In F. Bourguignon, and B. Pleskovic (eds), Annual World Bank Conference on Development Economics 2005: Lessons of Experience. Oxford, UK and Washington, DC: Oxford University Press and World Bank.
Palaniswamy, N., and N. Krishnan (2008). ‘Local Politics, Political Institutions and Public Resource Allocation’. IFPRI Discussion Paper 834. Washington, DC: International Food Policy Research Institute.
Prud’homme, R. (1995). ‘The Dangers of Decentralization’. World Bank Research Observer, 10(2): 201-10.
Punj, G.N., and R. Staelin (1978). ‘The Choice Process for Graduate Business Schools’. Journal of Marketing Research, 15(4): 588-98.
Srinivas, M.N. (1972). Social Change in Modern India. New Delhi: Orient Longman.
Suri, K.C. (2002). ‘Democratic Process and Electoral Politics in Andhra Pradesh, India’. ODI Working Paper 180. London: Overseas Development Institute.
Suri, K.C., P.N. Rao, and V.A. Reddy (2009). ‘Andhra Pradesh: A Vote for Status Quo?’. Economic and Political Weekly, 44(39): 108-13.
Tajfel, H., and J.C. Turner (1979). ‘An Integrative Theory of Intergroup Conflict’. In W.G. Austin, and S. Worchel (eds), The Social Psychology of Intergroup Relations. Monterey, CA: Brooks/Cole.
Tajfel, H. (1981). Human Groups and Social Categories: Studies in Social Psychology. Cambridge: Cambridge University Press.
Van der Merwe, W.G., and J. Burns (2008). ‘What's in a Name? Racial Identity and Altruism in Post-Apartheid South Africa’. South African Journal of Economics, 76(2): 266-75.
Vaugier-Chatterjee, A. (2009). ‘Two Dominant Castes: The Socio-political System in Andhra Pradesh’. In C. Jaffrelot, and S. Kumar (eds), Rise of the Plebeians? The Changing Face of Indian Legislative Assemblies. New Delhi: Routledge.
World Bank (2004). ‘World Development Report 2004: Making Services Work for Poor People’. Washington, DC: World Bank.

22
World Bank and IFPRI (2010). ‘Gender and Governance in Rural Services: Insights from India, Ethiopia and Ghana’. Washington, DC: World Bank.