refreshing our brand identity€¦ · synergy delivery and operational efficiency 8 • interstate...
TRANSCRIPT

Full year results2018/19
13 June 2019
NAME | DEPARTMENT

www.dssmith.comPrivate & Confidential © DS Smith
A year of significant delivery2
Notes(1) Corrugated box volumes (excluding Europac) and adjusted for the number of working days(2) Pro forma reflecting remedy and Plastics disposals
Strong strategic progress
◦ Acquisition of Europac - upgrade to synergies from €50m to €70m
◦ Sale of plastics division - expected completion by end of 2019
Strong operational performance
◦ Market outperformance - volume growth at 2.4%(1)
◦ Volume growth in all regions through FMCG and e-commerce focus
◦ Continued success of US operations
Strong financial performance
◦ Excellent pricing discipline
◦ Record margin and upgrade of medium-term target to 10 to 12%
◦ Organic adjusted operating profit +9%
◦ Cash generation: FCF +84%
◦ Robust balance sheet – pro-forma(2) net debt/EBITDA <2.0X
Well positioned for the future

Financial results

www.dssmith.comPrivate & Confidential © DS Smith
Continuing operations 2018/19 Changereported
Changeconstant currency
Revenue (£m) 6,171 +12% +12%
Operating profit(1) (£m) 631 +28% +28%
Return on sales(1) 10.2% +130bps +120bps
Adjusted EPS(1) 33.3p +8% +8%
Dividend per share 16.2p +13% +13%
ROACE(1) 13.6% -10bps -10bps
4
Financial highlights
(1) Before amortisation and adjusting items

www.dssmith.comPrivate & Confidential © DS Smith
5,518 5,497
6,171
191
293 74174
21
58
4,500
4,700
4,900
5,100
5,300
5,500
5,700
5,900
6,100
6,300
6,500
5
Acquisitions, volumes and pricing driving revenues
Note: Other volume includes paper, recycling and corrugated sheet
Revenue continuing operations, £m +3.3% organic

www.dssmith.comPrivate & Confidential © DS Smith
6
Strong organic growth
EBITA continuing operations £m
492493
631
3532
25 7
174
1
135
300
350
400
450
500
550
600
650
700
750
800
+8.8% organic

www.dssmith.comPrivate & Confidential © DS Smith
Segmental analysis7
Return on sales %2018/19
Return on sales %2017/18 (restated)
Changeconstant currency
UK 10.7% 10.0% +70 bps
Western Europe 8.0% 6.9% +110 bps
DCH and Northern Europe
9.3% 8.1% +120 bps
Central Europe and Italy 10.4% 8.8% +150 bps
North America 16.6% 16.1% +40 bps
Group 10.2% 8.9% +120 bps

www.dssmith.comPrivate & Confidential © DS Smith
Synergy delivery and operational efficiency8
• Interstate Resources
• Fully on track for delivery of cost synergies target of $40m
• $10m (£8m) delivered in FY18
• Incremental $23m (£18m) delivered in FY19
• Europac
• Initial delivery against cost synergies €6m in FY19
• Upgrade of cost synergy target from €50m to €70m, delivered by FY22
• Benefits from paper optimisation
• Savings from corporate office
• Further opportunities to optimise the efficiency of our business
• Asset optimisation
• SG&A efficiency

www.dssmith.comPrivate & Confidential © DS Smith
Update on disposals9
Plastics division
• Discontinued with effect 31 October 2018
• Agreement to dispose for c. £450m gross, c. £400 million net proceeds
• DoJ phase 2 as expected
• Completion expected in calendar H2
• 1.7 pence adjusted earnings per share contribution in FY19 (FY18: 2.3 pence per share)
• Substantial expected gain on disposal
Remedies
• Agreed c.£54m disposal of two packaging businesses (Portugal, France)
• Expected completion H1 FY20

www.dssmith.comPrivate & Confidential © DS Smith
Cash flow £m (continuing operations) FY 2018/19 FY 2017/18 (restated)
EBITDA 820 649
Underlying working capital 70 (136)
Invoice discounting movement (82) 118
Pension payments/other (34) (26)
Capex (net of proceeds) • Core DS Smith• Europac
(272)(17)
(289)
(312)n/a
(312)
Tax and interest (146) (109)
Free cash flow 339 184
FCF per share 25.6p 16.5p
Cashflow conversion 102% 99%
10
Strong cash generation
£m 30/4/19 y/y change
Non-recourse receivable factoring, like for like 483 (76)
Non-recourse factoring – Europac 42 (10)
Current total 525 (86)

www.dssmith.comPrivate & Confidential © DS Smith
(1,680)
(2,277)
339
-93
-1,702-187
(2,800)
(2,300)
(1,800)
(1,300)
(800)
(300)
30-Apr-18 Free cash flow Share issue
proceeds
Restructuring,
integration and
other adjusting
items
Acquisitions and
disposals
Dividends FX / other /
discontinued
30-Apr-19 Pro-forma
1,006
40
11
Cash flow robust following Europac acquisition
2.2xNet debt / EBITDA 2.3x
Net
debt
£m
<2.0x
Pro-forma reflecting Plastics and remedy disposals
www.dssmith.comPrivate & Confidential © DS Smith
Strong deleveraging profile12
• Net debt £2,277 million
• 2.3x net debt / EBITDA(1)
• <2.0x assuming Plastics and remedy disposals
• Interstate put-option liability £172 million
◦ Approximately 0.2x pro forma EBITDA
• 5 year RCF refinanced (November 2018)
• Further working capital opportunities
(1) Based on banking covenants Key adjustments – constant FX, and pro-forma EBITDA for businesses acquired in the year

www.dssmith.comPrivate & Confidential © DS Smith
Volume growth
13
2018/19: progress on our medium term targets
+2.4% 10.2%+120bps 13.6% 102%
Notes – Volumes on a like-for-like basis, excluding Europac. All figures are continuing operations on a constant currency basis, before adjusting items and amortisation and including adoption of IFRS15. Net debt / EBITDA calculated in accordance with banking covenants.1. GDP+1% based on weighted average GDP of 1.9%2. Pro-forma reflecting Plastics and remedy disposals <2.0x
Return on sales
Return on average capital employed
Cash conversion
2.3x(2)
Net debt / EBITDA
Target:2.9%1
Target:8-10%
Target:12 - 15%
Target:≤2.0x
Target:>100%

www.dssmith.comPrivate & Confidential © DS Smith
Technical guidance14
For FY20 continuing operations (plastics discontinued & including IFRS 16)
• Capex: £370 million
• Depreciation: £320 million
• Amortisation: £140 million
• Tax rate: 23% - 24%
• Interest incl. pension: £85 million (of which £5 million is pension charge)
• Pension deficit reduction cash contribution: £20 million
• Adjusting items: c. £76 million
• FX: €1c move versus GBP = approximately £2.4m EBITA
FY20 capex £m
Core DS Smith (including Indiana greenfield)
285
Europac – base 54
Europac – integration 31
Total 370
FY20 adjusting items £m
Acquisition related• Europac integration• Interstate integration• Other M&A/disposal costs
238
1950
Technical / accounting• Put option unwind 8
Other restructuring 18
Total* 76
*excluding expected gain on disposal of Plastics of over £200 million

www.dssmith.comPrivate & Confidential © DS Smith
IFRS 16 Guidance15
• Impact on FY20 (continuing operations) of IFRS 16 (Leases). The estimated impact on the consolidated financial position and the Group Key Performance Indicators are as follows:
• Property, plant and equipment c. +£235m
• EBITDA c. +£75m
• Depreciation c. +£70m
• Interest c. +£10m
• Adjusted PBT c. -£5m
• Net debt c. +£235m
• Net debt / EBITDA Negligible (no impact on leverage ratios)
• ROACE -30bps

www.dssmith.comPrivate & Confidential © DS Smith
3.04.2
5.57.4
9.310.6
11.914.1 14.4
16.2
5.3
9.011.6
15.9
19.9
22.825.5
30.2
33.035.0
0.0
5.0
10.0
15.0
20.0
25.0
30.0
35.0
40.0
Pence p
er
share
Adj DPS Adj EPS
16
Strong continuous growth in EPS and DPS
EPS includes both continuing and discontinued operations (Plastics)Historic EPS and DPS adjusted for rights issue bonus factor
EPS CAGR 23%, DPS CAGR 21%

2018/19 – a year of significant delivery

www.dssmith.comPrivate & Confidential © DS Smith
Redefining packaging for a changing world18
A year of significant delivery
• Strong strategic progress
• Strong operational performance
• Strong financial performance
Structural drivers remain strong
Resilient business model
Well positioned for the future

www.dssmith.comPrivate & Confidential © DS Smith
19
Structural drivers for corrugated remain strong
Geographic coverage
Partnership approach
E-comm Retail-Channel Change Sustainability
“Greater channel fragmentation is one of our key challenges…”
David Walker - Nestle Project Manager
Logistics Transformation (May 2018)
£5.7bn opportunityNew channels

www.dssmith.comPrivate & Confidential © DS Smith
Sustainability increasingly front of mind20

www.dssmith.comPrivate & Confidential © DS Smith
E-commerce driving growth21
• Increasing share in total retail sales
• New entrants and developments
• E-pharma, E-grocery, frozen food, sharing
economy
• Demographics, internet penetration,
improving delivery infrastructure

www.dssmith.comPrivate & Confidential © DS Smith
Innovation leader22
• Leader in packaging innovation
• c. 700 designers and innovators
• 9 major innovation hubs
• 36 practical innovation centres
◦ R&D in raw materials innovation
◦ Collaboration with partnership research organisations

www.dssmith.comPrivate & Confidential © DS Smith
20192010
37Countries
C.31,000Employees
200Manufacturing
sites
Over
Our scale means we are able to serve global customers…23

www.dssmith.comPrivate & Confidential © DS Smith
70%
10%
20%
DS Smith 2018/19
FMCG and food Other consumer Industrial
67%
9%
24%
DS Smith 2016/17
FMCG and food Other consumer Industrial
Highly resilient FMCG focus24
Source: DS Smith analysis

www.dssmith.comPrivate & Confidential © DS Smith
Resilient FMCG driving volume growth25
Core FMCG customers
• Continued strong performance ahead of Group average
• Consistent growth throughout the year
• Pricing discipline and margin focus
• Market leading e-commerce offering continues to drive strong growth
• Winning with multinationals – top 20 customers + 7%
• US – capacity temporarily constrained
• Expect further progress in FY20
Industrial customers
• Industrial deterioration in H2
◦ Export led impact, notably in Germany
◦ Supply chain compression
◦ Clear pricing discipline and margin focus
Looking ahead
• Expect our like-for-like volume growth in H1 2019/20 to recover from H2 2018/19
We are also focused on more strategic supplier relationships… Over the past five years, we have reduced our total number of suppliers by roughly 20%.
Global product supply officer

www.dssmith.comPrivate & Confidential © DS Smith
Consistent margin progression through the cycle26
5.7%6.3%
7.2%6.8%
7.6%
8.8%9.3% 9.3% 9.2%
10.2%
300
350
400
450
500
550
600
650
700
750
800
0.0%
2.0%
4.0%
6.0%
8.0%
10.0%
12.0%
Oct
2009
Jan 2
010
Apr
2010
Jul 2010
Oct
2010
Jan 2
011
Apr
2011
Jul 2011
Oct
2011
Jan 2
012
Apr
2012
Jul 2012
Oct
2012
Jan 2
013
Apr
2013
Jul 2013
Oct
2013
Jan 2
014
Apr
2014
Jul 2014
Oct
2014
Jan 2
015
Apr
2015
Jul 2015
Oct
2015
Jan 2
016
Apr
2016
Jul 2016
Oct
2016
Jan 2
017
Apr
2017
Jul 2017
Oct
2017
Jan 2
018
Apr
2018
Jul 2018
Oct
2018
Jan 2
019
Apr
2019
Paper
pri
ce €
/t
Retu
rn o
n s
ale
s
DS Smith margin (reported) German TL (€/t) UK TL (£/t)

www.dssmith.comPrivate & Confidential © DS Smith
New medium term margin target to
10 - 12%
Drivers of margin upgrade27
• Increasing value-added proposition for customers
• Contribution from North America business and Europac
▪ High quality businesses
▪ Synergy outperformance
• Optimising the benefits of scale
▪ Operational efficiency
Geographic coverage
InnovationEnd-to-end solutions
Partnership approach
www.dssmith.comPrivate & Confidential © DS Smith
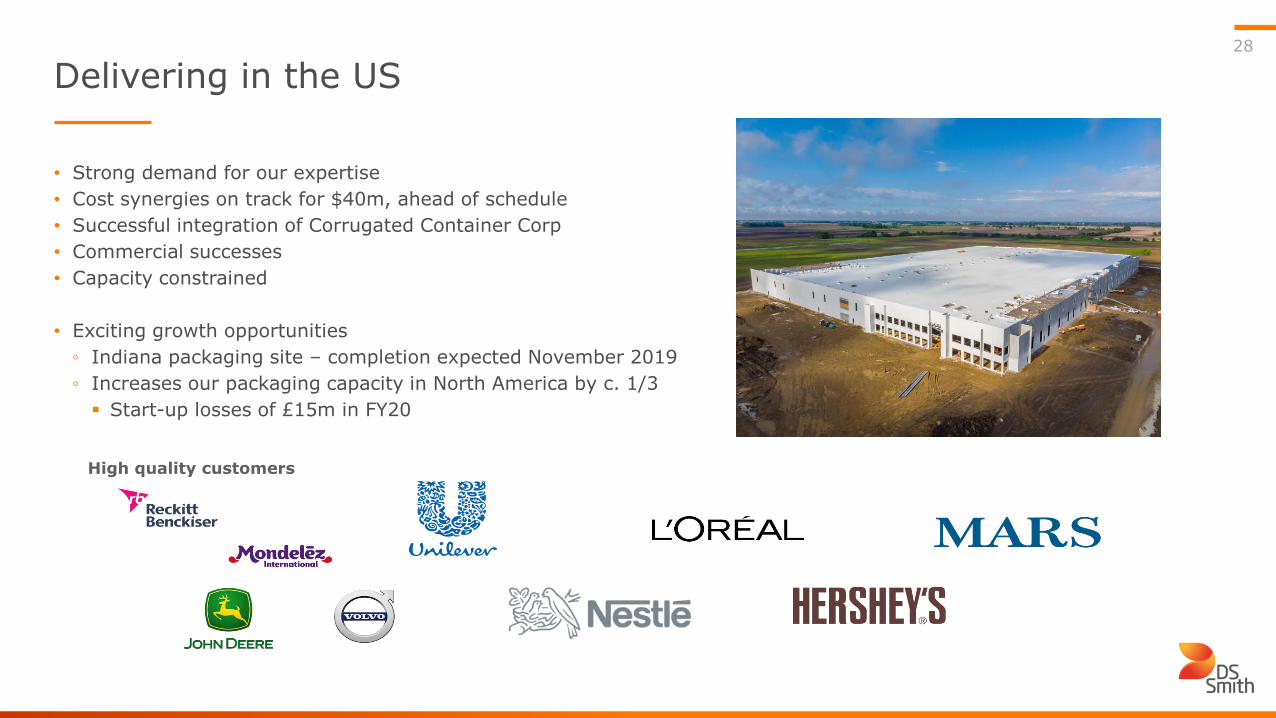
Delivering in the US 28
• Strong demand for our expertise
• Cost synergies on track for $40m, ahead of schedule
• Successful integration of Corrugated Container Corp
• Commercial successes
• Capacity constrained
• Exciting growth opportunities
◦ Indiana packaging site – completion expected November 2019
◦ Increases our packaging capacity in North America by c. 1/3
▪ Start-up losses of £15m in FY20
High quality customers in the US

www.dssmith.comPrivate & Confidential © DS Smith
Delivery from value-adding acquisitions - Europac29
• Initial performance and asset quality – as expected
◦ High quality paper operations
◦ Significant opportunity to transform packaging assets
• 3rd largest market in Europe – growing fast
• Improved overall global supply chain
◦ Key kraftliner asset in strategic location
• Integration going very well
◦ Excellent employee engagement
• Excellent customer reaction
• Target cost synergies now €70 million (up from €50 million),
phased over 3 years

www.dssmith.comPrivate & Confidential © DS Smith
Optimising our paper manufacturing30
• Paper asset base for high quality packaging
◦ Key assets in strategic locations
◦ Enhanced kraft and light-weight paper capability
• Currently c. 80% integrated in Europe
◦ Plan to optimise paper footprint and capability
◦ Consistent packaging growth
◦ Medium term target integration towards 60%
• US – security of supply necessary
◦ Grow packaging assets to reduce “long” position
• Result – the right assets in the right place
0
200
400
600
800
1000
1200
1400
1600
2014 2015 2016 2017 2018 2019
DS Smith (Europe) short paper position (kt)

www.dssmith.comPrivate & Confidential © DS Smith
Outlook31
• Structural drivers for continued volume growth remain strong
• Volume growth expected to improve from H2’19
o Driven by success with FMCG customers
• Robust pricing discipline
• Consistent strategy for a volatile macroeconomic and input cost environment
• Focus on driving cost efficiency and cash generation
• Opportunity to optimise our paper manufacturing
• Expect FY20 to be a further year of good progress

www.dssmith.comPrivate & Confidential © DS Smith
Our value proposition32
• Market leading packaging solutions
◦ FMCG focus, innovation led
• Consistent top line growth & proven cyclical resilience
• Consistent margin growth – upgraded target
• 9+ years EPS growth: 23% CAGR since May 2010
• Proven capital allocation discipline
◦ Strong cashflow and deleveraging profile
◦ Value creating acquisitions and disposals
• Consistent dividend growth: 21% CAGR since May 2010
• Confident in business model
0.0
5.0
10.0
15.0
20.0
25.0
30.0
35.0
Adj DPS Adj EPS
EPS includes both continuing and discontinued operations (Plastics)Historic EPS and DPS adjusted for rights issue bonus factor

Appendix

www.dssmith.comPrivate & Confidential © DS Smith
2018/19 Revenue (%) EBITA (%) Average rate FY 2017/18
Average rate H1 2018/19
Average rate FY 2018/19
Closing rate 30 Apr 2019
GBP 16.5 10.1
EUR 56.2 53.7 1.132 1.129 1.135 1.159
PLN 2.9 2.1 4.785 4.852 4.830 4.970
SEK 2.5 2.2 11.156 11.726 11.783 12.331
DKK 2.4 (0.1) 8.394 8.565 8.467 8.655
USD 10.6 21.1 1.356 1.311 1.304 1.301
Other 8.9 10.9
34
Foreign exchange exposure

www.dssmith.comPrivate & Confidential © DS Smith
Cost analysis 2018/1935
15
30
30
755
189
169
338
Fixed costs
Total £1,451m
employee depreciation repairs and maintenance other
2636
454
511
327161
Variable costs
Total £4,089m
materials distribution employee energy other

www.dssmith.comPrivate & Confidential © DS Smith
36
Debt analysis
As at 30 April 2019, the weighted average remaining life
of the Group's committed borrowing facilities was 4.6 years.
* Ratios as defined in the Group’s banking agreements.
** Debt shown net of swaps and fees.
Includes drawn Europac debt facilities.
Net Debt £2,277m
Net Debt/ EBITDA* 2.3 x
EBITDA/ Net Interest* 13.0 x
250 250 250 250 250 250 250 250
1,078 1,078 1,078 1,078
647 647
-
51 51
-
-
286 238 230 207
-
-
396 375 329
106
57 24
4
1,512 1,512
1,512
1,512
1,512
112
3,574 3,504 3,399
3,154
2,466
1,033
254
-
500
1,000
1,500
2,000
2,500
3,000
3,500
4,000
2019 2020 2021 2022 2023 2024 2025 2026-29
Facilities at 30 April 2019**
RCF
Term Loans
PP 2012
PP 2010
Eurobonds
Sterling Bond
71%
8%
19%
2%As at 30 April 2019 **
EUR
GBP
USD
OTHER69%
31%Fixed
Floating