probabilistic modeling of earthquake hazard …home.iitk.ac.in/~vinaykg/iset470.pdf ·...
TRANSCRIPT
ISET Journal of Earthquake Technology, Paper No. 470, Vol. 43, No. 3, September 2006, pp. 49-64
PROBABILISTIC MODELING OF EARTHQUAKE HAZARD IN STABLE CONTINENTAL SHIELD OF THE INDIAN PENINSULA
Kishor Jaiswal and Ravi Sinha Department of Civil Engineering
Indian Institute of Technology Bombay Powai, Mumbai-400076
ABSTRACT
This paper presents the probabilistic assessment of seismic hazard associated with the stable continental shield of peninsular India (10°N-26°N; 68°E-90°E) in terms of peak ground accelerations for different levels of ground shaking. The paper discusses the procedure for evaluating the probabilistic seismic hazard using a knowledge-tree approach. Attenuation relationships proposed for peninsular India and those proposed for the other stable continental regions such as Central and Eastern United States have been used in this study. The results show that for many parts of peninsular India, the estimated seismic hazard is higher than the level specified in the current seismic zoning map given in IS 1893-2002.
KEYWORDS: Seismic Zoning, Seismic Hazard, Probabilistic Assessment, Peninsular India
INTRODUCTION
Some of India’s most devastating earthquakes in recent times (e.g., 1967 Koyna, 1993 Killari, 1999 Jabalpur, 2001 Bhuj) have occurred in peninsular India (10°N-26°N; 68°E-90°E), a region that was predominantly considered as the stable and aseismic shield of the Indian Plate. In order to develop effective earthquake safety measures, it is essential that the earthquake hazard associated with this shield region be realistically estimated. Seismic-hazard estimation has been reasonably quantified for the development of probabilistic seismic-hazard maps based on regional geological and seismological information on a global scale under the Global Seismic Hazard Assessment Program (GSHAP). For India, Bhatia et al. (1999) published a probabilistic seismic-hazard map based on several well-identified and prominent source zones in the country. The seismic hazard estimated in their work is based on only a few identified source zones for peninsular India whereas most of the stable shield has been assumed to be free from seismogenic activity. Nevertheless, this study provides a useful first order interpretation of engineering seismic hazard associated with the entire region for different likelihood and return periods of the earthquake ground motions associated with the identified source zones. The present investigation uses the zoneless approach proposed by Frankel (1995) for seismic-hazard estimation. However, the spatial variations of seismicity parameters Mmax and b are assigned based on different identified broad regions in peninsular India. Due to the unavailability of well-established attenuation relations for the region, three different attenuation relationships have been considered. The main steps for hazard assessment in the present study include: (1) development of earthquake catalog using data from various sources; (2) removal of dependent events such as foreshocks and aftershocks from the main catalog events based on predefined identification criteria; (3) identification of different source regions based on geological and seismotectonic criteria in order to assign Mmax for each broad source region; (4) estimation of seismicity parameters for Gutenberg-Richter relationship (i.e., a- and b-values); (5) development of models to include spatial and temporal variations in b-value and modeling reservoir-induced seismicity; (6) incorporation of ground motion attenuation characteristics with multiple ground motion models by using an appropriate weighting scheme; and (7) development of a seismic-hazard map for a certain predefined exceedance probability level by using a convolution technique based on logic-tree approach. The seismic hazard associated with peninsular India has been estimated in the present investigation and has been compared with the seismic zoning map specified in the Indian Standard code for design of earthquake-resistant structures (BIS, 2002).
50 Probabilistic Modeling of Earthquake Hazard in Stable Continental Shield of the Indian Peninsula
SEISMICITY CHARACTERISTICS
1. Seismic Zonation and Earthquake Catalog
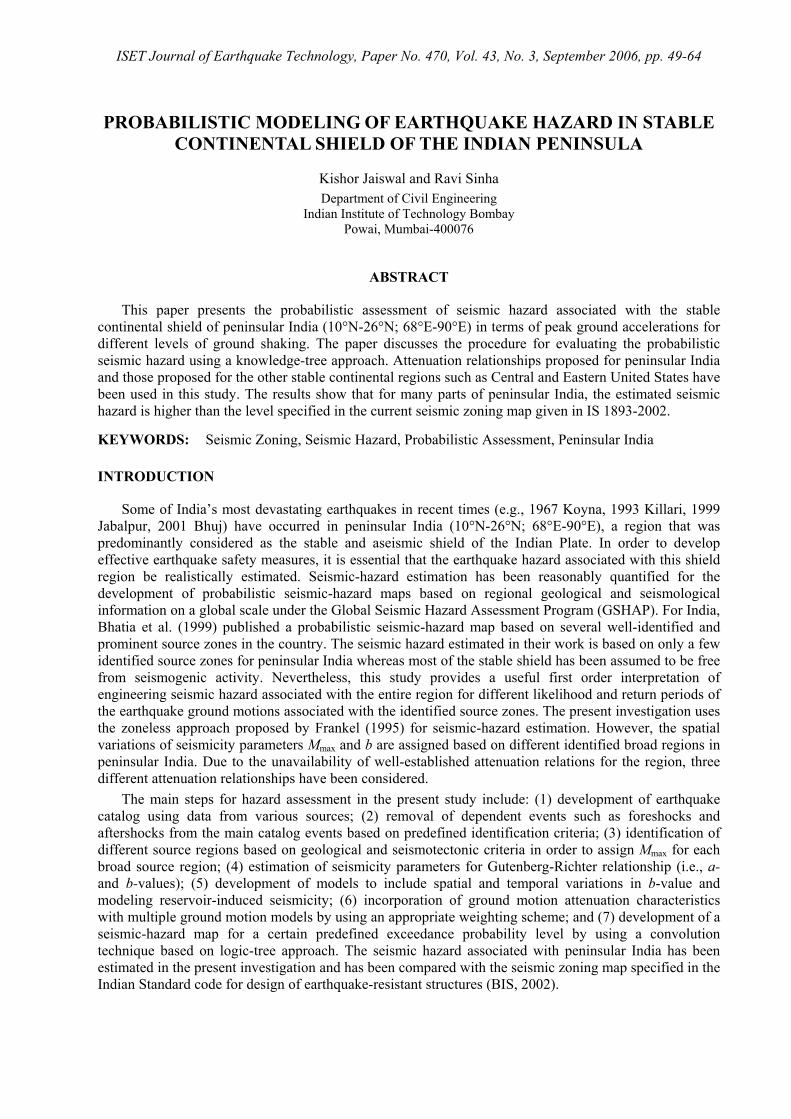
The spatial variations of seismicity parameters have been defined using seismic zonation of earthquake sources based on various evolutionary units and the associated tectonic features in the peninsular shield of India (Figure 1). Based on tectonic features and the observed seismic activity in the peninsular shield, the shield has been divided into nine broad seismic regions (Figure 2), considering the characterization of Stable Continental Regions (SCRs) as either cratons or paleorifts. The seismogenic characteristics of paleorifts suggest that these regions contain large faults and have experienced extentional deformations in their most active phase. In peninsular India, these include all passive continental margins and inactive grabens such as the Cambay, Godavari, Mahanadi grabens and the active Narmada lineament as shown in Figure 1. The stable southern and northern cratons have been assigned separate zones, and a similar procedure has been adopted for characterizing the western and eastern passive margins (Figure 2). In the present study, the seismic zone characterization has been one of the important criteria to investigate and assign the variations in seismicity parameters such as b-value and
maxM . However it should be noted that the zonation scheme has been applied only to understand the spatial variations of these parameters, whereas seismic-hazard estimation in each seismogenic region is based on the zoneless approach proposed by Frankel (1995).
Fig. 1 Map showing major evolutionary units and associated tectonic features of peninsular
India (Valdiya, 1973)
A complete earthquake catalog with a uniform magnitude scale for expressing the size of past earthquakes is a prerequisite for reliable parameterization of the magnitude distribution used in a hazard analysis. A working catalog has been prepared for this study based on the available information from various sources1 (Jaiswal, 2006). It includes the published catalog ( )0.3≥wM , after equivalent moment magnitude conversion, up to 1997 from Seeber et al. (1999). The most recent events up to 2002 are
1 Website of Earthquakeinfo.org, http://www.earthquakeinfo.org
ISET Journal of Earthquake Technology, September 2006 51
included in the catalog from PDE (Preliminary Determinations of Epicenters) data2. The PDE events are in terms of body wave magnitude, and are hence converted to equivalent moment magnitude by estimating the seismic moment using the relation proposed by Johnston (1996) for stable continental region as follows:
20log 18.28 0.679 0.0077b bM m m= + + (1)
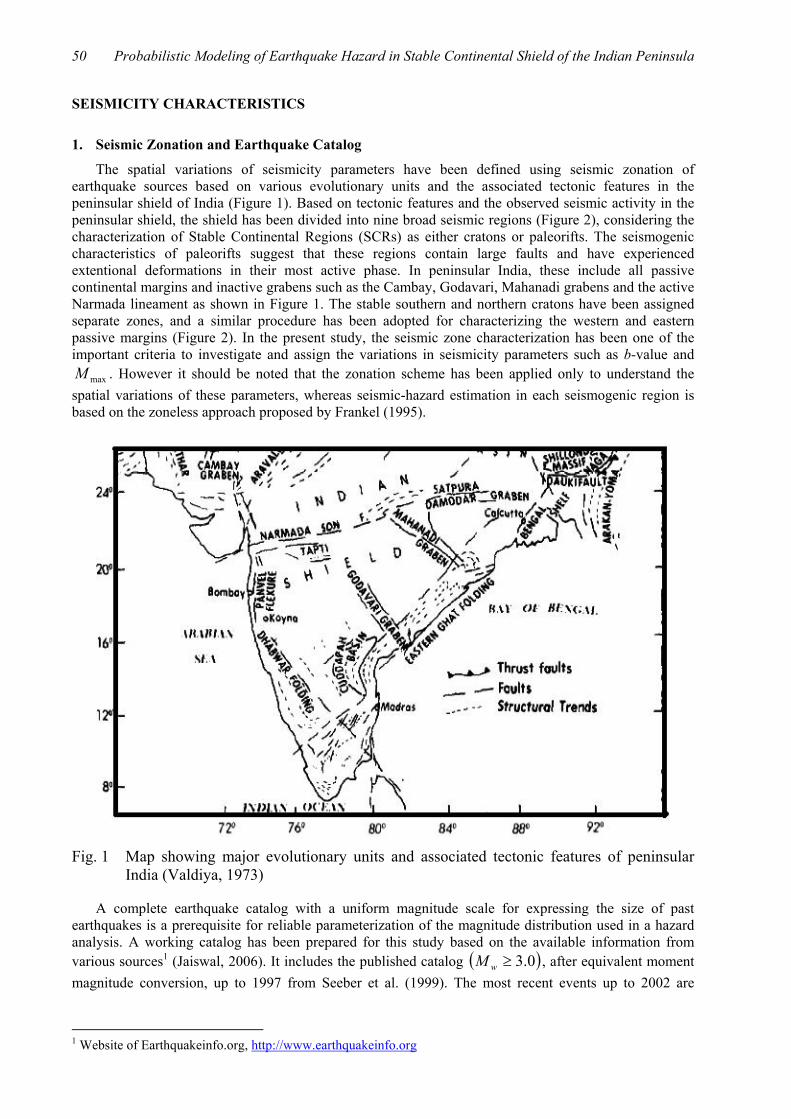
Fig. 2 Map showing epicentral locations of past earthquakes data for 1842-2002 along with geological zonation used in the present study for the seismic-hazard analysis of Peninsular India: 1 – Runn of Kuchchh (ROK), 2 – Northern Craton (NC), 3 – Narmada Lineament (NL), 4 – Mahanadi Graben (MG), 5 – Eastern Craton (EC), 6 – Godavari Graben (GG), 7 – Southern Craton (SC), 8 – Western Passive Margin (WPM), and 9 – Eastern Passive Margin (EPM)
For some of the larger events, reported moment magnitude estimates have been directly used in the preparation of the catalog. A declustering algorithm has been used for removing dependent events of the entire catalog. The criterion for removing foreshocks and aftershocks works on uniform time (≤ 90 days) and space (radius ≤ 50 km) window between the successive events. However for large events (e.g., Bhuj earthquake of 2001), the aftershock activity had continued for a much longer period; hence such events have been manually removed from the catalog in order to have uniform assumptions in the rate modeling. The regional earthquake recurrence activity is commonly expressed in terms of Gutenberg-Richter magnitude-frequency relationship represented by following exponential magnitude distribution function:
( )10log or expa b M Mλ λ α β= − = − (2)
where λ is the number of events per year with magnitude greater than or equal to M . The α -value is the activity rate per unit area per year and b -value is the slope of log-linear fit that represents the relative
2 Website of Earthquake Hazard Program of USGS, http://neic.usgs.gov/neis/epic/
52 Probabilistic Modeling of Earthquake Hazard in Stable Continental Shield of the Indian Peninsula
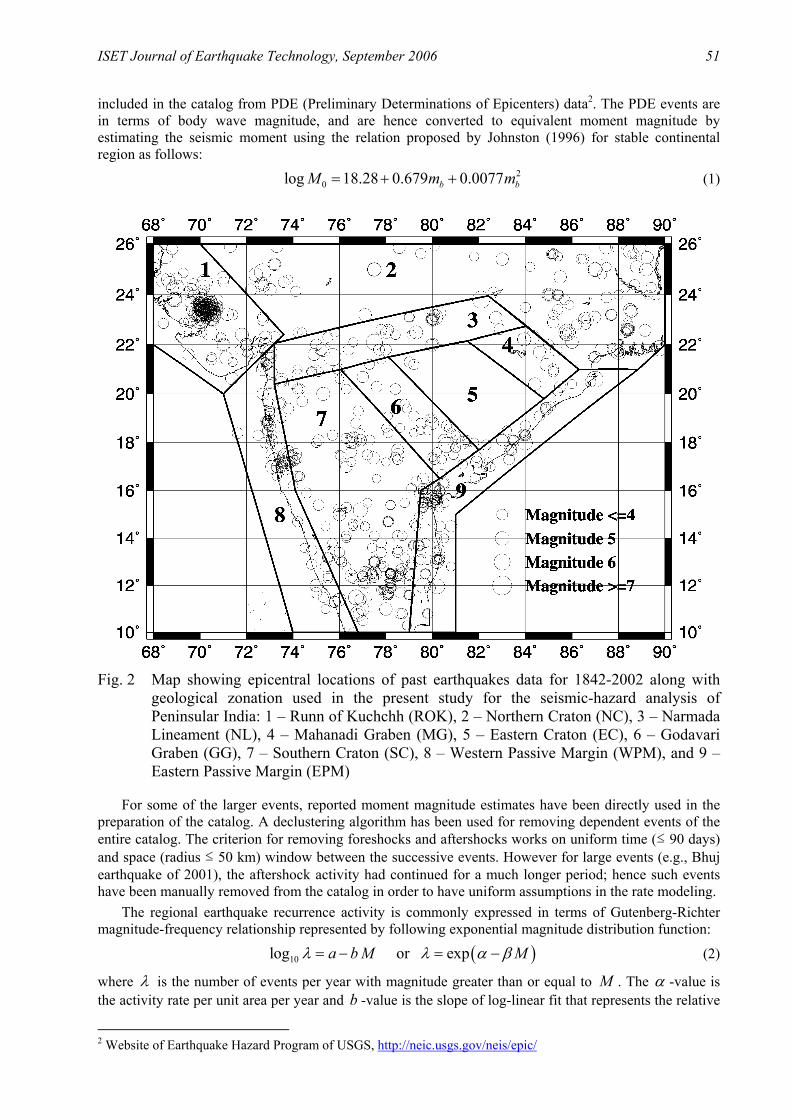
likelihood of larger and smaller earthquakes. For estimating seismicity parameters the entire catalog data in the period 1842-2002 has been used. Assumption of single threshold magnitude level of 4.5 for the entire catalog data gives a b-value of 0.84. The b-value obtained using this criterion is quite close to the value of 0.85 obtained by Rao and Rao (1984) based on the historical earthquake data of 170 years. However in order to ensure uniformity of activity rate of each magnitude class at different time scales, the catalog data has also been divided based on the cumulative number of events of different magnitude groups. This has led to the selection of different completeness criteria for different lengths of catalog based on observed rate uniformity in different time intervals, and the results are shown in Table 1. Considering this completeness level, the b -value has been found to be equal to 0.92 for the entire catalog data (Figure 3). This value is more representative of the region’s seismicity and hence has been used in this investigation as the basis for rate adjustment in hazard calculations using different models.
Table 1: Distribution of Earthquake Data in Different Magnitude Ranges along with Completeness Period
Magnitude Interval Completeness Period Time Interval (in Years) 4.0-4.5 1961-2002 42 4.5-5.0 1951-2002 52 5.0-5.5 1901-2002 102 5.5-6.0 1842-2002 160 6.0-6.5 1842-2002 160
4.0 4.5 5.0 5.5 6.0 6.5 7.0 7.5 8.010-3
10-2
10-1
100
101
Data Based on Magnitude Completeness Criteria (1842-2002)
GR-Fit parameters using Wiechert Method a=4.21, b=0.92(±0.052)
Cum
ulat
ive
of A
nnua
l Num
ber A
bove
MW
Moment Magnitude (MW)
Fig. 3 Estimation of seismicity parameters based on completeness criteria (from Table 1) for different spans of catalog data
2. Spatial-Temporal Characteristics of Seismicity Based on Catalog Data
Even though the current catalog data does not cover a long period of earthquake history for understanding recurrence pattern of the largest earthquakes, the observed seismic activity of moderate earthquakes clearly indicates a spatial variation in b -values. Wiemer and Wyss (1997) have carried out stability analysis of the Gutenberg-Richter parameters and suggested the possibility of such spatial or temporal variations at all scales.
ISET Journal of Earthquake Technology, September 2006 53
The spatial variation of this change for the catalog data of peninsular India indicates that the data associated with the cratons has a higher b -value of 1.05 as compared with the rift zones such as the east and west margins and the Runn of Kuchchh for which the b -value has been estimated as 0.85. The lower b -value in the rift zones implies that these zones experience greater number of large-size events as compared to the cratons for the same number of medium-size events. This is quite expected due to the fact that such areas of the peninsular shield have experienced large earthquakes at relatively shorter intervals during the last several centuries. This indicates that earthquakes associated with the rift systems of peninsular India tend to recur at relatively shorter intervals and are associated with higher potential of large-size earthquakes in comparison with the non-rift systems. It may be noted that similar conclusions have been obtained by Rajendran (2000) based on the classification of recent damaging earthquakes in terms of tectonic environment, recurrence period, maximum magnitude and style of deformation. In order to evaluate the effect of induced seismicity, the pre- and post-1960 earthquake catalogs have been considered for analysis. It is observed that the increase in seismicity after 1960 is, in terms of increase in the recurrence rate of moderate earthquakes, giving a higher b -value of 0.90 compared to 0.77 as observed for the pre-1960 data. It is important to evaluate the influence of such an increase in the seismicity of peninsular India for the current hazard estimation studies. For this purpose, the rate associated with the 20 known reservoirs in the region (Gupta, 1992) has been evaluated considering all the earthquakes that have occurred in the 100×100 km area peripheral to these reservoirs and approximately corresponding to the catchment areas. No direct evidence of the occurrence of these recent earthquakes near reservoirs is available in the literature, which can indicate an induced seismicity component except in the case of Koyna and Bhatsa (Rastogi, 1994). In this investigation, the earthquakes that are located within this near-reservoir area are considered to be associated with the likely effect of reservoir-induced seismicity as a first-order assumption. The area taken for including the events around each reservoir is based on the catchment areas of most of these reservoirs in the Peninsula. It is interesting to note that the events associated with the near-reservoir areas indicate a b -value of 0.95, which is higher than that observed (= 0.91) for the rest of the data for the Peninsula. The overall increase in the activity rate compared to the pre-1960 rate seems to be quite similar to the rate associated with the overall seismic activity observed for the entire peninsular India. This may be due to the fact that most of the near-reservoir earthquakes are from a few hot spots, such as the Koyna and Bhatsa regions of peninsular India, and are not associated with the other reservoirs in the region. It is also important to note that the overall increase in the activity rate after 1960s is not just due to the reservoirs but also due to the large number of moderate-sized earthquakes that occurred in the Runn of Kuchchh region, southern craton, or eastern and western passive margins. It is, therefore, inappropriate to assume that this increase in the seismicity of the peninsular India is entirely due to the increase in seismic activity in the vicinity of large reservoirs. Unlike other Stable Continental Regions (SCRs), such spatial variation in terms of the rate of recurrence remains a peculiarity of the Indian shield and has been ascertained based on the geologic and seismotectonic characteristics of the region. The present investigation addresses this issue by modeling the spatial variation in the b -value estimates in the hazard analysis using a logic-tree based approach. Cramer (2001) and Cramer et al. (2002) give systematic applications of such information for incorporating various uncertainties in terms of logic-tree based approach of seismic-hazard analysis, and this forms the basis for the current investigation.
SOURCE MODEL
The observed earthquake activity rate, evaluated in terms of the a-values, depends on the completeness period obtained down to each magnitude interval of the catalog data. In the case of peninsular India, it has been seen that the data completeness is very important since large areas, especially the large cratons, have rarely experienced moderate level earthquakes, whereas the activity near rifting systems has been very high. In order to understand the implication of such variation of observed seismicity rates, three independent source models have been considered which are intuitively based on the completeness of catalog data for different magnitude ranges. Data Model-1 includes all catalog data since 1961 that has magnitude greater than 4.0, for seismicity estimation. The correlation distance of 50 km has been taken for smoothing of the α -values to accommodate uncertainty associated with the location characteristics of individual earthquakes. Data Model-2 includes all those earthquakes that have magnitudes greater than 5.0 since 1901 and it presumes that the future seismicity will continue to follow
54 Probabilistic Modeling of Earthquake Hazard in Stable Continental Shield of the Indian Peninsula
these locations. It is important to note that the hazard computed from this model is generally larger and is found to be more localized in nature compared to the Data Model-1 and, hence, it is important to use this model in the logic-tree analysis. From the hazard-estimation considerations, it is essential to include the recurrence characteristics of the large earthquakes in terms of equivalent damage intensities in the pre-instrumental period in most of the peninsular India. The rift zones of the peninsular shield have already experienced one of the largest and most devastating earthquakes in the last few centuries. Thus, it becomes imperative to include the effects of such large-magnitude earthquakes in terms of the seismic hazard for the entire peninsular India. Data Model-3 uses spatially smoothed α -values based on the magnitude 6.0 and above since 1600. The smoothed a-values using larger correlation distance of 100 km cover the possibility of location misinterpretation of these moderate-to-large magnitude earthquakes in the region. The estimated a-values in each of the data model represent total number of earthquakes in each grid greater than a certain lower bound value based on the completeness criteria. For Data Model-1, the estimated total number of earthquakes with magnitude greater than 0.4=wM per annum is 3.81 (corresponding to 160 earthquakes between 1961 and 2002). For Data Model-2, the estimated total number of earthquakes with magnitude greater than 0.5=wM per annum is 0.353 (corresponding to 36 earthquakes between 1901 and 2002). The activity rate in terms of the gridded a-values is obtained by counting the number of earthquakes greater than magnitude 5.0 in each grid. In the case of Data Model-3, i.e., in between 1601 and 2002, 15 earthquakes with magnitude greater than 0.6=wM have been reported, of which 10 earthquakes have occurred between 1841 and 2002, which is the complete part of the catalog. Thus the observed rate for magnitudes greater than 0.6=wM in Data Model-3 between 1601 and 2002 is less than the estimated rates based on the overall completeness criteria (between 1841 and 2002). Hence, a correction factor (which is a ratio of the rate of magnitude 6.0 and larger earthquakes between 1842 and 2002 to that between 1601 and 2002) of 1.665 is applied to arrive at the corrected rate of 0.0621. Data Model-3 assumes that the historic rates of 0.6=wM since 1600 are expected to underestimate the observed rate, since the available catalog information is not complete for the entire interval. The multiplying factor of 1.665 to the smoothed α -values corrects the activity rates for the magnitudes greater than 0.6=wM based on the completeness criteria. This factor also allows consideration of the possible misinterpretation of previous large-size events in terms of assigning intensity or due to incomplete knowledge of recurrence characteristics of such large events in the region.
CONVOLUTION TECHNIQUE
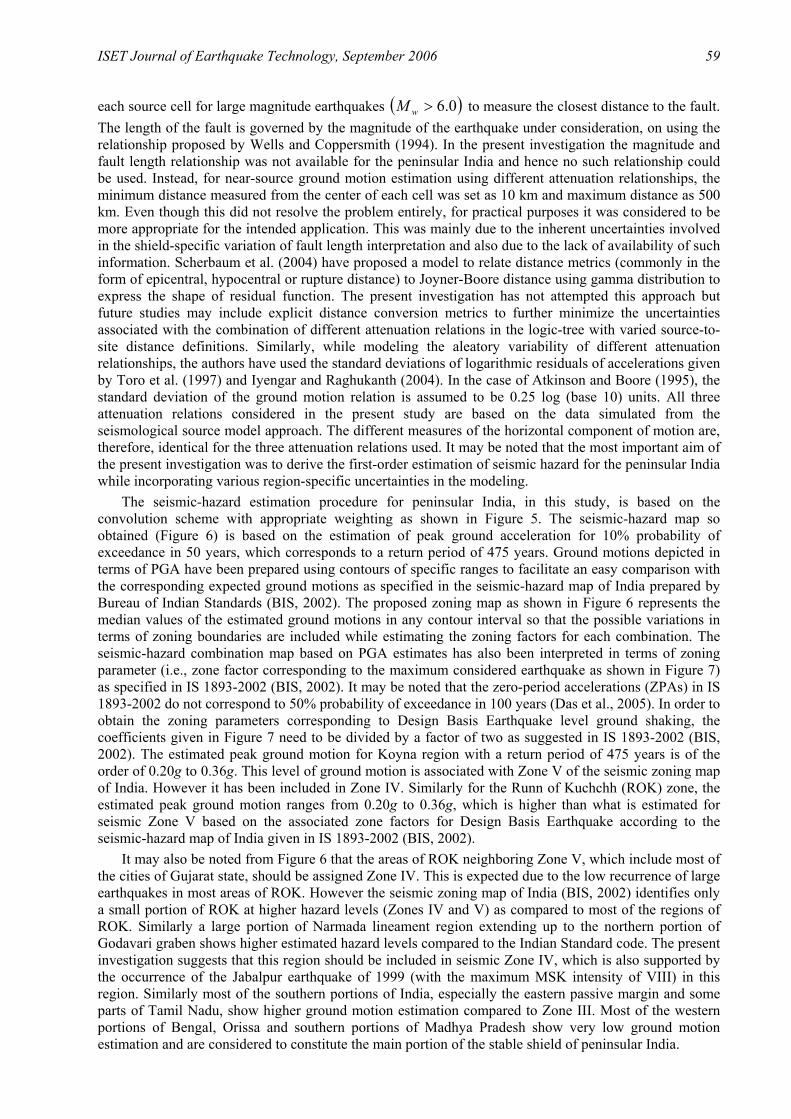
From the seismic-hazard consideration, a convolution technique has been used in the present study to include the spatial and temporal variations in the seismogenic activity associated with the peninsular India. These variations have been included using a suitable weighting scheme based on the relative importance of each of the models from known characteristics in the recent history. For the combinational analysis, each data model discussed above includes spatial variation in the a-values associated with that part of the catalog period. This has been included along with the influence from the overall known seismogenic characteristics in terms of the variation of b -values for each individual zone. The uncertainty has been modelled by considering four independent cases as discussed below.
1. Case-I: Uniform Seismicity
In the first case, a single b -value of 0.92 as based on the completeness criteria has been assigned to the entire peninsular India. The uniform maximum earthquake potential of 0.8max =M has been assigned to all zones of the peninsular India irrespective of their seismotectonic characteristics. This assumption is purely deterministic and primarily to model the possibility of having 2001 Bhuj earthquake in other places of peninsular India (e.g., Narmada basin, parts of western Maharashtra including Koyna belt). It is possible that the recurrence interval of such an earthquake ( )0.8max =M in the stable areas of shield, such as inactive grabens, is tens of thousands of years. However such an assumption does not cause a significant change in the estimated hazard (which is also dependent upon the region’s historic seismicity rates), especially in the desired exceedance probability range. This model assumes that the past
ISET Journal of Earthquake Technology, September 2006 55
seismic activity may continue in the future and that it will be associated with the regions where it has experienced past major earthquakes as dictated by the smoothed α -values. Thus the possibility of future large earthquakes in the region where they have not been observed in the limited history of the catalog has been included based on the historical seismic activity rate.
2. Case-II: Geo-based Seismicity
The catalog data, as discussed in the earlier sections, clearly indicates a few broad but important temporal and spatial variation characteristics in the entire region and those are considered in this case. A uniform b -value of 0.85 is assigned to all the rifting zones that include the Runn of Kuchchh, eastern and western Passive Margins, and grabens, whereas a higher b -value of 1.0 is assigned to all the cratonic regions of peninsular India. In this case, the maximum magnitude potential in each geologic zone has been based on the geological considerations following the criteria derived from the worldwide study of stable continental region seismicity (Frankel et al., 1996; Johnston, 1996). The maximum magnitude has been assumed to be 5.6max =M for cratons and 5.7max =M for rifting zones; however a relatively higher value of 0.8max =M has been taken for the Cambay graben (Runn of Kuchchh zone) based on its seismogenic characteristics and expectancy of larger earthquakes with a relatively shorter recurrence cycle.
3. Case-III: Reservoir-Induced Seismicity
In the third case, the effect of reservoir-associated seismicity has been introduced explicitly based on the observed seismicity rates for some of the reservoirs. In this, a uniform b -value of 0.91 has been used for the peninsular India excluding the 100×100 km area of known twenty reservoirs (Gupta, 1992). The relatively higher b -value of 0.95 has been estimated for all the earthquakes that occurred in this zone (100 ×100 km area) around each of these reservoirs and hence this value has been assigned to include the rate variation in the hazard analysis. It is important to note that the seismogenic characteristics and likely causes of occurrence of most of the near-reservoir earthquakes have not been investigated in great detail in the past. Large reservoirs in most of the peninsular shield acting as a possible source of induced seismic activity and the associated variation in the decay rate (b -value) for such smaller geographic regions has been considered as a conservative assumption in case of the hazard estimation for peninsular India.
4. Case-IV: Background Seismicity
It is important to note that for large portions of peninsular India (i.e., the quiet zones of cratons), historical catalog includes no information about the previous earthquake activity due to its relatively short time span. It is possible that many smaller magnitude earthquakes in these quiet zones have not been recorded due to a sparse instrumental network even during the last several decades. However, recent earthquakes have clearly shown that the parts of peninsular India that were assumed to be quiet earlier have some background seismic activity and have the potential of experiencing moderate damaging earthquakes in future. In fact, it has been found that even cratons show some local intra-plate activity (for example, Latur earthquake of 1993 with magnitude 3.6=wM ). Hence it is more realistic to model such seismicity in the form of background activity by assigning a uniform background seismic activity rate for these regions. This procedure has been used as one of the alternatives in the current investigation to model such future earthquakes. The background seismicity rate in the present case is taken as the seismicity rate prior to 1960s acting uniformly over the entire Indian Peninsula. In this model, a-values of the post-1960s data (which represents a better catalog information in terms of the recent activity in the entire peninsular India) are uniformly distributed over the entire peninsular India and included in the hazard analysis. In other words, all the earthquakes between 1962 and 2002 are distributed uniformly with the background decay rate ( b -value) all over the peninsular India. This allows a uniform earthquake activity rate to be assigned to each grid cell of the peninsular India irrespective of the actual locations of catalog earthquakes. The four cases discussed above are expected to broadly cover the overall seismicity rate variations in the different regions of peninsular India. It is important to note that the background seismicity model, as discussed above, has been considered as an additional model with equal weight in the combinational

56 Probabilistic Modeling of Earthquake Hazard in Stable Continental Shield of the Indian Peninsula
analysis, for studying the possible variations of seismic hazard in some of the quiet zones of peninsular India.
THEORETICAL BACKGROUND OF PSHA
Cornell (1968) pioneered the application of probabilistic scheme to model the earthquake hazard originating from different sources at a particular site by assuming earthquake occurrence as a stationary random process. This study also incorporated the effects of all potential sources of earthquake and the activity rates assigned to them. McGuire (1977) and Anderson and Trifunac (1978) introduced the probabilistic seismic-hazard analysis of Fourier and response spectra considering the dependence of spectral shape on magnitude, distance and local site conditions. Frankel (1995) proposed a zoneless seismic-hazard approach which is especially useful for the region where it is difficult to demarcate distinct seismic zone boundaries due to poor understanding of the tectonic settings that cause seismic activity in that region (e.g., Stable Continental Regions (SCRs), such as most of the Central and Eastern United States, Central Asia, Western Australia and peninsular India) and is popularly known as the zoneless hazard model. This method uses different time scale models for the given catalog data, based on different completeness criteria, to characterize earthquake hazard associated with the region. When evaluating seismic hazard for the peninsular India, all earthquakes that have occurred within the region between the years 1842 and 2002 have been included. A minimum magnitude min 5.0M = has been chosen for the hazard calculations, based on the observation that earthquakes of that size can cause damage to existing built environment in the region. This is due to prevailing poor construction practices and due to the large number of old buildings in the region, which are highly susceptible to damage due to moderate earthquakes (Sinha and Adarsh, 1999). For a given earthquake occurrence, the probability that a ground-motion parameter y will exceed a particular value miny can be computed by using the total probability theorem:
min min( ) ( ) ( ) ( | , )P y y f M f R P y y M R dR dM> = >∫ ∫ (3)
where ( )f M is the probability density function with respect to magnitude M and ( )f R is the probability density function with respect to distance R. min( | , )P y y M R> is the probability that a given earthquake
of magnitude M and distance R will result in the ground motion parameter exceeding miny .
In case of the hazard estimation of any geographic region consisting of N potential earthquake sources, each of which has an average threshold magnitude exceedance rate ( )minexpi i iMλ α β= − ,
the total average exceedance rate for the ground motion parameter in the region is given by
max
min
min1 0
( ) ( ) ( ) ( | , )MN
i i ii M
E y f M f R P y y M R dR dMλ∞
== >∑ ∫ ∫ (4)
Practically, for all realistic PSHAs, the individual components of Equation (4) are sufficiently complicated and therefore the integrals cannot be evaluated analytically. Frankel (1995) introduced a numerical integration technique to evaluate the total average exceedance rate due to a grid of point sources around each site with possibilities of different range of magnitudes and distances. The mean rate at a particular site is calculated by using all the a-values associated with each grid cell that is within the smoothening distance range from the site. Thus for each site, the values of ia are summed in proportion to distance from that site, so that the totals of ia values are represented as ia values for the cells within a certain distance increment of the site. The annual rate ( )minyy >λ of exceeding ground motion miny at a specified site is determined from a sum over distance D and magnitude M:
( ) ( )10 reflog /min min( ) 10 ( | , )k la T b M M
k lk l
y y P y y D Mλ − − > = >∑∑ (5)

ISET Journal of Earthquake Technology, September 2006 57
where T is the duration of catalog completeness for each reference magnitude refM based on the completeness criteria as obtained in the earlier section and given in Table 1. The first sum in the above equation is taken over k distance ranges and the second sum is taken over l magnitude ranges.
The term [ ]min | ,k lP y y D M> in Equation (5) represents the probability of exceedance of the
ground motion miny when an earthquake of magnitude lM occurs at kD distance from the site. This probability is dependent on the attenuation relation and the standard deviation of the specified ground motion for any specific distance, i.e., the ground motion component associated with such magnitude and distance at that location could be predicted in terms of an attenuation relation. The present investigation uses three different attenuation relations: (1) Iyengar and Raghukanth (2004) relationship, which has recently become available for peninsular India, (2) Atkinson and Boore (1995) relationship, and (3) Toro et al. (1997) relationship, which is another well-established attenuation relationship proposed for the Eastern North America region. Both Eastern North America and peninsular India regions share similar features not only in terms of observed seismogenic activities and known seismotectonics, as discussed by Schweig et al. (2003) and Cramer and Kumar (2003), but there are similarities in the crustal Q parameters also as studied by Singh et al. (2004). Bodin et al. (2004) studied the aftershock data of Bhuj earthquake and found that the seismic wave attenuation in the Kachchh crust is very low and is quite comparable with the attenuation characteristics in Central and Eastern United States (CEUS). The use of these three attenuation relationships with different weights in the logic tree accounts for the uncertainties involved in the ground-motion modeling in the hazard assessment. The logarithms of ground motion characteristics, say peak ground acceleration (PGA) or pseudo spectral acceleration (PSA), are generally assumed to be normally distributed, and hence the standard normal variable associated with such uncertainty is given as
* min
ln PGA
ln PGA ln yzσ
−= (6)
where ln PGAσ is the standard deviation of the logarithm of PGA. The attenuation relationship predicts ln PGA based on the combination of magnitude and distance. Using the standard deviation of ln PGA given in each attenuation relation, the standard normal variable corresponding to the exceedance probabilities for various target peak accelerations, e.g. ln (0.01g), can be estimated by using Equation (6). The annual probability of exceeding miny is essentially equal to the annual rate of exceedance
( )miny yλ > , or to the annual probability of exceedance of interest. In the present investigation, the earthquake occurrence is assumed to have Poisson distribution with time-independent hazard rate. A well-known algorithm developed by Frankel et al. (1996) based on an error function technique has been used in the present investigation for numerically estimating the exceedance probability. The exceedance level for estimating median hazard estimates has been taken as corresponding to 10% probability of occurrence in 50 years, thus giving average return period of approximately 475 years or exceedance frequency of 0.0021 per year. For several values of miny , the ground motion with 10% probability of occurrence in 50 years has been calculated using an interpolation technique. The ground motion that contributes hazard at this level of probability is generally considered for the estimation of earthquake forces in earthquake-resistant design practices.
HAZARD ASSESSMENT
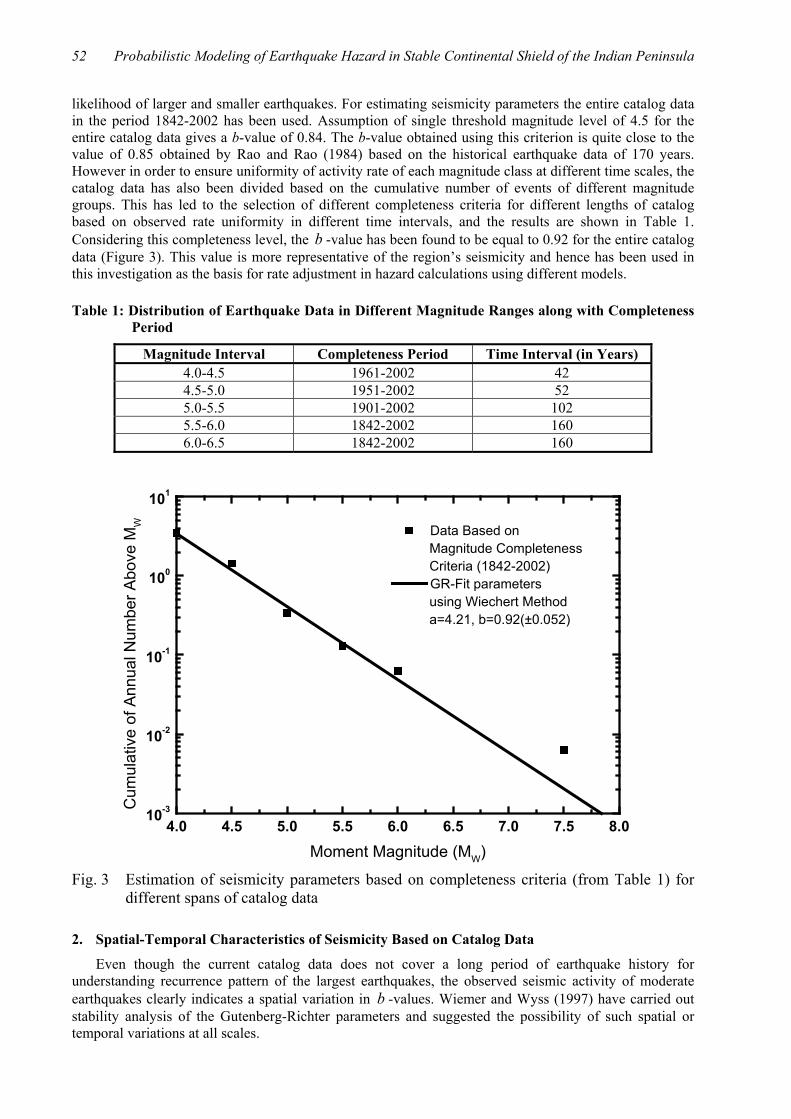
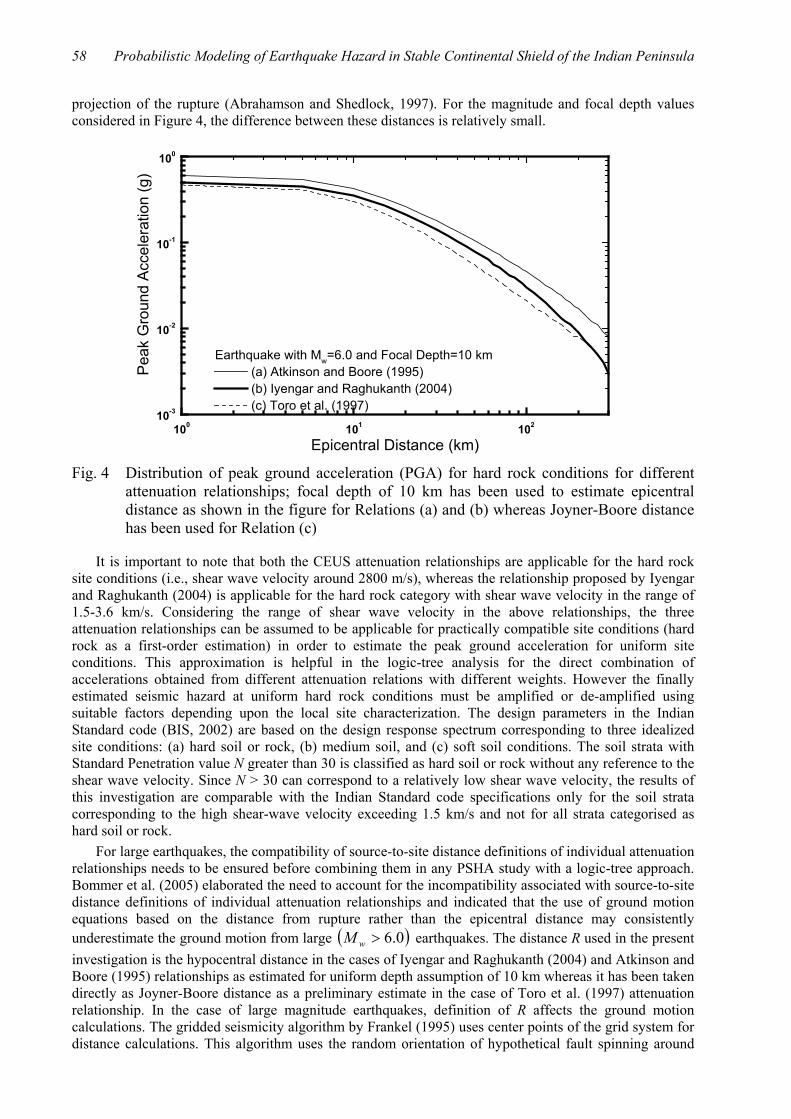
The seismic-hazard estimation procedure used in this investigation is based on the zoneless seismic-hazard approach initially proposed by Frankel (1995), as discussed earlier. In the present investigation, three attenuation relationships as shown in Figure 4 have been used with different weights. The Iyengar and Raghukanth (2004) relationship for peak ground acceleration is based on the recent large earthquakes in peninsular India. This is considered to be more representative of the attenuation characteristics of the region and hence is given twice the weight as compared to the other two relationships, i.e., those by Atkinson and Boore (1995) and Toro et al. (1997). Both these relationships are well established and rigorously studied ground motion models and have been given equal weights. The relationships by Atkinson and Boore (1995) and Iyengar and Raghukanth (2004) use the epicentral distance while that by Toro et al. (1997) uses the Joyner-Boore distance which is the closest horizontal distance to the vertical
58 Probabilistic Modeling of Earthquake Hazard in Stable Continental Shield of the Indian Peninsula
projection of the rupture (Abrahamson and Shedlock, 1997). For the magnitude and focal depth values considered in Figure 4, the difference between these distances is relatively small.
100 101 10210-3
10-2
10-1
100
Earthquake with Mw=6.0 and Focal Depth=10 km (a) Atkinson and Boore (1995) (b) Iyengar and Raghukanth (2004) (c) Toro et al. (1997)
Pea
k G
roun
d A
ccel
erat
ion
(g)
Epicentral Distance (km)
Fig. 4 Distribution of peak ground acceleration (PGA) for hard rock conditions for different attenuation relationships; focal depth of 10 km has been used to estimate epicentral distance as shown in the figure for Relations (a) and (b) whereas Joyner-Boore distance has been used for Relation (c)
It is important to note that both the CEUS attenuation relationships are applicable for the hard rock site conditions (i.e., shear wave velocity around 2800 m/s), whereas the relationship proposed by Iyengar and Raghukanth (2004) is applicable for the hard rock category with shear wave velocity in the range of 1.5-3.6 km/s. Considering the range of shear wave velocity in the above relationships, the three attenuation relationships can be assumed to be applicable for practically compatible site conditions (hard rock as a first-order estimation) in order to estimate the peak ground acceleration for uniform site conditions. This approximation is helpful in the logic-tree analysis for the direct combination of accelerations obtained from different attenuation relations with different weights. However the finally estimated seismic hazard at uniform hard rock conditions must be amplified or de-amplified using suitable factors depending upon the local site characterization. The design parameters in the Indian Standard code (BIS, 2002) are based on the design response spectrum corresponding to three idealized site conditions: (a) hard soil or rock, (b) medium soil, and (c) soft soil conditions. The soil strata with Standard Penetration value N greater than 30 is classified as hard soil or rock without any reference to the shear wave velocity. Since N > 30 can correspond to a relatively low shear wave velocity, the results of this investigation are comparable with the Indian Standard code specifications only for the soil strata corresponding to the high shear-wave velocity exceeding 1.5 km/s and not for all strata categorised as hard soil or rock. For large earthquakes, the compatibility of source-to-site distance definitions of individual attenuation relationships needs to be ensured before combining them in any PSHA study with a logic-tree approach. Bommer et al. (2005) elaborated the need to account for the incompatibility associated with source-to-site distance definitions of individual attenuation relationships and indicated that the use of ground motion equations based on the distance from rupture rather than the epicentral distance may consistently underestimate the ground motion from large ( )0.6>wM earthquakes. The distance R used in the present investigation is the hypocentral distance in the cases of Iyengar and Raghukanth (2004) and Atkinson and Boore (1995) relationships as estimated for uniform depth assumption of 10 km whereas it has been taken directly as Joyner-Boore distance as a preliminary estimate in the case of Toro et al. (1997) attenuation relationship. In the case of large magnitude earthquakes, definition of R affects the ground motion calculations. The gridded seismicity algorithm by Frankel (1995) uses center points of the grid system for distance calculations. This algorithm uses the random orientation of hypothetical fault spinning around
ISET Journal of Earthquake Technology, September 2006 59
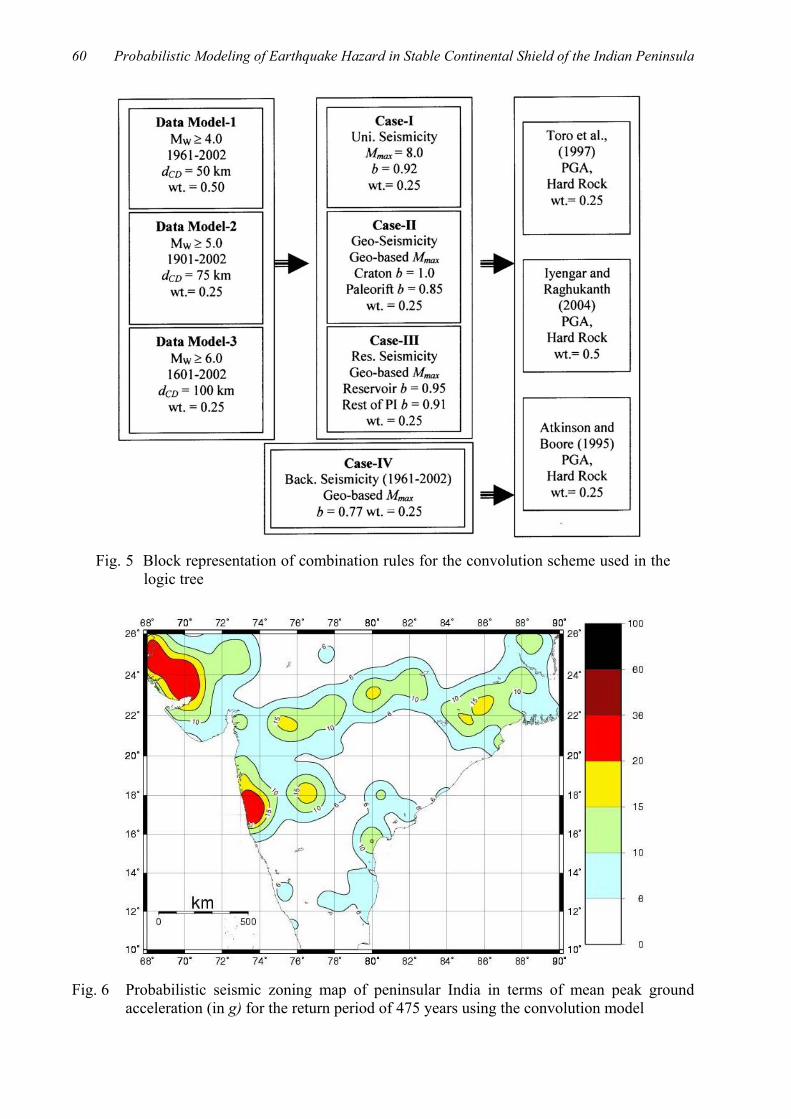
each source cell for large magnitude earthquakes ( )0.6>wM to measure the closest distance to the fault. The length of the fault is governed by the magnitude of the earthquake under consideration, on using the relationship proposed by Wells and Coppersmith (1994). In the present investigation the magnitude and fault length relationship was not available for the peninsular India and hence no such relationship could be used. Instead, for near-source ground motion estimation using different attenuation relationships, the minimum distance measured from the center of each cell was set as 10 km and maximum distance as 500 km. Even though this did not resolve the problem entirely, for practical purposes it was considered to be more appropriate for the intended application. This was mainly due to the inherent uncertainties involved in the shield-specific variation of fault length interpretation and also due to the lack of availability of such information. Scherbaum et al. (2004) have proposed a model to relate distance metrics (commonly in the form of epicentral, hypocentral or rupture distance) to Joyner-Boore distance using gamma distribution to express the shape of residual function. The present investigation has not attempted this approach but future studies may include explicit distance conversion metrics to further minimize the uncertainties associated with the combination of different attenuation relations in the logic-tree with varied source-to-site distance definitions. Similarly, while modeling the aleatory variability of different attenuation relationships, the authors have used the standard deviations of logarithmic residuals of accelerations given by Toro et al. (1997) and Iyengar and Raghukanth (2004). In the case of Atkinson and Boore (1995), the standard deviation of the ground motion relation is assumed to be 0.25 log (base 10) units. All three attenuation relations considered in the present study are based on the data simulated from the seismological source model approach. The different measures of the horizontal component of motion are, therefore, identical for the three attenuation relations used. It may be noted that the most important aim of the present investigation was to derive the first-order estimation of seismic hazard for the peninsular India while incorporating various region-specific uncertainties in the modeling. The seismic-hazard estimation procedure for peninsular India, in this study, is based on the convolution scheme with appropriate weighting as shown in Figure 5. The seismic-hazard map so obtained (Figure 6) is based on the estimation of peak ground acceleration for 10% probability of exceedance in 50 years, which corresponds to a return period of 475 years. Ground motions depicted in terms of PGA have been prepared using contours of specific ranges to facilitate an easy comparison with the corresponding expected ground motions as specified in the seismic-hazard map of India prepared by Bureau of Indian Standards (BIS, 2002). The proposed zoning map as shown in Figure 6 represents the median values of the estimated ground motions in any contour interval so that the possible variations in terms of zoning boundaries are included while estimating the zoning factors for each combination. The seismic-hazard combination map based on PGA estimates has also been interpreted in terms of zoning parameter (i.e., zone factor corresponding to the maximum considered earthquake as shown in Figure 7) as specified in IS 1893-2002 (BIS, 2002). It may be noted that the zero-period accelerations (ZPAs) in IS 1893-2002 do not correspond to 50% probability of exceedance in 100 years (Das et al., 2005). In order to obtain the zoning parameters corresponding to Design Basis Earthquake level ground shaking, the coefficients given in Figure 7 need to be divided by a factor of two as suggested in IS 1893-2002 (BIS, 2002). The estimated peak ground motion for Koyna region with a return period of 475 years is of the order of 0.20g to 0.36g. This level of ground motion is associated with Zone V of the seismic zoning map of India. However it has been included in Zone IV. Similarly for the Runn of Kuchchh (ROK) zone, the estimated peak ground motion ranges from 0.20g to 0.36g, which is higher than what is estimated for seismic Zone V based on the associated zone factors for Design Basis Earthquake according to the seismic-hazard map of India given in IS 1893-2002 (BIS, 2002). It may also be noted from Figure 6 that the areas of ROK neighboring Zone V, which include most of the cities of Gujarat state, should be assigned Zone IV. This is expected due to the low recurrence of large earthquakes in most areas of ROK. However the seismic zoning map of India (BIS, 2002) identifies only a small portion of ROK at higher hazard levels (Zones IV and V) as compared to most of the regions of ROK. Similarly a large portion of Narmada lineament region extending up to the northern portion of Godavari graben shows higher estimated hazard levels compared to the Indian Standard code. The present investigation suggests that this region should be included in seismic Zone IV, which is also supported by the occurrence of the Jabalpur earthquake of 1999 (with the maximum MSK intensity of VIII) in this region. Similarly most of the southern portions of India, especially the eastern passive margin and some parts of Tamil Nadu, show higher ground motion estimation compared to Zone III. Most of the western portions of Bengal, Orissa and southern portions of Madhya Pradesh show very low ground motion estimation and are considered to constitute the main portion of the stable shield of peninsular India.
60 Probabilistic Modeling of Earthquake Hazard in Stable Continental Shield of the Indian Peninsula
Fig. 5 Block representation of combination rules for the convolution scheme used in the
logic tree
Fig. 6 Probabilistic seismic zoning map of peninsular India in terms of mean peak ground
acceleration (in g) for the return period of 475 years using the convolution model

ISET Journal of Earthquake Technology, September 2006 61
Fig. 7 Seismic zoning map of India with zone factors corresponding to the maximum
considered earthquakes (MCEs) in the region (BIS, 2002); these factors are reduced by half in order to estimate the factors associated with the design basis earthquakes (i.e., the earthquake-induced ground motions that have 10% exceedance chance in 50 years of design life of structures)
DISCUSSION AND CONCLUSIONS
The evaluation of seismic hazard associated with peninsular India under a probabilistic framework has been described in this paper. The most recent knowledge of seismic activity in the region has been used to estimate the hazard while incorporating uncertainties associated with different modeling parameters. Throughout this paper, the data-related uncertainties that can be associated with the existing catalog as well as the uncertainties associated with the seismicity rates estimates or other parameters involved in the hazard analysis have been discussed. The results presented in the present investigation are in the form of peak ground accelerations corresponding to 10% exceedance probability in 50 years. Further studies may consider the development of seismic-hazard map in terms of spectral accelerations for different time periods, which will be directly useful for the structural engineering applications. Based on the present investigation of seismic hazard of peninsular India, following conclusions can be drawn: • The lack of comprehensive knowledge about the occurrence of earthquakes in most Stable
Continental Regions such as peninsular India can be accounted for by using probabilistic analysis that includes the uncertainties in assessments of different parameters as well as combinations of different models by using a convolution scheme. A probabilistic seismic-hazard map for the peninsular India has been developed using this approach.
• The use of a single b -value for the entire region including large cratonic and rift zones is not a correct approach for incorporating spatial rate patterns, since recent seismogenic characteristics
62 Probabilistic Modeling of Earthquake Hazard in Stable Continental Shield of the Indian Peninsula
clearly indicate possible temporal and spatial variations in terms of seismicity. This deficiency has affected the modeling of large magnitude earthquakes in earlier studies since recurrence of such events has been found to be low in rift systems. The effect of reservoir-induced seismicity has also been incorporated in the hazard modeling in the present investigation.
• The zoneless seismic-hazard estimation approach proposed by Frankel (1995) has been modified to incorporate spatial and temporal variations in terms of b -values. The estimated seismic hazard for different regions of peninsular India clearly indicates the influence of recent variations in the seismic activity in the regions, thereby resulting in higher levels of hazard for most of the rifting zones.
• The results obtained from the present investigation clearly indicate higher seismic hazard for several regions of peninsular India as compared to the existing specifications in IS 1893-2002 (BIS, 2002). Further research may include accurate source delineation at micro-level, assessment of source-specific geophysical parameters and its verification based on paleoseismic and geodetic considerations, and incorporation of associated uncertainties, in order to have an even better assessment of the seismic hazard for peninsular India.
• The authors have made several assumptions during the modeling process, such as the selection of the attenuation models, source-site distance criteria for near-source attenuation, maximum magnitude assignment for different regions, reservoir or background seismicity modeling, and weighting scheme in the logic tree. The seismic zoning map presented in the paper is intended to highlight the influence of these parameters. The authors feel that it is possible to carry out further improvements in the preliminary zoning map presented in the paper based on emerging multi-disciplinary research before a definitive zoning map can be developed.
ACKNOWLEDGEMENTS
The authors have modified the United States Geological Survey (USGS) seismic-hazard mapping software (Frankel et al., 1996) for estimating the seismic hazard with spatial variations of seismicity parameters, and appreciate access to the original software source code. The authors have benefited from useful suggestions by Dr. Charles Mueller and Dr. Mark Petersen of USGS during this research. The authors also gratefully acknowledge the useful suggestions given by Dr. Julian J. Bommer, which have helped to improve the original manuscript of the paper. The authors acknowledge the partial support for this research that has been provided by Department of Science and Technology, Government of India through research grant No. DST/23(289)/SU/2001.
REFERENCES
1. Abrahamson, N.A. and Shedlock, K.M. (1997). “Overview”, Seismological Research Letters, Vol. 68, No. 1, pp. 9-23.
2. Anderson, J.G. and Trifunac, M.D. (1978). “Uniform Risk Functionals for Characterization of Strong Ground Motion”, Bulletin of the Seismological Society of America, Vol. 68, No. 1, pp. 205-218.
3. Atkinson, G.M. and Boore, D.M. (1995). “Ground-Motion Relations for Eastern North America”, Bulletin of the Seismological Society of America, Vol. 85, No. 1, pp. 17-30.
4. Bhatia, S.C., Ravi Kumar, M. and Gupta, H.K. (1999). “A Probabilistic Seismic Hazard Map of India and Adjoining Regions”, Annali di Geofisica, Vol. 42, No. 6, pp. 1153-1166.
5. BIS (2002). “IS 1893 (Part 1)-2002: Indian Standard Criteria for Earthquake Resistant Design of Structures, Part 1 – General Provisions and Buildings”, Bureau of Indian Standards, New Delhi.
6. Bodin, P., Malagnini, L. and Akinci, A. (2004). “Ground-Motion Scaling in the Kachchh Basin, India, Deduced from Aftershocks of the 2001 Mw 7.6 Bhuj Earthquake”, Bulletin of the Seismological Society of America, Vol. 94, No. 5, pp. 1658-1669.
7. Bommer, J.J., Scherbaum, F., Bungum, H., Cotton, F., Sabetta, F. and Abrahamson, N.A. (2005). “On the Use of Logic Trees for Ground-Motion Prediction Equations in Seismic-Hazard Analysis”, Bulletin of the Seismological Society of America, Vol. 95, No. 2, pp. 377-389.
8. Cornell, C.A. (1968). “Engineering Seismic Risk Analysis”, Bulletin of the Seismological Society of America, Vol. 58, No. 5, pp. 1583-1606.
ISET Journal of Earthquake Technology, September 2006 63
9. Cramer, C.H. (2001). “The New Madrid Seismic Zone: Capturing Variability in Seismic Hazard Analyses”, Seismological Research Letters, Vol. 72, No. 6, pp. 664-672.
10. Cramer, C.H. and Kumar, A. (2003). “2001 Bhuj, India, Earthquake Engineering Seismoscope Recordings and Eastern North America Ground-Motion Attenuation Relations”, Bulletin of the Seismological Society of America, Vol. 93, No. 3, pp. 1390-1394.
11. Cramer, C.H., Wheeler, R.L. and Mueller, C.S. (2002). “Uncertainty Analysis for Seismic Hazard in the Southern Illinois Basin”, Seismological Research Letters, Vol. 73, No. 5, pp. 792-805.
12. Das, S., Gupta, V.K. and Gupta, I.D. (2005). “Codal Provisions of Seismic Hazard in Northeast India”, Current Science, Vol. 89, No. 12, pp. 2004-2008.
13. Frankel, A. (1995). “Mapping Seismic Hazard in the Central Eastern United States”, Seismological Research Letters, Vol. 66, No. 4, pp. 8-21.
14. Frankel, A., Mueller, C., Barnhard, T., Perkins, D., Leyendecker, E.V., Dickman, N., Hanson, S. and Hopper, M. (1996). “National Seismic-Hazard Maps: Documentation June 1996”, Open-File Report 96-532, United States Geological Survey, Denver, U.S.A.
15. Gupta, H.K. (1992). “Reservoir-Induced Earthquakes”, Current Science, Vol. 62, Nos. 1 & 2, pp. 183-198.
16. Iyengar, R.N. and Raghukanth, S.T.G. (2004). “Attenuation of Strong Ground Motion in Peninsular India”, Seismological Research Letters, Vol. 75, No. 4, pp. 530-540.
17. Jaiswal, K. (2006). “Probabilistic Seismic Hazard Estimation Methodology for Stable Continental Regions Incorporating Spatial and Temporal Uncertainties”, Ph.D. Thesis, Indian Institute of Technology Bombay, Mumbai.
18. Johnston, A.C. (1996). “Seismic Moment Assessment of Earthquakes in Stable Continental Regions, Part-I: Instrumental Seismicity”, Geophysical Journal International, Vol. 124, No. 2, pp. 381-414.
19. McGuire, R.K. (1977). “Seismic Design Spectra and Mapping Procedures Using Hazard Analysis Based Directly on Oscillator Response”, Earthquake Engineering and Structural Dynamics, Vol. 5, pp. 211-234.
20. Rajendran, C.P. (2000). “Using Geological Data for Earthquake Studies: A Perspective from Peninsular India”, Current Science, Vol. 79, No. 9, pp. 1251-1258.
21. Rao, B.R. and Rao, P.S. (1984). “Historical Seismicity of Peninsular India”, Bulletin of the Seismological Society of America, Vol. 74, No. 6, pp. 2519-2533.
22. Rastogi, B.K. (1994). “Latur Earthquake: Not Triggered” in “Latur Earthquake (edited by H.K. Gupta)”, Memoir No. 35, Geological Society of India, Kolkata.
23. Scherbaum, F., Schmedes, J. and Cotton, F. (2004). “On the Conversion of Source-to-Site Distance Measures for Extended Earthquake Source Models”, Bulletin of the Seismological Society of America, Vol. 94, No. 3, pp. 1053-1069.
24. Schweig, E., Gomberg, J., Petersen, M., Ellis, M., Bodin, P., Mayrose, L. and Rastogi, B.K. (2003). “The Mw 7.7 Bhuj Earthquake: Global Lessons for Earthquake Hazard in Intra-plate Regions”, Journal of the Geological Society of India, Vol. 61, No. 3, pp. 277-282.
25. Seeber, L., Armbruster, J.G. and Jacob, K.H. (1999). “Probabilistic Assessment of Earthquake Hazard for the State of Maharashtra”, Unpublished Report, Earthquake Rehabilitation Cell, Government of Maharashtra, Mumbai.
26. Singh, S.K., Pacheco, J.F., Bansal, B.K., Campos, P., Dattatrayam, R.S. and Suresh, G. (2004). “A Source Study of the Bhuj, India, Earthquake of 26 January 2001 (Mw 7.6)”, Bulletin of the Seismological Society of America, Vol. 94, No. 4, pp. 1195-1206.
27. Sinha, R. and Adarsh, N. (1999). “A Postulated Earthquake Damage Scenario for Mumbai”, ISET Journal of Earthquake Technology, Vol. 36, No. 2-4, pp. 169-176.
28. Toro, G.R., Abrahamson, N.A. and Schneider, J.F. (1997). “Model of Strong Ground Motions from Earthquakes in Central and Eastern North America: Best Estimates and Uncertainties”, Seismological Research Letters, Vol. 68, No. 1, pp. 41-57.
29. Valdiya, K.S. (1973). “Tectonic Framework of India: A Review and Interpretation of Recent Structural and Tectonic Studies”, Geophysical Research Bulletin, Vol. 11, pp. 79-114.
64 Probabilistic Modeling of Earthquake Hazard in Stable Continental Shield of the Indian Peninsula
30. Wells, D.L. and Coppersmith, K.J. (1994). “New Empirical Relationships among Magnitude, Rupture Length, Rupture Width, Rupture Area and Surface Displacement”, Bulletin of the Seismological Society of America, Vol. 84, No. 4, pp. 974-1002.
31. Wiemer, S. and Wyss, M. (1997). “Mapping the Frequency-Magnitude Distribution in Asperities: An Improved Technique to Calculate Recurrence Times”, Journal of Geophysical Research, Vol. 102, No. 15, pp. 115-128.