probabilistic performance-based earthquake...
TRANSCRIPT

Probabilistic Performance-based Earthquake Engineering
K H A L I D M . M O S A L A M , P R O F E S S O R
S T R U C T U R A L E N G I N E E R I N G , M E C H A N I C S & M A T E R I A L S
D E P A R T M E N T O F C I V I L & E N V I R O N M E N T A L E N G I N E E R I N G
U N I V E R S I T Y O F C A L I F O R N I A , B E R K E L E Y
A C K N O W L E D G E M E N T S :
F I B T A S K G R O U P 7 . 7 : P R O B A B I L I S T I C P E R F O R M A N C E - B A S E D S E I S M I C D E S I G N
D R . S E L I M G Ü N A Y , U C - B E R K E L E Y
Probabilistic Performance-based Earthquake Engineering, Tongji University, Shanghai, China, Dec. 17-18, 2015
Course Outline 1/2
2
Part I:
1. PBEE assessment methods
Conditional probability approaches such as SAC/FEMA & PEER formulations
Unconditional probabilistic approach
Questions
2. PBEE design methods
Optimization-based methods
Non optimization-based methods
Questions
3. PEER PBEE formulation demonstrated for electric substation equipment
Introduction
Hazard analysis
Structural analysis
Damage analysis
Loss analysis
Combination of analyses
Questions
Probabilistic Performance-based Earthquake Engineering, Tongji University, Shanghai, China, Dec. 17-18, 2015
Course Outline 2/2
3
Part II:
1. Application 1: Evaluation of the effect of unreinforced masonry infill walls on reinforced concrete frames with probabilistic PBEE
Questions
2. Application 2: PEER PBEE assessment of a shearwall building located on the University of California, Berkeley campus
Questions
3. Application 3: Evaluation of the seismic response of structural insulated panels with probabilistic PBEE
Questions
4. Future extension to multi-objective performance-based sustainable design
5. Recapitulation
Probabilistic Performance-based Earthquake Engineering, Tongji University, Shanghai, China, Dec. 17-18, 2015

Outline
4
1. Application 1: Evaluation of the effect of unreinforced masonry
infill walls on reinforced concrete frames with probabilistic PBEE
2. Application 2: PEER PBEE assessment of a shearwall building
located on the University of California, Berkeley, campus
3. Application 3: Evaluation of the seismic response of structural
insulated panels with probabilistic PBEE
Probabilistic Performance-based Earthquake Engineering, Tongji University, Shanghai, China, Dec. 17-18, 2015

II-1 Application 1
KHALID M. MOSALAM, PROFESSOR
UNIVERSITY OF CALIFORNIA, BERKELEY
Probabilistic Performance-based Earthquake Engineering, Tongji University, Shanghai, China, Dec. 17-18, 2015
6
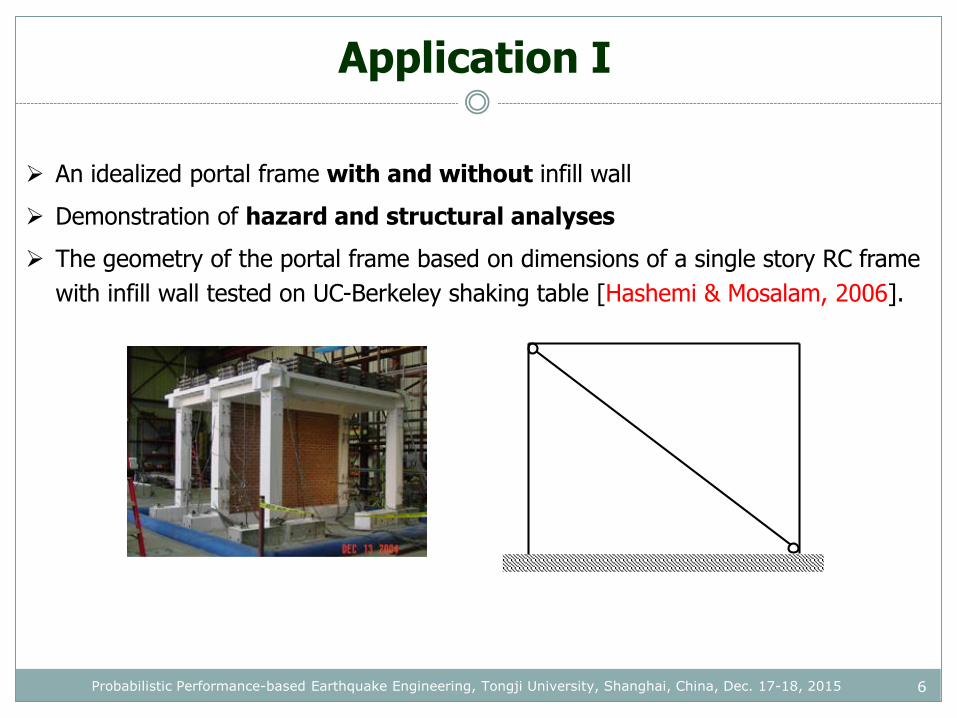
An idealized portal frame with and without infill wall
Demonstration of hazard and structural analyses
The geometry of the portal frame based on dimensions of a single story RC frame
with infill wall tested on UC-Berkeley shaking table [Hashemi & Mosalam, 2006].
Application I
Prototype structure
A1 A2
B1 B2
C1C2
A3 A4
B3 B4
C4
Development
and validation of
FE model
Verification of
hybrid simulation
with sub-
structuring
Development of generalized
hybrid simulation framework
Infill-RC
frame
interaction
Damage sequence
and collapse
mechanism
Development of
element removal
algorithms
Improvement of RC
constitutive material
& damage models
Development of
new SAT
models
Progressive collapse analysis
for RC structures with URM
infill walls
Shake-
table
tests
Pseudo-
dynamic
tests
Numerical
simulations on URM
infill walls
Reliability analysis for
performance evaluation
of RC structures with
URM infill walls
Development of
error-free
hybrid
simulation
Mixed variables
(displacement/force)
control for flexible/
stiff structures
Error
compensation in
displacement
control
1
2 3
4 5 67
8 9 10
11 12
14
15 16 1817
Development of
element removal
criteria13
Prototype structure
A1 A2
B1 B2
C1C2
A3 A4
B3 B4
C4
Development
and validation of
FE model
Verification of
hybrid simulation
with sub-
structuring
Development of generalized
hybrid simulation framework
Infill-RC
frame
interaction
Damage sequence
and collapse
mechanism
Development of
element removal
algorithms
Improvement of RC
constitutive material
& damage models
Development of
new SAT
models
Progressive collapse analysis
for RC structures with URM
infill walls
Shake-
table
tests
Shake-
table
tests
Pseudo-
dynamic
tests
Pseudo-
dynamic
tests
Numerical
simulations on URM
infill walls
Reliability analysis for
performance evaluation
of RC structures with
URM infill walls
Development of
error-free
hybrid
simulation
Mixed variables
(displacement/force)
control for flexible/
stiff structures
Error
compensation in
displacement
control
1
2 3
4 5 67
8 9 10
11 12
14
15 16 1817
Development of
element removal
criteria13
Probabilistic Performance-based Earthquake Engineering, Tongji University, Shanghai, China, Dec. 17-18, 2015

7
Application I
Hazard Analysis
UC Berkeley campus
Location of the structure: @North gate of campus (37.877˚, -122.264˚)
Site class: NEHRP D
Probabilistic Performance-based Earthquake Engineering, Tongji University, Shanghai, China, Dec. 17-18, 2015

8
Application I
Hazard Analysis
Source: USGS
Probabilistic Performance-based Earthquake Engineering, Tongji University, Shanghai, China, Dec. 17-18, 2015
9
Application I
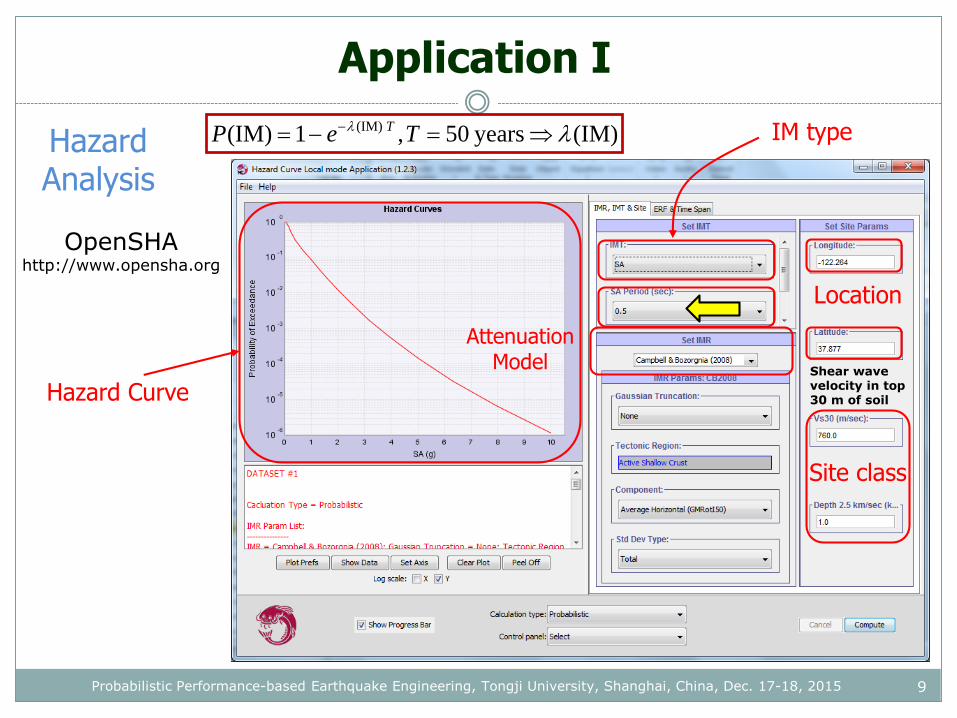
Hazard Analysis
OpenSHAhttp://www.opensha.org
Location
Site class
IM type
Attenuation Model
Hazard CurveShear wave velocity in top 30 m of soil
(IM) years50,1(IM) (IM) TeP T
Probabilistic Performance-based Earthquake Engineering, Tongji University, Shanghai, China, Dec. 17-18, 2015
10
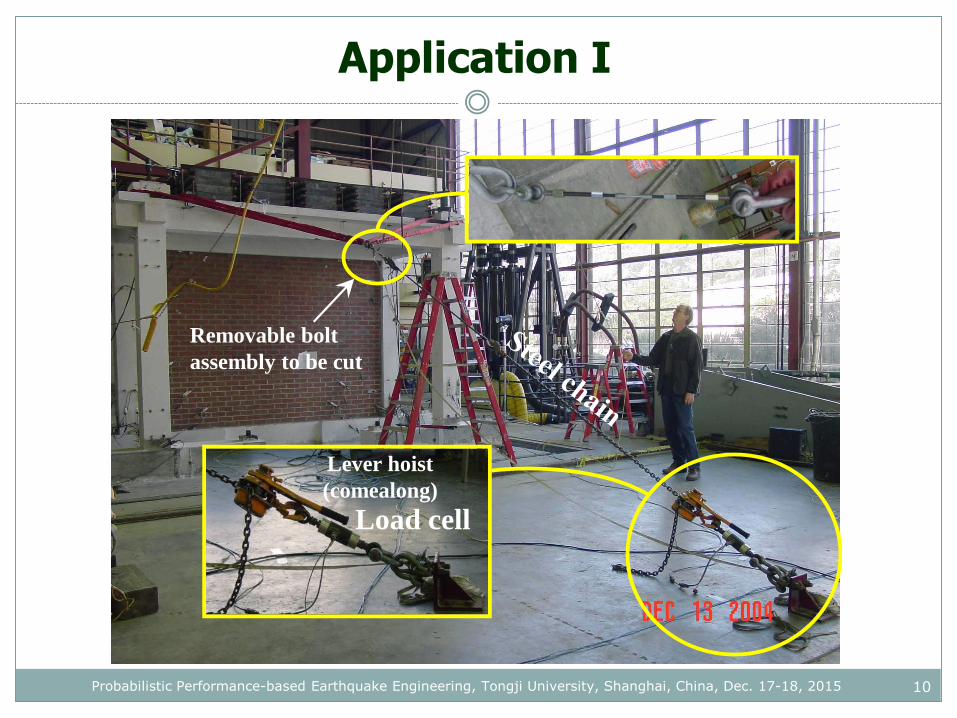
Application I
Probabilistic Performance-based Earthquake Engineering, Tongji University, Shanghai, China, Dec. 17-18, 2015
Removable bolt
assembly to be cut
Load cell
Lever hoist
(comealong)

11
Application I
Hazard Analysis: Hazard Curve
Hazard is more severe for the bare frame at this particular location
10-2
10-1
100
101
10-8
10-6
10-4
10-2
100
Sa (g)
Me
an
an
nu
al fr
eq
ue
ncy o
f e
xce
ed
an
ce
Tn=0.1 sec - Infilled Frame
Tn=0.5 sec - Bare Frame
Probabilistic Performance-based Earthquake Engineering, Tongji University, Shanghai, China, Dec. 17-18, 2015
12
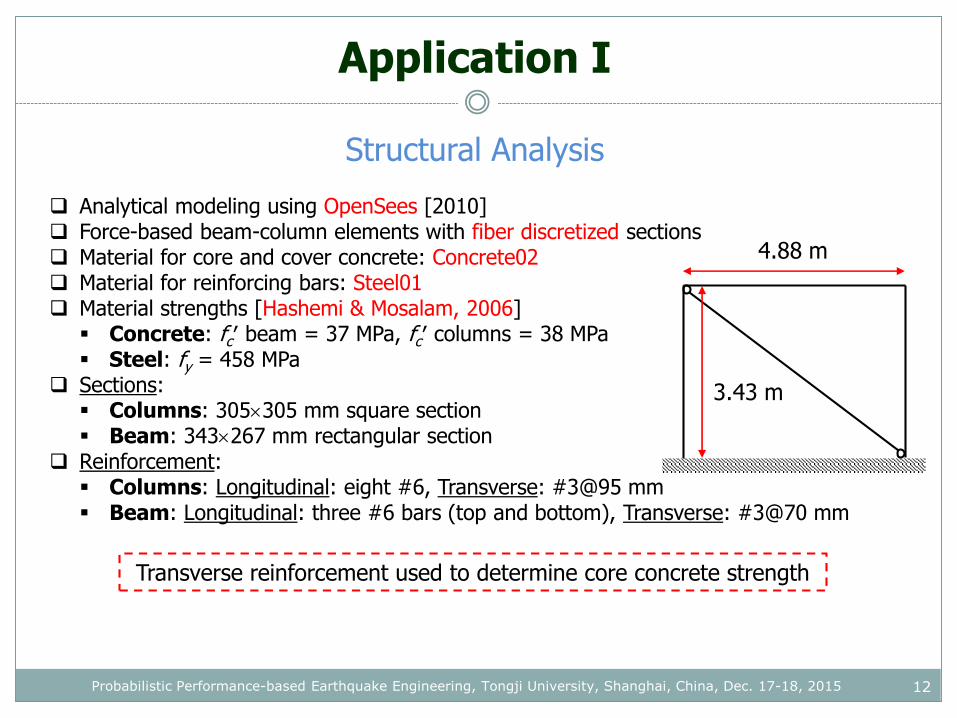
Application I
Structural Analysis
Analytical modeling using OpenSees [2010] Force-based beam-column elements with fiber discretized sections Material for core and cover concrete: Concrete02 Material for reinforcing bars: Steel01 Material strengths [Hashemi & Mosalam, 2006] Concrete: fcʹ beam = 37 MPa, fcʹ columns = 38 MPa Steel: fy = 458 MPa
Sections: Columns: 305305 mm square section Beam: 343267 mm rectangular section
Reinforcement: Columns: Longitudinal: eight #6, Transverse: #3@95 mm Beam: Longitudinal: three #6 bars (top and bottom), Transverse: #3@70 mm
4.88 m
3.43 m
Transverse reinforcement used to determine core concrete strength
Probabilistic Performance-based Earthquake Engineering, Tongji University, Shanghai, China, Dec. 17-18, 2015
13
Application I
Structural Analysis
Twenty ground motions [Lee & Mosalam, 2006] used in nonlinear time history
analyses (explanation later in Application II)
Ground motions scaled for each of the considered Sa(T1) value
Note: Use of unscaled ground motions should be the preferred method in a
real-life application
For demonstration purposes, only uncertainty in ground motion is considered;
material uncertainty is not taken into consideration
Total number of analyses conducted for an intensity level is twenty
Peak interstory drift ratio (IDR) & peak roof acceleration (RA) are considered
as the EDPs
Probabilistic Performance-based Earthquake Engineering, Tongji University, Shanghai, China, Dec. 17-18, 2015
14
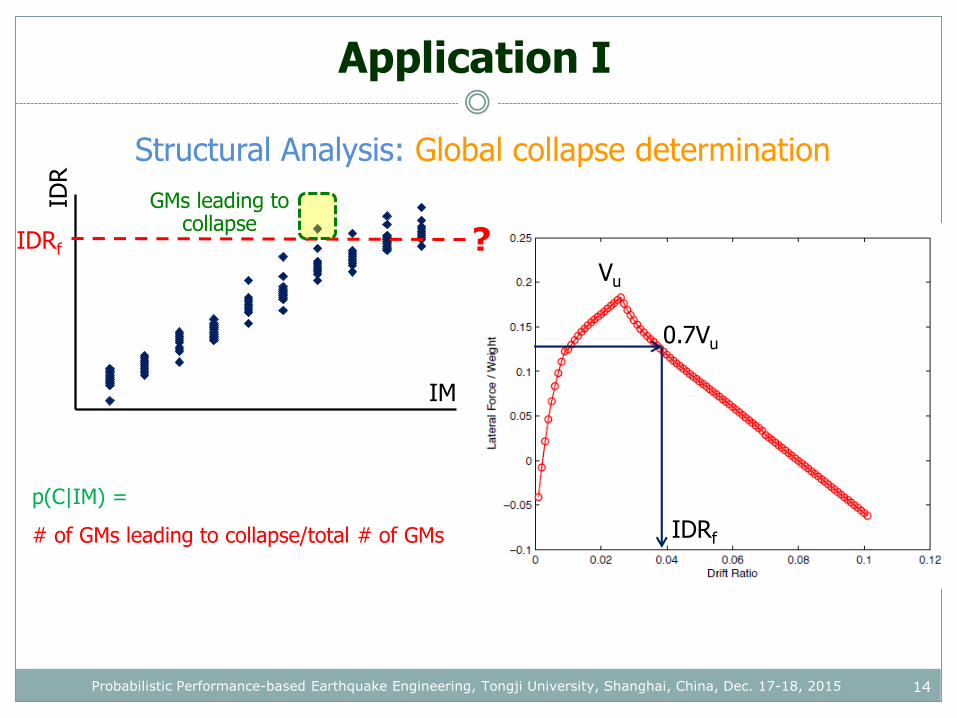
Application I
Structural Analysis: Global collapse determination
0
1
2
3
4
5
6
7
8
9
10
0 2 4 6 8 10
IDR
IM
Vu
0.7Vu
IDRf
IDRf
p(C|IM) =
# of GMs leading to collapse/total # of GMs
GMs leading to collapse
?
Probabilistic Performance-based Earthquake Engineering, Tongji University, Shanghai, China, Dec. 17-18, 2015
15
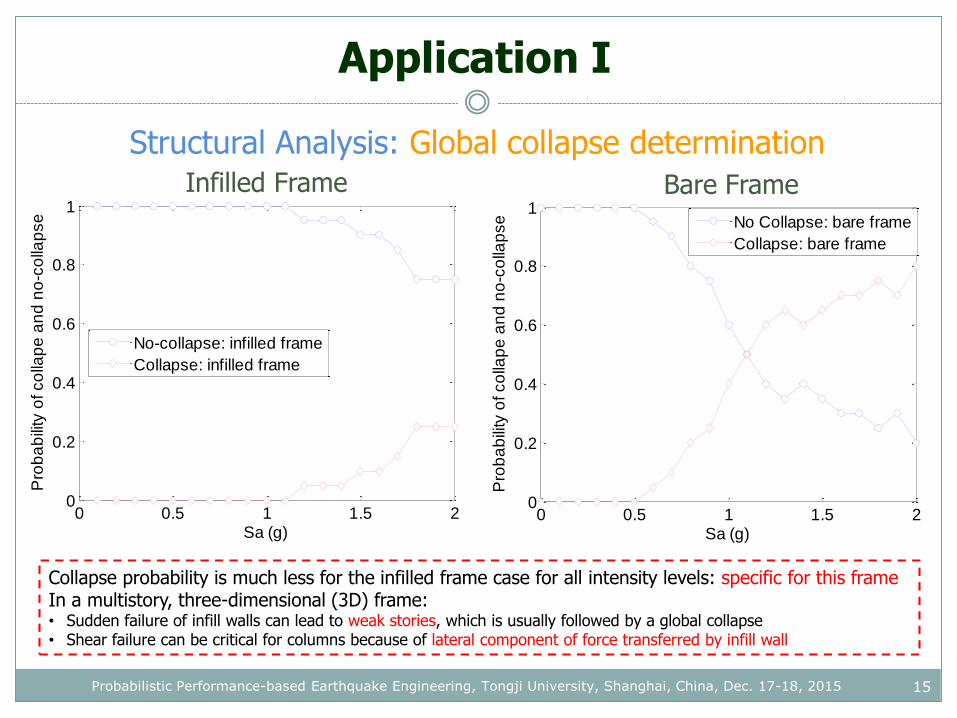
Application I
Structural Analysis: Global collapse determination
0 0.5 1 1.5 20
0.2
0.4
0.6
0.8
1
Sa (g)
Pro
ba
bili
ty o
f co
llap
e a
nd
no
-co
llap
se
No-collapse: infilled frame
Collapse: infilled frame
Infilled Frame
0 0.5 1 1.5 20
0.2
0.4
0.6
0.8
1
Sa (g)
Pro
ba
bili
ty o
f co
llap
e a
nd
no
-co
llap
se
No Collapse: bare frame
Collapse: bare frame
Bare Frame
Collapse probability is much less for the infilled frame case for all intensity levels: specific for this frameIn a multistory, three-dimensional (3D) frame:• Sudden failure of infill walls can lead to weak stories, which is usually followed by a global collapse• Shear failure can be critical for columns because of lateral component of force transferred by infill wall
Probabilistic Performance-based Earthquake Engineering, Tongji University, Shanghai, China, Dec. 17-18, 2015
0
1
2
3
4
5
6
7
8
9
10
0 2 4 6 8 10
0
1
2
3
4
5
6
7
8
9
10
0 2 4 6 8 100
1
2
3
4
5
6
7
8
9
10
0 2 4 6 8 10
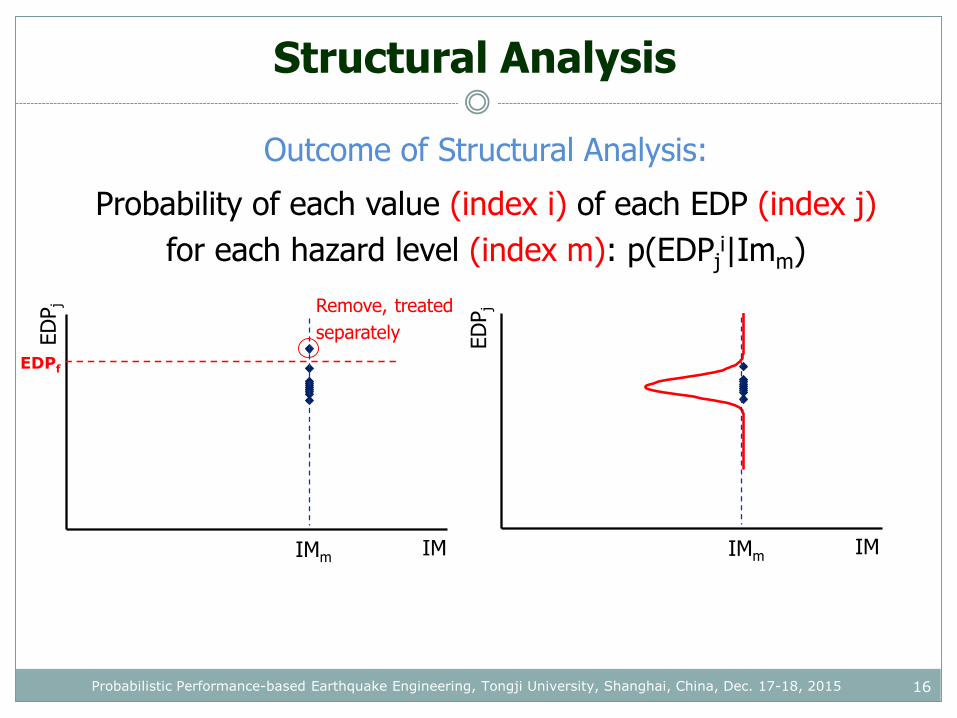
Structural Analysis
16
ED
Pj
IM
Outcome of Structural Analysis:
Probability of each value (index i) of each EDP (index j)
for each hazard level (index m): p(EDPji|Imm)
IMm
EDPf
ED
PjRemove, treated
separately
IMIMm
Probabilistic Performance-based Earthquake Engineering, Tongji University, Shanghai, China, Dec. 17-18, 2015

17
Application I
Outcome of Structural Analysis:Probability and POE for IDR and RA ”Only RA is shown here”
0 0.005 0.01 0.015 0.02 0.025 0.03 0.035 0.040
0.01
0.02
0.03
0.04
Pro
babili
ty
Sa=0.2g
Sa=0.6g
Sa=1.1g
Sa=1.6g
0 0.005 0.01 0.015 0.02 0.025 0.03 0.035 0.040
0.5
1
RA
Pro
babili
ty o
f E
xceedance
Sa=0.2g
Sa=0.6g
Sa=1.1g
Sa=1.6g
Lognormal distribution
Probabilistic Performance-based Earthquake Engineering, Tongji University, Shanghai, China, Dec. 17-18, 2015
Application I
18
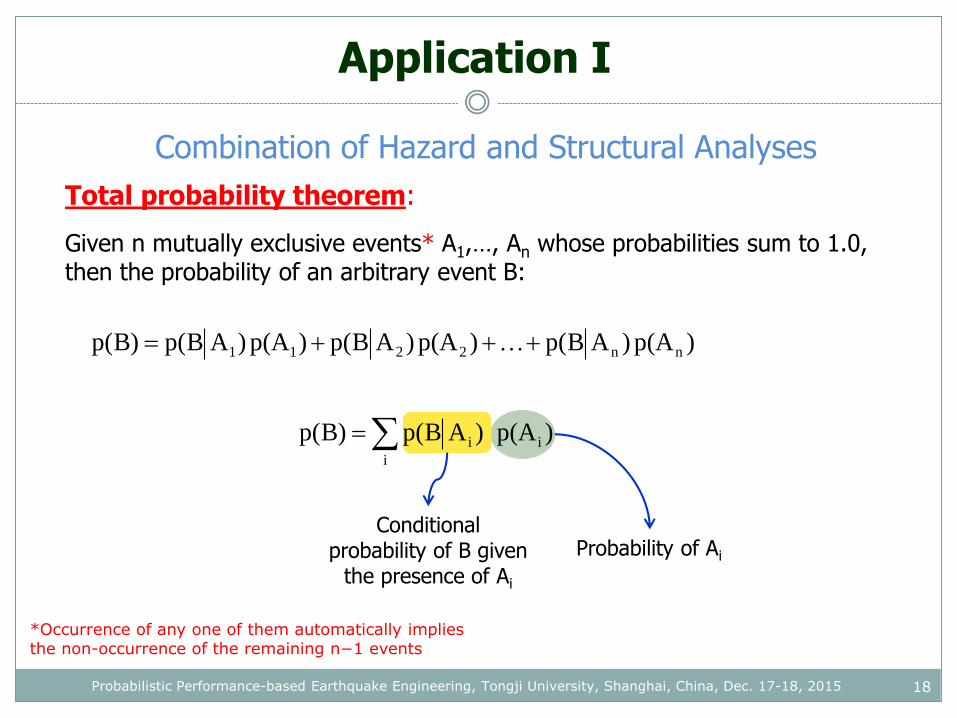
Total probability theorem:
Given n mutually exclusive events* A1,…, An whose probabilities sum to 1.0, then the probability of an arbitrary event B:
)p(A)ABp()p(A)ABp()p(A)ABp()Bp( nn2211
i
ii )p(A)ABp()Bp(
Conditional probability of B given
the presence of Ai
Probability of Ai
*Occurrence of any one of them automatically implies the non-occurrence of the remaining n−1 events
Combination of Hazard and Structural Analyses
Probabilistic Performance-based Earthquake Engineering, Tongji University, Shanghai, China, Dec. 17-18, 2015
19
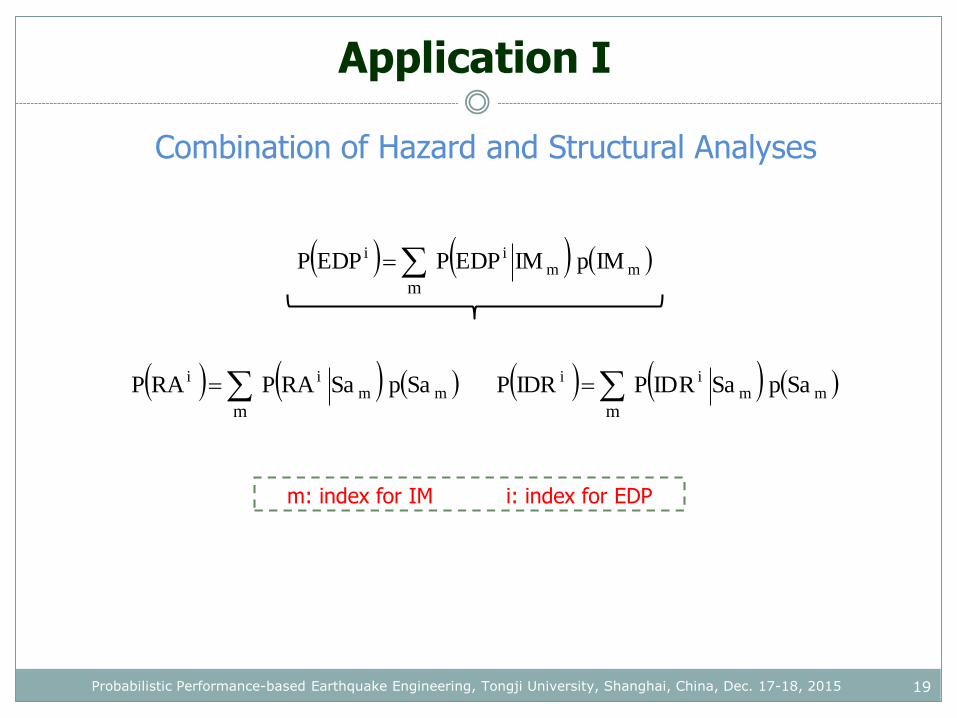
Application I
Combination of Hazard and Structural Analyses
mmii IMpIMEDPPEDPP
m
mmii SapSaRAPRAP
m mm
ii SapSaRIDPIDRPm
m: index for IM i: index for EDP
Probabilistic Performance-based Earthquake Engineering, Tongji University, Shanghai, China, Dec. 17-18, 2015

20
Application I
Combination of Hazard and Structural Analyses
POE of RA is larger for the infilled frame due to:
Initial periods for small RA values (acceleration response for 0.1 sec-infilled frame is greater than that for0.5 sec-bare frame)
Lateral force capacity [next slide] (larger for the infilled frame compared to the bare frame) for large Sa
0 0.5 1 1.5 2 2.5 30
0.1
0.2
0.3
0.4
0.5
0.6
0.7
0.8
0.9
1
RA (g)
Pro
babili
ty o
f E
xceedance o
f R
A
Bare Frame
Infilled Frame
Bare Frame
Infilled Frame
Probabilistic Performance-based Earthquake Engineering, Tongji University, Shanghai, China, Dec. 17-18, 2015
0 0.5 1 1.5 2 2.5 30
0.1
0.2
0.3
0.4
0.5
0.6
0.7
0.8
0.9
1
RA (g)
Pro
babili
ty o
f E
xceedance o
f R
A
Bare Frame
Infilled Frame
Bare Frame
Infilled Frame
21
Application I
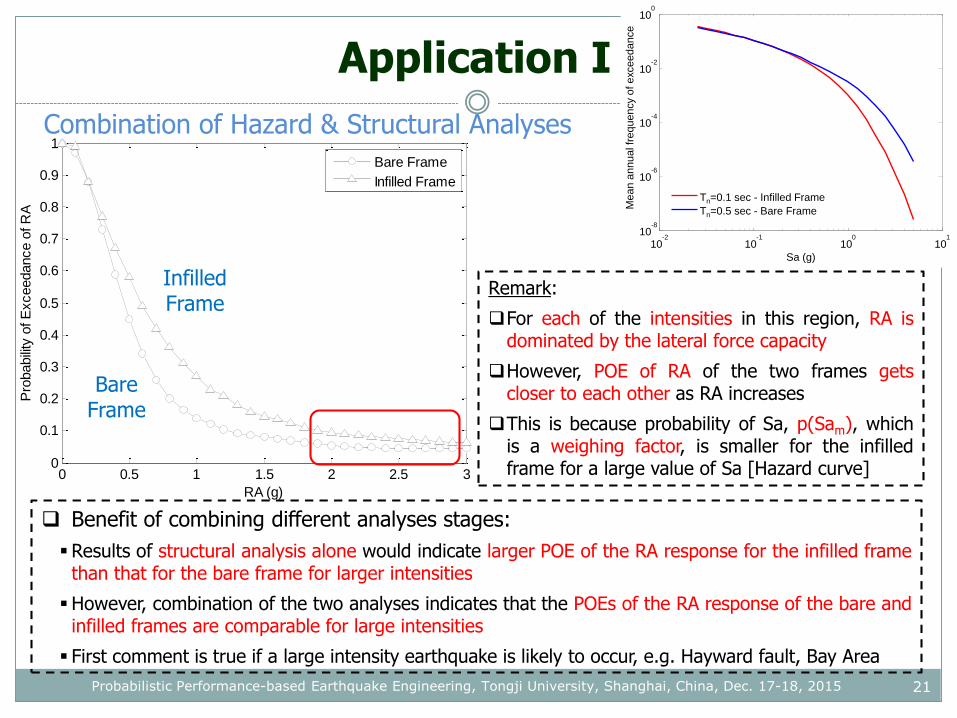
Combination of Hazard & Structural Analyses
Remark:
For each of the intensities in this region, RA isdominated by the lateral force capacity
However, POE of RA of the two frames getscloser to each other as RA increases
This is because probability of Sa, p(Sam), whichis a weighing factor, is smaller for the infilledframe for a large value of Sa [Hazard curve]
Benefit of combining different analyses stages:
Results of structural analysis alone would indicate larger POE of the RA response for the infilled framethan that for the bare frame for larger intensities
However, combination of the two analyses indicates that the POEs of the RA response of the bare andinfilled frames are comparable for large intensities
First comment is true if a large intensity earthquake is likely to occur, e.g. Hayward fault, Bay Area
10-2
10-1
100
101
10-8
10-6
10-4
10-2
100
Sa (g)
Me
an
an
nu
al fr
eq
ue
ncy o
f e
xce
ed
an
ce
Tn=0.1 sec - Infilled Frame
Tn=0.5 sec - Bare Frame
Probabilistic Performance-based Earthquake Engineering, Tongji University, Shanghai, China, Dec. 17-18, 2015
0 0.5 1 1.5 2 2.5 3 3.50
0.1
0.2
0.3
0.4
0.5
0.6
0.7
0.8
0.9
1
IDR (%)
Pro
babili
ty o
f E
xceedance o
f ID
R
Infilled Frame
Bare Frame
22
Application I
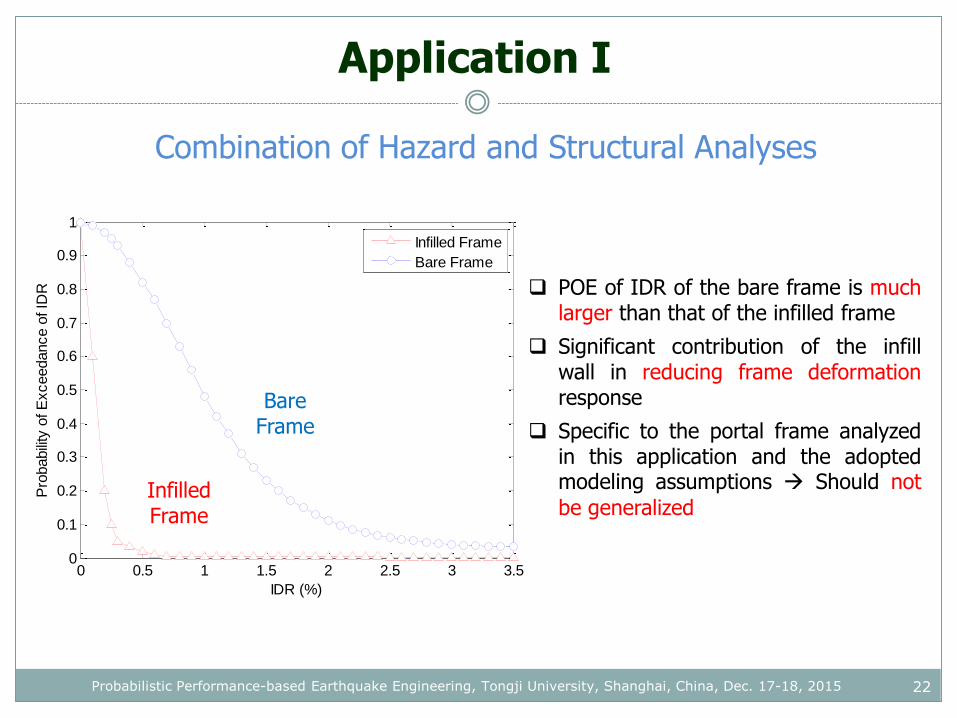
Combination of Hazard and Structural Analyses
POE of IDR of the bare frame is muchlarger than that of the infilled frame
Significant contribution of the infillwall in reducing frame deformationresponse
Specific to the portal frame analyzedin this application and the adoptedmodeling assumptions Should not
be generalized
Bare Frame
Infilled Frame
Probabilistic Performance-based Earthquake Engineering, Tongji University, Shanghai, China, Dec. 17-18, 2015

23Probabilistic Performance-based Earthquake Engineering, Tongji University, Shanghai, China, Dec. 17-18, 2015
Questions?
http://www.ce.berkeley.edu/people/faculty/mosalam

Outline
24
1. Application 1: Evaluation of the effect of unreinforced masonry
infill walls on reinforced concrete frames with probabilistic PBEE
2. Application 2: PEER PBEE assessment of a shearwall building
located on the University of California, Berkeley, campus
3. Application 3: Evaluation of the seismic response of structural
insulated panels with probabilistic PBEE
Probabilistic Performance-based Earthquake Engineering, Tongji University, Shanghai, China, Dec. 17-18, 2015

II-2 Application 2
KHALID M. MOSALAM, PROFESSOR
UNIVERSITY OF CALIFORNIA, BERKELEY
Probabilistic Performance-based Earthquake Engineering, Tongji University, Shanghai, China, Dec. 17-18, 2015

Application II
26
University of California Science (UCS) building in UC-Berkeley campus
Modern reinforced concrete shear-wall building
High technology research laboratories for organismal biology, animal facilities,
offices and related support spaces
An example for which non-structural components contribute to the PBEE
methodology due to valuable building contents, i.e. the laboratory equipment
and research activities
Probabilistic Performance-based Earthquake Engineering, Tongji University, Shanghai, China, Dec. 17-18, 2015
Application II
27
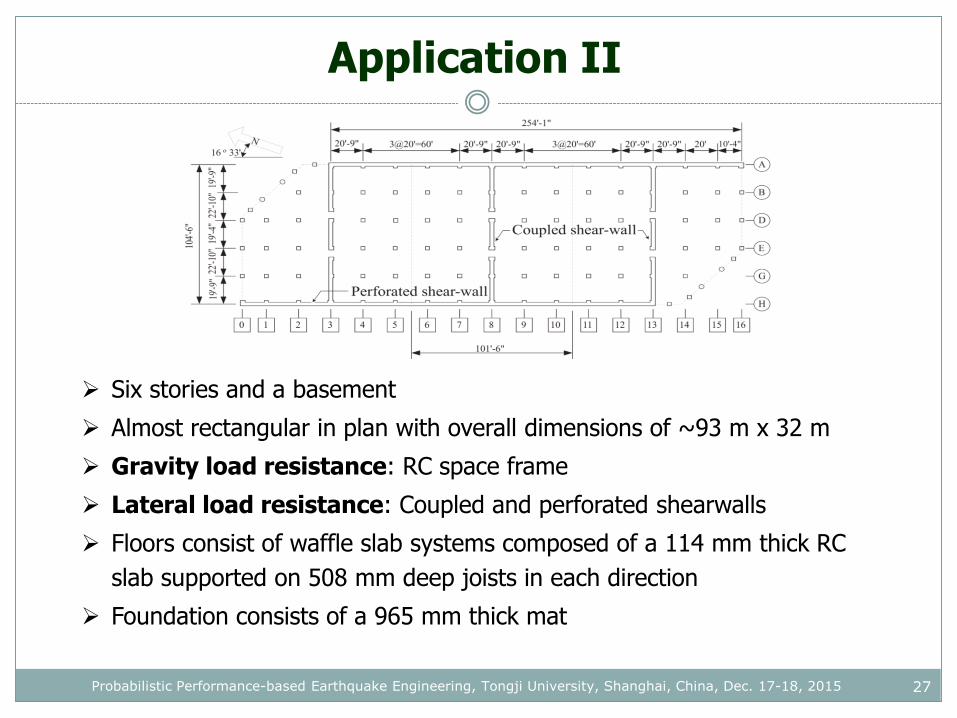
Six stories and a basement
Almost rectangular in plan with overall dimensions of ~93 m x 32 m
Gravity load resistance: RC space frame
Lateral load resistance: Coupled and perforated shearwalls
Floors consist of waffle slab systems composed of a 114 mm thick RC
slab supported on 508 mm deep joists in each direction
Foundation consists of a 965 mm thick mat
Probabilistic Performance-based Earthquake Engineering, Tongji University, Shanghai, China, Dec. 17-18, 2015
28
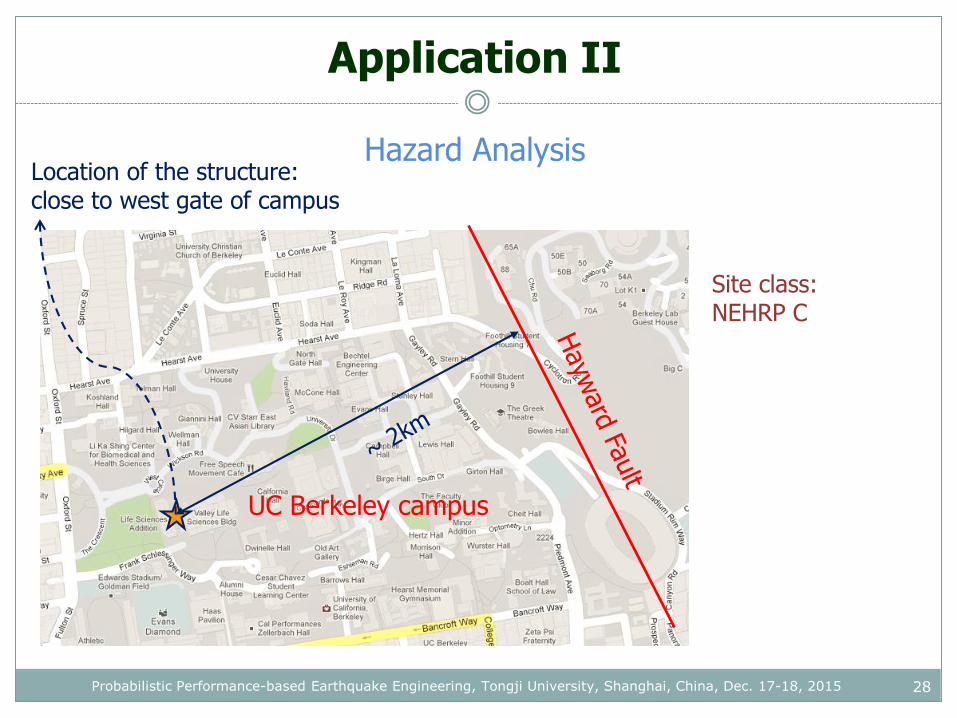
Application II
Hazard AnalysisLocation of the structure: close to west gate of campus
UC Berkeley campus
Site class: NEHRP C
Probabilistic Performance-based Earthquake Engineering, Tongji University, Shanghai, China, Dec. 17-18, 2015
29
Application II
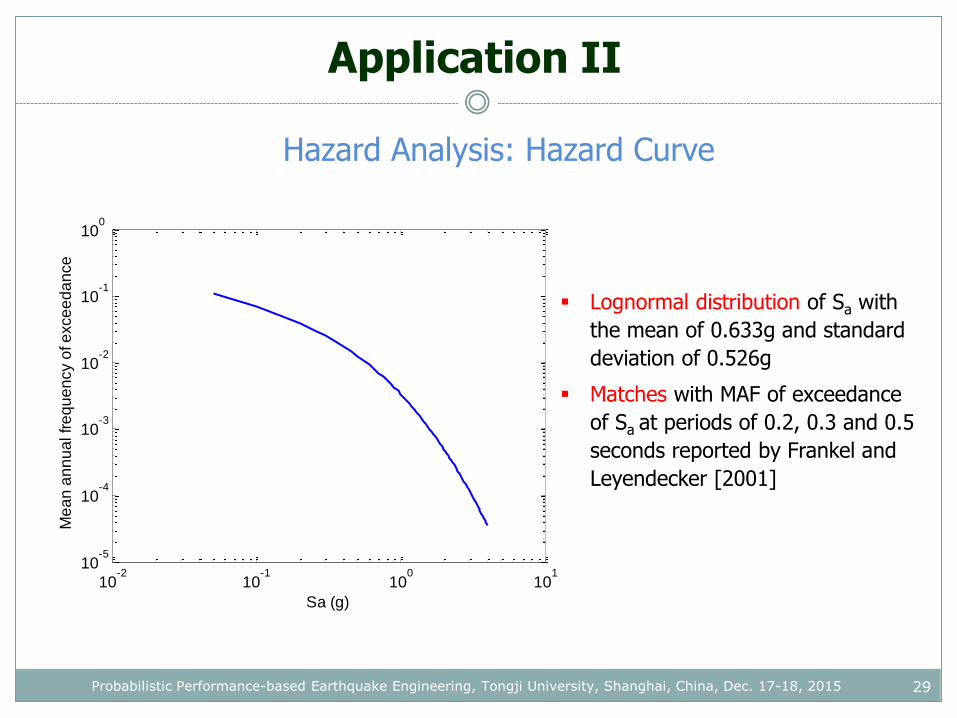
Hazard Analysis: Hazard Curve
10-2
10-1
100
101
10-5
10-4
10-3
10-2
10-1
100
Sa (g)
Me
an
an
nu
al fr
eq
ue
ncy o
f e
xce
ed
an
ce
Lognormal distribution of Sa with
the mean of 0.633g and standard
deviation of 0.526g
Matches with MAF of exceedance
of Sa at periods of 0.2, 0.3 and 0.5
seconds reported by Frankel and
Leyendecker [2001]
Probabilistic Performance-based Earthquake Engineering, Tongji University, Shanghai, China, Dec. 17-18, 2015
30
Application II
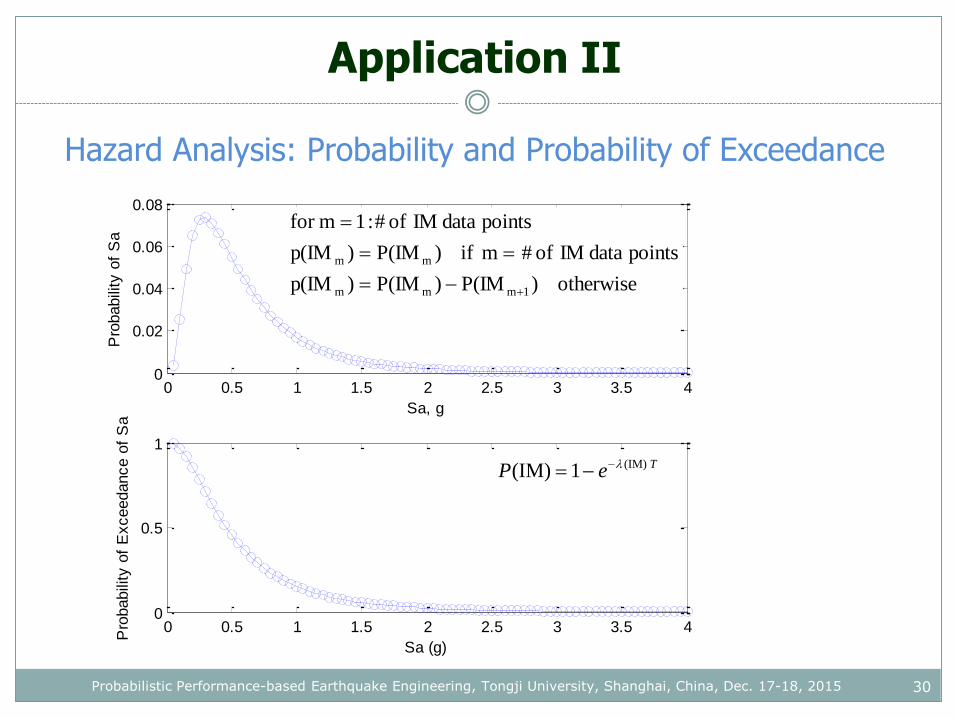
Hazard Analysis: Probability and Probability of Exceedance
0 0.5 1 1.5 2 2.5 3 3.5 40
0.02
0.04
0.06
0.08
Sa, g
Pro
babili
ty o
f S
a
0 0.5 1 1.5 2 2.5 3 3.5 40
0.5
1
Sa (g)
Pro
babili
ty o
f E
xceedance o
f S
a
TeP (IM)1(IM)
otherwise)P(IM)P(IM)p(IM
points data IM of #mif)P(IM)p(IM
points data IM of #:1mfor
1mmm
mm
Probabilistic Performance-based Earthquake Engineering, Tongji University, Shanghai, China, Dec. 17-18, 2015
31
Application II
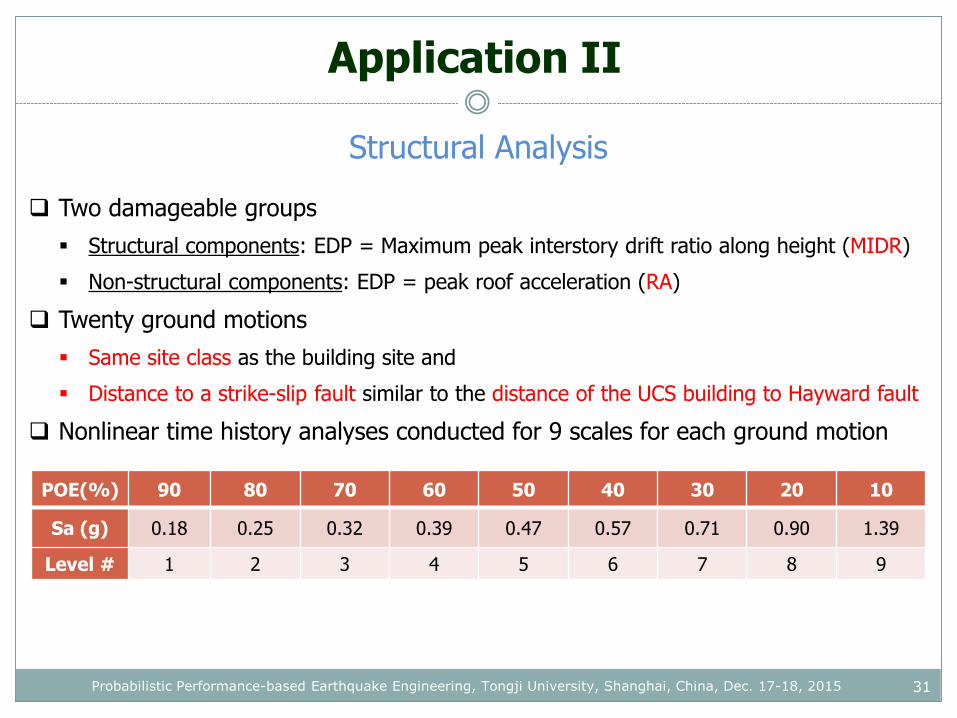
Structural Analysis
Two damageable groups
Structural components: EDP = Maximum peak interstory drift ratio along height (MIDR)
Non-structural components: EDP = peak roof acceleration (RA)
Twenty ground motions
Same site class as the building site and
Distance to a strike-slip fault similar to the distance of the UCS building to Hayward fault
Nonlinear time history analyses conducted for 9 scales for each ground motion
POE(%) 90 80 70 60 50 40 30 20 10
Sa (g) 0.18 0.25 0.32 0.39 0.47 0.57 0.71 0.90 1.39
Level # 1 2 3 4 5 6 7 8 9
Probabilistic Performance-based Earthquake Engineering, Tongji University, Shanghai, China, Dec. 17-18, 2015
32
Application II
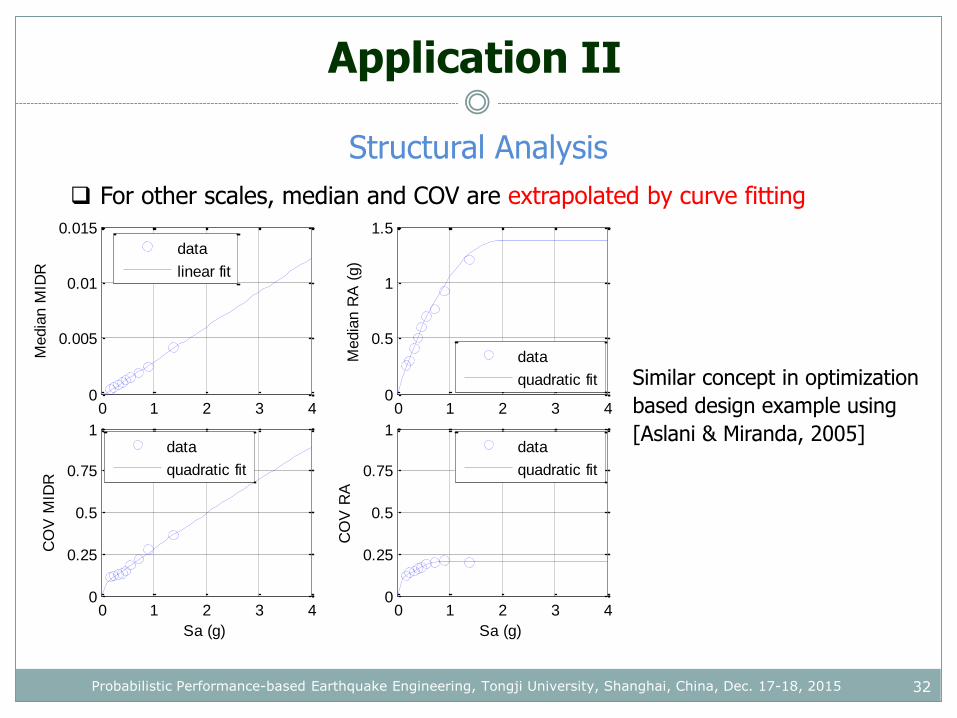
Structural Analysis
For other scales, median and COV are extrapolated by curve fitting
0 1 2 3 40
0.005
0.01
0.015
Media
n M
IDR
data
linear fit
0 1 2 3 40
0.25
0.5
0.75
1
Sa (g)
CO
V M
IDR
data
quadratic fit
0 1 2 3 40
0.5
1
1.5
Media
n R
A (
g)
data
quadratic fit
0 1 2 3 40
0.25
0.5
0.75
1
Sa (g)
CO
V R
A
data
quadratic fit
Similar concept in optimization
based design example using
[Aslani & Miranda, 2005]
Probabilistic Performance-based Earthquake Engineering, Tongji University, Shanghai, China, Dec. 17-18, 2015
33
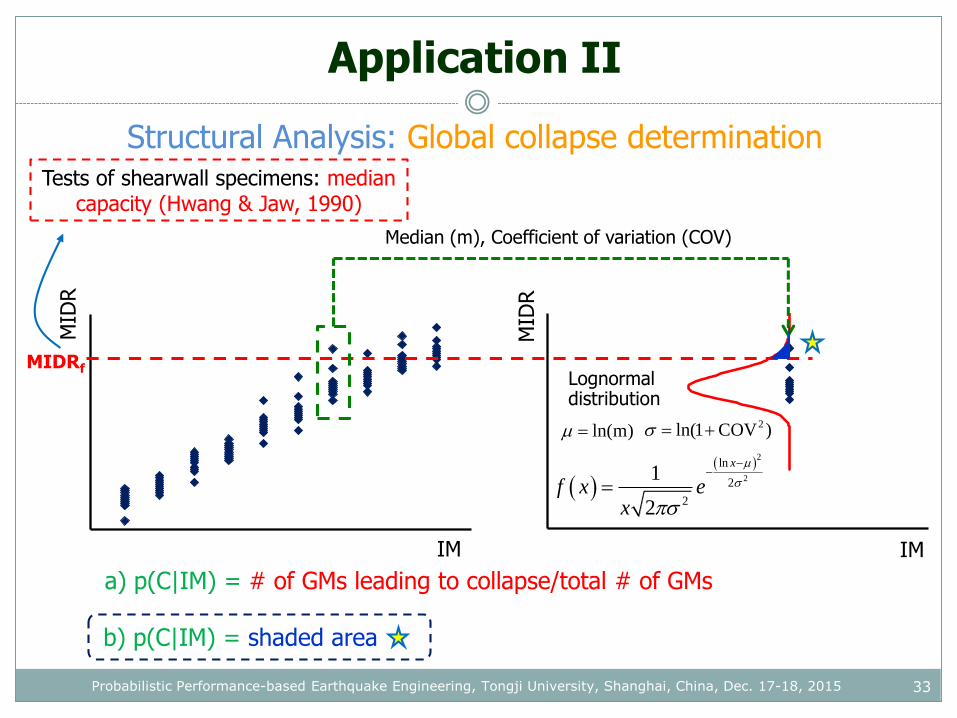
Application II
Structural Analysis: Global collapse determination
0
1
2
3
4
5
6
7
8
9
10
0 2 4 6 8 10M
IDR
IM
Median (m), Coefficient of variation (COV)
2
2
ln
2
2
1
2
x
f x ex
Lognormaldistribution
)mln( )COV1ln( 2
a) p(C|IM) = # of GMs leading to collapse/total # of GMs
0
1
2
3
4
5
6
7
8
9
10
0 2 4 6 8 10
MID
R
IM
MIDRf
b) p(C|IM) = shaded area
Tests of shearwall specimens: median capacity (Hwang & Jaw, 1990)
Probabilistic Performance-based Earthquake Engineering, Tongji University, Shanghai, China, Dec. 17-18, 2015
34
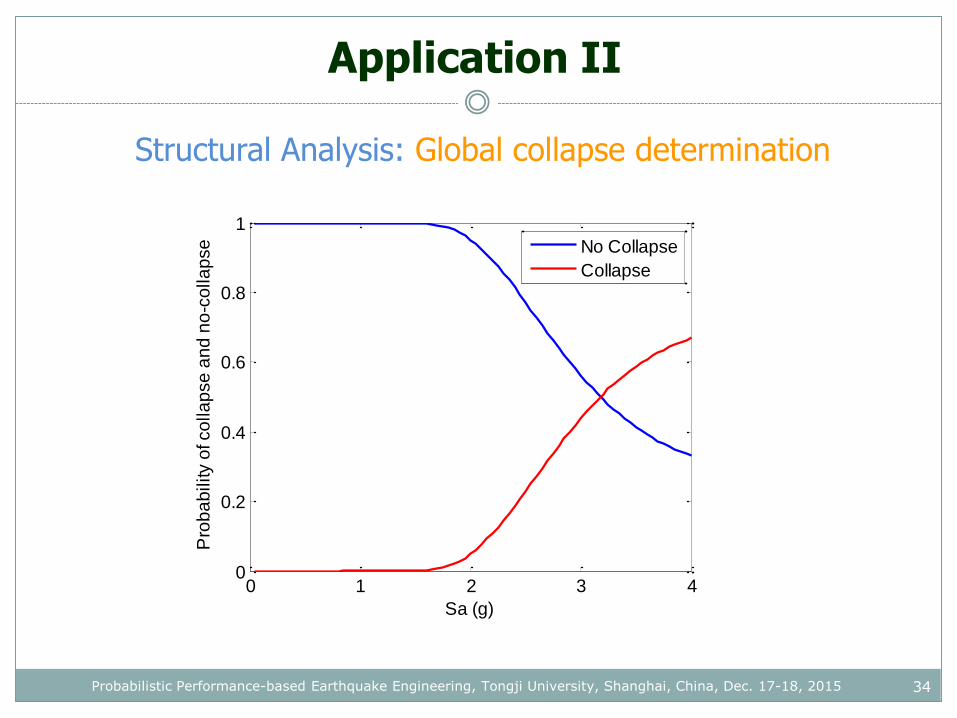
Application II
Structural Analysis: Global collapse determination
0 1 2 3 40
0.2
0.4
0.6
0.8
1
Sa (g)
Pro
ba
bility o
f co
lla
pse
an
d n
o-c
olla
pse
No Collapse
Collapse
Probabilistic Performance-based Earthquake Engineering, Tongji University, Shanghai, China, Dec. 17-18, 2015

35
Application II
Outcome of Structural Analysis:Probability of MIDR and RA
0 0.005 0.01 0.015 0.02 0.025 0.03 0.035 0.04 0.0450
0.05
0.1
0.15
0.2
MIDR
Pro
babili
ty o
f M
IDR
Sa=0.5 g
Sa=1.0 g
Sa=3.0 g
0 0.5 1 1.5 2 2.5 3 3.5 40
1
2
3
4x 10
-3
RA (g)
Pro
babili
ty o
f R
A
Sa=0.5 g
Sa=1.0 g
Sa=3.0 g
Probabilistic Performance-based Earthquake Engineering, Tongji University, Shanghai, China, Dec. 17-18, 2015
36
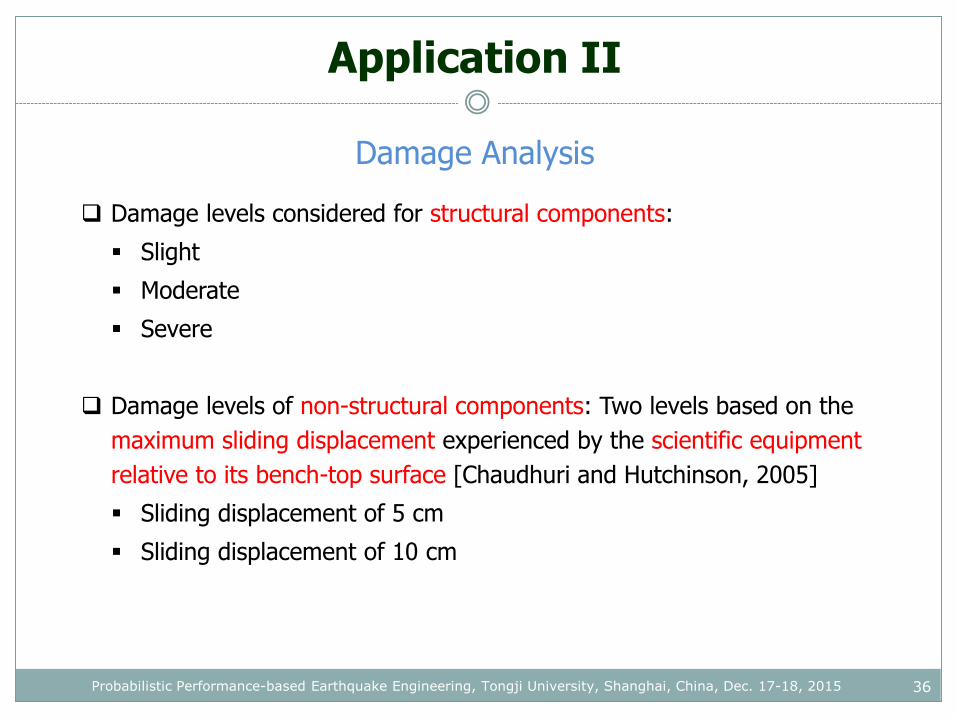
Application II
Damage Analysis
Damage levels considered for structural components:
Slight
Moderate
Severe
Damage levels of non-structural components: Two levels based on the
maximum sliding displacement experienced by the scientific equipment
relative to its bench-top surface [Chaudhuri and Hutchinson, 2005]
Sliding displacement of 5 cm
Sliding displacement of 10 cm
Probabilistic Performance-based Earthquake Engineering, Tongji University, Shanghai, China, Dec. 17-18, 2015
37
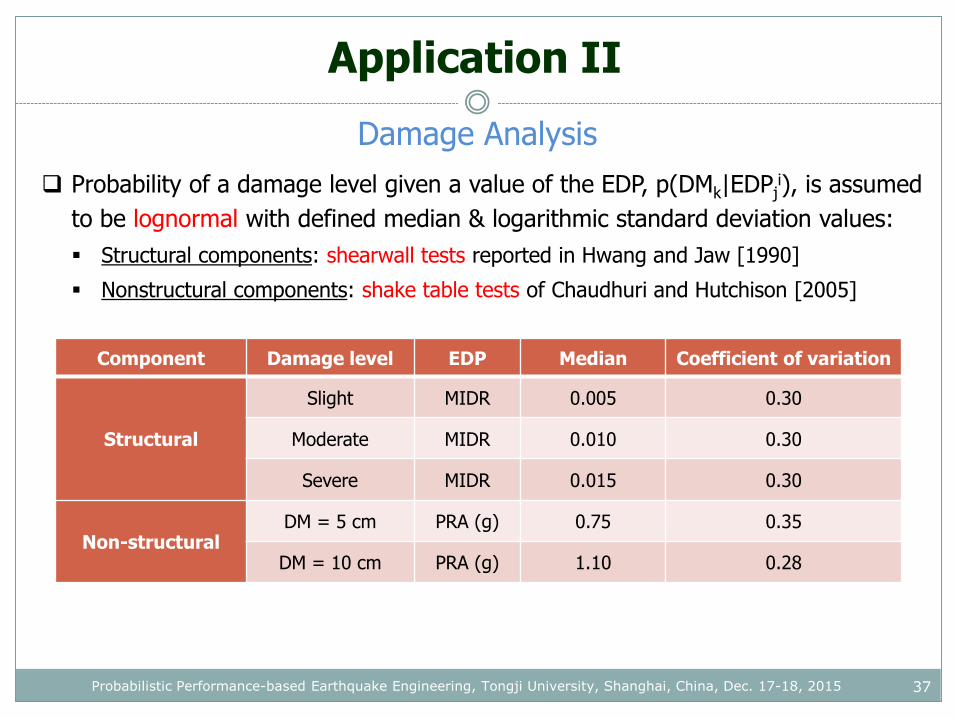
Application II
Damage Analysis
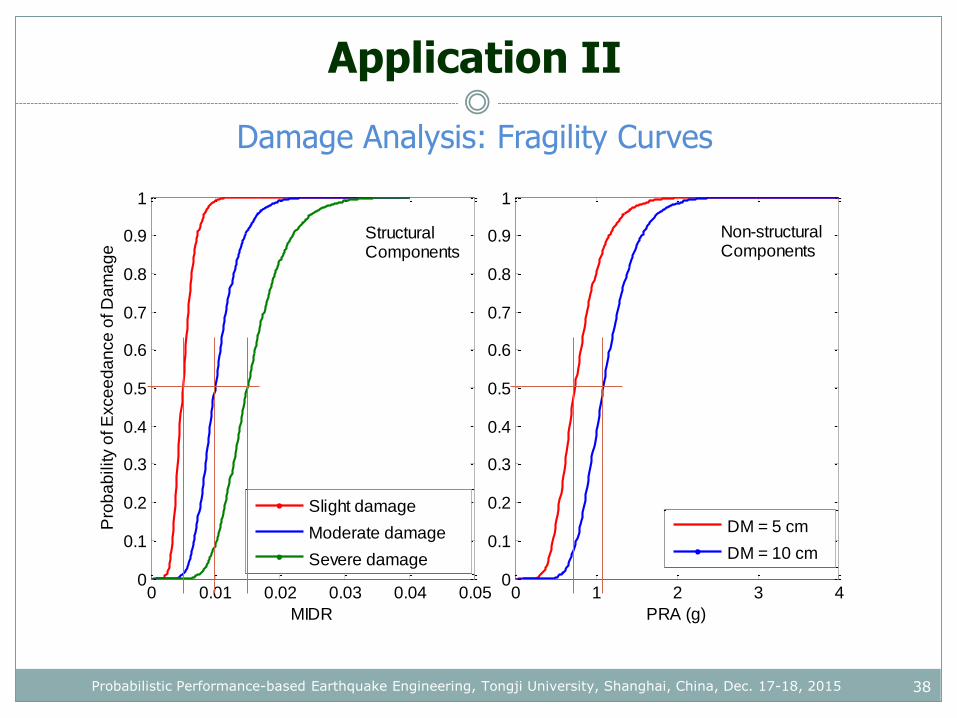
Probability of a damage level given a value of the EDP, p(DMk|EDPji), is assumed
to be lognormal with defined median & logarithmic standard deviation values:
Structural components: shearwall tests reported in Hwang and Jaw [1990]
Nonstructural components: shake table tests of Chaudhuri and Hutchison [2005]
Component Damage level EDP Median Coefficient of variation
Structural
Slight MIDR 0.005 0.30
Moderate MIDR 0.010 0.30
Severe MIDR 0.015 0.30
Non-structuralDM = 5 cm PRA (g) 0.75 0.35
DM = 10 cm PRA (g) 1.10 0.28
Probabilistic Performance-based Earthquake Engineering, Tongji University, Shanghai, China, Dec. 17-18, 2015
38
Application II
Damage Analysis: Fragility Curves
0 0.01 0.02 0.03 0.04 0.050
0.1
0.2
0.3
0.4
0.5
0.6
0.7
0.8
0.9
1
MIDR
Pro
ba
bility o
f E
xce
ed
an
ce
of D
am
ag
e
Slight damage
Moderate damage
Severe damage
0 1 2 3 40
0.1
0.2
0.3
0.4
0.5
0.6
0.7
0.8
0.9
1
PRA (g)
DM = 5 cm
DM = 10 cm
Non-structuralComponents
StructuralComponents
Probabilistic Performance-based Earthquake Engineering, Tongji University, Shanghai, China, Dec. 17-18, 2015
39
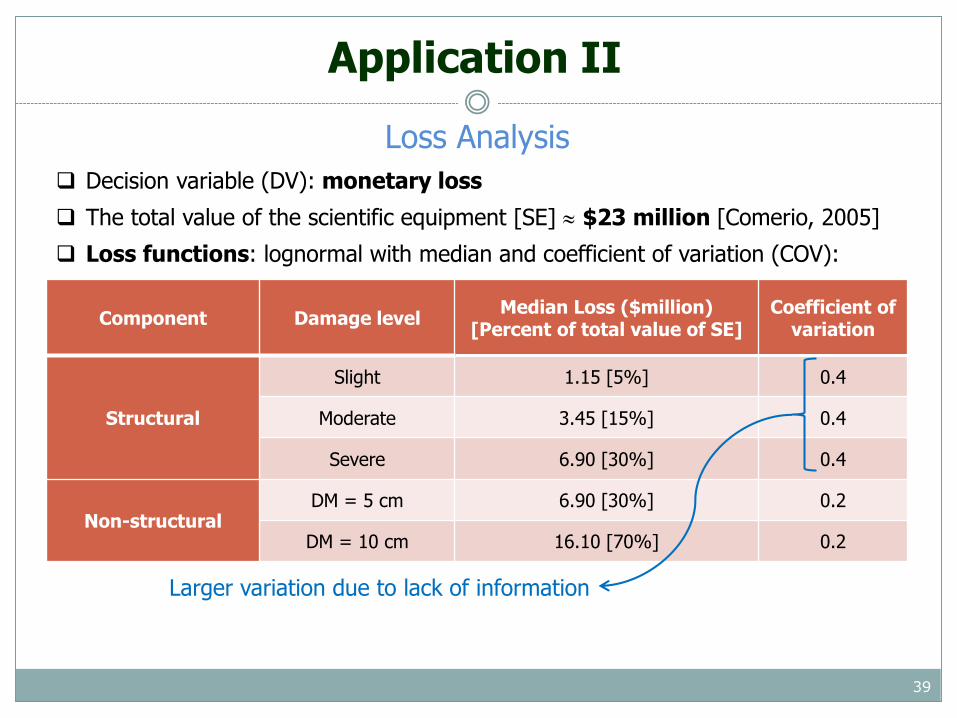
Application II
Loss Analysis
Decision variable (DV): monetary loss
The total value of the scientific equipment [SE] $23 million [Comerio, 2005]
Loss functions: lognormal with median and coefficient of variation (COV):
Component Damage levelMedian Loss ($million)
[Percent of total value of SE]Coefficient of
variation
Structural
Slight 1.15 [5%] 0.4
Moderate 3.45 [15%] 0.4
Severe 6.90 [30%] 0.4
Non-structuralDM = 5 cm 6.90 [30%] 0.2
DM = 10 cm 16.10 [70%] 0.2
Larger variation due to lack of information

40
Application II
Loss Analysis: Loss Functions
0 10 20 30 400
0.1
0.2
0.3
0.4
0.5
0.6
0.7
0.8
0.9
1
Economic Loss (million $)
Pro
ba
bility o
f E
xce
ed
an
ce
of E
co
no
mic
Lo
ss
Slight damage
Moderate damage
Severe damage
0 10 20 30 400
0.1
0.2
0.3
0.4
0.5
0.6
0.7
0.8
0.9
1
Economic Loss (million $)
DM=5 cm
DM = 10 cm
Non-structuralComponents
StructuralComponents
Probabilistic Performance-based Earthquake Engineering, Tongji University, Shanghai, China, Dec. 17-18, 2015
41
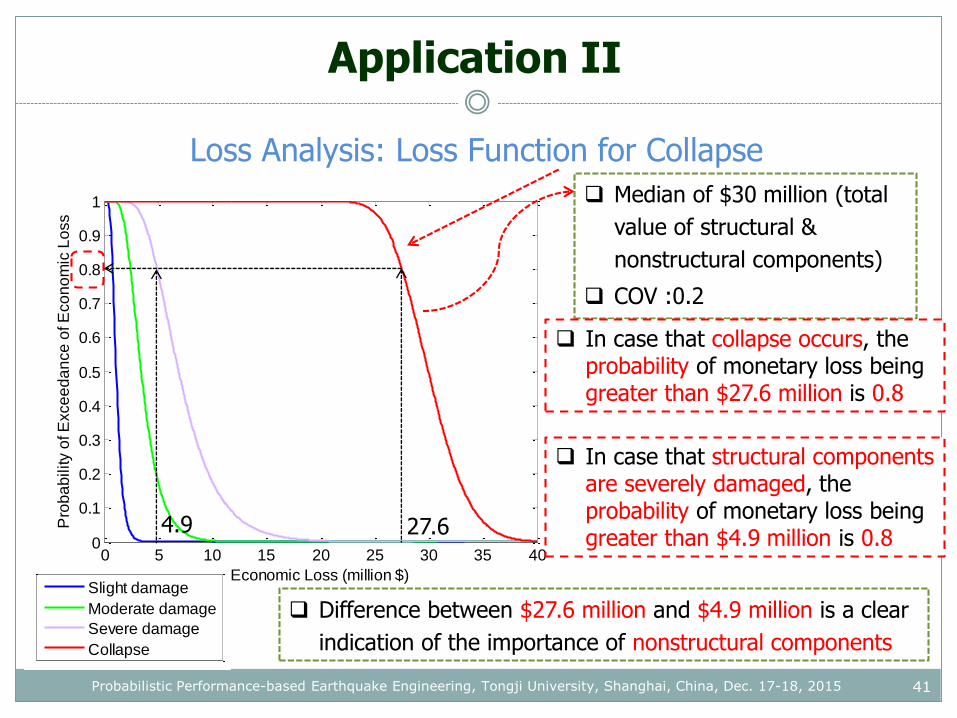
Application II
Loss Analysis: Loss Function for Collapse
0 5 10 15 20 25 30 35 400
0.1
0.2
0.3
0.4
0.5
0.6
0.7
0.8
0.9
1
Economic Loss (million $)
Pro
ba
bility o
f E
xce
ed
an
ce
of E
co
no
mic
Lo
ss
0 5 10 15 20 25 30 35 400
0.1
0.2
0.3
0.4
0.5
0.6
0.7
0.8
0.9
1
Economic Loss (million $)
Pro
ba
bility o
f E
xce
ed
an
ce
of E
co
no
mic
Lo
ss
Slight damage
Moderate damage
Severe damage
Collapse
Median of $30 million (total
value of structural &
nonstructural components)
COV :0.2
In case that collapse occurs, the probability of monetary loss being greater than $27.6 million is 0.8
Difference between $27.6 million and $4.9 million is a clear
indication of the importance of nonstructural components
In case that structural components are severely damaged, the probability of monetary loss being greater than $4.9 million is 0.8
27.64.9
Probabilistic Performance-based Earthquake Engineering, Tongji University, Shanghai, China, Dec. 17-18, 2015
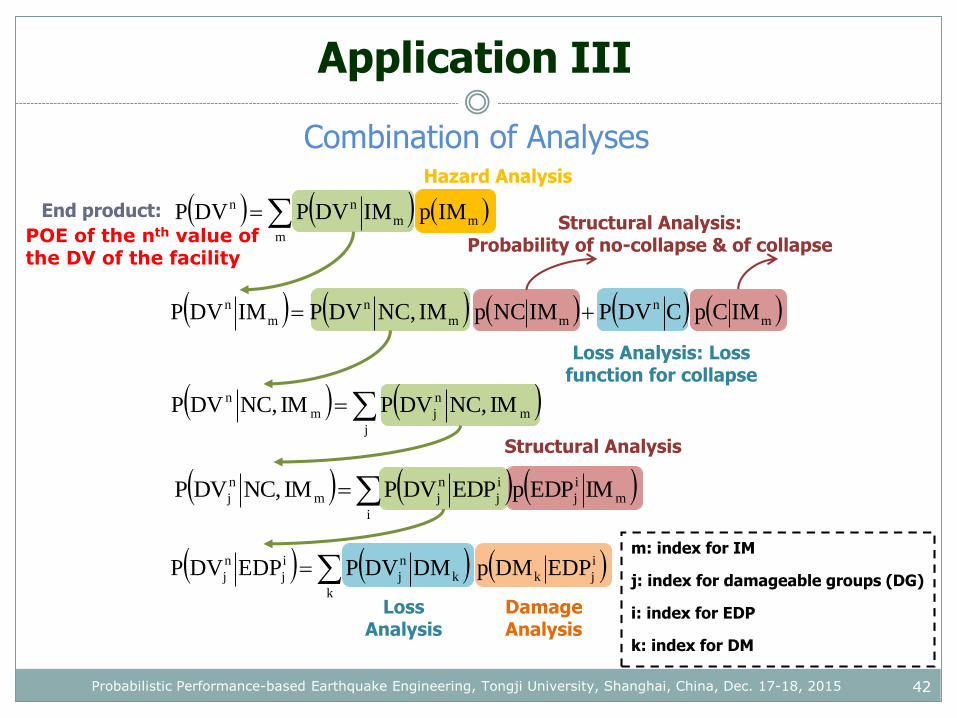
Application III
42
j
m
n
jm
n IMNC,DVPIMNC,DVP
m
n
mm
n
m
n IMCpCDVPIMNCpIMNC,DVPIMDVP
m
mm
nn IMpIMDVPDVP
k
i
jkk
n
j
i
j
n
j EDPDMpDMDVPEDPDVP
i
m
i
j
i
j
n
jm
n
j IMEDPpEDPDVPIMNC,DVP
End product: Structural Analysis:
Probability of no-collapse & of collapse
Loss Analysis: Loss function for collapse
m: index for IM
j: index for damageable groups (DG)
i: index for EDP
k: index for DM
Structural Analysis
Hazard Analysis
Loss Analysis
Damage Analysis
POE of the nth value ofthe DV of the facility
Combination of Analyses
Probabilistic Performance-based Earthquake Engineering, Tongji University, Shanghai, China, Dec. 17-18, 2015
Application II
43
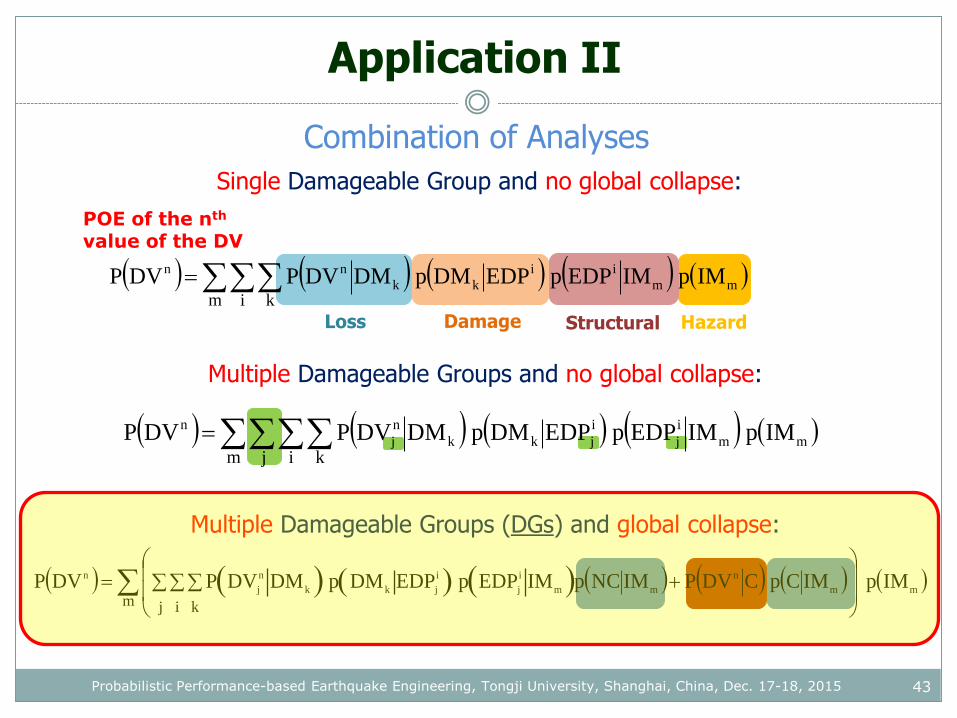
Combination of Analyses
Loss Damage Structural Hazard
Single Damageable Group and no global collapse:
POE of the nth
value of the DV
Multiple Damageable Groups and no global collapse:
Multiple Damageable Groups (DGs) and global collapse:
mm
i
j
i
jkk
n
j
n IMpIMEDPpEDPDMpDMDVPDVPm j i k
mm
ii
kk
nn IMpIMEDPpEDPDMpDMDVPDVPm i k
mm
n
mm
i
j
i
jkk
n
j
n IMpIMCpCDVPIMNCpIMEDPpEDPDMpDMDVPDVPm j i k
Probabilistic Performance-based Earthquake Engineering, Tongji University, Shanghai, China, Dec. 17-18, 2015
44
Application II
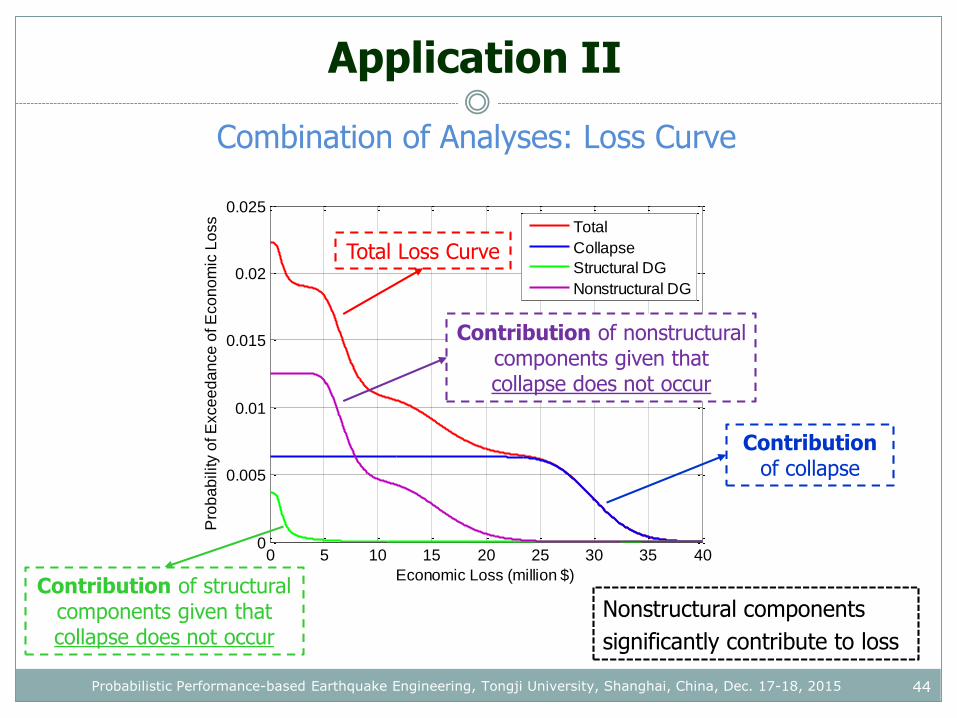
Combination of Analyses: Loss Curve
0 5 10 15 20 25 30 35 400
0.005
0.01
0.015
0.02
0.025
Economic Loss (million $)
Pro
ba
bility o
f E
xce
ed
an
ce
of E
co
no
mic
Lo
ss
Total
Collapse
Structural DG
Nonstructural DG
Total Loss Curve
Contribution of nonstructural components given that collapse does not occur
Contribution of structural components given that collapse does not occur
Contributionof collapse
Nonstructural components
significantly contribute to loss
Probabilistic Performance-based Earthquake Engineering, Tongji University, Shanghai, China, Dec. 17-18, 2015

Application II
45
Combination of Analyses: Loss Curve
“No collapse” case is more dominant on
the total loss curve for monetary losses
less than $8 million
All the loss is attributed to the “collapse”
case for monetary losses greater than
$25 million
“No collapse” plot can be interpreted as
the loss curve for a hypothetical case
where collapse is prevented for all
intensity levels
The significant reduction of economic
loss as a result of the elimination of
collapse shows the effect of the collapse
prevention mandated by the seismic
codes from an economical perspective
0 5 10 15 20 25 30 35 400
0.005
0.01
0.015
0.02
0.025
Economic Loss (million $)
Pro
ba
bility o
f E
xce
ed
an
ce
of E
co
no
mic
Lo
ss
Total
Collapse
No collapse =Structural DG + Nonstructural DG
Probabilistic Performance-based Earthquake Engineering, Tongji University, Shanghai, China, Dec. 17-18, 2015

46Probabilistic Performance-based Earthquake Engineering, Tongji University, Shanghai, China, Dec. 17-18, 2015
Questions?
http://www.ce.berkeley.edu/people/faculty/mosalam
Outline
47
1. Application 1: Evaluation of the effect of unreinforced masonry
infill walls on reinforced concrete frames with probabilistic PBEE
2. Application 2: PEER PBEE assessment of a shearwall building
located on the University of California, Berkeley, campus
3. Application 3: Evaluation of the seismic response of structural
insulated panels with probabilistic PBEE
Probabilistic Performance-based Earthquake Engineering, Tongji University, Shanghai, China, Dec. 17-18, 2015
II-3 Application 3
[Outline of Procedure]
KHALID M. MOSALAM, PROFESSOR
UNIVERSITY OF CALIFORNIA, BERKELEY
Probabilistic Performance-based Earthquake Engineering, Tongji University, Shanghai, China, Dec. 17-18, 2015
Application III
49
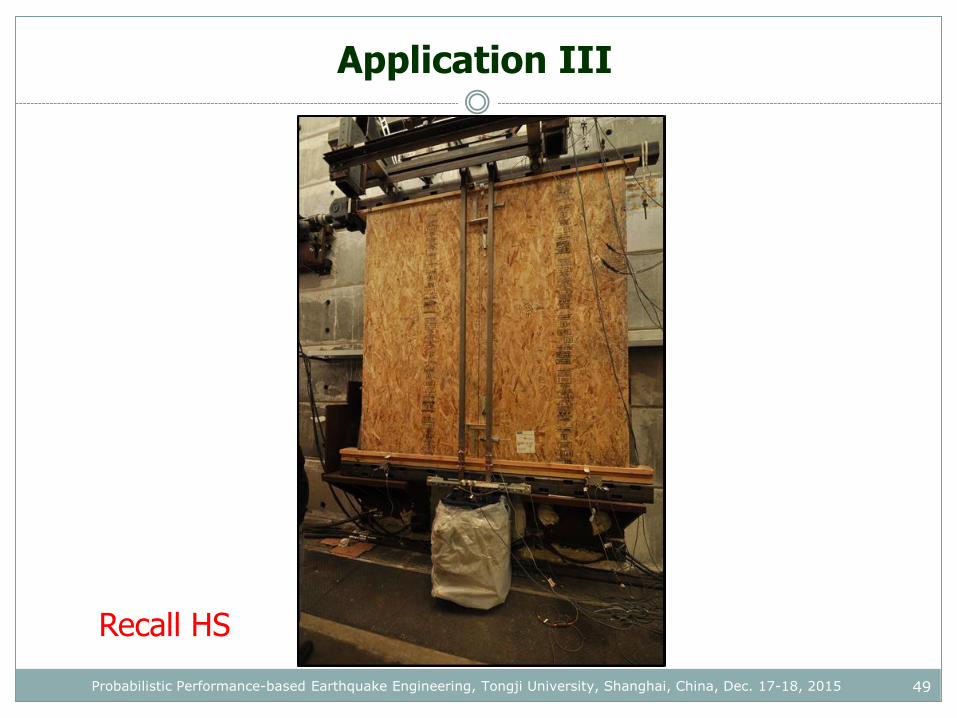
Recall HS
Probabilistic Performance-based Earthquake Engineering, Tongji University, Shanghai, China, Dec. 17-18, 2015

Application III
• Structural Insulated Panels (SIPs) are composite panelsfor energy efficient construction
• Composed of an energy-efficient core placed in betweenfacing materials
• Their application in seismic regions is limited by unacceptableperformance as demonstrated by cyclic testing
• Limited number of tests with realistic dynamic loading
• Hybrid simulation is ideal to test SIPs with a variety ofstructural configurations and ground motion excitations
50Probabilistic Performance-based Earthquake Engineering, Tongji University, Shanghai, China, Dec. 17-18, 2015
Application III
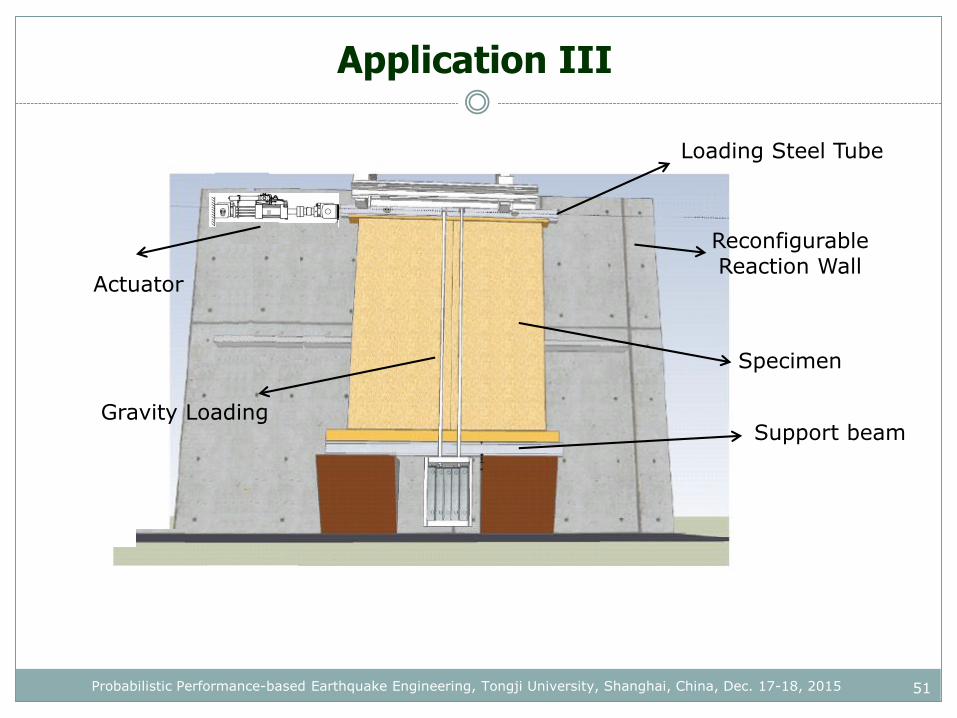
Reconfigurable Reaction Wall
Loading Steel Tube
Specimen
Gravity Loading
Actuator
Support beam
51Probabilistic Performance-based Earthquake Engineering, Tongji University, Shanghai, China, Dec. 17-18, 2015
Application III
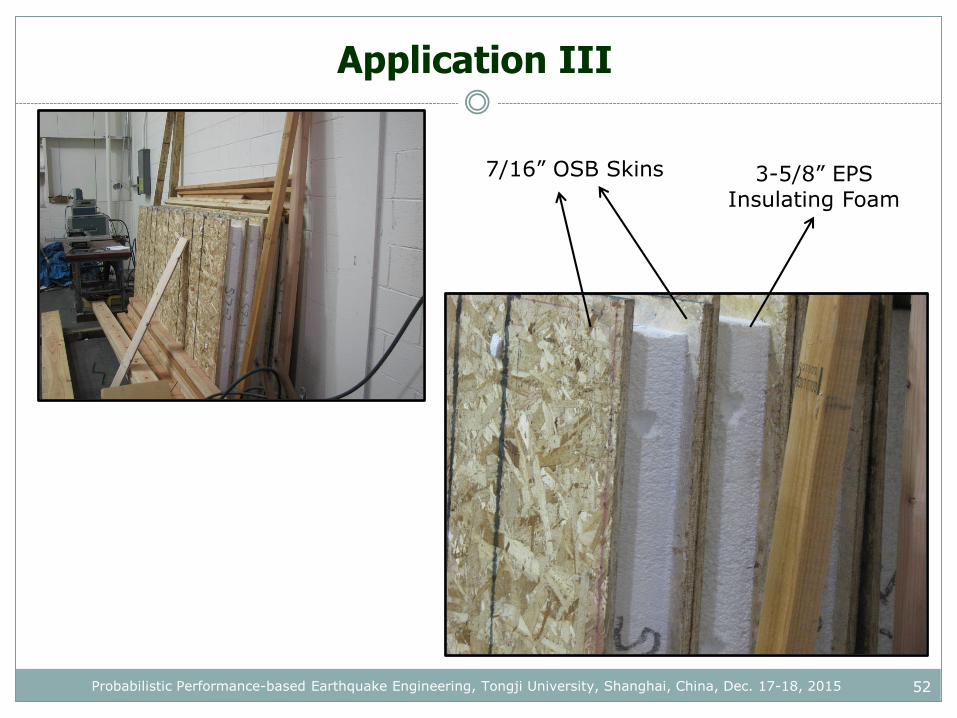
7/16” OSB Skins 3-5/8” EPS Insulating Foam
52Probabilistic Performance-based Earthquake Engineering, Tongji University, Shanghai, China, Dec. 17-18, 2015

Application III
Specimen Protocol Gravity Nail spacing [in] Remarks
S1 CUREE No 6 Conventional wood panel
S2 CUREE No 6 -
S3 CUREE Yes 6 -
S4 HS Yes 6 Near-fault pulse-type GM
S5 HS Yes 3 Near-fault pulse-type GM
S6 CUREE Yes 3 -
S7 HS Yes 3 Long duration, harmonic GM
S8 HS Yes 3Near-fault GM; 3 stories computational
substructure
• A parameter related to the design and construction of panels: Nail spacing• Parameters related to loading:
Presence of gravity loading Lateral loading: CUREE protocol vs HS Type of ground motion (Pulse type vs Long duration, harmonic)
• Parameter related to HS: Presence of an analytical substructure
2.Investigate the effects of:
1.Compare the responses of conventional wood panel vs SIPs
Test Matrix
53Probabilistic Performance-based Earthquake Engineering, Tongji University, Shanghai, China, Dec. 17-18, 2015
Application III
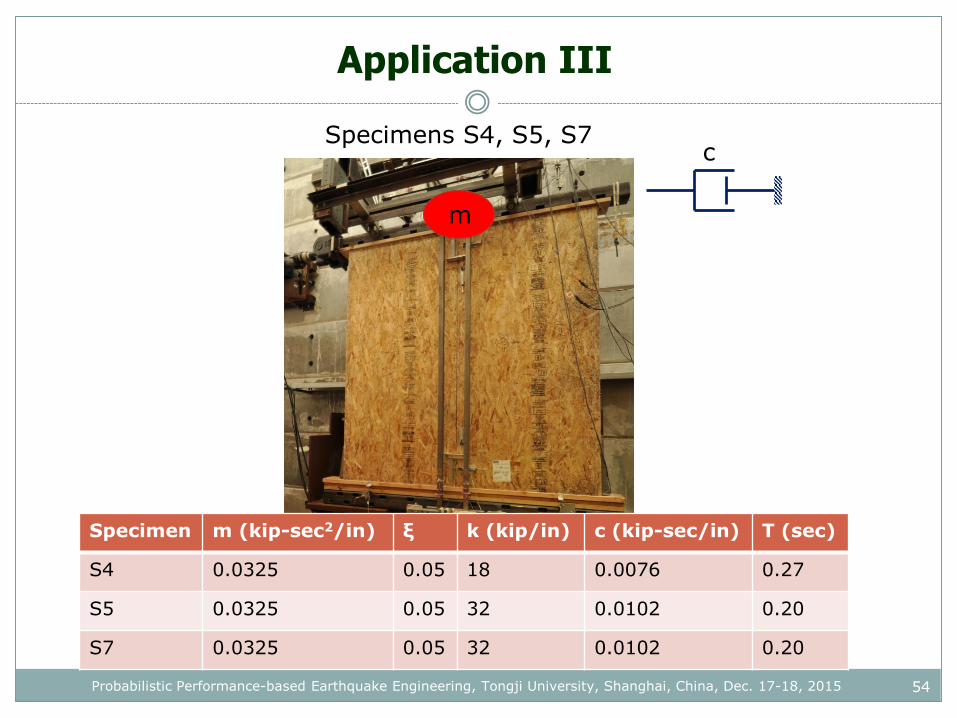
Specimens S4, S5, S7c
m
Specimen m (kip-sec2/in) ξ k (kip/in) c (kip-sec/in) T (sec)
S4 0.0325 0.05 18 0.0076 0.27
S5 0.0325 0.05 32 0.0102 0.20
S7 0.0325 0.05 32 0.0102 0.20
54Probabilistic Performance-based Earthquake Engineering, Tongji University, Shanghai, China, Dec. 17-18, 2015
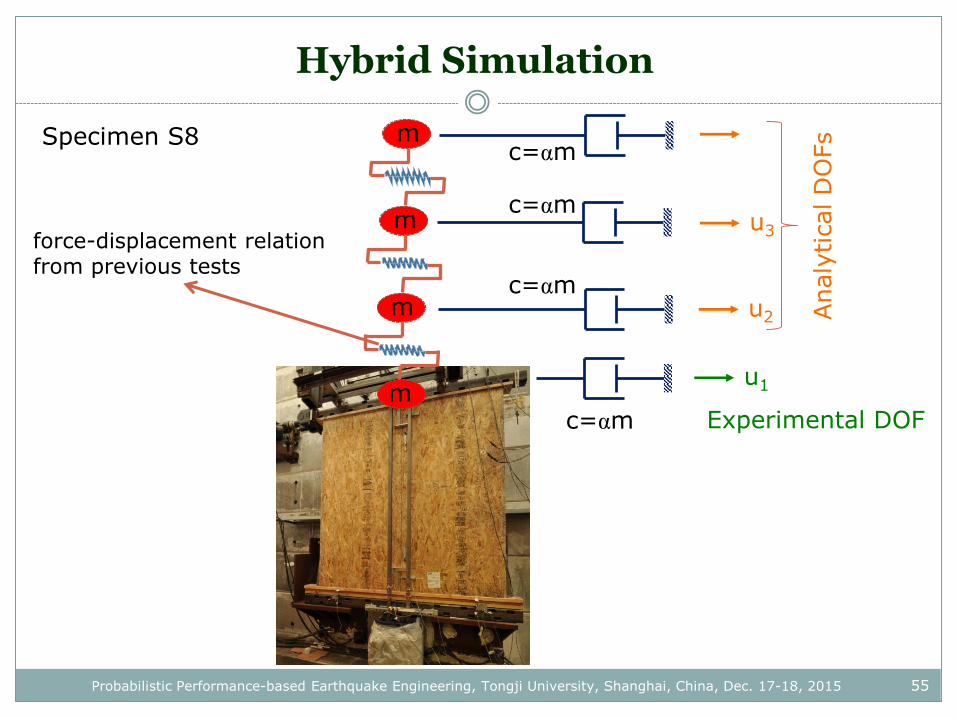
Hybrid Simulation
c=αmm
m
m
m
u1
Experimental DOF
u2
u3
c=αm
c=αm
c=αm
Analy
tical D
OFs
force-displacement relation from previous tests
Specimen S8
55Probabilistic Performance-based Earthquake Engineering, Tongji University, Shanghai, China, Dec. 17-18, 2015
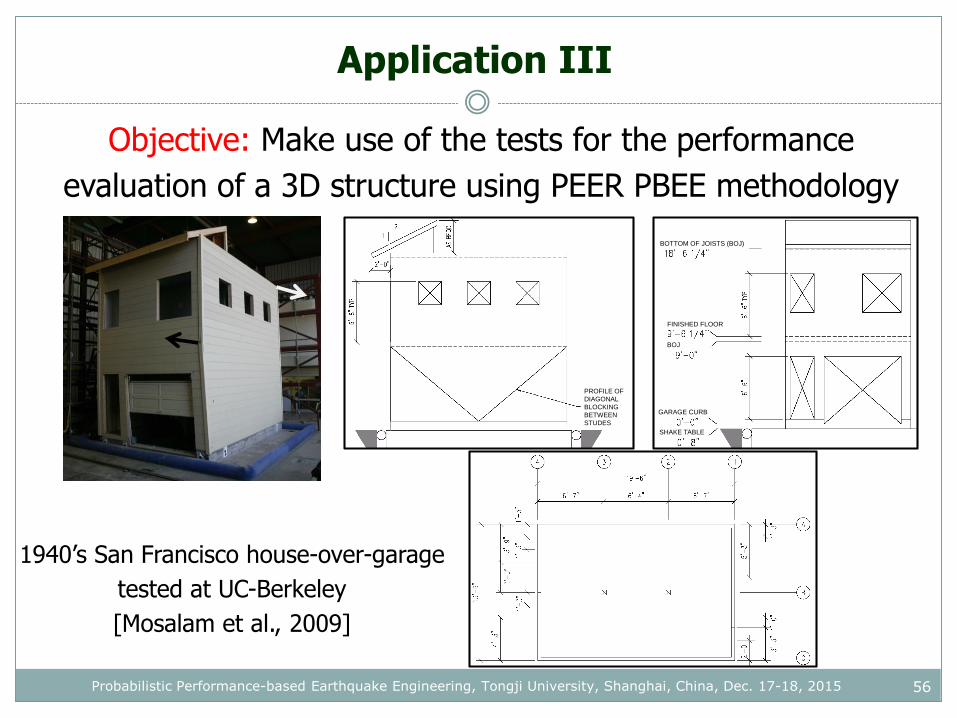
Application III
Objective: Make use of the tests for the performance
evaluation of a 3D structure using PEER PBEE methodology
PROFILE OF
DIAGONAL
BLOCKING
BETWEEN
STUDES
BOTTOM OF JOISTS (BOJ)
BOJ
FINISHED FLOOR
GARAGE CURB
SHAKE TABLE
1940’s San Francisco house-over-garage
tested at UC-Berkeley
[Mosalam et al., 2009]
56Probabilistic Performance-based Earthquake Engineering, Tongji University, Shanghai, China, Dec. 17-18, 2015
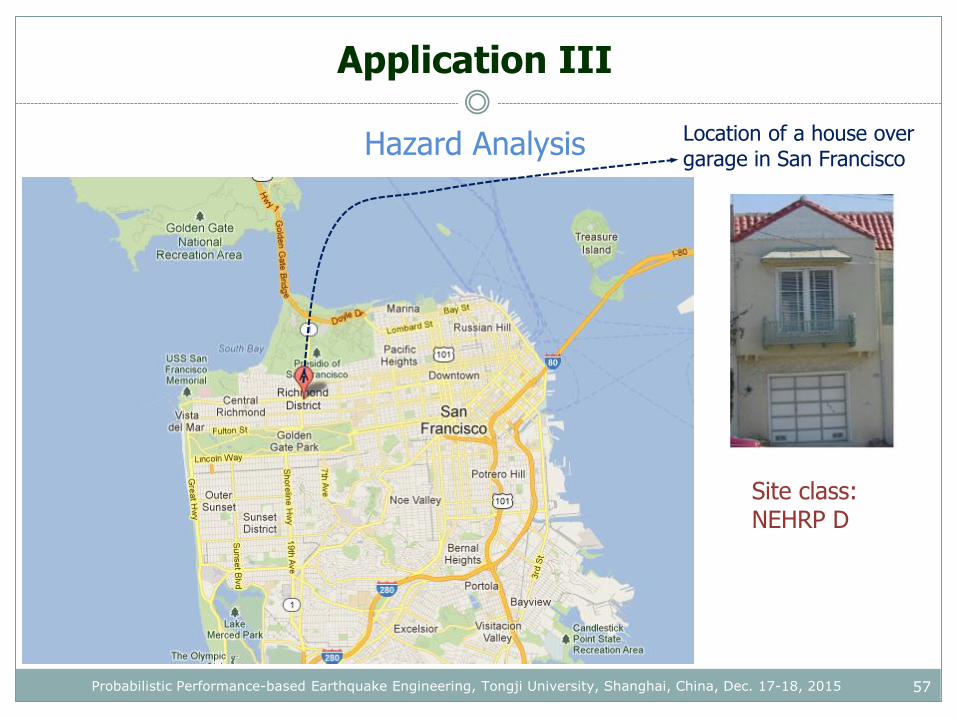
Application III
Hazard Analysis Location of a house over garage in San Francisco
Site class: NEHRP D
57Probabilistic Performance-based Earthquake Engineering, Tongji University, Shanghai, China, Dec. 17-18, 2015
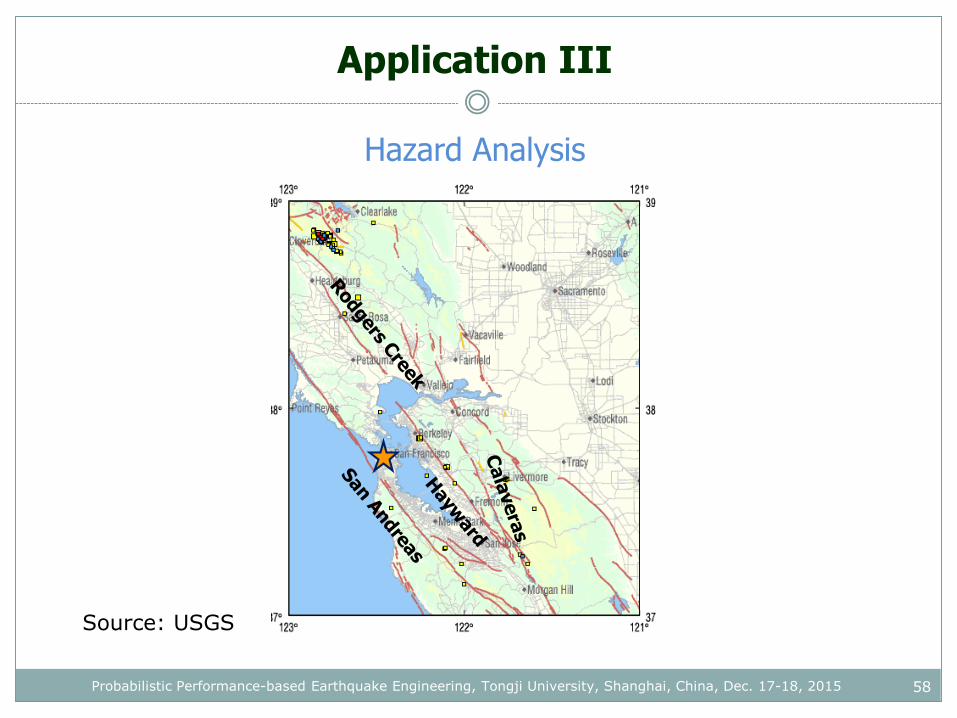
Application III
58
Source: USGS
Hazard Analysis
Probabilistic Performance-based Earthquake Engineering, Tongji University, Shanghai, China, Dec. 17-18, 2015
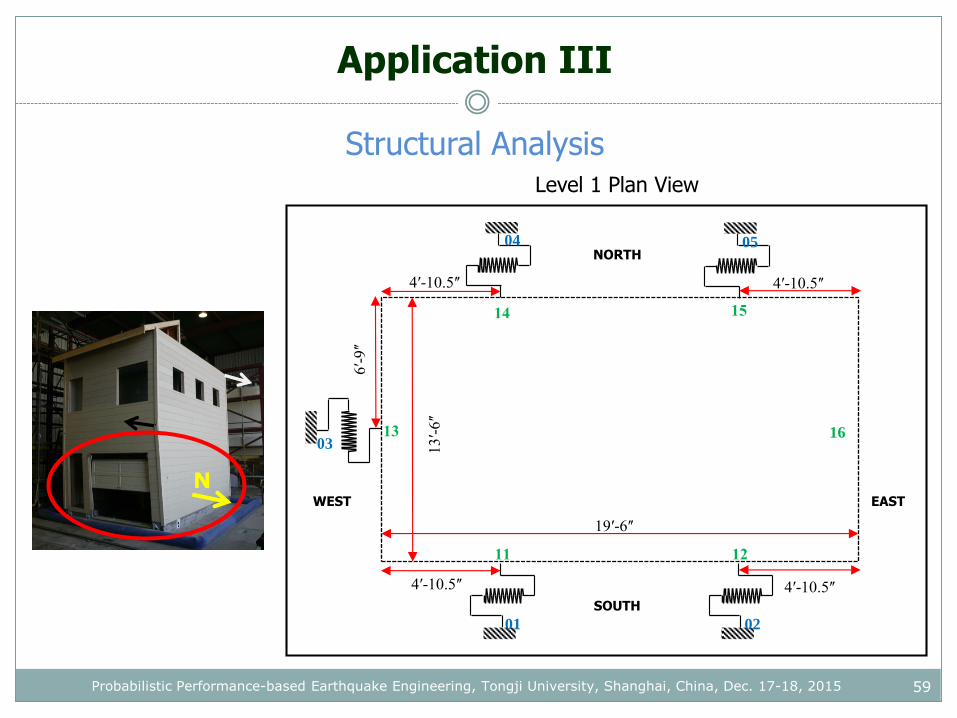
Application III
Structural Analysis
59
N
Level 1 Plan View
19ʹ-6ʺ
4ʹ-10.5ʺ
13ʹ-6ʺ
6ʹ-9ʺ
4ʹ-10.5ʺ
4ʹ-10.5ʺ4ʹ-10.5ʺ
01 02
03
04 05
11 12
13
14 15
16
NORTH
SOUTH
WEST EAST
Probabilistic Performance-based Earthquake Engineering, Tongji University, Shanghai, China, Dec. 17-18, 2015
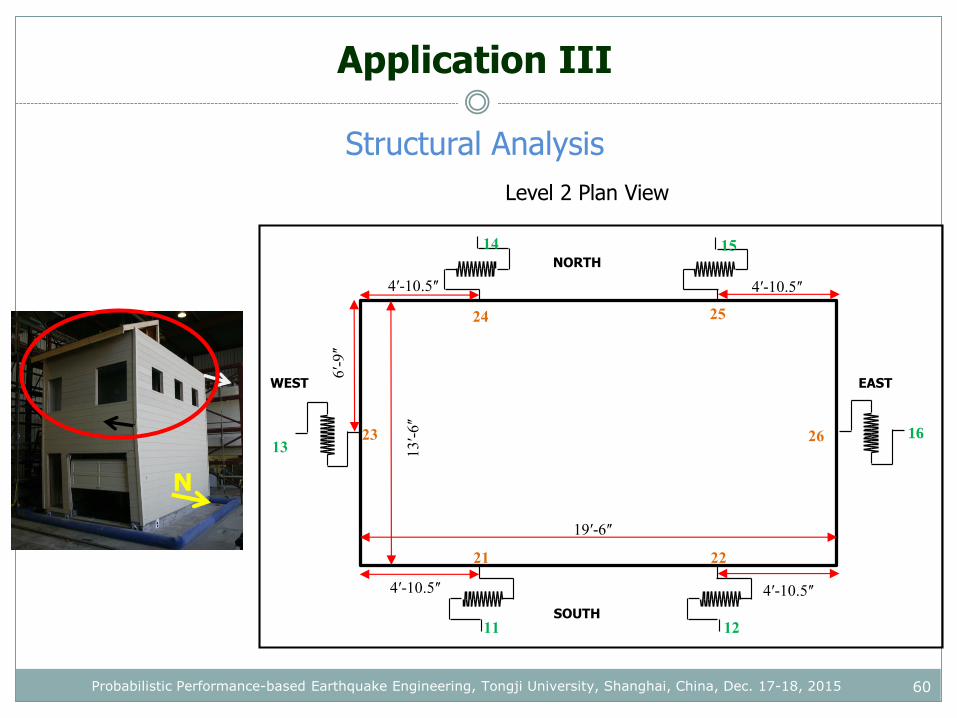
Application III
Structural Analysis
60
19ʹ-6ʺ
4ʹ-10.5ʺ
13ʹ-6ʺ
6ʹ-9ʺ
4ʹ-10.5ʺ
4ʹ-10.5ʺ4ʹ-10.5ʺ
11 12
13
14 15
21 22
23
24 25
26 16
NORTH
SOUTH
WEST
Level 2 Plan View
EAST
N
Probabilistic Performance-based Earthquake Engineering, Tongji University, Shanghai, China, Dec. 17-18, 2015
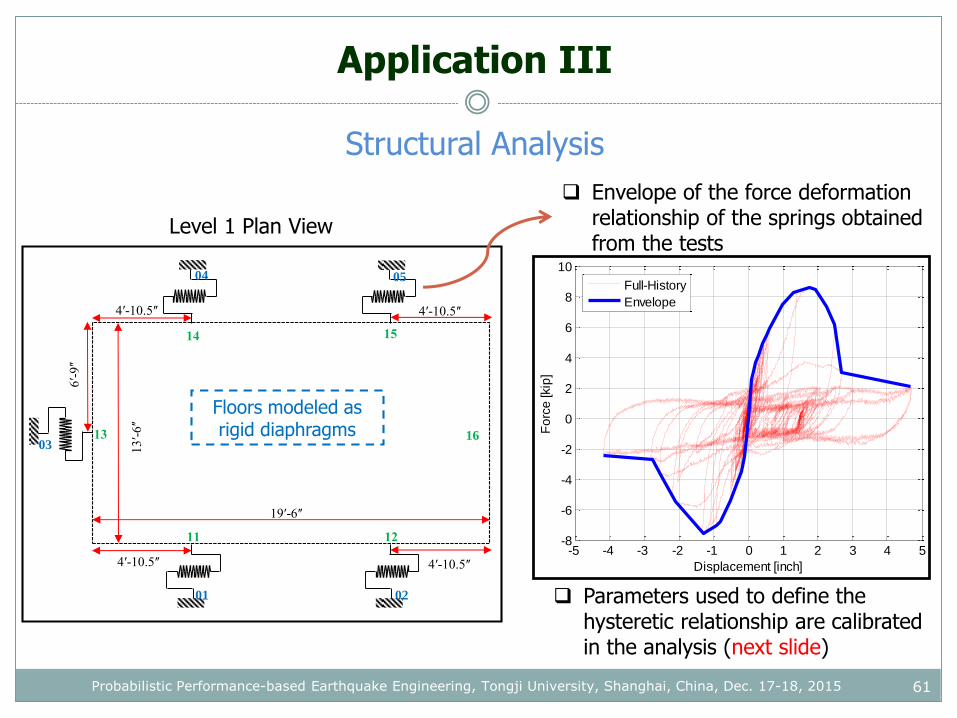
Application III
Structural Analysis
61
19ʹ-6ʺ
4ʹ-10.5ʺ
13ʹ-6ʺ
6ʹ-9ʺ
4ʹ-10.5ʺ
4ʹ-10.5ʺ4ʹ-10.5ʺ
01 02
03
04 05
11 12
13
14 15
16
Level 1 Plan View
Floors modeled as rigid diaphragms
Envelope of the force deformation relationship of the springs obtained from the tests
-5 -4 -3 -2 -1 0 1 2 3 4 5-8
-6
-4
-2
0
2
4
6
8
10
Displacement [inch]
Fo
rce
[kip
]
Full-History
Envelope
Parameters used to define the hysteretic relationship are calibrated in the analysis (next slide)
Probabilistic Performance-based Earthquake Engineering, Tongji University, Shanghai, China, Dec. 17-18, 2015
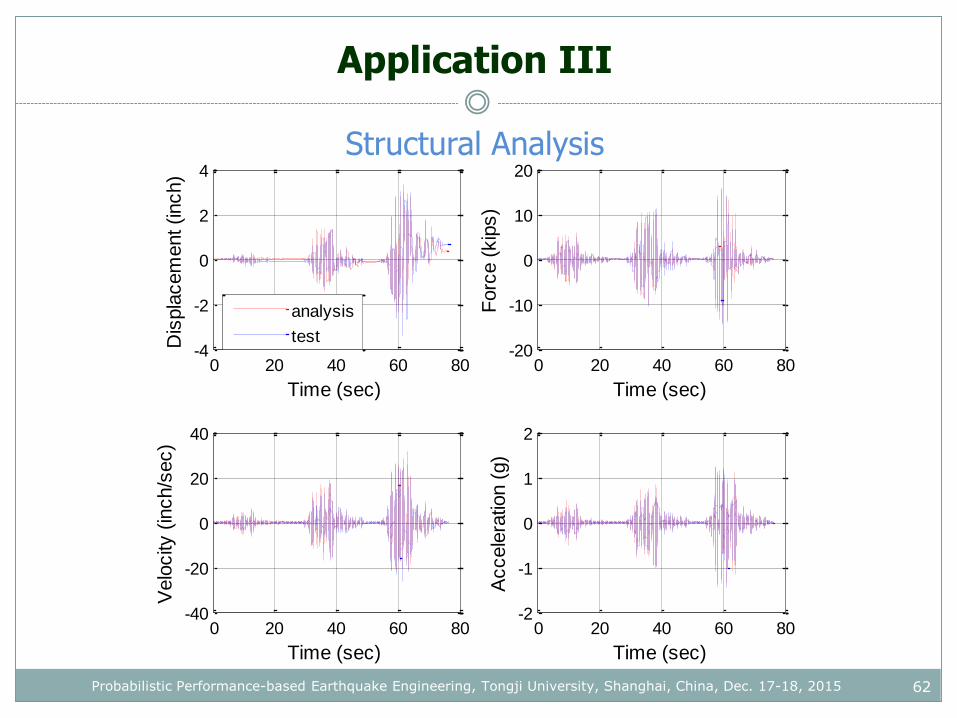
Application III
Structural Analysis
62
0 20 40 60 80-4
-2
0
2
4
Time (sec)
Dis
pla
cem
ent (inch)
0 20 40 60 80-20
-10
0
10
20
Time (sec)
Forc
e (
kip
s)
0 20 40 60 80-40
-20
0
20
40
Time (sec)
Velo
city
(in
ch/s
ec)
0 20 40 60 80-2
-1
0
1
2
Time (sec)
Accele
ratio
n (
g)
analysis
test
Probabilistic Performance-based Earthquake Engineering, Tongji University, Shanghai, China, Dec. 17-18, 2015
Application III
Structural Analysis
63
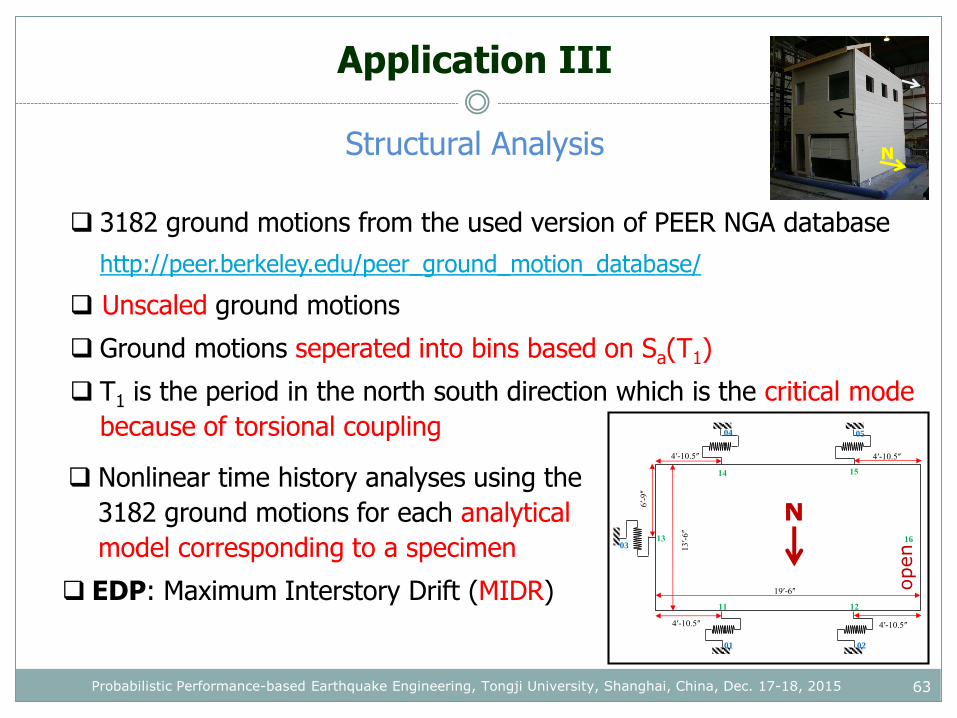
3182 ground motions from the used version of PEER NGA database
http://peer.berkeley.edu/peer_ground_motion_database/
Unscaled ground motions
Ground motions seperated into bins based on Sa(T1)
T1 is the period in the north south direction which is the critical mode
because of torsional coupling
Nonlinear time history analyses using the
3182 ground motions for each analytical
model corresponding to a specimen
EDP: Maximum Interstory Drift (MIDR)
N
19ʹ-6ʺ
4ʹ-10.5ʺ
13ʹ-6ʺ
6ʹ-9ʺ
4ʹ-10.5ʺ
4ʹ-10.5ʺ4ʹ-10.5ʺ
01 02
03
04 05
11 12
13
14 15
16
N
open
Probabilistic Performance-based Earthquake Engineering, Tongji University, Shanghai, China, Dec. 17-18, 2015
Application III
Damage Analysis
64
Forc
e
Displacement
Light
Moderate Severe
Collapse
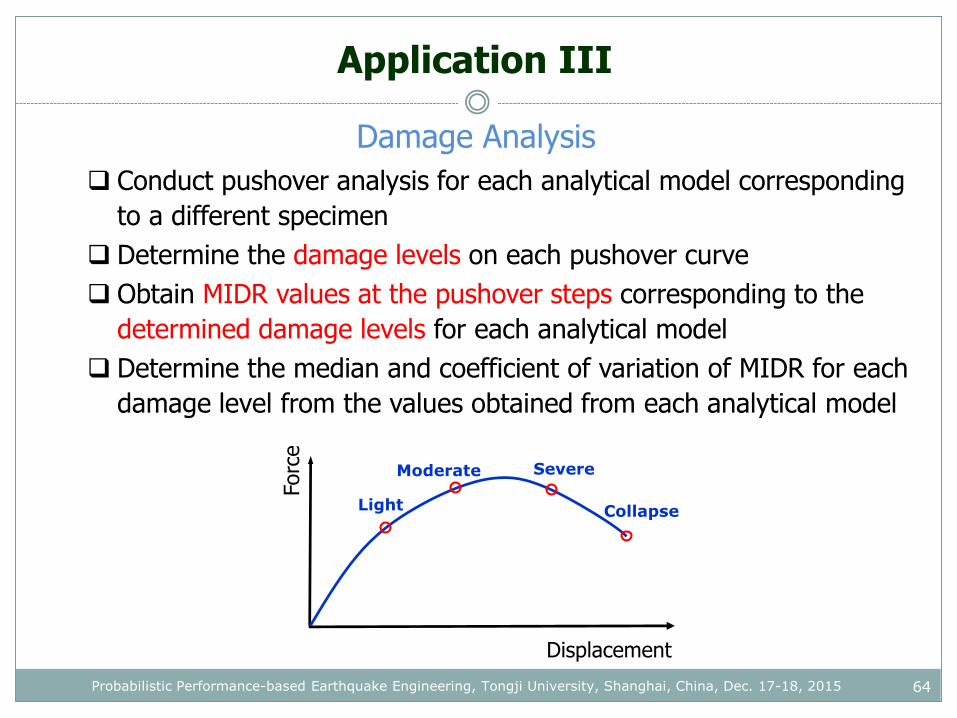
Conduct pushover analysis for each analytical model corresponding
to a different specimen
Determine the damage levels on each pushover curve
Obtain MIDR values at the pushover steps corresponding to the
determined damage levels for each analytical model
Determine the median and coefficient of variation of MIDR for each
damage level from the values obtained from each analytical model
Probabilistic Performance-based Earthquake Engineering, Tongji University, Shanghai, China, Dec. 17-18, 2015
Application III
Loss Analysis
65
Determine the median value of loss corresponding to each damage
level as a percentage of total value of the building
Determine the corresponding coefficient of variation
Obtain the loss curves from a probabilistic PBEE
Probabilistic Performance-based Earthquake Engineering, Tongji University, Shanghai, China, Dec. 17-18, 2015

66Probabilistic Performance-based Earthquake Engineering, Tongji University, Shanghai, China, Dec. 17-18, 2015
Questions?
http://www.ce.berkeley.edu/people/faculty/mosalam

Course Outline 2/2
67
Part II:
1. Application 1: Evaluation of the effect of unreinforced masonry infill walls on reinforced concrete frames with probabilistic PBEE
Questions
2. Application 2: PEER PBEE assessment of a shearwall building located on the University of California, Berkeley campus
Questions
3. Application 3: Evaluation of the seismic response of structural insulated panels with probabilistic PBEE
Questions
4. Future extension to multi-objective performance-based sustainable design
5. Recapitulation
Probabilistic Performance-based Earthquake Engineering, Tongji University, Shanghai, China, Dec. 17-18, 2015

II-4 Future Extension
& II-5 Recapitulation
KHALID M. MOSALAM, PROFESSOR
UNIVERSITY OF CALIFORNIA, BERKELEY
Probabilistic Performance-based Earthquake Engineering, Tongji University, Shanghai, China, Dec. 17-18, 2015

Introduction
69
Basic
Probabilistic Performance-based Earthquake Engineering, Tongji University, Shanghai, China, Dec. 17-18, 2015
Introduction
70
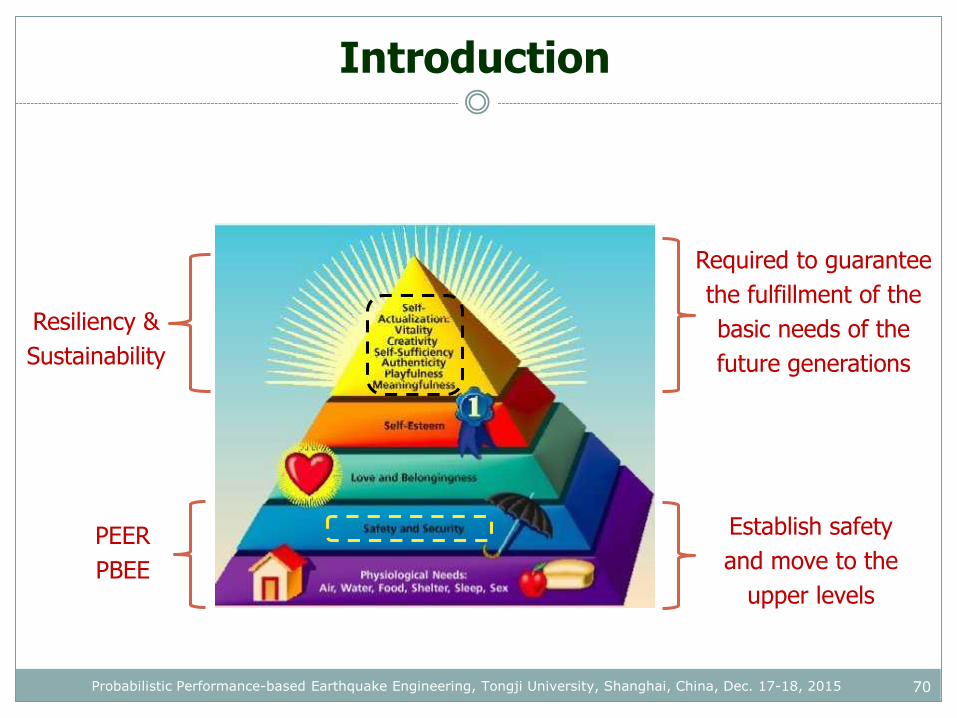
PEER
PBEE
Resiliency &
Sustainability
Establish safety
and move to the
upper levels
Required to guarantee
the fulfillment of the
basic needs of the
future generations
Probabilistic Performance-based Earthquake Engineering, Tongji University, Shanghai, China, Dec. 17-18, 2015
Introduction
71
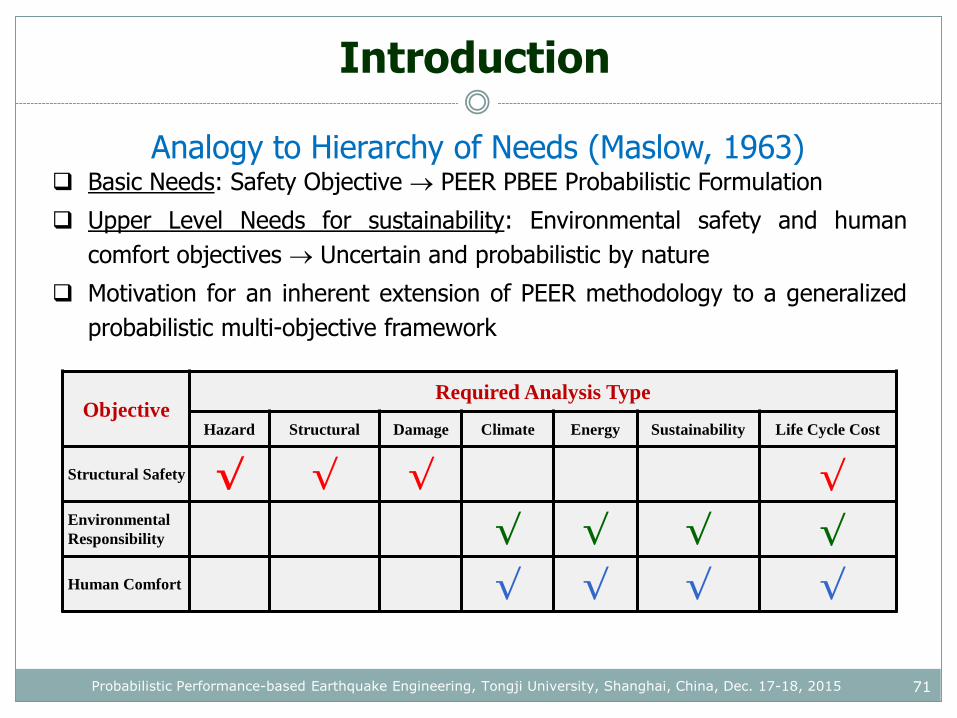
Basic Needs: Safety Objective PEER PBEE Probabilistic Formulation
Upper Level Needs for sustainability: Environmental safety and human
comfort objectives Uncertain and probabilistic by nature
Motivation for an inherent extension of PEER methodology to a generalized
probabilistic multi-objective framework
ObjectiveRequired Analysis Type
Hazard Structural Damage Climate Energy Sustainability Life Cycle Cost
Structural Safety √ √ √ √Environmental
Responsibility √ √ √ √
Human Comfort √ √ √ √
Analogy to Hierarchy of Needs (Maslow, 1963)
Probabilistic Performance-based Earthquake Engineering, Tongji University, Shanghai, China, Dec. 17-18, 2015
72
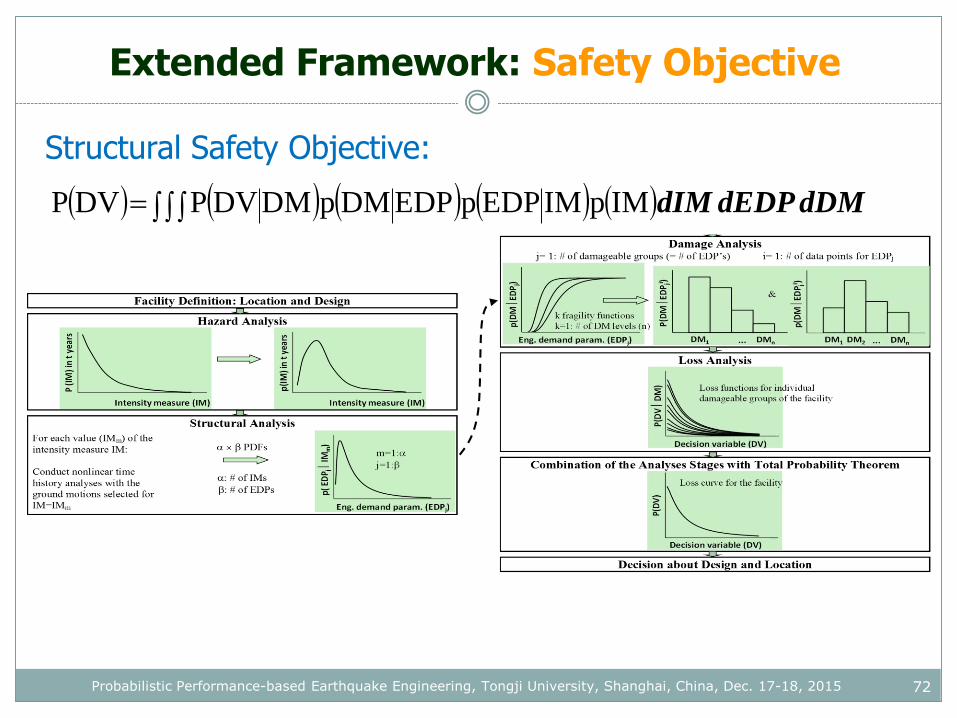
Structural Safety Objective:
dDMdEDPdIMIMpIMEDPpEDPDMpDMDVPDVP
Extended Framework: Safety Objective
Probabilistic Performance-based Earthquake Engineering, Tongji University, Shanghai, China, Dec. 17-18, 2015
Extended Framework: Environmental Responsibility Objective (ERO): Sustainability
73
P(S
DV
)
Sust. Dec. Variable (SDV) (EDV)
P(S
DV
EMi)
Sust. Dec. Variable (SDV)
p(C
V)
in t
ye
ars
Climate Variable (CV)
p (
EM|C
Vi)
Energy measure (EM)
For each CV value
Climate Analysis
Energy Analysis Sustainability Analysis
For each EM value
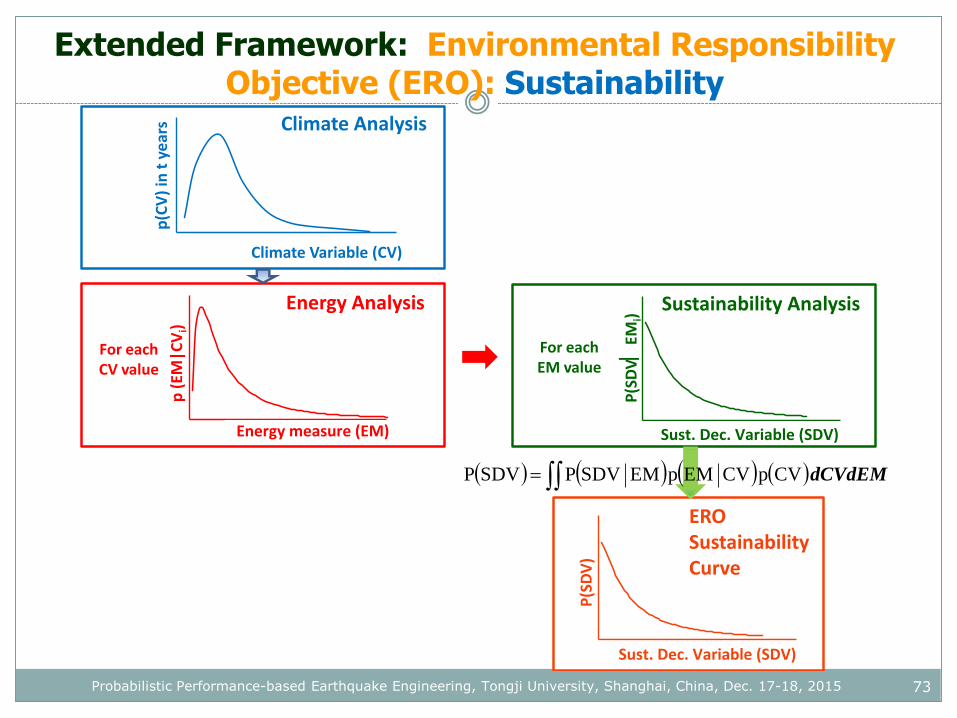
dCVdEMCVpCVEMpEMSDVPSDVP
EROSustainabilityCurve
Probabilistic Performance-based Earthquake Engineering, Tongji University, Shanghai, China, Dec. 17-18, 2015

Extended Framework: Environmental Responsibility Objective (ERO): Sustainability
74
dCVdEMCVpCVEMpEMSDVPSDVP
Sustainability Analysis
Energy Analysis
Climate Analysis
SDV : Sustainability Decision Variable, e.g. Carbon or ecological footprint
EM : Energy measure, e.g. Building energy
CV : Climate Variable, e.g. Temperature change
Probabilistic Performance-based Earthquake Engineering, Tongji University, Shanghai, China, Dec. 17-18, 2015
Extended Framework: Environmental Responsibility Objective (ERO): Life Cycle Cost
75
P(C
SV)
Cost Variable (CSV)
P(C
SV
EMi)
Cost Variable (CSV)
p(C
V)
in t
ye
ars
Climate Variable (CV)
p (
EM|C
Vi)
Energy measure (EM)
For each CV value
Climate Analysis
Energy Analysis Lifecycle Cost Analysis
For each EM value
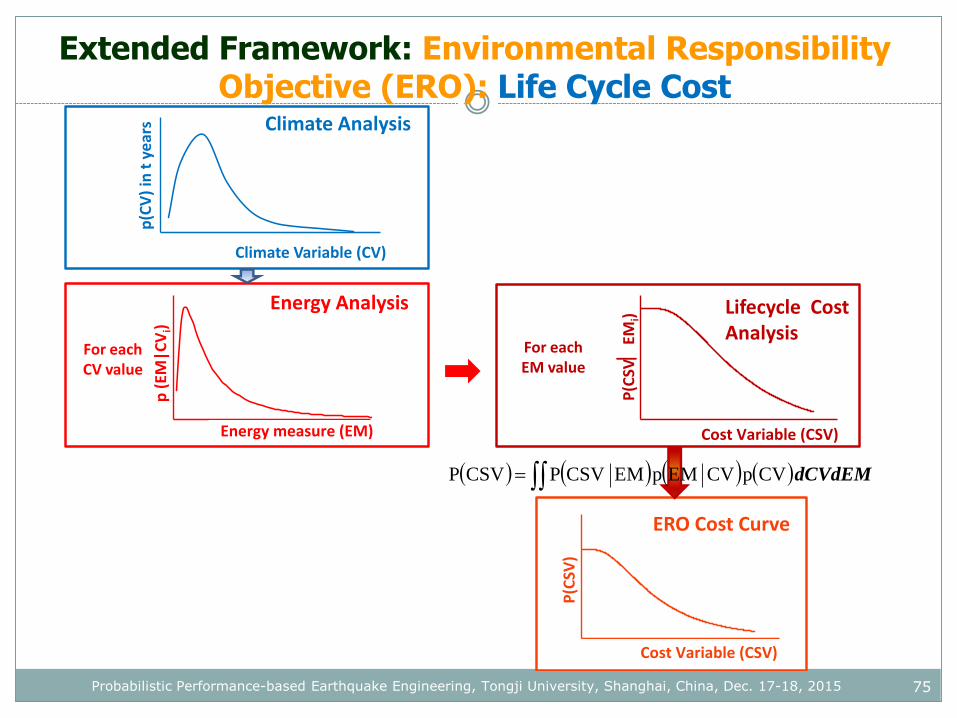
dCVdEMCVpCVEMpEMCSVPCSVP
ERO Cost Curve
Probabilistic Performance-based Earthquake Engineering, Tongji University, Shanghai, China, Dec. 17-18, 2015
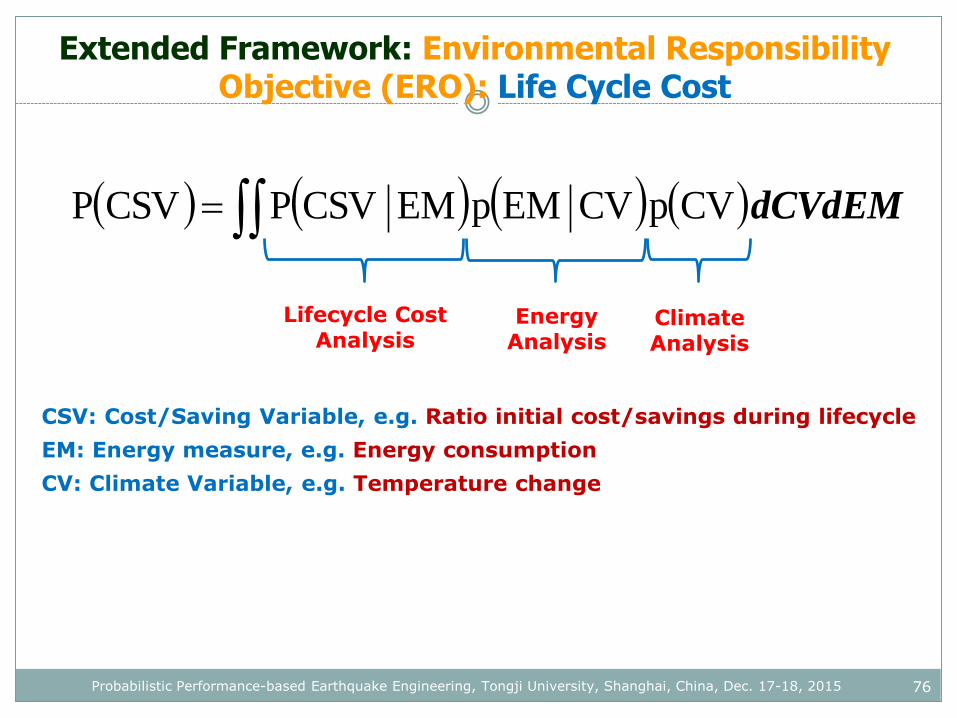
Extended Framework: Environmental Responsibility Objective (ERO): Life Cycle Cost
76
dCVdEMCVpCVEMpEMCSVPCSVP
Lifecycle CostAnalysis
Energy Analysis
Climate Analysis
CSV: Cost/Saving Variable, e.g. Ratio initial cost/savings during lifecycle
EM: Energy measure, e.g. Energy consumption
CV: Climate Variable, e.g. Temperature change
Probabilistic Performance-based Earthquake Engineering, Tongji University, Shanghai, China, Dec. 17-18, 2015
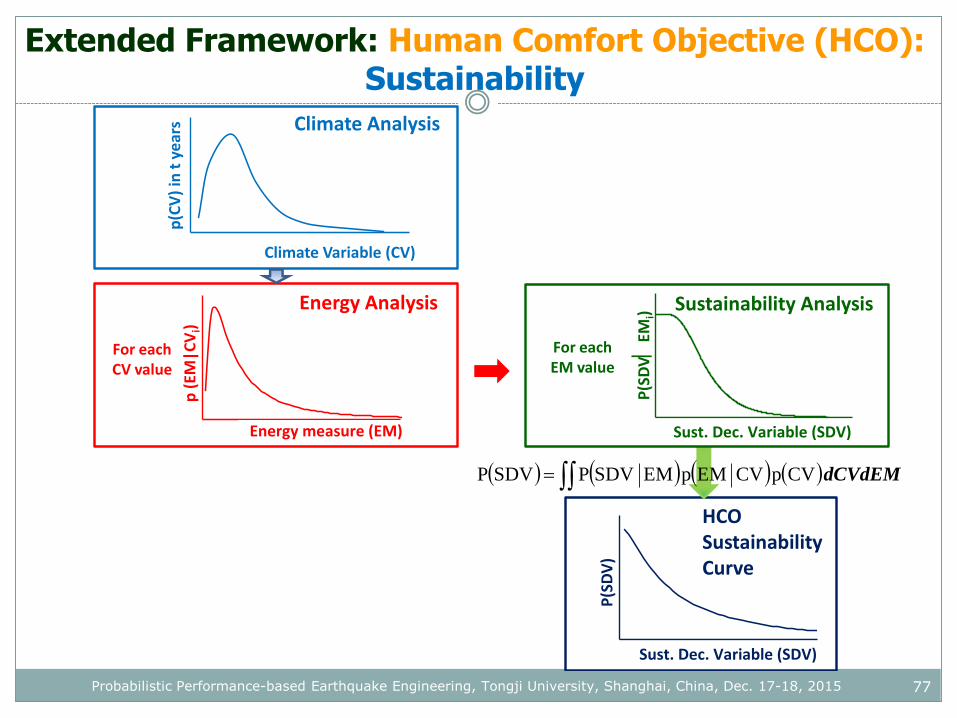
Extended Framework: Human Comfort Objective (HCO): Sustainability
77
P(S
DV
)
Sust. Dec. Variable (SDV) (EDV)
P(S
DV
EMi)
Sust. Dec. Variable (SDV)
p(C
V)
in t
ye
ars
Climate Variable (CV)
p (
EM|C
Vi)
Energy measure (EM)
For each CV value
Climate Analysis
Energy Analysis
dCVdEMCVpCVEMpEMSDVPSDVP
Sustainability Analysis
For each EM value
HCOSustainabilityCurve
Probabilistic Performance-based Earthquake Engineering, Tongji University, Shanghai, China, Dec. 17-18, 2015
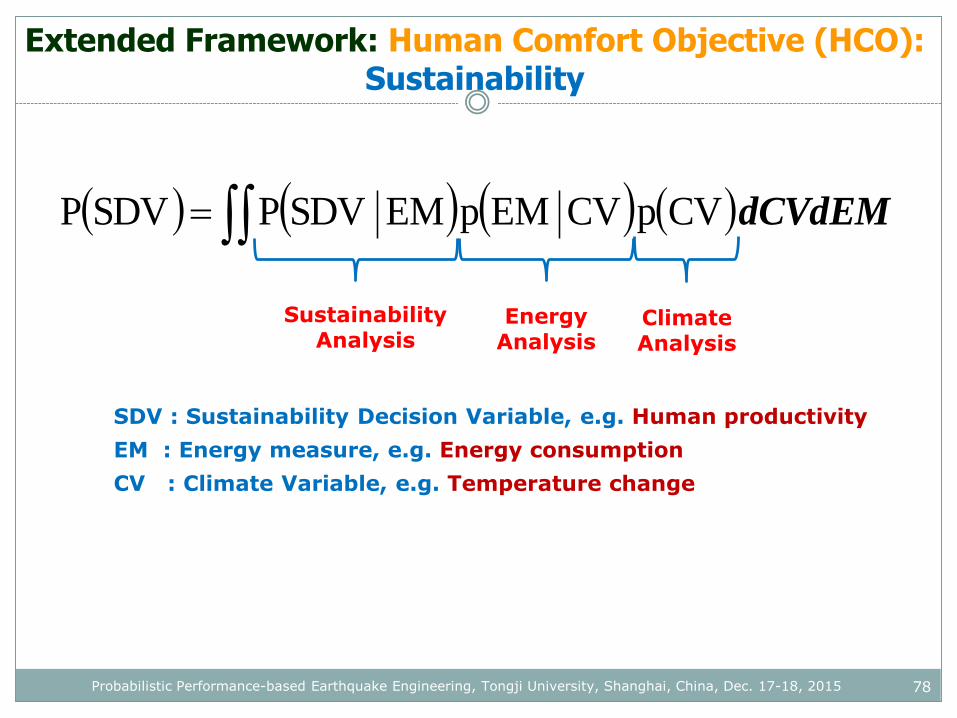
Extended Framework: Human Comfort Objective (HCO): Sustainability
78
dCVdEMCVpCVEMpEMSDVPSDVP
Sustainability Analysis
Energy Analysis
Climate Analysis
SDV : Sustainability Decision Variable, e.g. Human productivity
EM : Energy measure, e.g. Energy consumption
CV : Climate Variable, e.g. Temperature change
Probabilistic Performance-based Earthquake Engineering, Tongji University, Shanghai, China, Dec. 17-18, 2015
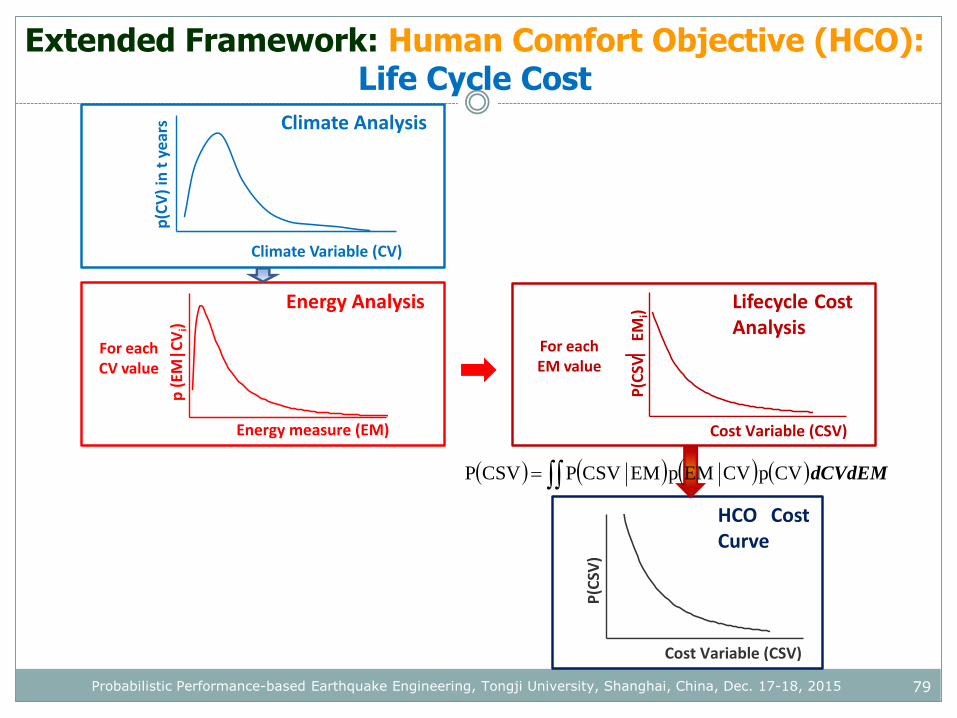
Extended Framework: Human Comfort Objective (HCO):Life Cycle Cost
79
P(C
SV)
Cost Variable (CSV)P
(CSV
EMi)
Cost Variable (CSV)
HCO CostCurve
p(C
V)
in t
ye
ars
Climate Variable (CV)
p (
EM|C
Vi)
Energy measure (EM)
For each CV value
Climate Analysis
Energy Analysis Lifecycle CostAnalysis
For each EM value
dCVdEMCVpCVEMpEMCSVPCSVP
Probabilistic Performance-based Earthquake Engineering, Tongji University, Shanghai, China, Dec. 17-18, 2015
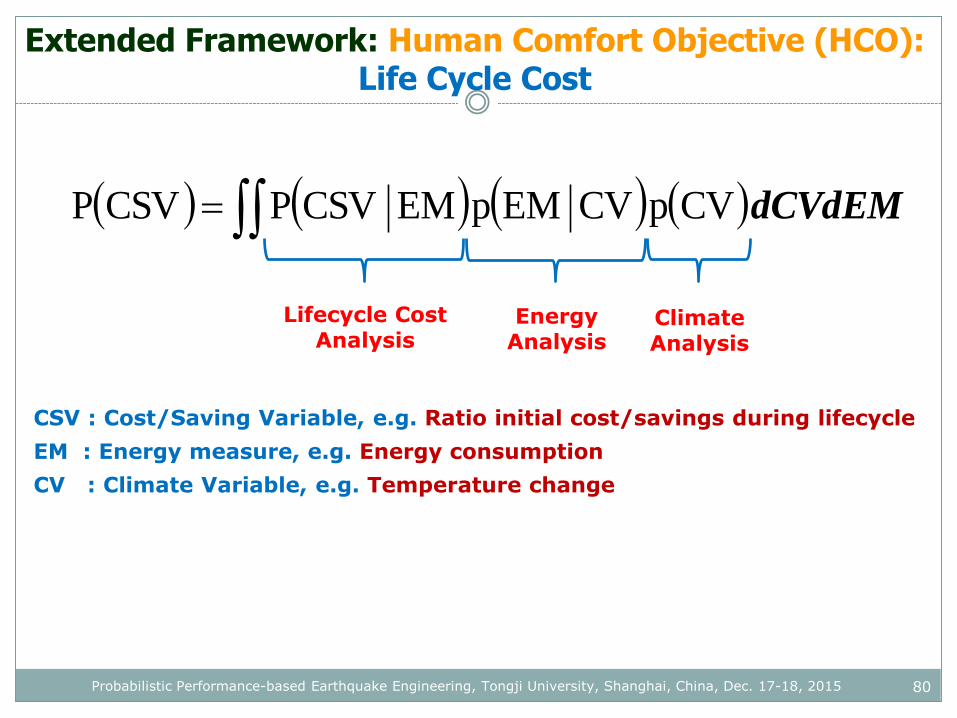
Extended Framework: Human Comfort Objective (HCO):Life Cycle Cost
80
dCVdEMCVpCVEMpEMCSVPCSVP
Lifecycle CostAnalysis
Energy Analysis
Climate Analysis
CSV : Cost/Saving Variable, e.g. Ratio initial cost/savings during lifecycle
EM : Energy measure, e.g. Energy consumption
CV : Climate Variable, e.g. Temperature change
Probabilistic Performance-based Earthquake Engineering, Tongji University, Shanghai, China, Dec. 17-18, 2015
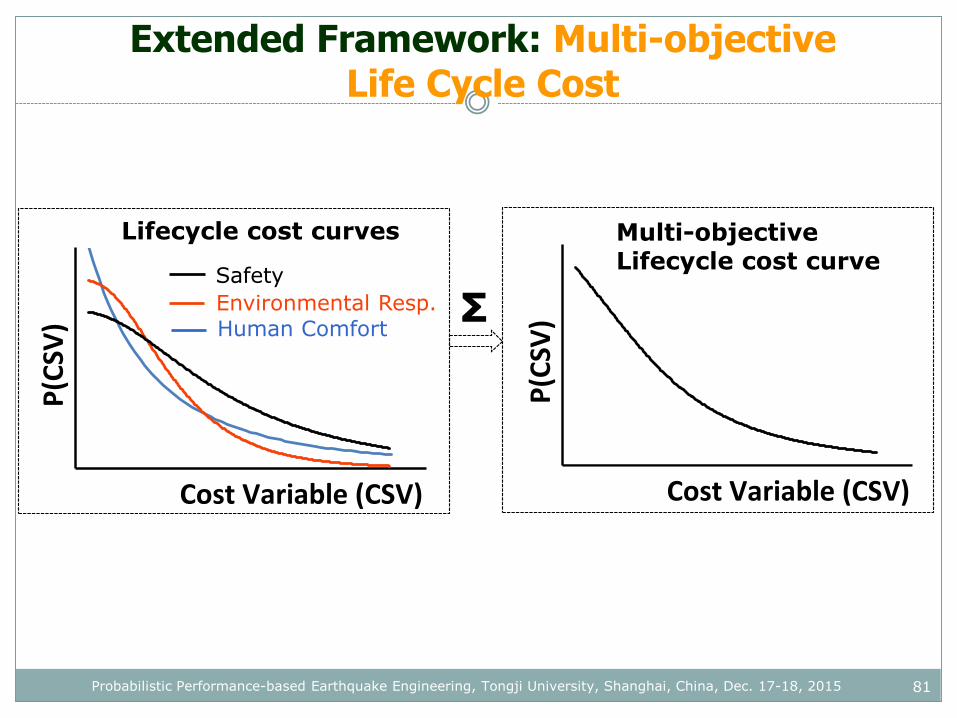
Extended Framework: Multi-objective Life Cycle Cost
81
P(C
SV)
Cost Variable (CSV)
P(C
SV)
Cost Variable (CSV)
Safety
Environmental Resp.Human Comfort
Lifecycle cost curves Multi-objectiveLifecycle cost curve
Σ
Probabilistic Performance-based Earthquake Engineering, Tongji University, Shanghai, China, Dec. 17-18, 2015
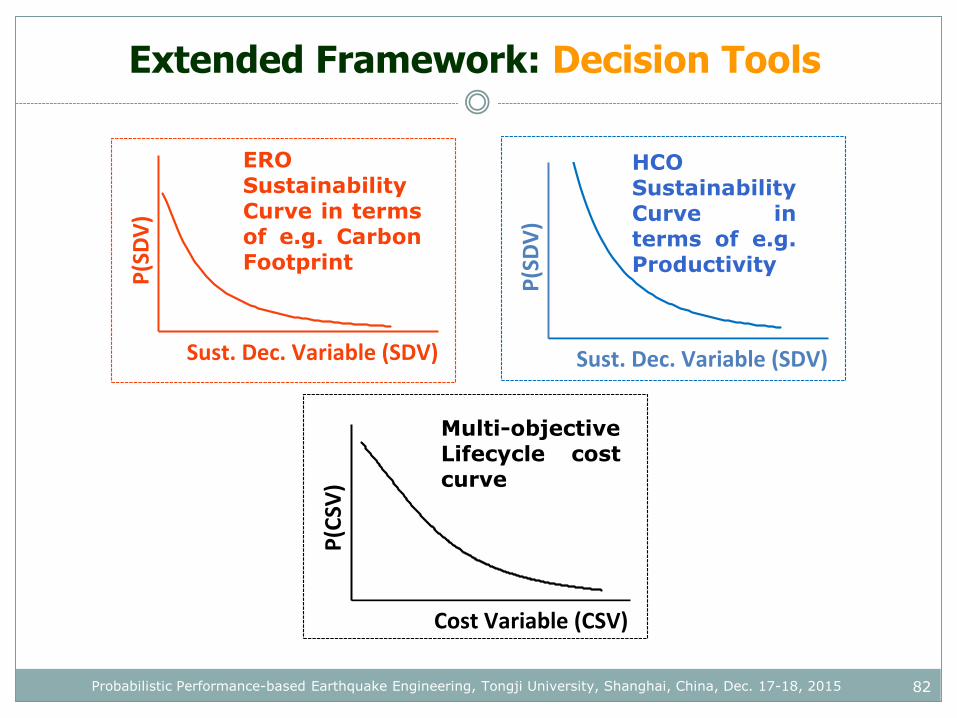
Extended Framework: Decision Tools
82
P(S
DV
)
Sust. Dec. Variable (SDV) P
(CSV
)
Cost Variable (CSV)
P(S
DV
)
Sust. Dec. Variable (SDV) (EDV)
EROSustainabilityCurve in termsof e.g. CarbonFootprint
Multi-objectiveLifecycle costcurve
HCOSustainabilityCurve interms of e.g.Productivity
Probabilistic Performance-based Earthquake Engineering, Tongji University, Shanghai, China, Dec. 17-18, 2015
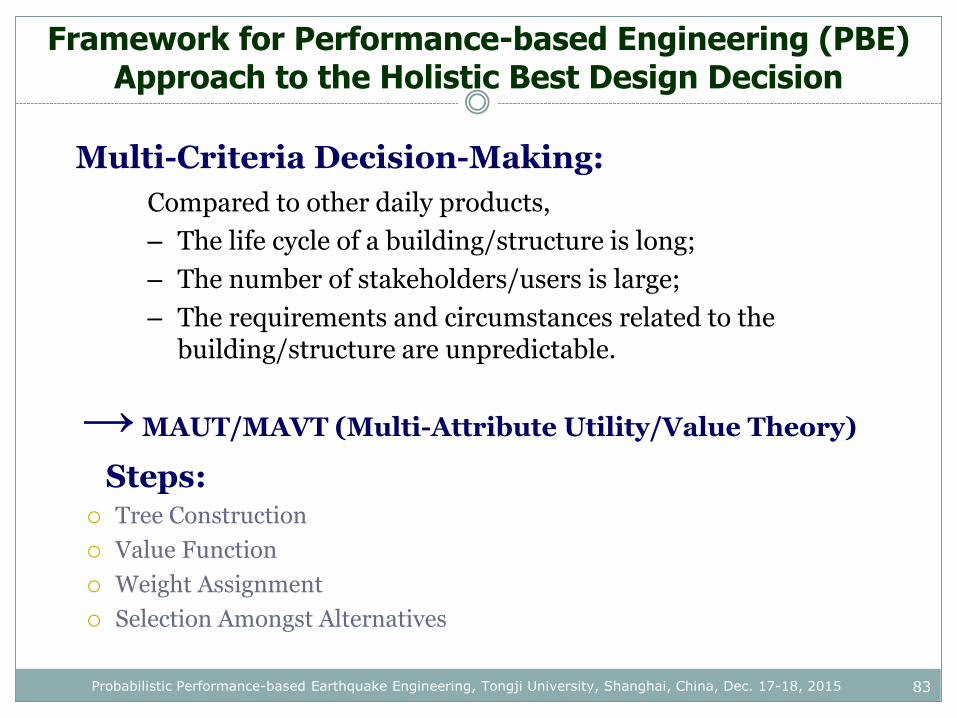
Framework for Performance-based Engineering (PBE) Approach to the Holistic Best Design Decision
83
→MAUT/MAVT (Multi-Attribute Utility/Value Theory)
Steps: Tree Construction
Value Function
Weight Assignment
Selection Amongst Alternatives
Multi-Criteria Decision-Making:
Compared to other daily products,
– The life cycle of a building/structure is long;
– The number of stakeholders/users is large;
– The requirements and circumstances related to the building/structure are unpredictable.
Probabilistic Performance-based Earthquake Engineering, Tongji University, Shanghai, China, Dec. 17-18, 2015
Extended Framework: Systematic Decision
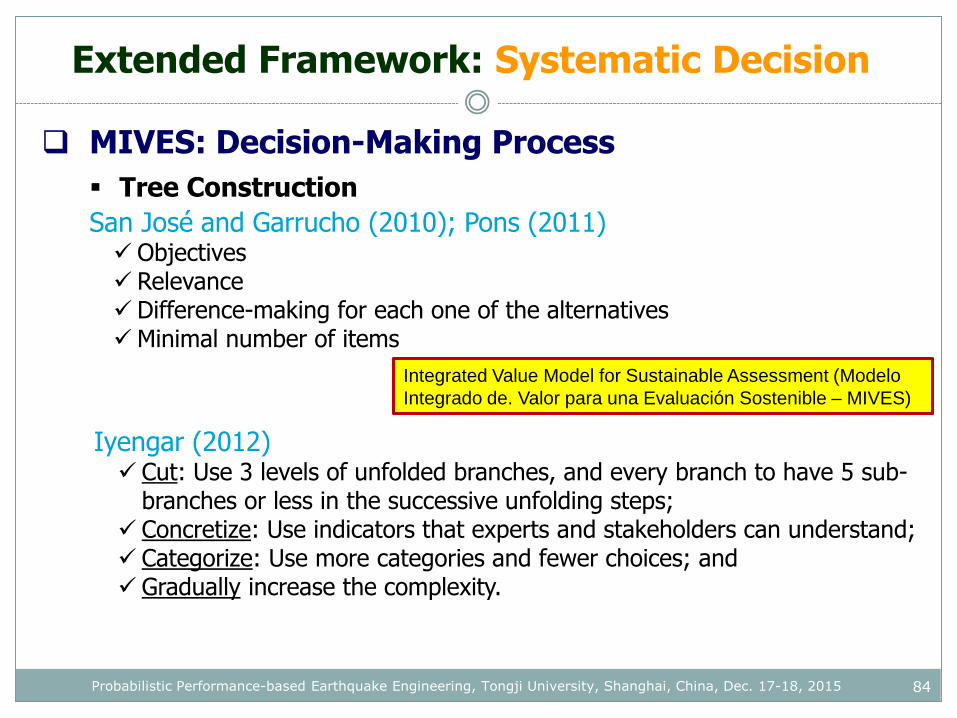
84
MIVES: Decision-Making Process
Tree Construction
San José and Garrucho (2010); Pons (2011) Objectives Relevance Difference-making for each one of the alternativesMinimal number of items
Iyengar (2012) Cut: Use 3 levels of unfolded branches, and every branch to have 5 sub-
branches or less in the successive unfolding steps; Concretize: Use indicators that experts and stakeholders can understand; Categorize: Use more categories and fewer choices; and Gradually increase the complexity.
Probabilistic Performance-based Earthquake Engineering, Tongji University, Shanghai, China, Dec. 17-18, 2015
Integrated Value Model for Sustainable Assessment (Modelo
Integrado de. Valor para una Evaluación Sostenible – MIVES)
Extended Framework: Systematic Decision
85
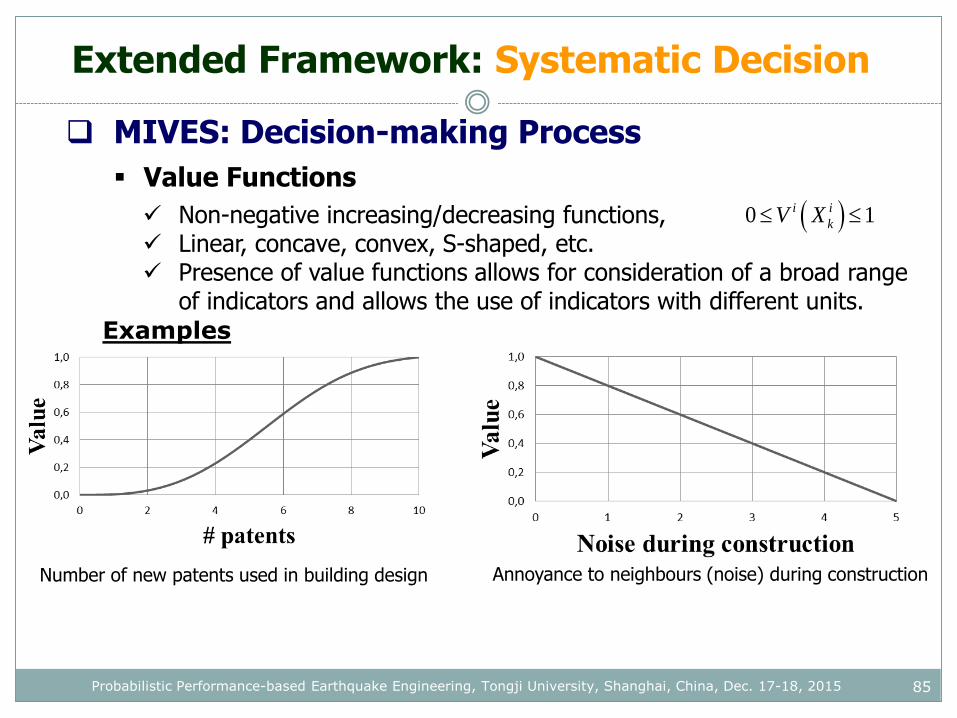
MIVES: Decision-making Process
Value Functions
Number of new patents used in building design Annoyance to neighbours (noise) during construction
Examples
Non-negative increasing/decreasing functions, Linear, concave, convex, S-shaped, etc. Presence of value functions allows for consideration of a broad range
of indicators and allows the use of indicators with different units.
0 1i i
kV X
Probabilistic Performance-based Earthquake Engineering, Tongji University, Shanghai, China, Dec. 17-18, 2015
Extended Framework: Systematic Decision
86
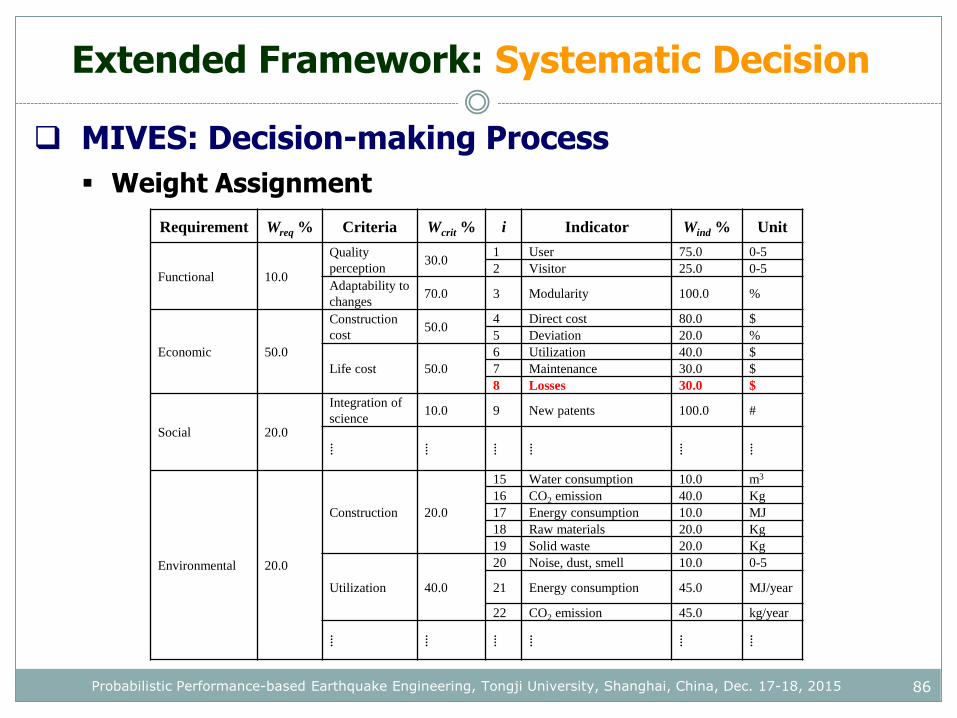
MIVES: Decision-making Process
Weight Assignment
Requirement Wreq % Criteria Wcrit % i Indicator Wind % Unit
Functional 10.0
Quality
perception30.0
1 User 75.0 0-5
2 Visitor 25.0 0-5
Adaptability to
changes70.0 3 Modularity 100.0 %
Economic 50.0
Construction
cost50.0
4 Direct cost 80.0 $
5 Deviation 20.0 %
Life cost 50.0
6 Utilization 40.0 $
7 Maintenance 30.0 $
8 Losses 30.0 $
Social 20.0
Integration of
science10.0 9 New patents 100.0 #
⁞ ⁞ ⁞ ⁞ ⁞ ⁞
Environmental 20.0
Construction 20.0
15 Water consumption 10.0 m3
16 CO2 emission 40.0 Kg
17 Energy consumption 10.0 MJ
18 Raw materials 20.0 Kg
19 Solid waste 20.0 Kg
Utilization 40.0
20 Noise, dust, smell 10.0 0-5
21 Energy consumption 45.0 MJ/year
22 CO2 emission 45.0 kg/year
⁞ ⁞ ⁞ ⁞ ⁞ ⁞
Probabilistic Performance-based Earthquake Engineering, Tongji University, Shanghai, China, Dec. 17-18, 2015
Extended Framework: Systematic Decision
87
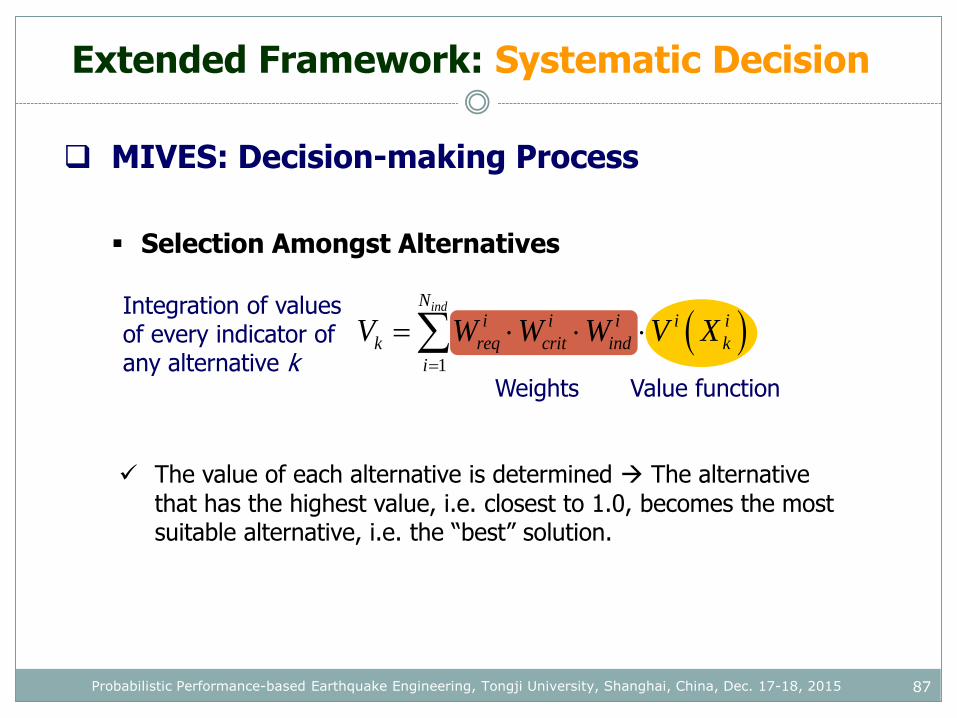
MIVES: Decision-making Process
Selection Amongst Alternatives
1
indNi i i i i
k req crit ind k
i
V W W W V X
Value functionWeights
Integration of values of every indicator ofany alternative k
The value of each alternative is determined The alternative
that has the highest value, i.e. closest to 1.0, becomes the most suitable alternative, i.e. the “best” solution.
Probabilistic Performance-based Earthquake Engineering, Tongji University, Shanghai, China, Dec. 17-18, 2015
Extended Framework: Systematic Decision
88
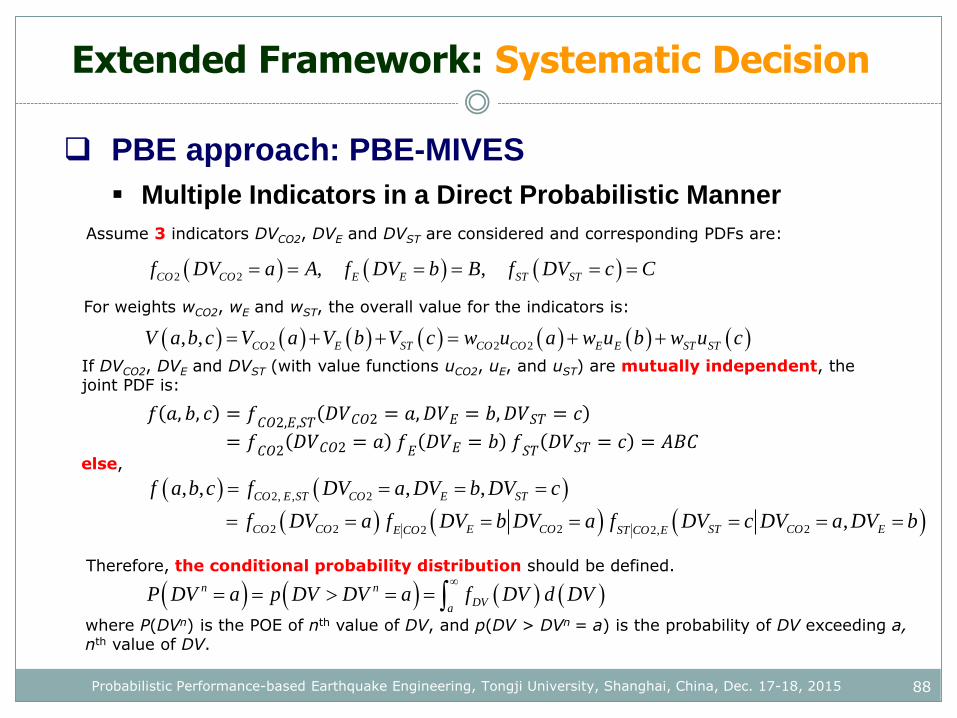
PBE approach: PBE-MIVES
Multiple Indicators in a Direct Probabilistic Manner
2 2 , ,CO CO E E ST STf DV a A f DV b B f DV c C
2 2 2, , CO E ST CO CO E E ST STV a b c V a V b V c w u a w u b w u c
2, , 2
2 2 2 22 2,
, , , ,
,
CO E ST CO E ST
CO CO E CO ST CO EE CO ST CO E
f a b c f DV a DV b DV c
f DV a f DV b DV a f DV c DV a DV b
n n
DVa
P DV a p DV DV a f DV d DV
where P(DVn) is the POE of nth value of DV, and p(DV > DVn = a) is the probability of DV exceeding a, nth value of DV.
Assume 3 indicators DVCO2, DVE and DVST are considered and corresponding PDFs are:
For weights wCO2, wE and wST, the overall value for the indicators is:
If DVCO2, DVE and DVST (with value functions uCO2, uE, and uST) are mutually independent, the joint PDF is:
else,
Therefore, the conditional probability distribution should be defined.
Probabilistic Performance-based Earthquake Engineering, Tongji University, Shanghai, China, Dec. 17-18, 2015
Extended Framework: Systematic Decision
89
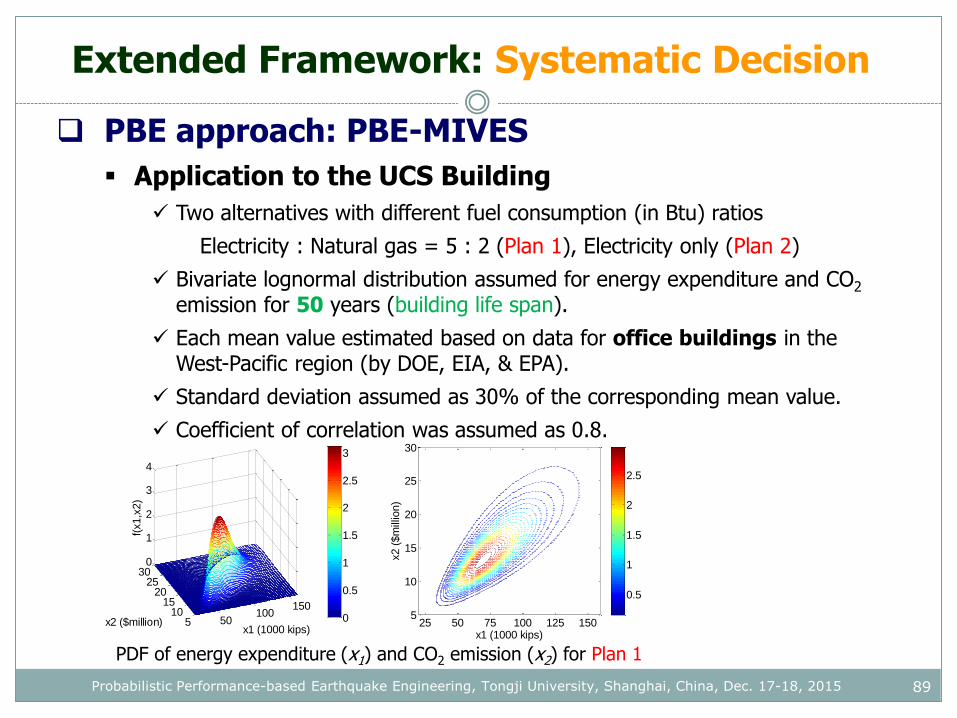
PBE approach: PBE-MIVES
Application to the UCS Building
Two alternatives with different fuel consumption (in Btu) ratios
Electricity : Natural gas = 5 : 2 (Plan 1), Electricity only (Plan 2)
Bivariate lognormal distribution assumed for energy expenditure and CO2
emission for 50 years (building life span).
Each mean value estimated based on data for office buildings in the West-Pacific region (by DOE, EIA, & EPA).
Standard deviation assumed as 30% of the corresponding mean value.
Coefficient of correlation was assumed as 0.8.
50100
150
510
1520
2530
0
1
2
3
4
x1 (1000 kips)x2 ($million)
f(x1,x
2)
0
0.5
1
1.5
2
2.5
3
x1 (1000 kips)
x2 (
$m
illio
n)
25 50 75 100 125 1505
10
15
20
25
30
0.5
1
1.5
2
2.5
PDF of energy expenditure (x1) and CO2 emission (x2) for Plan 1
Probabilistic Performance-based Earthquake Engineering, Tongji University, Shanghai, China, Dec. 17-18, 2015
Extended Framework: Systematic Decision
90
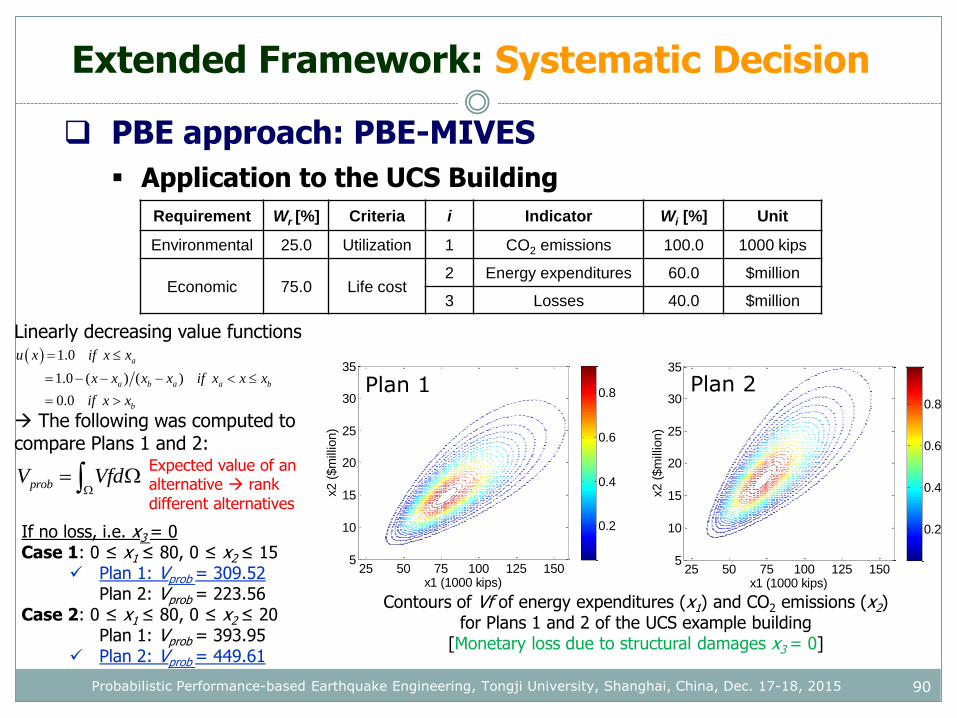
Requirement Wr [%] Criteria i Indicator Wi [%] Unit
Environmental 25.0 Utilization 1 CO2 emissions 100.0 1000 kips
Economic 75.0 Life cost2 Energy expenditures 60.0 $million
3 Losses 40.0 $million
PBE approach: PBE-MIVES
Application to the UCS Building
Contours of Vf of energy expenditures (x1) and CO2 emissions (x2) for Plans 1 and 2 of the UCS example building
[Monetary loss due to structural damages x3 = 0]
x1 (1000 kips)
x2 (
$m
illio
n)
25 50 75 100 125 1505
10
15
20
25
30
35
0.2
0.4
0.6
0.8
x1 (1000 kips)
x2 (
$m
illio
n)
25 50 75 100 125 1505
10
15
20
25
30
35
0.2
0.4
0.6
0.8
Plan 1 Plan 2
probV Vfd
Linearly decreasing value functions
The following was computed to compare Plans 1 and 2:
1.0
1.0 ( ) ( )
0.0
a
a b a a b
b
u x if x x
x x x x if x x x
if x x
Expected value of an alternative rank different alternatives
If no loss, i.e. x3 = 0Case 1: 0 ≤ x1 ≤ 80, 0 ≤ x2 ≤ 15
Plan 1: Vprob = 309.52Plan 2: Vprob = 223.56
Case 2: 0 ≤ x1 ≤ 80, 0 ≤ x2 ≤ 20Plan 1: Vprob = 393.95
Plan 2: Vprob = 449.61
Probabilistic Performance-based Earthquake Engineering, Tongji University, Shanghai, China, Dec. 17-18, 2015
Extended Framework: Systematic Decision
91
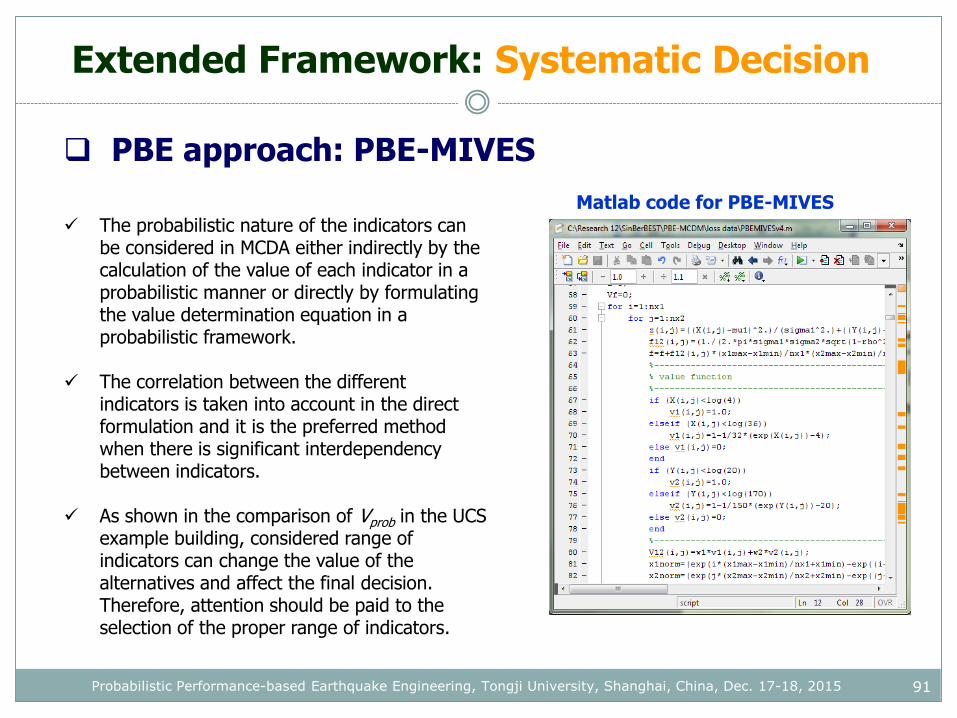
PBE approach: PBE-MIVES
The probabilistic nature of the indicators can be considered in MCDA either indirectly by the calculation of the value of each indicator in a probabilistic manner or directly by formulating the value determination equation in a probabilistic framework.
The correlation between the different indicators is taken into account in the direct formulation and it is the preferred method when there is significant interdependency between indicators.
As shown in the comparison of Vprob in the UCS example building, considered range of indicators can change the value of the alternatives and affect the final decision. Therefore, attention should be paid to the selection of the proper range of indicators.
Matlab code for PBE-MIVES
Probabilistic Performance-based Earthquake Engineering, Tongji University, Shanghai, China, Dec. 17-18, 2015
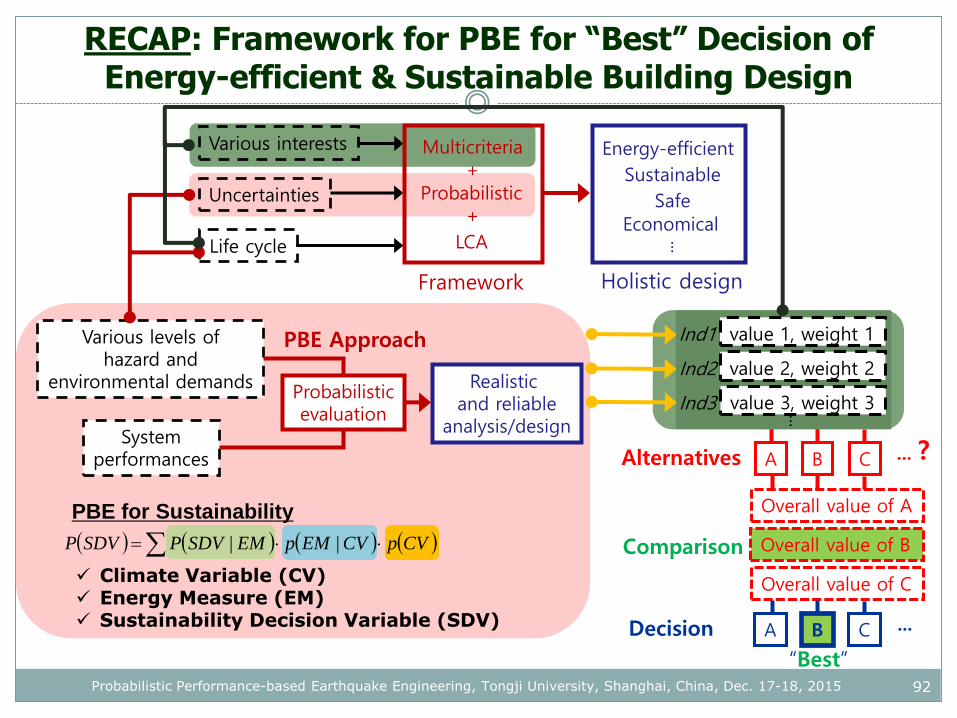
RECAP: Framework for PBE for “Best” Decision of Energy-efficient & Sustainable Building Design
92
Framework
Various interests
Uncertainties
Life cycle
Multicriteria
Probabilistic
LCA
+
+Energy-efficient
Sustainable
Safe
Economical
...
Holistic design
A B C ... ?Alternatives
Comparison
Overall value of A
Overall value of B
Overall value of C
Decision A B C ...
“Best”
Various levels ofhazard and
environmental demands
PBE Approach
Systemperformances
Probabilisticevaluation
Realistic and reliable
analysis/design
CVpCVEMpEMSDVPSDVP ||
Climate Variable (CV) Energy Measure (EM) Sustainability Decision Variable (SDV)
PBE for Sustainability
value 1, weight 1
value 2, weight 2
value 3, weight 3
...
Ind1
Ind2
Ind3
Probabilistic Performance-based Earthquake Engineering, Tongji University, Shanghai, China, Dec. 17-18, 2015

93Probabilistic Performance-based Earthquake Engineering, Tongji University, Shanghai, China, Dec. 17-18, 2015
Questions?
http://www.ce.berkeley.edu/people/faculty/mosalam