probabilistic assessment of earthquake insurance rates for turkey
TRANSCRIPT

Probabilistic Assessment of Earthquake
Insurance Rates for Turkey
M. S. YUCEMENDepartment of Civil Engineering and Earthquake Engineering Research Center, Middle EastTechnical University, 06531 Ankara, Turkey; E-mail: [email protected]
(Received 7 May 2004; accepted 3 November 2004)
Abstract. A probabilistic model is presented to obtain a realistic estimate of earthquake
insurance rates for reinforced concrete buildings in Turkey. The model integrates informationon seismic hazard and information on expected earthquake damage on engineering facilities ina systematic way, yielding to estimates of earthquake insurance premiums. In order to dem-
onstrate the application of the proposed probabilistic method, earthquake insurance rates arecomputed for reinforced concrete buildings constructed in five cities located in differentseismic zones of Turkey. The resulting rates are compared with the rates currently charged by
the insurance companies. The earthquake insurance rates are observed to be sensitive to theassumptions on seismic hazard and damage probability matrices and to increase significantlywith increasing violation of the code requirements.
Key words: seismic hazard, earthquake engineering, earthquake insurance, building damage,
damage probability matrix, risk premium, insurance premium
1. Introduction
Turkey is located in one of the seismically most active regions of the world.Geological and seismological data indicate that in almost all parts ofTurkey seismic hazard is significant: 95% of the population, 92% of thetotal area and 98% of the industry are under earthquake threat (Gencogluet al., 1996). To reduce the vulnerability of human settlements and indus-trial facilities, the engineered structures must be designed and constructedto resist the effects of earthquakes. However, due to poor control of con-struction in Turkey, a large degree of damage is expected if a majorearthquake hits a large city, as observed during the recent earthquakes.Accordingly, different measures have to be considered to alleviate the post-disaster consequences of earthquakes as well as enforcement of the earth-quake resistant provisions of the Code. The implementation of obligatoryearthquake insurance is among such measures.
In Turkey, the State used to have a legal obligation to fund the costs ofreconstructing buildings after an earthquake. This responsibility of the Statenaturally brought an unplanned burden on the national economy and on the
Natural Hazards (2005) 35: 291–313 � Springer 2005DOI 10.1007/s11069-004-6485-8
already limited central budget in the case of catastrophic seismic events. Thetwo recent major earthquakes in Turkey on 17 August and 12 November1999 both occurred in or near urban settlements and caused widespreaddestruction of the building stock. This activated the idea of a nationwideobligatory earthquake insurance enforcement, which was first put forward in1978 by the Ministry of Reconstruction and Settlement. At that time theEarthquake Engineering Research Institute, Middle East Technical Univer-sity (EERI/METU), through a project sponsored by the same Ministry,investigated the feasibility of an obligatory insurance model (Gurpinar et al.,1978; Gurpinar and Yucemen, 1980). The obligatory insurance model con-sidered by EERI/METU aimed to serve for a number of purposes, whichmay be listed as: control and therefore improvement of construction practicesin seismic regions, decrease of time loss due to the interruption of services,accumulation of funds for reconstruction and resettlement. The fact that thefirst purpose was included is due to the peculiar control mechanism inTurkey, which may to some extent be generalized to other developingcountries. As control of construction is implemented unsatisfactorily, it isexpected that the earthquake insurance may constitute a complementarycontrol mechanism, based on the conflict of economic interests on the part ofthe insurer and the insured.
After the two major earthquakes in 1999, the Government of Turkey hasdecided to enforce the earthquake insurance on the nationwide basis with thesole purpose of privatizing the potential risk by offering insurance via theTurkish Catastrophic Insurance Pool (TCIP) and then exporting the majorpart of this risk to the international reinsurance and capital markets(Bommer et al., 2002). Although the main aim was to reduce government’sfiscal exposure, it was also intended to encourage risk mitigation and saferconstruction practices. To achieve these purposes all registered residentialdwellings, the total number being about 13 million, are required to be in thecompulsory earthquake insurance coverage. Initially funded by the WorldBank, the TCIP program became effective as of March 2001. In spite of itscompulsory nature, TCIP policy count was about two million as of Sep-tember 2004, corresponding only to 15.3% of the total property owners. Thehighest insured percentage was observed in the Marmara region (24.80%),where the two major earthquakes in 1999 caused the highest damage(www.dask.gov.tr). Milli-Re (Turkish Reinsurance Company) is responsiblefor running the pool, which is protected by the World Bank and a whole hostof reinsurers. TCIP has a potential to become one of the largest earthquakeinsurance companies in the world, provided that the penetration rate is in-creased significantly.
In the implementation of the obligatory insurance program, no reliableinvestigations were conducted for the assessment of earthquake insurancerates. As a matter of fact the rates are set by the Prime Ministry of the
M. S. YUCEMEN292

Turkish Republic, the Under-secretariat of Treasury and charged by theinsurance companies under the control and coordination of TCIP. Thus, thisstudy aims at presenting a simple model for the assessment of earthquakeinsurance rates by considering the damage statistics and the potential seismichazard. The proposed model is used for the assessment of the earthquakeinsurance premiums for reinforced concrete buildings constructed in differentseismic zones of Turkey. The earthquake insurance premiums are computedby considering only the risk of damage due to earthquake shock and lossesresulting from fire due to earthquake are omitted.
In most of the countries, earthquake insurance programs are implementedwith the purpose of accumulating funds to cover the post-disaster expendi-tures. The practice and regulations of earthquake insurance vary fromcountry to country. Below, a brief description for some countries, where theseismic hazard is significant is presented.
In Japan, earthquake insurance has been available since the 1950’s(Kamei, 1976). Earthquake insurance covers damage from volcano eruptionsand tsunamis also. The buildings are classified according to their earthquakeresistance capacities and in this way constructions with poor quality anddesign are discouraged. The earthquake insurance for homes is an endorse-ment to fire coverage, and reinsurance is provided by the government(Brillinger, 1993, p. 16; Scawthorn et al., 2003, chapter 32, pp. 24–25).
In California, a state-run earthquake insurance company, called theCalifornia Earthquake Authority (CEA), was formed in 1994 for providingcoverage for homeowners. The all-residential CEA program was formed inorder to overcome some of the difficulties encountered by the insurancecompanies after the 1994 Northridge earthquake (Scawthorn et al., 2003,chapter 32, pp. 23–24).
In New Zealand, the earthquake insurance is a part of fire insurance. TheEarthquake Commission (EQC), which was formed in 1993, handles theearthquake insurance nationwide. For homes there is a limit of 100,000 NZdollars of coverage at a cost of 0.5 per 1,000 (Scawthorn et al., 2003, chapter32, p. 26). The New Zealand reinsurance program is one of the largestcatastrophe coverages in the world (Steven, 1992).
Studies on the assessment of earthquake insurance premiums based onstatistical methods and utilizing earthquake engineering concepts are limitedin number. Gurpinar et al. (1978) and Gurpinar and Yucemen (1980) haveconsidered the problems related to obligatory earthquake insurance imple-mentation in Turkey and a pilot application was carried out for Denizli.Yucemen and Bulak (1997) have developed a statistical model for theassessment of earthquake insurance rates for the different seismic zones inTurkey. Smolka and Berz (1989, 1991) have developed a methodology forobtaining insurance premiums consistent with seismic risk and estimation ofpotential losses due to large earthquakes. Some of the other major studies
ASSESSMENT OF EARTHQUAKE INSURANCE RATES 293
conducted in the field of earthquake insurance are due to Straub (1973), VereJones (1973), Lockett (1980), Brillinger (1993), Kunreuther (1996), Walker(2000), Amendola et al. (2000) and Scawthorn et al. (2003).
2. Probabilistic Model for the Estimation of Earthquake Insurance Premiums
The assessment of earthquake insurance premiums requires two types ofstudies, namely: seismic hazard analysis (SHA) and estimation of potentialearthquake damage to structures. In the following the models used for thesetwo types of studies are presented.
2.1. SEISMIC HAZARD ANALYSIS (SHA)
In the probabilistic sense the seismic hazard can be defined as the probabilityof exceeding different levels of ground motion at a given place and within agiven period of time due to expected seismic activity in the region.
Many models have been developed for seismic hazard analysis. Most ofthe earlier models of seismic hazard assessment were based on the assump-tion that earthquake occurrences are independent events in space and time,and utilized the Poisson model which is also known as the classical SHAmodel (Cornell, 1968) or the extreme value statistics. Later studies consideredthe temporal or spatial dependence of earthquakes only. Some models con-sistent with the ‘‘elastic rebound theory’’ considered the temporal dependenceof earthquakes based on the processes with Markovian characteristics.Attempts were also made to model the spatial dependence of earthquakes. Inrecent studies, the occurrence of earthquakes is treated as a space-timeprocess and the spatial and temporal correlations are taken into consider-ation (Yucemen, 1993; Akkaya and Yucemen, 2002). A detailed review andcomparison of different stochastic models of earthquake occurrence is givenin Yucemen and Akkaya (1996) and Akkaya and Yucemen (2002).
The probabilistic formulation adopted in this study is based on the clas-sical SHA model. However, the classical model is improved by taking intoaccount the uncertainties associated with the attenuation equation, geo-graphical location of seismic sources and estimation of seismicity parameters.The SHA model used here involves the following stages:
(i) Determination of the probability distribution of earthquake magni-tudes: The probability distribution of earthquake magnitudes is obtainedfrom the linear magnitude-frequency relationship (Gutenberg and Richter,1956) having a lower bound m0 and an upper bound m1 for earthquakemagnitudes. The resulting exponential probability density function is asfollows (Yucemen, 1992):
M. S. YUCEMEN294

fMðmÞ ¼ kb expð�bðm�m0ÞÞ ð1ÞHere, k is the standardization coefficient which is needed to normalize thedistribution function to unity at m ¼ m1 and obtained from the followingformula:
k ¼ ½1� expð�bðm1 �m0ÞÞ��1 ð2ÞThe parameter b, which is the slope of the magnitude-frequency relationship,is an indicator of the severity of seismic activity and is related to the tectonicstructure of the region.
(ii) Determination of the probability distribution of earthquake occur-rences: Earthquake occurrences are assumed to be independent events inthe time domain and can be modeled as a Poisson process. Poisson modelis preferred in this study since it is found to be in agreement with theobserved seismic activity related to moderate or large magnitude earth-quakes which affect engineering structures seriously (Cornell andWinterstein, 1998; Ferraes, 2003). According to the Poisson model, theprobability of n earthquakes having intensity m P m0 occurring during[0, t] is:
PðN ¼ nÞ ¼ ½expð�mtÞðmtÞn�=n! ð3Þwhere, N ¼ number of earthquakes (m P m0) occurring in the time interval[0, t] and m ¼ mean number of earthquakes having intensity mPm0 per unittime (generally taken as 1 year).
(iii) Determination of an attenuation relationship: Attenuation relation-ships describe the decay of the ‘‘severity’’ of an earthquake of magnitude mwith epicentral (or hypocentral) distance r. Due to the scarcity of localstrong-motion data in Turkey, it was necessary to select an attenuationequation from a spectrum of such equations that appear in the literature. Inthis study the following widely used attenuation relationship given by Joynerand Boore (1981) is adopted.
Log PGA ¼ �1:02þ 0:249m� logr� 0:00255r
þ 0:26p for 5:0 � m � 7:7ð4Þ
Here, r ¼ (d2 + 7.32)½ and p ¼ 0 or 1, respectively, for 50 and 84% prob-ability that the prediction will not exceed the real value. PGA denotes peakground acceleration in terms of g and d is the closest distance in km to thesurface projection of the fault rupture. The coefficient of p in the aboveequation represents the standard error of prediction, denoted by racc. Forthis attenuation equation racc ¼ 0.26.
(iv) Determination of the error in the location of seismic sources: in thisstudy, the location of seismic sources is taken to be random and the location
ASSESSMENT OF EARTHQUAKE INSURANCE RATES 295
of seismic source boundaries are assumed to exhibit a Gaussian distributionwith mean zero and standard deviation, denoted by rloc. This standarddeviation quantifies the expected error in the location of seismic sources. Thedetails of this model are given in Yucemen and Gulkan (1994).
It is to be noted that the main source of uncertainty in SHA is theattenuation equation. Other sources of uncertainties are related to the seis-micity parameters of the region (b, m1, m) and the geographical location ofseismic zones.
2.2. ESTIMATION OF POTENTIAL DAMAGE TO STRUCTURES
The other component of the probabilistic model involves the assessment ofthe seismic vulnerability of buildings. Damage is commonly described by aloss ratio that varies with the strength of shaking and type of structure(Whitman, 1973; Blong, 2003a; Askan and Yucemen, 2003). Due to theuncertainties involved, the damage that may occur during future earth-quakes has to be treated in a probabilistic manner. For this purposedamage probability matrices (DPM) are constructed from observationaland estimated data. A DPM expresses what will happen to buildings, de-signed according to some particular set of requirements, during earth-quakes of various intensities (Whitman, 1973, ATC-13, 1985). An elementof this matrix Pk (DS, I) gives the probability that a particular damagestate (DS) occurs when the structure of kth-type is subjected to an earth-quake of intensity, I. The identification of damage states is achieved in twosteps:
(i) The qualitative description of the degree of structural and non-struc-tural damage by words: In the damage evaluation forms used by the GeneralDirectorate of Disaster Works prior to 1994, five levels of damage states werespecified. These are: No damage (N), light damage (L), moderate damage(M), heavy damage (H), and collapse (C) states. This categorization ofdamage states is also used in this study.
(ii) The quantification of the damage described by words in terms of thedamage ratio (DR), which is defined as the ratio of the cost of repairing theearthquake damage to the replacement cost of the building. For mathe-matical simplicity it is convenient to use a single DR for each DS (Blong,2003b, p. 3; Gurpinar and Yucemen, 1980). This single DR is called thecentral damage ratio (CDR). Based on interviews with experts in charge ofdamage evaluation and based on similar studies, the damage ratios corre-sponding to the five damage states are estimated by Gurpinar et al. (1978)and are shown in Table I. In the present study only DPMs for conventionalreinforced concrete frame buildings are considered, and the correspondingmatrices are constructed from observational and estimated data available forTurkey.
M. S. YUCEMEN296
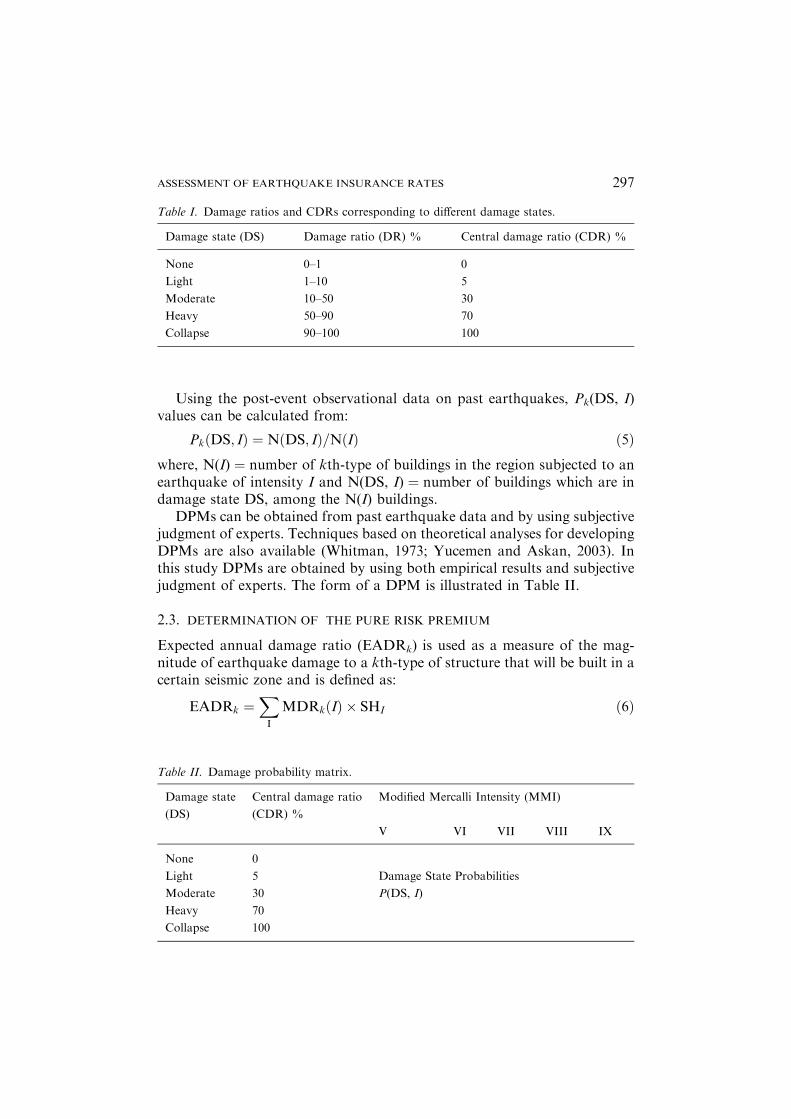
Using the post-event observational data on past earthquakes, Pk(DS, I)values can be calculated from:
PkðDS; IÞ ¼ NðDS; IÞ=NðIÞ ð5Þwhere, N(I) ¼ number of kth-type of buildings in the region subjected to anearthquake of intensity I and N(DS, I) ¼ number of buildings which are indamage state DS, among the N(I) buildings.
DPMs can be obtained from past earthquake data and by using subjectivejudgment of experts. Techniques based on theoretical analyses for developingDPMs are also available (Whitman, 1973; Yucemen and Askan, 2003). Inthis study DPMs are obtained by using both empirical results and subjectivejudgment of experts. The form of a DPM is illustrated in Table II.
2.3. DETERMINATION OF THE PURE RISK PREMIUM
Expected annual damage ratio (EADRk) is used as a measure of the mag-nitude of earthquake damage to a kth-type of structure that will be built in acertain seismic zone and is defined as:
EADRk ¼X
I
MDRkðIÞ � SHI ð6Þ
Table I. Damage ratios and CDRs corresponding to different damage states.
Damage state (DS) Damage ratio (DR) % Central damage ratio (CDR) %
None 0–1 0
Light 1–10 5
Moderate 10–50 30
Heavy 50–90 70
Collapse 90–100 100
Table II. Damage probability matrix.
Damage state
(DS)
Central damage ratio
(CDR) %
Modified Mercalli Intensity (MMI)
V VI VII VIII IX
None 0
Light 5 Damage State Probabilities
Moderate 30 P(DS, I)
Heavy 70
Collapse 100
ASSESSMENT OF EARTHQUAKE INSURANCE RATES 297

where, MDRk(I) ¼ average damage ratio for the kth-type of structuressubjected to an earthquake of intensity I and SHI ¼ annual probability of anearthquake of intensity I occurring at the site.
The information contained in the damage probability matrix and in thedamage ratios can be combined by defining the MDRk(I) as follows:
MDRkðIÞ ¼X
DS
PkðDS; IÞ � CDRDS ð7Þ
where, CDRDS ¼ central damage ratio corresponding to the damage stateDS.
After calculating EADRk, the pure risk premium (PRPk) is computedbased on the insured value of the building (INSV) under consideration fromthe following relationship:
PRPk ¼ EADRk � INSV ð8Þ
2.4. DETERMINATION OF THE TOTAL EARTHQUAKE INSURANCE PREMIUM
The total earthquake insurance premium (TPk) that will be charged by aninsurance company for the kth-type of structure is found by increasing thePRPk by some margin as follows:
TPk ¼ ðPRPkÞ=ð1� LFÞ ð9Þwhere, LF ¼ load factor which covers the hidden uncertainties, administra-tion, business and taxation expenses and a reasonable profit allowance forthe insurance firm. Here, LF is set equal to 0.4 (Gurpinar and Yucemen,1980) and with this value of LF, the total insurance premium that will becharged by the insurance companies becomes:
TPk ¼ 1:67� PRPk ð10ÞA flowchart showing the algorithm for the computation of earthquake
insurance premiums is given in Figure 1.
3. Application: Assessment of Earthquake Insurance Rates for Different
Seismic Zones in Turkey
The implementation of the proposed probabilistic method is illustrated bycomputing the earthquake insurance rates for reinforced concrete buildingslocated in different seismic zones of Turkey. Cities are selected from thedifferent zones according to the new seismic zonation map of Turkey(Gencoglu et al., 1996). These cities and the corresponding seismic zones,(shown in parentheses) are as follows: Erzincan (Zone I), Denizli (Zone I),Istanbul/south (Zone I), Istanbul/north (Zone II), Ankara (Zone III) andKonya (Zone IV). In computing the earthquake insurance rates, complianceand non-compliance with the Code (1975) is also considered.
M. S. YUCEMEN298

3.1. SEISMIC HAZARD ANALYSIS
In order to use the proposed model it is first necessary to carry out a SHA forthese cities. For this purpose the comprehensive study carried out by Gulkanet al. (1993) for the assessment of seismic hazard in Turkey is utilized. Thelocations of the seismic sources are shown in Figure 2. These seismic sourcesare all modeled as area sources. The past seismic activity data withmagnitude ‡4.5 are distributed to these sources according to their epicenterallocations and closeness to the sources. Earthquakes whose epicenters cannot
EARTHQUAKE INTENSITIES, I
EXPECTED ANNUAL DAMAGE RATIO
EADR k=∑ MDR k (I) x SH (I)I
SEISMIC HAZARD, SH (I)
PURE RISK PREMIUM PRP k = EADRk x INSV
MEAN DAMAGE RATIOS
MDR k (I) = ∑ Pk(DS, I) x CDR (DS)DS
DAMAGE PROBABILITY MATRIX[ P k (DS, I) ] L
AR
TN
EC
EG
AM
AD
IT
AR
OS
,R
DC
(S
D)
TOTAL INSURANCE PREMIUM
TPk =PRP k
1-LF
MA
DS
ET
AT
SE
GA
(S
D)
Figure 1. Algorithm for the computation of earthquake insurance premiums.
ASSESSMENT OF EARTHQUAKE INSURANCE RATES 299
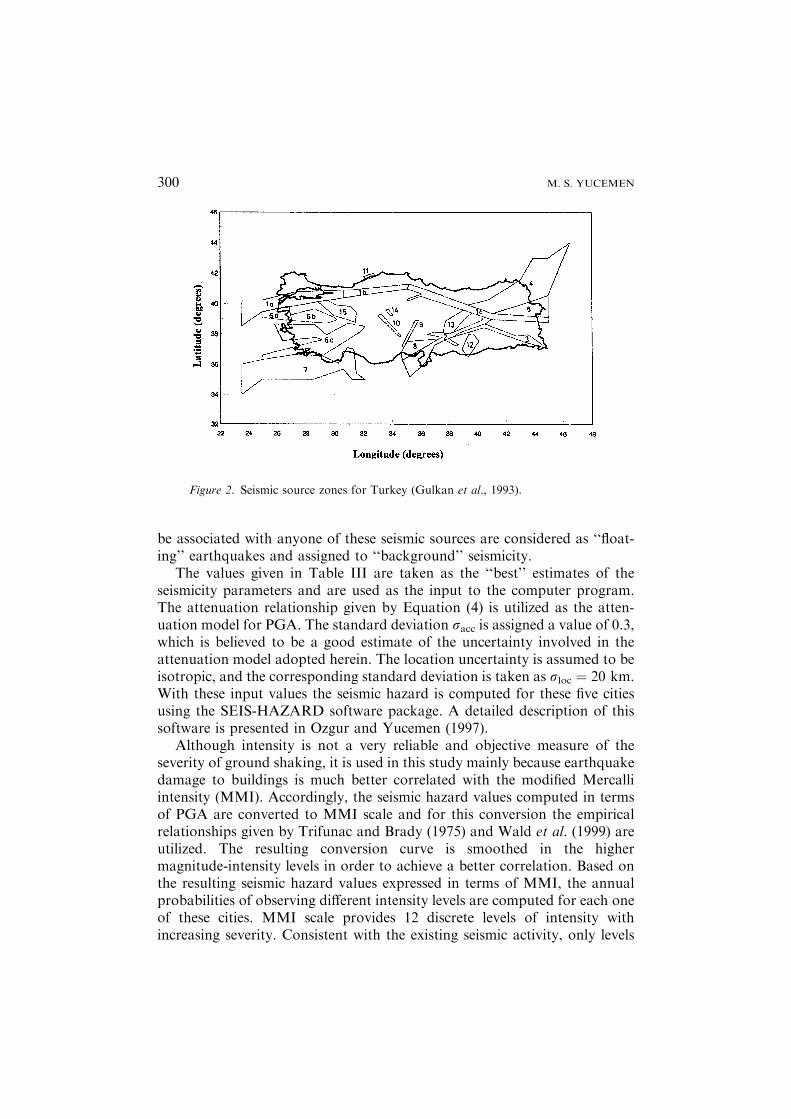
be associated with anyone of these seismic sources are considered as ‘‘float-ing’’ earthquakes and assigned to ‘‘background’’ seismicity.
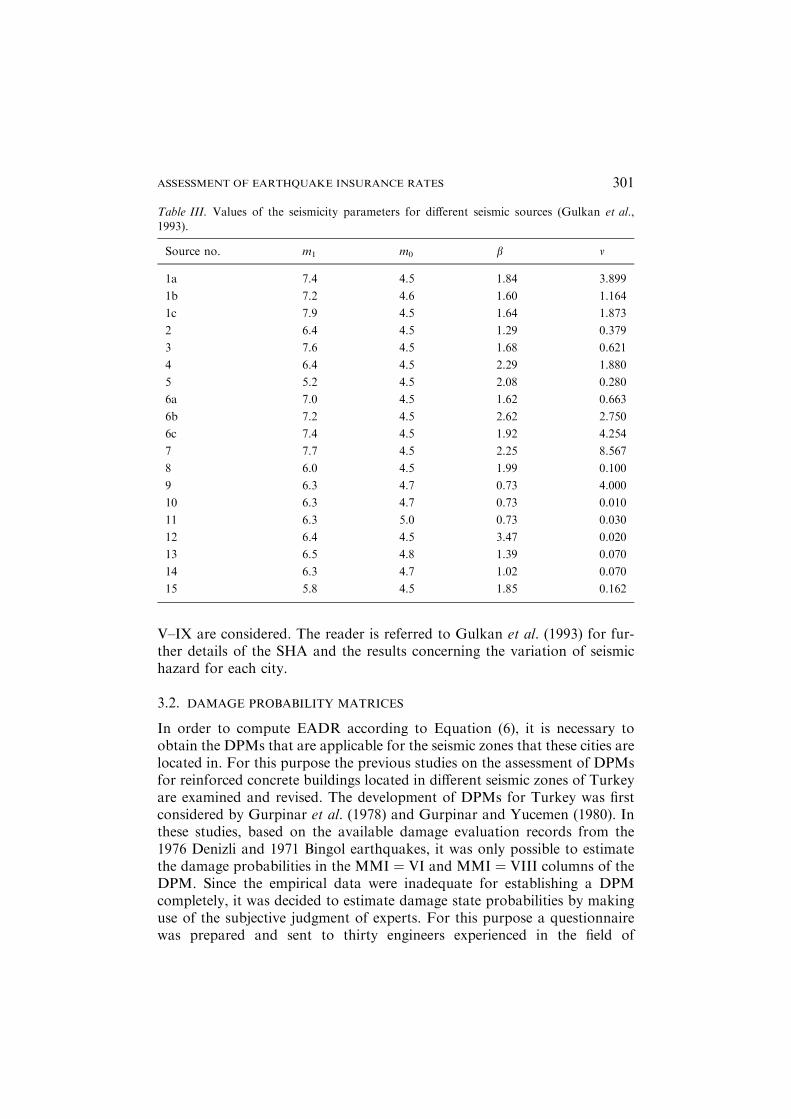
The values given in Table III are taken as the ‘‘best’’ estimates of theseismicity parameters and are used as the input to the computer program.The attenuation relationship given by Equation (4) is utilized as the atten-uation model for PGA. The standard deviation racc is assigned a value of 0.3,which is believed to be a good estimate of the uncertainty involved in theattenuation model adopted herein. The location uncertainty is assumed to beisotropic, and the corresponding standard deviation is taken as rloc ¼ 20 km.With these input values the seismic hazard is computed for these five citiesusing the SEIS-HAZARD software package. A detailed description of thissoftware is presented in Ozgur and Yucemen (1997).
Although intensity is not a very reliable and objective measure of theseverity of ground shaking, it is used in this study mainly because earthquakedamage to buildings is much better correlated with the modified Mercalliintensity (MMI). Accordingly, the seismic hazard values computed in termsof PGA are converted to MMI scale and for this conversion the empiricalrelationships given by Trifunac and Brady (1975) and Wald et al. (1999) areutilized. The resulting conversion curve is smoothed in the highermagnitude-intensity levels in order to achieve a better correlation. Based onthe resulting seismic hazard values expressed in terms of MMI, the annualprobabilities of observing different intensity levels are computed for each oneof these cities. MMI scale provides 12 discrete levels of intensity withincreasing severity. Consistent with the existing seismic activity, only levels
Figure 2. Seismic source zones for Turkey (Gulkan et al., 1993).
M. S. YUCEMEN300
V–IX are considered. The reader is referred to Gulkan et al. (1993) for fur-ther details of the SHA and the results concerning the variation of seismichazard for each city.
3.2. DAMAGE PROBABILITY MATRICES
In order to compute EADR according to Equation (6), it is necessary toobtain the DPMs that are applicable for the seismic zones that these cities arelocated in. For this purpose the previous studies on the assessment of DPMsfor reinforced concrete buildings located in different seismic zones of Turkeyare examined and revised. The development of DPMs for Turkey was firstconsidered by Gurpinar et al. (1978) and Gurpinar and Yucemen (1980). Inthese studies, based on the available damage evaluation records from the1976 Denizli and 1971 Bingol earthquakes, it was only possible to estimatethe damage probabilities in the MMI ¼ VI and MMI ¼ VIII columns of theDPM. Since the empirical data were inadequate for establishing a DPMcompletely, it was decided to estimate damage state probabilities by makinguse of the subjective judgment of experts. For this purpose a questionnairewas prepared and sent to thirty engineers experienced in the field of
Table III. Values of the seismicity parameters for different seismic sources (Gulkan et al.,1993).
Source no. m1 m0 b m
1a 7.4 4.5 1.84 3.899
1b 7.2 4.6 1.60 1.164
1c 7.9 4.5 1.64 1.873
2 6.4 4.5 1.29 0.379
3 7.6 4.5 1.68 0.621
4 6.4 4.5 2.29 1.880
5 5.2 4.5 2.08 0.280
6a 7.0 4.5 1.62 0.663
6b 7.2 4.5 2.62 2.750
6c 7.4 4.5 1.92 4.254
7 7.7 4.5 2.25 8.567
8 6.0 4.5 1.99 0.100
9 6.3 4.7 0.73 4.000
10 6.3 4.7 0.73 0.010
11 6.3 5.0 0.73 0.030
12 6.4 4.5 3.47 0.020
13 6.5 4.8 1.39 0.070
14 6.3 4.7 1.02 0.070
15 5.8 4.5 1.85 0.162
ASSESSMENT OF EARTHQUAKE INSURANCE RATES 301
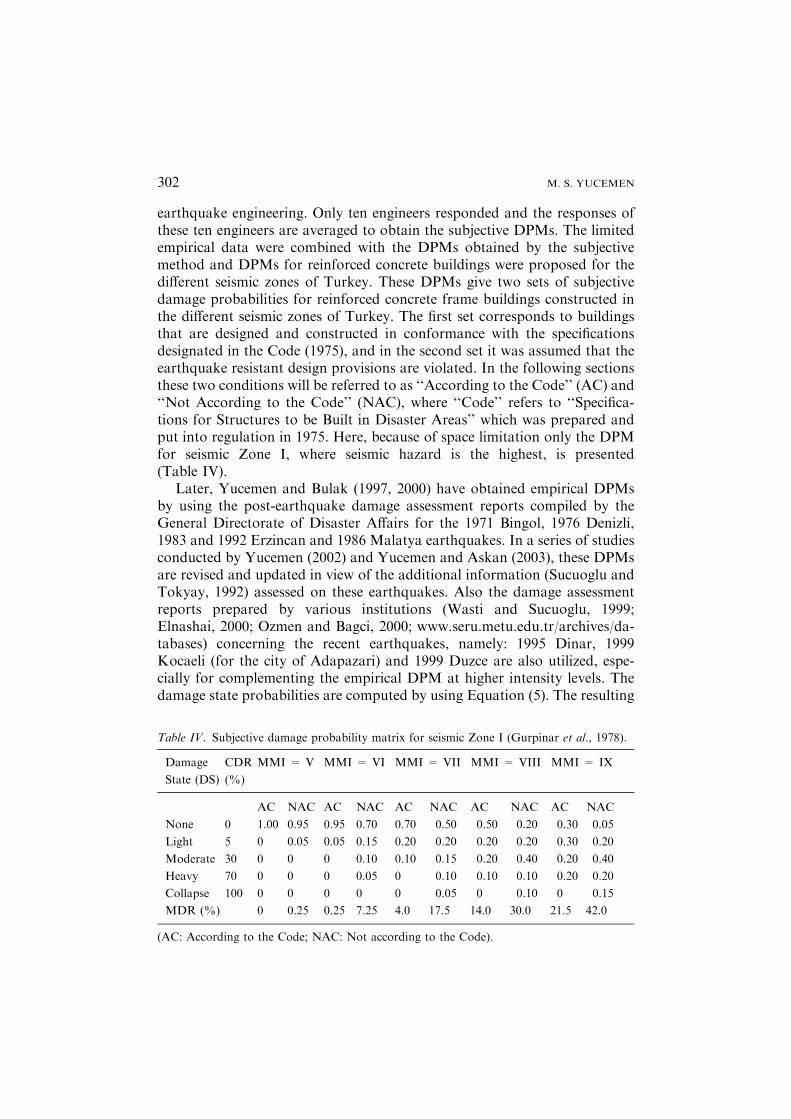
earthquake engineering. Only ten engineers responded and the responses ofthese ten engineers are averaged to obtain the subjective DPMs. The limitedempirical data were combined with the DPMs obtained by the subjectivemethod and DPMs for reinforced concrete buildings were proposed for thedifferent seismic zones of Turkey. These DPMs give two sets of subjectivedamage probabilities for reinforced concrete frame buildings constructed inthe different seismic zones of Turkey. The first set corresponds to buildingsthat are designed and constructed in conformance with the specificationsdesignated in the Code (1975), and in the second set it was assumed that theearthquake resistant design provisions are violated. In the following sectionsthese two conditions will be referred to as ‘‘According to the Code’’ (AC) and‘‘Not According to the Code’’ (NAC), where ‘‘Code’’ refers to ‘‘Specifica-tions for Structures to be Built in Disaster Areas’’ which was prepared andput into regulation in 1975. Here, because of space limitation only the DPMfor seismic Zone I, where seismic hazard is the highest, is presented(Table IV).
Later, Yucemen and Bulak (1997, 2000) have obtained empirical DPMsby using the post-earthquake damage assessment reports compiled by theGeneral Directorate of Disaster Affairs for the 1971 Bingol, 1976 Denizli,1983 and 1992 Erzincan and 1986 Malatya earthquakes. In a series of studiesconducted by Yucemen (2002) and Yucemen and Askan (2003), these DPMsare revised and updated in view of the additional information (Sucuoglu andTokyay, 1992) assessed on these earthquakes. Also the damage assessmentreports prepared by various institutions (Wasti and Sucuoglu, 1999;Elnashai, 2000; Ozmen and Bagci, 2000; www.seru.metu.edu.tr/archives/da-tabases) concerning the recent earthquakes, namely: 1995 Dinar, 1999Kocaeli (for the city of Adapazari) and 1999 Duzce are also utilized, espe-cially for complementing the empirical DPM at higher intensity levels. Thedamage state probabilities are computed by using Equation (5). The resulting
Table IV. Subjective damage probability matrix for seismic Zone I (Gurpinar et al., 1978).
Damage
State (DS)
CDR
(%)
MMI = V MMI = VI MMI = VII MMI = VIII MMI = IX
AC NAC AC NAC AC NAC AC NAC AC NAC
None 0 1.00 0.95 0.95 0.70 0.70 0.50 0.50 0.20 0.30 0.05
Light 5 0 0.05 0.05 0.15 0.20 0.20 0.20 0.20 0.30 0.20
Moderate 30 0 0 0 0.10 0.10 0.15 0.20 0.40 0.20 0.40
Heavy 70 0 0 0 0.05 0 0.10 0.10 0.10 0.20 0.20
Collapse 100 0 0 0 0 0 0.05 0 0.10 0 0.15
MDR (%) 0 0.25 0.25 7.25 4.0 17.5 14.0 30.0 21.5 42.0
(AC: According to the Code; NAC: Not according to the Code).
M. S. YUCEMEN302
empirical DPM is shown in Table V. In the sixth row of this table the numberof buildings for which damage assessments were made is given.
The information on the date of construction of buildings was generallymissing in the damage assessment reports compiled by the General Direc-torate of Disaster Affairs. Accordingly, it was not possible to classify thebuildings as constructed before or after the 1975 Code, except for the 1976Denizli and 1971 Bingol earthquakes. The building stock considered in thesetwo earthquakes is assumed to be constructed not in accordance with therequirements of the Code (1975), since they were constructed before the 1975Code became effective. For the buildings involved in the other three earth-quakes, i.e. 1983, 1992 Erzincan and 1986 Malatya, it was difficult to decide.However, the general opinion of experts in charge of damage evaluation wasthat: most of the buildings did not comply with the requirements of the 1975Code. A similar situation was valid for the 1999 Kocaeli and 1999 Duzceearthquake reports. However, for the 1995 Dinar earthquake, where only 39buildings were examined, it was possible to decide for each building thedegree of compliance with the Code. Accordingly, the empirical values givenin Table V are assumed to be valid for reinforced concrete structures that areconstructed not in accordance with the Code, except for the case of Dinar,where AC and NAC conditions are differentiated (Yucemen, 2002; Yucemenand Askan, 2003).
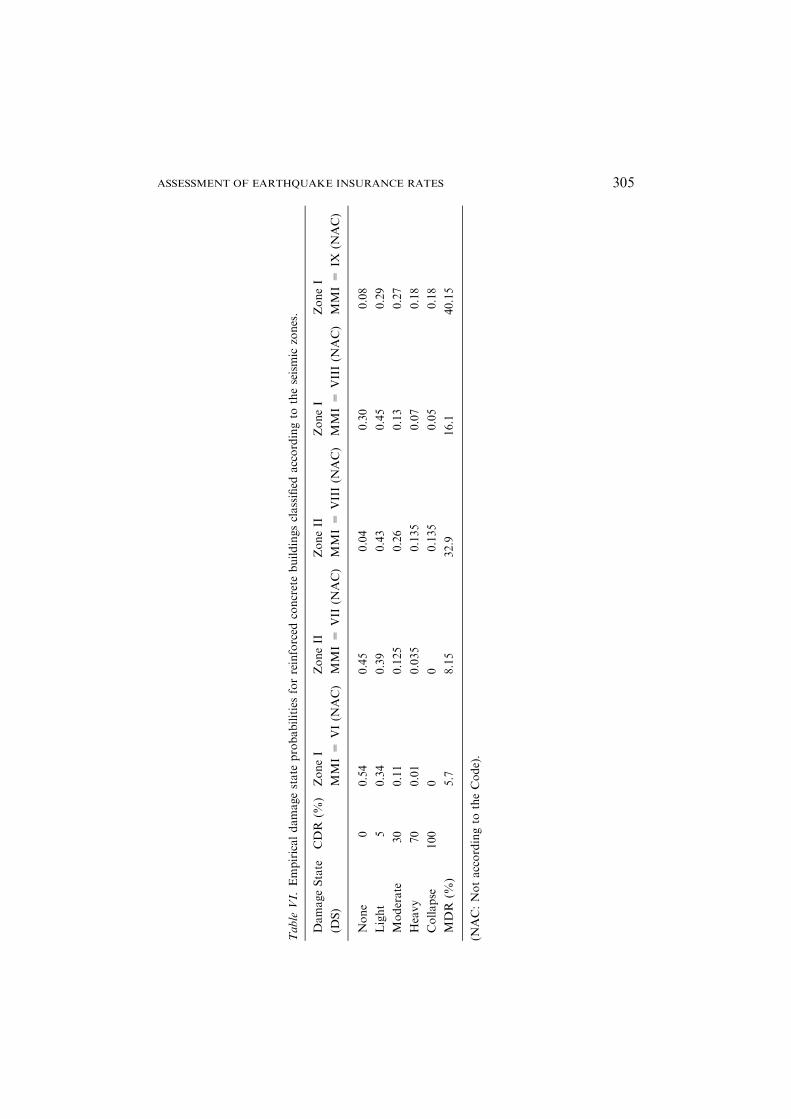
The values given in Table V are used to obtain the empirical damage stateprobabilities valid for different seismic zones by relating the cities with theseismic zones. Table VI gives the damage state statistics for Zone I withMMI ¼ VI, VIII and IX and for Zone II with MMI ¼ VII and VIII. Forcases where more than one earthquake damage data are available for thesame zone, weighted average damage state probabilities, based on thenumber of buildings, are computed. The empirical damage state probabilitiesgiven in this table correspond to the NAC case, as explained above.
3.3. BEST ESTIMATE DAMAGE PROBABILITY MATRICES
The DPMs will show differences from zone to zone. Therefore for each zonea DPM is needed. Besides, whether a building has been constructedaccording to the requirements of the code or not should be taken into con-sideration. In selecting these DPMs it is desirable to utilize all of the relevantinformation in a systematic way. In this respect, we note the following pointsconcerning the information presented in the previous section.
(i) It seems that the most reliable method for constructing DPMs is theempirical method, which is based on the observed damage statistics, providedthat personal biases in damage evaluation are controlled. However, due tolack of data it was only possible to quantify the empirical damage stateprobabilities for Zones I and II as given in Table VI.
ASSESSMENT OF EARTHQUAKE INSURANCE RATES 303

Table
V.Empiricaldamagestate
probabilitiesforreinforced
concretebuildings.
Damage
State
(DS)
CDR
(%)19.8.1976Denizli
MMI=
VI
18.11.1983
Erzincan
MMI=
VI
6.6.1986
Malatya
MMI=
VII
22.05.1971
Bingol
MMI=
VIII
13.3.1992
Erzincan
MMI=
VIII
1.10.1995
Dinar
MMI=
VIII
17.08.1999
Kocaeli
MMI=
IX
12.11.1999
Duzce
MMI=
IX
AC
NAC
None
00.49
0.74
0.45
0.12
0.31
0.23
0.24
0.04
0.17
Light
50.37
0.23
0.39
0.29
0.48
0.31
0.24
0.34
0.16
Moderate
30
0.13
0.03
0.12
0.31
0.09
0.38
0.41
0.27
0.28
Heavy
70
0.01
0.00
0.03
0.18
0.07
0.04
0.05
0.175
0.19
Collapse
100
00
00.10
0.05
0.04
0.06
0.175
0.20
Number
of
Buildings
378
112
89
46
415
39
13240
5420
MDR
(%)
6.45
2.05
7.65
32.9
15
19.75
23
39.6
42.5
(AC:Accordingto
theCode;
NAC:Notaccordingto
theCode).
M. S. YUCEMEN304
Table
VI.
Empiricaldamagestate
probabilitiesforreinforced
concretebuildingsclassified
accordingto
theseismic
zones.
DamageState
(DS)
CDR
(%)
ZoneI
MMI=
VI(N
AC)
ZoneII
MMI=
VII
(NAC)
ZoneII
MMI=
VIII(N
AC)
ZoneI
MMI=
VIII(N
AC)
ZoneI
MMI=
IX(N
AC)
None
00.54
0.45
0.04
0.30
0.08
Light
50.34
0.39
0.43
0.45
0.29
Moderate
30
0.11
0.125
0.26
0.13
0.27
Heavy
70
0.01
0.035
0.135
0.07
0.18
Collapse
100
00
0.135
0.05
0.18
MDR
(%)
5.7
8.15
32.9
16.1
40.15
(NAC:Notaccordingto
theCode).
ASSESSMENT OF EARTHQUAKE INSURANCE RATES 305
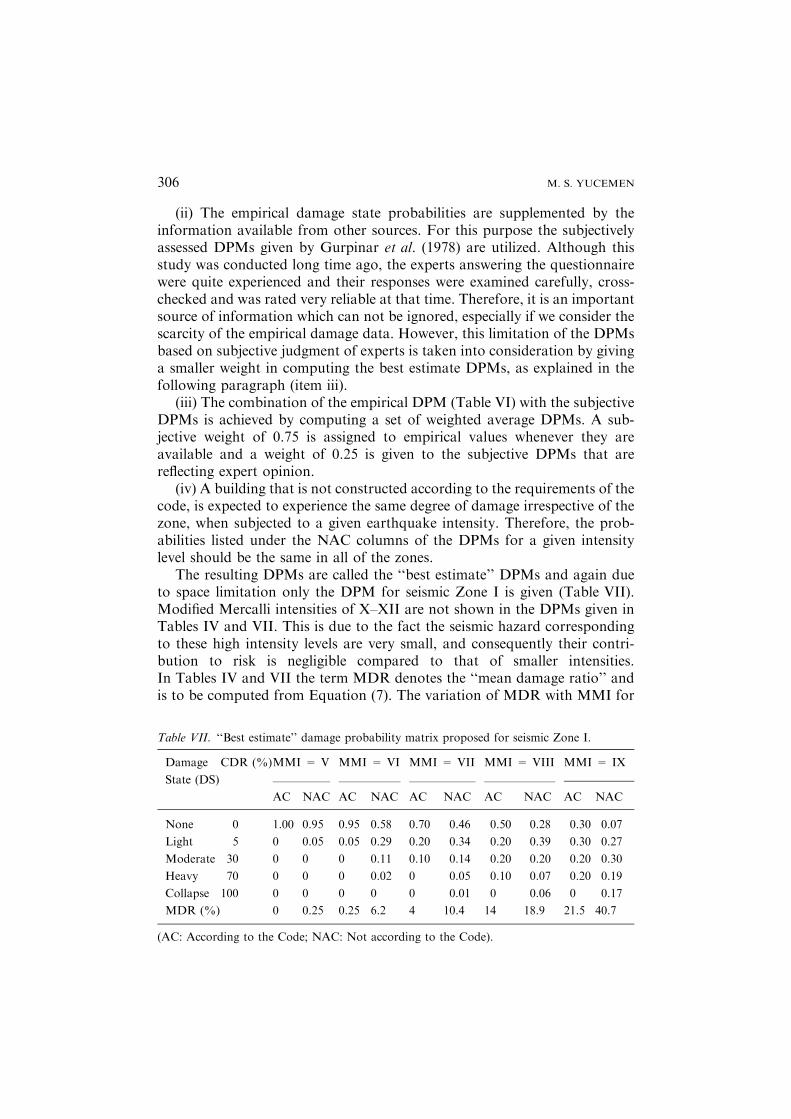
(ii) The empirical damage state probabilities are supplemented by theinformation available from other sources. For this purpose the subjectivelyassessed DPMs given by Gurpinar et al. (1978) are utilized. Although thisstudy was conducted long time ago, the experts answering the questionnairewere quite experienced and their responses were examined carefully, cross-checked and was rated very reliable at that time. Therefore, it is an importantsource of information which can not be ignored, especially if we consider thescarcity of the empirical damage data. However, this limitation of the DPMsbased on subjective judgment of experts is taken into consideration by givinga smaller weight in computing the best estimate DPMs, as explained in thefollowing paragraph (item iii).
(iii) The combination of the empirical DPM (Table VI) with the subjectiveDPMs is achieved by computing a set of weighted average DPMs. A sub-jective weight of 0.75 is assigned to empirical values whenever they areavailable and a weight of 0.25 is given to the subjective DPMs that arereflecting expert opinion.
(iv) A building that is not constructed according to the requirements of thecode, is expected to experience the same degree of damage irrespective of thezone, when subjected to a given earthquake intensity. Therefore, the prob-abilities listed under the NAC columns of the DPMs for a given intensitylevel should be the same in all of the zones.
The resulting DPMs are called the ‘‘best estimate’’ DPMs and again dueto space limitation only the DPM for seismic Zone I is given (Table VII).Modified Mercalli intensities of X–XII are not shown in the DPMs given inTables IV and VII. This is due to the fact the seismic hazard correspondingto these high intensity levels are very small, and consequently their contri-bution to risk is negligible compared to that of smaller intensities.In Tables IV and VII the term MDR denotes the ‘‘mean damage ratio’’ andis to be computed from Equation (7). The variation of MDR with MMI for
Table VII. ‘‘Best estimate’’ damage probability matrix proposed for seismic Zone I.
Damage
State (DS)
CDR (%)MMI = V MMI = VI MMI = VII MMI = VIII MMI = IX
AC NAC AC NAC AC NAC AC NAC AC NAC
None 0 1.00 0.95 0.95 0.58 0.70 0.46 0.50 0.28 0.30 0.07
Light 5 0 0.05 0.05 0.29 0.20 0.34 0.20 0.39 0.30 0.27
Moderate 30 0 0 0 0.11 0.10 0.14 0.20 0.20 0.20 0.30
Heavy 70 0 0 0 0.02 0 0.05 0.10 0.07 0.20 0.19
Collapse 100 0 0 0 0 0 0.01 0 0.06 0 0.17
MDR (%) 0 0.25 0.25 6.2 4 10.4 14 18.9 21.5 40.7
(AC: According to the Code; NAC: Not according to the Code).
M. S. YUCEMEN306

different seismic zones and depending on the degree of conformance with theCode (1975) is shown in Figure 3. As observed in this figure, buildings notconforming with the requirements of the Code (1975) yield to significantlyhigher mean damage ratios, especially at lower intensity levels. As a matter offact, the curve for the NAC case forms an upper bound envelope for theMDRs applicable to the different seismic zones.
3.4. COMPUTATION OF THE EARTHQUAKE INSURANCE RATES
In computing the earthquake insurance rates for the different cities the bestestimate seismicity parameters and the best estimate attenuation equation(with uncertainty measure, racc ¼ 0.3) and the best estimate DPMs are used.Based on the seismic hazard results obtained for these cities, the EADRscorresponding to reinforced concrete buildings that are constructed inaccordance and not in accordance with the requirements of the Code (1975)are computed and given in Table VIII. These EADR’s can be interpreted asthe pure risk premiums (PRP) to be charged for every 1,000 Turkish Lira(TL) of insured property. The corresponding total premium rates which areobtained by multiplying the PRPs by the load factor of 1.67 (Equations (9)and (10)) are also shown in Table VIII. Since the southern part of Istanbulfalls into seismic Zone I and the northern part into Zone II, these regions aretreated separately and for Istanbul two different rates are given. For seismicZone I, where the seismic hazard is highest, three cities, Erzincan, Istanbul/south and Denizli are considered. The earthquake insurance rates computedfor these three cities are quite close to each other; therefore the average rates
0
5
10
15
20
25
30
35
40
45
V VI VII VIII IX
MMI
)%(
RD
M
Zone I (AC)
Zone II (AC)
Zone III(AC)Zone IV(AC)All Zones(NAC)
Figure 3. Variation of mean damage ratio with MMI for different seismic zones and
degree of compliance with the Code (AC: According to the Code; NAC: Not accordingto the Code).
ASSESSMENT OF EARTHQUAKE INSURANCE RATES 307
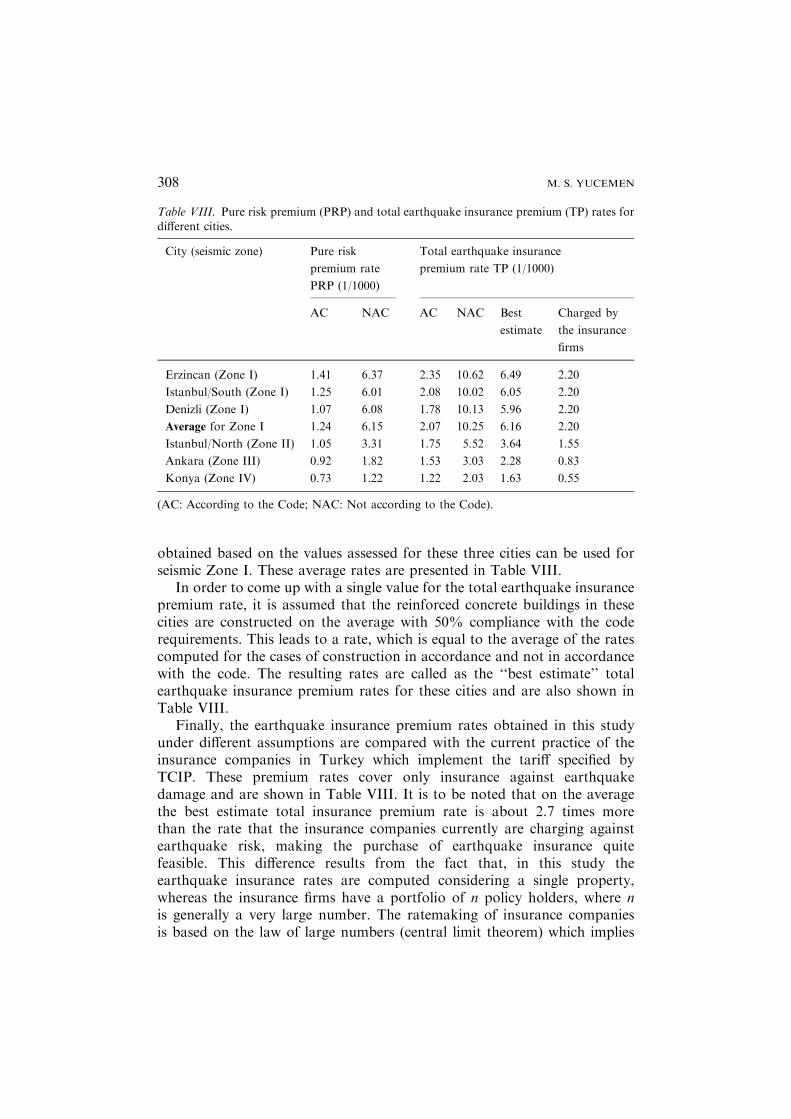
obtained based on the values assessed for these three cities can be used forseismic Zone I. These average rates are presented in Table VIII.
In order to come up with a single value for the total earthquake insurancepremium rate, it is assumed that the reinforced concrete buildings in thesecities are constructed on the average with 50% compliance with the coderequirements. This leads to a rate, which is equal to the average of the ratescomputed for the cases of construction in accordance and not in accordancewith the code. The resulting rates are called as the ‘‘best estimate’’ totalearthquake insurance premium rates for these cities and are also shown inTable VIII.
Finally, the earthquake insurance premium rates obtained in this studyunder different assumptions are compared with the current practice of theinsurance companies in Turkey which implement the tariff specified byTCIP. These premium rates cover only insurance against earthquakedamage and are shown in Table VIII. It is to be noted that on the averagethe best estimate total insurance premium rate is about 2.7 times morethan the rate that the insurance companies currently are charging againstearthquake risk, making the purchase of earthquake insurance quitefeasible. This difference results from the fact that, in this study theearthquake insurance rates are computed considering a single property,whereas the insurance firms have a portfolio of n policy holders, where nis generally a very large number. The ratemaking of insurance companiesis based on the law of large numbers (central limit theorem) which implies
Table VIII. Pure risk premium (PRP) and total earthquake insurance premium (TP) rates fordifferent cities.
City (seismic zone) Pure risk
premium rate
PRP (1/1000)
Total earthquake insurance
premium rate TP (1/1000)
AC NAC AC NAC Best
estimate
Charged by
the insurance
firms
Erzincan (Zone I) 1.41 6.37 2.35 10.62 6.49 2.20
Istanbul/South (Zone I) 1.25 6.01 2.08 10.02 6.05 2.20
Denizli (Zone I) 1.07 6.08 1.78 10.13 5.96 2.20
Average for Zone I 1.24 6.15 2.07 10.25 6.16 2.20
Istanbul/North (Zone II) 1.05 3.31 1.75 5.52 3.64 1.55
Ankara (Zone III) 0.92 1.82 1.53 3.03 2.28 0.83
Konya (Zone IV) 0.73 1.22 1.22 2.03 1.63 0.55
(AC: According to the Code; NAC: Not according to the Code).
M. S. YUCEMEN308
that as n increases the uncertainty on the expected loss becomes less,because the standard deviation of the expected (mean) loss decreases in-versely proportional to the square root of n. Since it is a more predictablerisk and dispersed to a large number of households, it becomes a moremanageable risk from the point of view of the insurance companies. Thisis the main reason for the difference between the rates estimated in thisstudy based on a single household and the rates currently charged by theinsurance companies in Turkey.
Within the context of the probabilistic approach it is also important tocomment on the different types of uncertainties that contribute to theinsurance rates and their variation with the degree of code compliance.The uncertainties can be categorized into two, namely: the aleatory(probabilistic) uncertainty that is inherent in earthquake occurrence anddamage potential, and the epistemic (knowledge-based) uncertainty that isassociated with the degree of code compliance. The aleatory uncertaintycannot be reduced by acquiring additional information (McGuire, 2004),whereas the epistemic uncertainty over the code compliance or violationcould be reduced by implementing a systematic program of buildinginspection and rehabilitation.
4. Conclusions
In this paper, a probabilistic model is presented for the calculation of theearthquake insurance rates and its application is illustrated by computing theearthquake insurance rates for five cities located in different seismic zones ofTurkey. The following main conclusions can be stated based on this study:
1. The computation of earthquake insurance rates requires information onfuture earthquake hazard and expected seismic vulnerability of engi-neering structures.
2. In this study all empirical data are utilized in the preparation ofDPMs. However, since observed data were not sufficient for estab-lishing DPMs for all of the seismic zones completely, other sources ofinformation, including subjective judgment of experts, are utilized. Itis to be emphasized that the determination of the appropriate DPMsis crucial as far as the validity of the resulting insurance rates areconcerned.
3. For seismic Zone I, three cities, namely: Erzincan, Denizli and thesouthern part of Istanbul are considered. No significant difference isobserved among these three cities with respect to the PRP and TP rates.Therefore the average value obtained from these three cities can beapplied for seismic Zone I.
ASSESSMENT OF EARTHQUAKE INSURANCE RATES 309
4. For reinforced concrete buildings constructed according to the Code(1975), the pure and total premium rates decrease gradually, but consis-tently as it is moved from Zone I to Zone IV (Table VIII). Actually TPrates forZones I and II are quite close to each other (2.07& versus 1.75&).Similarly Zones III and IV have almost the same TP rates (1.53& versus1.22&). This trend suggests that for reinforced concrete buildings con-structed according to the requirements of the Code (1975), earthquakeinsurance premiumsmaybe implementedby treatingZones I and II as onegroup and Zones III and IV as another group. The TP rates computed forbuildings satisfying the code requirements in Zones I and II are observedto be slightly below and above, respectively, what has been currentlycharged by the insurance firms. On the other hand, for Zones III and IVthis difference is rather high; 1.85 and 2.22 times more, respectively.
5. For the case where the requirements of the Code (1975) are violated,total premium rates are again observed to decrease consistently as it ismoved from Zone I to Zone IV, but this time the differences are quitesignificant (Table VIII). In this case grouping is not possible. Besides theTP rates are much higher (3.6–4.7 times more) than the rates currentlycharged by the insurance companies.
6. As the final outcome of this study the best estimate total premium ratesare computed for each zone based on the assumption that reinforcedconcrete buildings are constructed on the average with 50% compliancewith the code requirements. The resulting best estimate TP rates areabout 2.7 times more than the rates currently charged for insuranceagainst earthquakes (Table VIII).
7. Much higher (up to five times more) insurance premium rates that resultfrom the violation of the code requirements strongly suggest thatcompliance with the code should be an important factor in deciding onthe earthquake insurance rates. In other words, significantly differentrates should be charged for buildings depending on the degree ofcompliance with the code. It is also believed that enforcement of such acriterion, will not only encourage the implementation of the coderequirements with respect to earthquake resistant design provisions, butit will also create a control mechanism.
8. It is to be emphasized that the earthquake insurance rates presentedherein are based on the SHA carried out and DPMs assessed within thescope of this study. Both of these inputs are obtained based on the datacurrently available and are subject to revision as new data becomeavailable. It is also to be noted that the rates are valid for reinforcedconcrete buildings and 1975 Code is considered, throughout the study.
9. The earthquake insurance rates are observed to be sensitive to theassumptions on SHA and DPMs. Therefore more consideration shouldbe given to the assessment of proper input parameters. Future studies
M. S. YUCEMEN310

should also concentrate on the collection of earthquake damage data,which is essential for obtaining a realistic estimate of the damage stateprobabilities.
Acknowledgements
Thanks are due to Nazan (Yilmaz) Ozturk, research assistant and AykutDeniz, graduate student at the Department of Civil Engineering, Middle EastTechnical University, for carrying out the numerical computations related tothe assessment of seismic hazard.
References
Akkaya, A. D. and Yucemen, M. S.: 2002, Stochastic modeling of earthquake occurrences andestimation of seismic hazard: A random field approach, Probab. Eng. Mech. 17, 1–13.
Amendola, A., Ermoliev, Y., Ermolieva, T. Y., Gitis, V., Koff, G., and Linnerooth-Bayer, J.:
2000, A systems approach to modeling catastrophic risk and insurability, Nat. Hazards 21,381–393.
Applied Technology Council: 1985, Earthquake Damage Evaluation Data for California,
Report ATC-13, Redwood City, California.Askan, A. and Yucemen, M. S.: 2003, Stochastic methods for the estimation of potential
seismic damage. In: Proceedings of the Ninth International Conference on Application of
Statistics and Probability in Civil Engineering, Berkeley, California, Vol. I, pp. 497–502.Blong, R.: 2003a, A review of damage intensity scales, Nat. Hazards 29, 57–76.Blong, R.: 2003b, A new damage index, Nat. Hazards 30, 1–23.Bommer, J., Spence, R., Erdik, M., Tabuchi, S., Aydinoglu, N., Booth, E., del Re, D., and
Peterken, O.: 2002, Development of an earthquake loss model for Turkish catastropheinsurance, J. Seismol. 6, 431–446.
Brillinger, D. R.: 1993, Earthquake Risk and Insurance, Environmentrics 4, 1–21.
Code: 1975, Specifications for Structures to be Built in Disaster Areas, Earthquake ResearchInstitute, Turkish Government Ministry of Reconstruction and Resettlement, Ankara.
Cornell, C. A.: 1968, Engineering seismic risk analysis, Bull. Seismol. Soc. Am. 58(5), 1583–
1606.Cornell, C. A. and Winterstein, S. R.: 1998, Temporal and magnitude dependence in earth-
quake recurrence models, Bull. Seismol. Soc. Am. 78, 1522–1537.
Elnashai, A. S.: 2000, Analysis of the damage potential of Kocaeli (Turkey) earthquake of 17August 1999, Eng. Struct. 22(7), 746–754.
Ferraes, S. G.: 2003, The conditional probability of earthquake occurrence and the next largeearthquake in Tokyo, Japan, J. Seismol. 7, 145–153.
Gencoglu, S., Ozmen, B., and Guler, H.: 1996, Settlement Locations and Earthquake, TurkishEarthquake Foundation, Ankara (in Turkish).
Gulkan, P., Yucemen, M. S., Basoz, N., Kocyigit, A., and Doyuran, V.: 1993, Seismic Zoning
Map for Turkey Based on the Most Recent Data, METU/EERC; Report No. 93–01,Ankara (in Turkish).
Gurpinar, A. and Yucemen, M. S.: 1980, An obligatory earthquake insurance model for
Turkey, In: Proceedings of the International Conference on Engineering for Protection fromNatural Disasters, Asian Institute of Technology, Bangkok, Thailand, pp. 895–906.
ASSESSMENT OF EARTHQUAKE INSURANCE RATES 311
Gurpinar, A., Abali, M., Yucemen, M. S., and Yesilcay, Y.: 1978, Feasibility of ObligatoryEarthquake Insurance in Turkey, METU/ EERI Report No.78–05, Ankara (in Turkish).
Gutenberg, B. and Richter, C.: 1956, Earthquake magnitude, intensity, energy and accelera-tion, Bull. Seismol. Soc. Am. 46, 105–143.
Joyner, W. B. and Boore, D. M.: 1981, Peak horizontal acceleration and velocity from strong
motion records including records from the 1979 Imperial Valley, California earthquake,Bull. Seismol. Soc. Am. 71(6), 2011–2038.
Kamei, K.: 1976, Japanese report on outline of earthquake insurance in Japan, In: UNESCOConference on Assessment and Mitigation of Earthquake Risk, Paris.
Kunreuther, H.: 1996, Mitigating disaster losses through insurance, J. Risk Uncertainty, 12,171–187.
Lockett, J. E.: 1980, Catastrophes and catastrophe insurances, J. Inst. Actuaries Student Soc.
24, 1980, 91–134.Lomnitz, C.: 1974, Global Tectonics and Earthquake Risk, Elsevier, Amsterdam.McGuire, R. K.: 2004, Seismic Hazard and Risk Analysis, EERI, MNO-10, California.
Ozgur, C. and Yucemen, M. S.: 1997, Assessment of Seismic Hazard for Cyprus, Chamber ofCivil Engineers, Report No.: UCCTEA/CCE-97–01, Nicosia.
Ozmen, B. and Bagc�, G.: 2000, 12 November 1999 Duzce Earthquake Report, Ministry of
Public Works and Resettlement, General Directorate of Disaster Affairs, EarthquakeResearch Department, Ankara (in Turkish).
Scawthorn, C., Kunreuther, H., and Roth Jr, R.: 2003, Insurance and financial risk transfer,In: W.-F Chen. and C. Scawthorn (eds.), Earthquake Engineering Handbook, CRC Press,
Chapter 32.Smolka, A. and Berz, G.: 1989, The Mexico earthquake of September 19, 1985 – an
analysis of the insured loss and implications for risk assessment, Earthquake Spectra, 5,
223–248.Smolka, A. and Berz, G.: 1991, Seismic zoning in earthquake insurance: past and future, In:
Proceedings of the Fourth International Conference on Seismic Zonation, Stanford, Cali-
fornia, pp. 245–252.Steven, L.: 1992, The earthquake and war damage commission – a look forward (and a look
back), Bull. N. Z. Nat. Soc. Earthquake Eng., 25, 52–55.Straub, E.: 1973, Earthquakes and statistics from the insurance point of view, Bull. Inter.
Statist. Inst. 45(3), 462–466.Sucuoglu, H. and Tokyay, M.: 1992, Engineering Report of 13 March 1992 Erzincan
Earthquake, Turkish Society of Civil Engineers, Ankara (in Turkish).
Trifunac, M. D. and Brady, A. G.: 1975, On the correlation of seismic intensity scale withpeaks of recorded ground motions, Bull. Seismol. Soc. Am. 45, 139–162.
Vere Jones, D.: 1973, The statistical estimation of earthquake risk, N. Z. Stat. 8, 7–16.
Wald, D. J., Quitoriano, V., Heaton, T. H., and Kanamori, H.:1999, Relationships betweenpeak ground acceleration, peak ground velocity and modified Mercalli intensity in Cali-fornia, Earthquake Spectra 15(3), 557–564.
Walker, G. R.: 2000, Earthquake engineering and insurance: past, present and future, Aon ReAustralia (available on the Internet at: http://www.aon.com.au/reinsurance/knowledge/quake_engineering.asp).
Wasti, S. T. and Sucuoglu, H.: 1999, Rehabilitation of Moderately Damaged Reinforced
Concrete Buildings after the 1 October 1995 Dinar Earthquake, METU/EERC, ReportNo. 99–01, Ankara (in Turkish).
Whitman, R. V.: 1973, Damage Probability Matrices for Prototype Buildings, Dept. of Civil
Engineering, MIT, R73–57, Cambridge.
M. S. YUCEMEN312

Yucemen, M. S.: 1992, Seismic hazard maps for Jordan and vicinity, Nat. Hazards 6(3), 201–226.
Yucemen, M. S.: 1993, A random field model for the estimation of seismic hazard, Struct.Safety 12, 187–203.
Yucemen, M. S.: 2002, Prediction of potential seismic damage to reinforced concrete buildings
based on damage probability matrices, In: Proceedings of the 6th International Conferenceon Concrete Technology for Developing Countries, Amman, Vol. 3, pp. 951–960.
Yucemen, M. S. and Akkaya (Dener), A.: 1996, A comparative study of stochastic models forseismic hazard estimation, In: M. I. El-Sabh, S. Venkatesh, H. Denis and T. S. Murty (ed),
Land-Based and Marine Hazards, Kluwer Academic Publishers, The Netherlands, Vol. 7,pp. 5–24.
Yucemen, M. S. and Askan, A.: 2003, Estimation of earthquake damage probabilities for
reinforced concrete buildings, In: S. T. Wasti and G. Ozcebe (eds), Seismic Assessment andRehabilitation of Existing Buildings, NATO Science Series IV: Earth and EnvironmentalSciences, Kluwer Academic Publishers, The Netherlands, Vol. 29, pp. 149–164.
Yucemen, M. S. and Bulak, S.: 1997, Assessment of earthquake insurance premiums based onstatistical methods, In: Proceedings of the Fourth National Earthquake Engineering Con-ference, Ankara, pp. 699–707 (in Turkish).
Yucemen, M. S. and Bulak, S.: 2000, Estimation of earthquake damage on structures: damageprobability matrices, Bull. Chamb. Civil Eng. 3, 15–22 (in Turkish).
Yucemen, M. S. and Gulkan, P.: 1994, Seismic hazard analysis with randomly located sources,Nat. Hazards 9, 215–233.
ASSESSMENT OF EARTHQUAKE INSURANCE RATES 313