problem 1 sample test 2 4/22/05 - rice universitydobelman/courses/spring05/test2_sample.pdfproblem 1...
TRANSCRIPT

Problem 1 Sample Test 2 4/22/05
1. Which of the following are statistics?
a. All of these choices.
b. median
c. mean
d. standard deviation
e. the population mean
f. the population standard deviation
g. the sample proportion
h. the population proportion,
2. What is the distribution of the values of a statistic called?
a. a sample
b. a sampling distribution
c. Central Limit Theorem
d. a mean
3 Which of the following defines the sampling distribution of ?
a. It is the distribution of the sample means for all samples of the same size from the population.
b. It is the probability distribution of a population mean.
c. It is the probability distribution of the sample proportion based on a random sample of size n.
d. It is the probability distribution of the sample means for all possible sample sizes from the population.
4
When can the Central Limit Theorem be safely applied using the conservative rule?
a. When n is greater than 30

Problem 1 Sample Test 2 4/22/05
b. When n is greater than or equal to 10
c. When n is less than 10
d. When n is greater than 20
5. Suppose a random sample of 15 snow throwers has a mean lifespan of 20 years. If it is known
that , what is the test statistic for testing ?
a. 0.026
b.
c. –0.50
d. 6. What is the probability of a Type I error of a test of if a 0.05 level of significance is used for the test?
a. 0.62
b. 0.05
c. The sample data is needed to determine the probability of a Type I error for a test.
d. 0.10
7. Suppose 15 students pass an exam in a class of size 25. If the population proportion of
students who pass the exam is 0.65, what are the mean and standard deviation for the sampling distribution of p?
a.
b.
c.
d. 8. When are two population means considered identical?
a. when
b. when
c. when
Problem 1 Sample Test 2 4/22/05
d. when 9. What is the test statistic for testing whether or not the true proportion of adults who visit a
dentist regularly is indeed or whether it is less? Suppose a random sample of 30 adults found that the proportion who visited a dentist regularly was .
a.
b.
c.
d.

Problem 1 Sample Test 2 4/22/05
10 What is the P-value for a test of with a test statistic of ?
a. 1.928
b. 0.9641
c. 0.072
d. 0.036
11. Which of the following is not true with regards to a P-value?
a. A P-value indicates the strength of the evidence against the null hypothesis.
b. A P-value does not tell us the probability that the null hypothesis is true.
c. A P-value is a probability and must be between 0 and 1.
d. The larger the P-value the more conclusive the evidence is against the null hypothesis.
12. If a computer is not available, what is a conservative estimate of the number of degrees of freedoms for the t curve when computing a two-sample confidence interval for the difference
between two independent population means if and ?
a. 60
b. 19
c. 39
d. 20
Problem 1 4/22/05 Sample Test 2
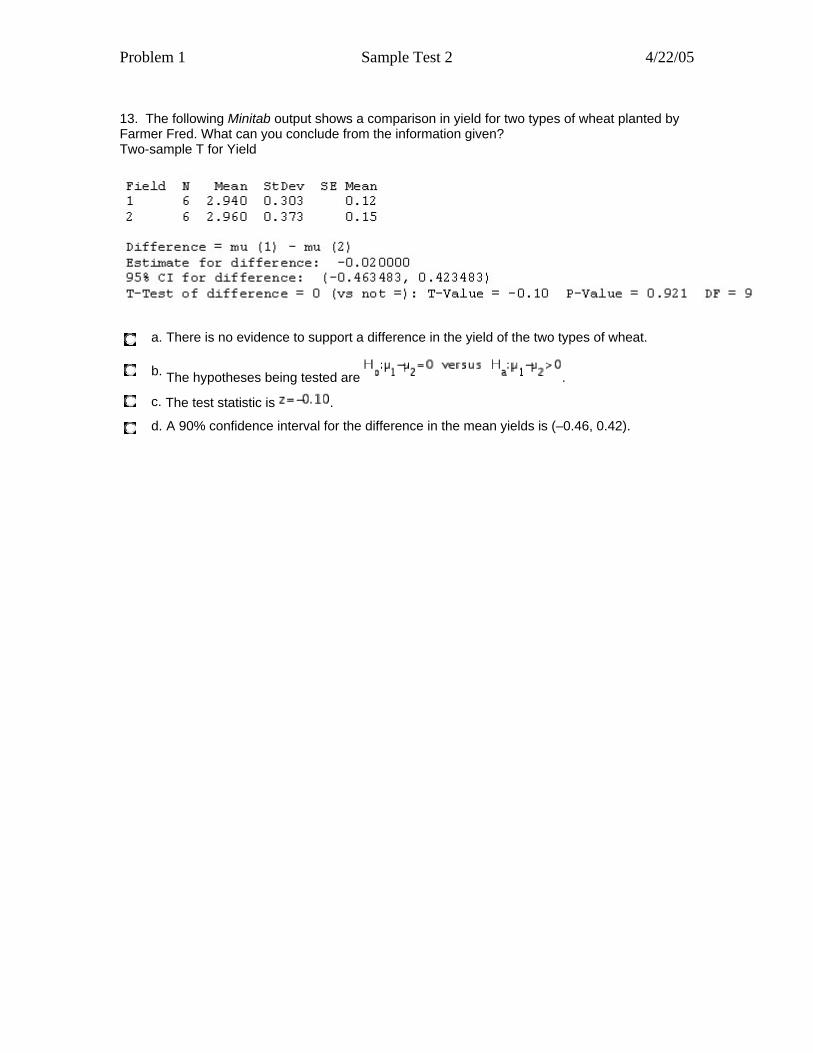
13. The following Minitab output shows a comparison in yield for two types of wheat planted by Farmer Fred. What can you conclude from the information given? Two-sample T for Yield
a. There is no evidence to support a difference in the yield of the two types of wheat.
b. The hypotheses being tested are .
c. The test statistic is .
d. A 90% confidence interval for the difference in the mean yields is (–0.46, 0.42).
Problem 2 Sample Test 2 4/22/05
1. Fill in the blank. An unbiased statistic is a statistic whose mean value is __________ the
population characteristic estimated.
a. equal to
b. half the value of
c. greater than
d. less than
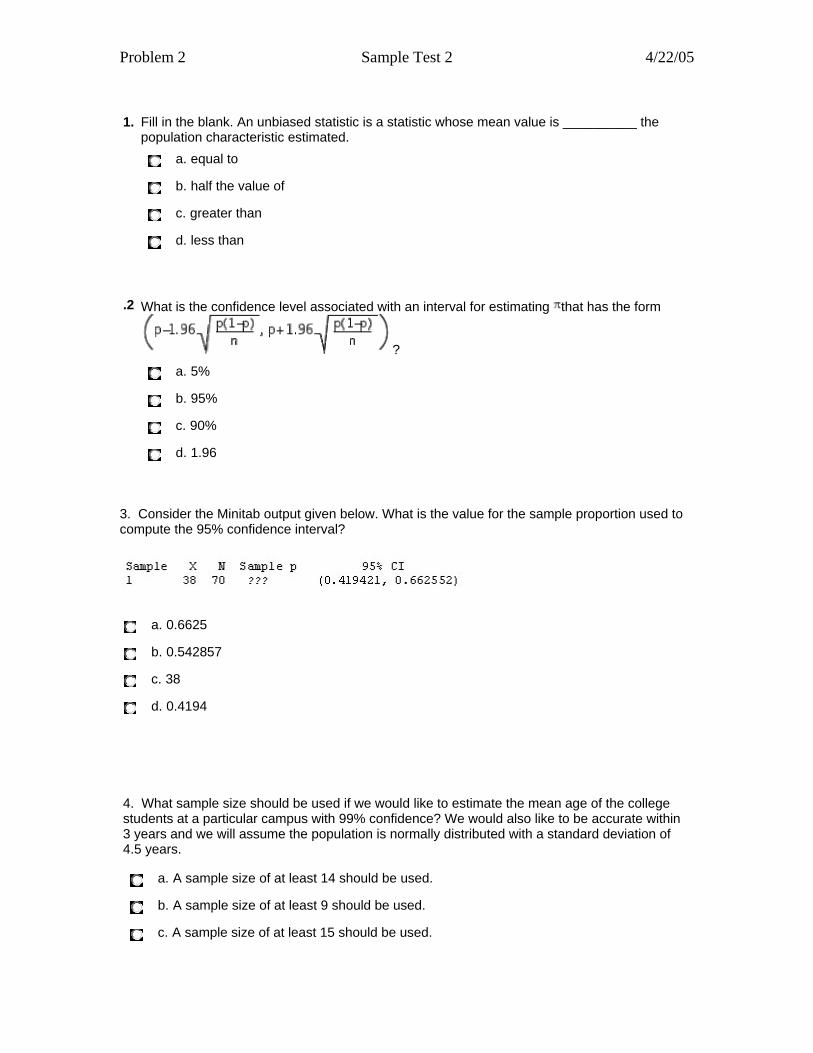
.2 What is the confidence level associated with an interval for estimating that has the form
?
a. 5%
b. 95%
c. 90%
d. 1.96
3. Consider the Minitab output given below. What is the value for the sample proportion used to compute the 95% confidence interval?
a. 0.6625
b. 0.542857
c. 38
d. 0.4194 4. What sample size should be used if we would like to estimate the mean age of the college students at a particular campus with 99% confidence? We would also like to be accurate within 3 years and we will assume the population is normally distributed with a standard deviation of 4.5 years.
a. A sample size of at least 14 should be used.
b. A sample size of at least 9 should be used.
c. A sample size of at least 15 should be used.

Problem 2 Sample Test 2 4/22/05
d. A sample size of at least 26 should be used.
5. How are t distributions distinguished from one another?
a. their standard deviation
b. All t distributions are exactly the same.
c. their mean
d. their degrees of freedom
6. What is a point estimate for the population mean of GPA based on the Minitab output below from a random sample of data from the population?
a. 2.63
b. (2.52328, 2.73672)
c. 0.58
d. 200 7. Which of the following is the test statistic for a hypothesis of a population mean if the
population standard deviation is unknown?
a.
b.
c.

Problem 2 Sample Test 2 4/22/05
d.
8. Which of the following is the correct formula for constructing a confidence interval for when is unknown and either the sample size is large or the population distribution is normal?
a.
b.
c.
d.

Problem 2 4/22/05 Sample Test 2
9. Suppose the P-value equals 0.09 for testing whether grocery stores stocked on average more than 30 varieties of potato chips. Which of the following conclusions would be correct for testing the hypotheses ?
a. It can be concluded that stores stock more than 30 varieties on average using the significance level.
b. It can be concluded that stores stock more than 30 varieties on average using the significance level.
c. It can be concluded that on average stores do not stock more than 30 varieties using the significance level.
d. It can be concluded that on average stores do not stock more than 30 varieties using the significance level.
10. Which of the following is the correct null hypothesis for testing whether two population means are the same?
a.
b.
c.
d. 11. If two independent random samples gave the following information, what would be the t value for testing that the population means are identical? Assume the populations are approximately normal.
Sample A: Sample B:
a.
b.
c.
d. 12. What can be concluded from the following Minitab output in a study the heights of six randomly chosen first graders at the beginning of the school year (September) and the end of the school year (June)? Paired T for height in June - height in September

Problem 2 Sample Test 2 4/22/05
a.
Since the mean difference is 1.45 we can conclude that students grown on average 1.45 inches per year and thus there is a difference between mean heights of the students at the beginning of the school year and the mean height of students at the end of the school year at the level.
b. The data support the theory that there is not a difference between mean heights of the students at the beginning of the school year and the mean height of students at the end of the school year at the level.
c. The data support the theory that there is a difference between mean heights of the students at the beginning of the school year and the mean height of students at the end of the school year at the level.
d. The data support the theory that there is a difference between mean heights of the students at the beginning of the school year and the mean height of students at the end of the school year at the level.
13. What is the formula used to compute?
a. It is the test statistic for comparing two population proportions.
b. It is the standard deviation used when constructing a confidence interval for .
c. It is the pooled standard deviation for two proportions.
d. It is the statistic for estimating the common population proportion when .
Problem 3 Sample Test 2 4/22/05
Risky Behavior. The National AIDS Behavioral Surveys interviewed a random sample of 2673 adult heterosexuals. Of these, 170 said they had more than one sexual partner in the past year. Assume these people told the truth. We would like to make inference about the true population proportion π of heterosexual risky behavior. a. Calculate the sample proportion ; you should calculate both the “old” (good-enough for the last 100 years) and the “new” Wilson estimates.
p̂
b. Calculate the (1-α) confidence intervals for π using α =.05 c. Suppose another sample was taken with X=148, the number of “successes” for risky behavior. What is the confidence interval for this result?
Problem 3 Sample Test 2 4/22/05
d. What does the (1- α ) confidence interval mean? I.e., suppose the true π =0.06 and you are able to get 100 samples. e. Suppose a similar study was done in Sweden, with NSW=3141 and XSW=243. We think that the Swedes might be more risqué than those in the US. Design an appropriate test of this belief and comment on its results. Do this for both the traditional and Wilson estimates.
Problem 3 Sample Test 2 4/22/05
f. Comment on the difference between your tests based on the Wilson and the traditional estimates. g. List some confounding factors in this survey. For example, truth bias might be present because respondees might be unwilling to tell the truth.
Problem 4 Sample Test 2 4/22/05
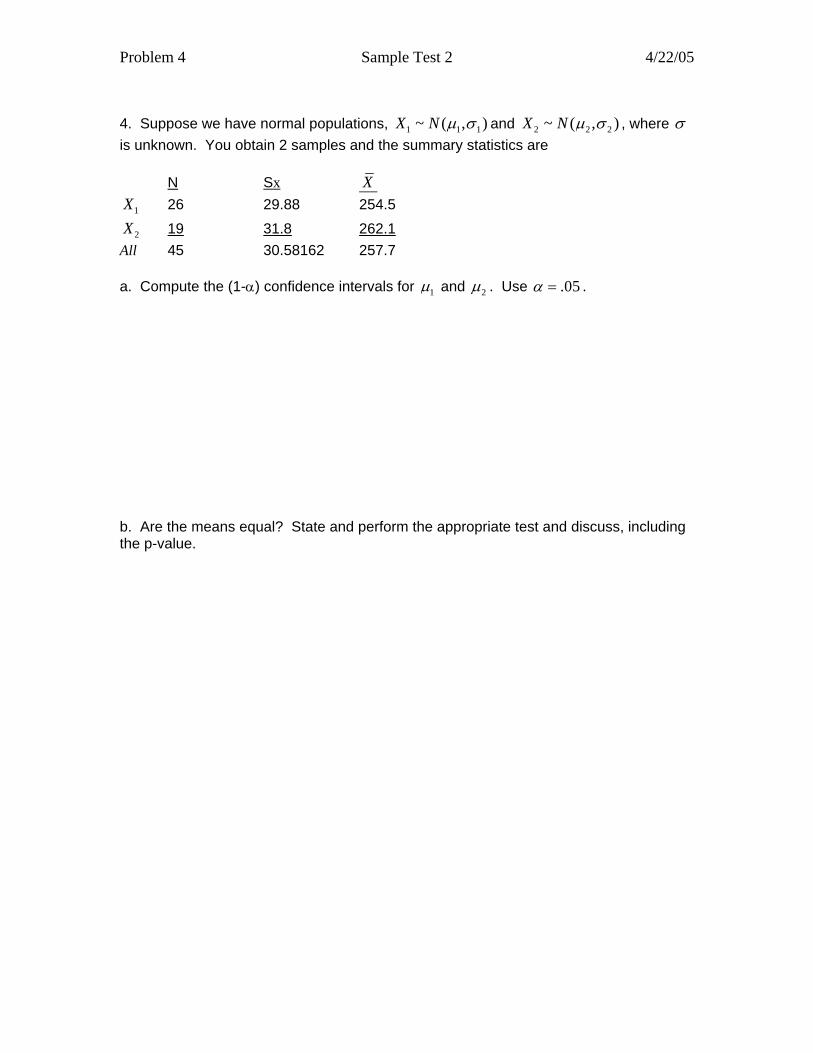
4. Suppose we have normal populations, 1 1~ ( , )X N 1µ σ and 2 2~ ( , )X N 2µ σ , where σ is unknown. You obtain 2 samples and the summary statistics are N Sx X
1X 26 29.88 254.5
2X 19 31.8 262.1All 45 30.58162 257.7 a. Compute the (1-α) confidence intervals for 1µ and 2µ . Use .05α = . b. Are the means equal? State and perform the appropriate test and discuss, including the p-value.

Problem 4 Sample Test 2 4/22/05
c. Since our sample size is relatively small, it would be better to use a pooled estimate for the standard deviation. We can do this is the standard deviations are the same. Perform the appropriate test (also using .05α = ) of the hypothesis that the standard
deviations are the same. Recall that 2
?, 2
?
1whatevera b
whatever
SF
S= ≥ since 2σ <0.
d. If you accepted in part c. redo the test in part b using the pooled standard deviation. Discuss what difference, if any, using a pooled variance made in your inference. The sample standard deviation for all 45 data points is 30.58162.
0H