problem solving & quality improvement 101
TRANSCRIPT

Visit our website: www.doh.wa.gov/PHIP/perfmgtcenters
Public Health Performance Management Centers for Excellence
1
Welcome! Quality Improvement Tools for
Improving Public Health Practice will begin shortly
Funded by the US Centers for Disease Control and Prevention
Public Health Performance Management
Centers for Excellence
Funded by the U. S. Centers for Disease Control’s National Public Health Improvement Initiative
July 2013
Quality Improvement Tools for
Improving Public Health Practice
July 17, 2013
Susan Pfeifer and Stacy Wenzl
2 Funded by the U. S. Centers for Disease Control’s National Public Health Improvement Initiative
Visit us: www.doh.wa.gov/PHIP/perfmgtcenters

Visit our website: www.doh.wa.gov/PHIP/perfmgtcenters
Adams
Benton-Franklin
Chelan-Douglas
Clallam
Clark
Columbia
Cowlitz
Garfield
Grant
Island
Jefferson
Kitsap
Kittitas
Klickitat
Lewis
Lincoln
Northeast Tri-County Okanogan
Pacific
King
San Juan
Skagit
Skamania
Snohomish
Spokane
Pierce
Thurston
Wahkiakum Walla Walla
Whatcom
Whitman
Yakima
Grays
Harbor
Asotin
Chelan
Douglas
Ferry Stevens
Pend
Oreille
Benton
Franklin
Mason
Noosack Tribe
Lummi Tribe
Upper Skagit Tribe
Sauk-Suiattle Tribe
Samish Tribe Swinomish Tribe
Stillaguamish Tribe
Snoqualmie Tribe
Muckleshoot Tribe
Puyallup Tribe
Suquamish Tribe
Makah Tribe
Lower Elwha Klallam Tribe Jamestown
S’Klallam Tribe Quileute Tribe
Hoh Tribe
Port Gamble S’Klallam
Tribe
Skokomish Tribe Quinault Tribe
Shoalwater Bay Tribe
Nisqually Tribe
Chehalis Confederated
Tribes
Confederated Tribes and Bands
Yakima Nation WA State Dept. of Health
Center for Excellence
Tacoma-Pierce County Center for Excellence
Colville Confederated
Tribes
Kalispel Tribe
Spokane Regional Health Center for Excellence
Tulalip Tribe
Tacoma-Pierce
Seattle-King County
Tacoma-Pierce Co Health Dept.
WA State Dept. of Health
Spokane Regional Health
District
County Boundaries
Washington’s Federally Recognized Tribes
Squaxin Tribe
Spokane Tribe
Which Center for Excellence Region are you located in? A. Department of Health B. Tacoma-Pierce County Health Department
C. Spokane Regional Health District D. Outside Washington State

Visit our website: www.doh.wa.gov/PHIP/perfmgtcenters
Public Health Performance Management Centers for Excellence
4
Today’s Presenters Susan Pfeifer RN, MN, is the Office of Assessment, Planning and Improvement Program Manager at the Tacoma-Pierce County Health Department, where she has worked for more than 20 years. Susan has been the facilitator for the Department's Quality Improvement Council for seven years.
Stacy Wenzl, MHPA, is the manager of the Community Health Assessment, Planning, and Evaluation program at Spokane Regional Health District She has worked at SRHD for almost 10 years and has experience in five different program areas. Stacy is currently co-Chair for SRHD’s Quality Council.
Visit our website: www.doh.wa.gov/PHIP/perfmgtcenters
Public Health Performance Management Centers for Excellence
5

Visit our website: www.doh.wa.gov/PHIP/perfmgtcenters
Public Health Performance Management Centers for Excellence
6
Today’s Learning Objectives: • Upon completion participants should be able to:
– Review and practice four important Quality Improvement Tools to apply as part of their QI teams
• Process Mapping
• Cause and Effect Diagram
• 5-S
• Prioritization Matrix
– Describe how they will apply at least two of the tools in their QI work

Visit our website: www.doh.wa.gov/PHIP/perfmgtcenters
Public Health Performance Management Centers for Excellence
7
What’s the Difference: QI Method vs. QI Tool
Assess
Define
Analyze
Change
Evaluate
PLAN
DO
ACT
STUDY
Affinity diagrams
Prioritization tools
Project definition forms
Process maps
Cause & Effect
Pareto charts
Data collection
Run charts
Histogram
Detailed flow charts
Prioritization tools
Gantt chart
Process maps
Run charts
Control charts

Visit our website: www.doh.wa.gov/PHIP/perfmgtcenters
Public Health Performance Management Centers for Excellence
5S + Safety A Lean Tool
8

Visit our website: www.doh.wa.gov/PHIP/perfmgtcenters
Public Health Performance Management Centers for Excellence
9
5S: Where are we?
Assess
Define
Analyze
Change
Evaluate
PLAN
DO
ACT
STUDY

Visit our website: www.doh.wa.gov/PHIP/perfmgtcenters
Participant poll
• Have you used or
currently use the
5S approach to
quality?
10
A. Yes
B. No
C. Unsure

Visit our website: www.doh.wa.gov/PHIP/perfmgtcenters
Public Health Performance Management Centers for Excellence
5S+Safety is a strategy to keep our workplace safe and in order
5S+Safety
You have everything you need.
You need everything you
have.
You can see everything clearly belongs where it
is.
11

Visit our website: www.doh.wa.gov/PHIP/perfmgtcenters
Public Health Performance Management Centers for Excellence
Safety
1- Sort
2-Simplify
3-Sweep
4-Standardize
5-Self Discipline
5S+Safety
12

Visit our website: www.doh.wa.gov/PHIP/perfmgtcenters
Public Health Performance Management Centers for Excellence
13

Visit our website: www.doh.wa.gov/PHIP/perfmgtcenters
Public Health Performance Management Centers for Excellence
14

Visit our website: www.doh.wa.gov/PHIP/perfmgtcenters
Public Health Performance Management Centers for Excellence
Sort ”When in doubt, move it out”
Separate necessary from unnecessary
– Establish criteria
– Identify unnecessary items
– Move unnecessary items to holding area to
reside for a limited time
– Conduct an initial cleaning
15

Visit our website: www.doh.wa.gov/PHIP/perfmgtcenters
Public Health Performance Management Centers for Excellence
16

Visit our website: www.doh.wa.gov/PHIP/perfmgtcenters
Public Health Performance Management Centers for Excellence
“A place for everything.”
• Arrange workplace
– Identify key equipment and supplies
– Determine location for each item
– Visual management (labels, folders, etc.)
– Document layout, equipment, supplies
Simplify
17

Visit our website: www.doh.wa.gov/PHIP/perfmgtcenters
Public Health Performance Management Centers for Excellence
1
9
8
7
6
5
4
3
2


Visit our website: www.doh.wa.gov/PHIP/perfmgtcenters
Public Health Performance Management Centers for Excellence
Sweep
“Everything in its place.”
• Clean area
• Determine acceptable performance
• Mark equipment
• Create visual indicators to “sweep”
• Perform daily cleaning
20

Visit our website: www.doh.wa.gov/PHIP/perfmgtcenters
Public Health Performance Management Centers for Excellence
21

Visit our website: www.doh.wa.gov/PHIP/perfmgtcenters
Public Health Performance Management Centers for Excellence
Standardize
“Sort, simplify, and sweep always.”
• Determine and agree upon best practice
–Document
–Communicate
–Make it clear and simple
22

Visit our website: www.doh.wa.gov/PHIP/perfmgtcenters
Public Health Performance Management Centers for Excellence
23

Visit our website: www.doh.wa.gov/PHIP/perfmgtcenters
Public Health Performance Management Centers for Excellence
Self-Discipline
“Make 5S+Safety a habit”
• Maintain the gains and improve – Determine 5S+Safety level of achievement
– Perform routine checks
– Analyze results of routine checks
– Measure progress and plan for continuous improvement
24

Visit our website: www.doh.wa.gov/PHIP/perfmgtcenters
Public Health Performance Management Centers for Excellence
25
Visit our website: www.doh.wa.gov/PHIP/perfmgtcenters
Public Health Performance Management Centers for Excellence
26

Visit our website: www.doh.wa.gov/PHIP/perfmgtcenters
Public Health Performance Management Centers for Excellence
+Safety
“Safety is Job #1.”
• Correct safety hazards (ergonomics, environment, etc.)
– Identify
– Investigate
– Correct
– Communicate
27

Visit our website: www.doh.wa.gov/PHIP/perfmgtcenters
Participant poll
• How likely are you
to start using the
5S tool?
A. So cool, I’m
gonna 5S my work
space and garage!
B. Never gonna
happen.
C. Intrigued but
need more info.
D. Might give it a try.
28

Visit our website: www.doh.wa.gov/PHIP/perfmgtcenters
Public Health Performance Management Centers for Excellence
29
Process Mapping
Visit our website: www.doh.wa.gov/PHIP/perfmgtcenters
Public Health Performance Management Centers for Excellence
30
Participant poll
• Have you used or currently use process mapping for quality improvement projects?
A. Yes
B. No
C. Unsure

Visit our website: www.doh.wa.gov/PHIP/perfmgtcenters
Public Health Performance Management Centers for Excellence
31
Process Map: Where are we?
Assess
Define
Analyze
Change
Evaluate
PLAN
DO
ACT
STUDY
Visit our website: www.doh.wa.gov/PHIP/perfmgtcenters
Public Health Performance Management Centers for Excellence
32
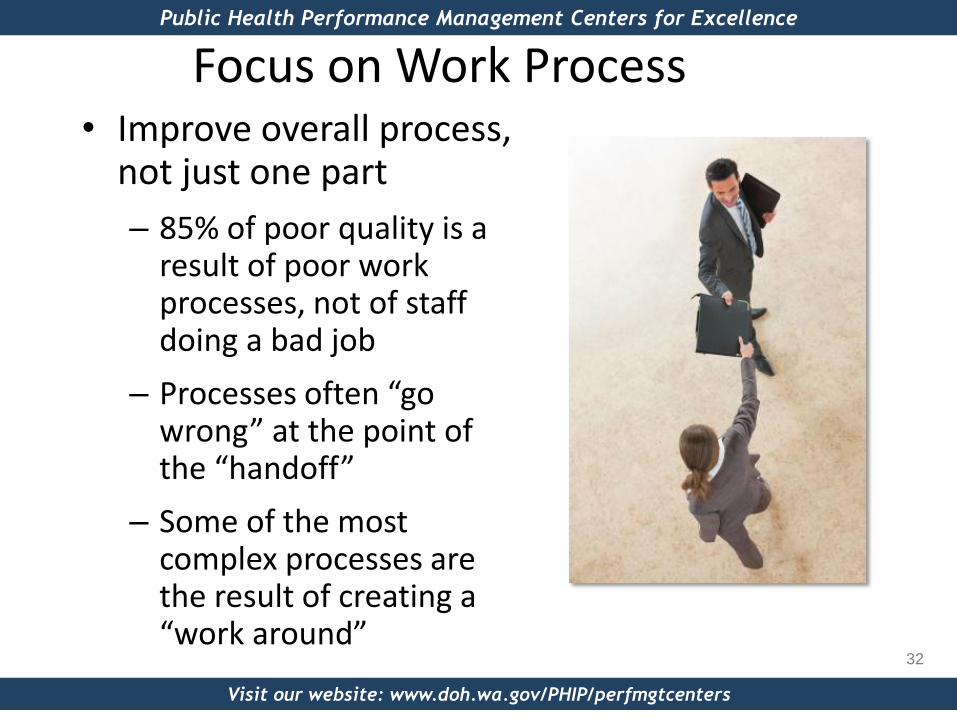
Focus on Work Process • Improve overall process,
not just one part
– 85% of poor quality is a result of poor work processes, not of staff doing a bad job
– Processes often “go wrong” at the point of the “handoff”
– Some of the most complex processes are the result of creating a “work around”

Visit our website: www.doh.wa.gov/PHIP/perfmgtcenters
Public Health Performance Management Centers for Excellence
33
3 Views of a Process
The way you want it to be (simple)
The way you think it is (slightly more complex)
The way it really is
start
end

Visit our website: www.doh.wa.gov/PHIP/perfmgtcenters
Public Health Performance Management Centers for Excellence
34
Flow Charting When would I use this tool?
Flow charting can be used for a variety of purposes
• High Level flow charts are useful to frame the scope and boundaries of a project, to connect activities to outcomes (logic model), etc.
• Matrix flow (swim lane/functional) charts are good for framing analysis and for communicating a standard in an easy to follow format
• Detailed flow charts are good for analyzing a process, or for designing and communicating solutions, or for establishing a standard.

Visit our website: www.doh.wa.gov/PHIP/perfmgtcenters
Public Health Performance Management Centers for Excellence
35
High Level Flow
Visit our website: www.doh.wa.gov/PHIP/perfmgtcenters
Public Health Performance Management Centers for Excellence
36
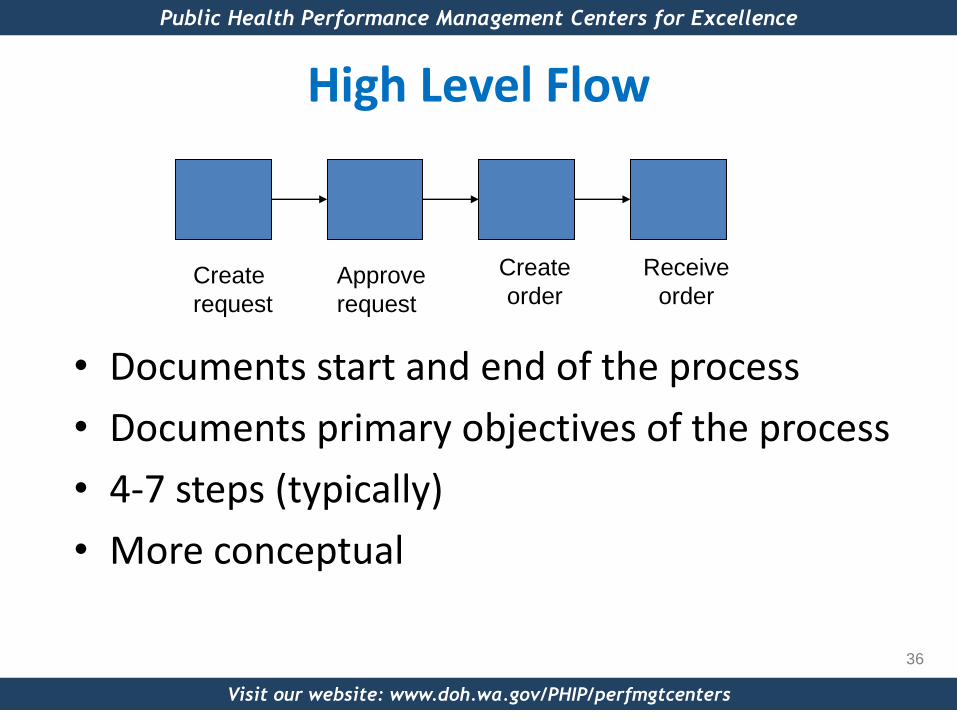
High Level Flow
• Documents start and end of the process
• Documents primary objectives of the process
• 4-7 steps (typically)
• More conceptual
Create
request
Approve
request
Create
order
Receive
order

Visit our website: www.doh.wa.gov/PHIP/perfmgtcenters
Public Health Performance Management Centers for Excellence
37
(1) DOH sets date for release
(2) Call for password and ask for STATA
format
(3) Download from FTP site
(4) Saved in HYS_year folder
labeled data_year
(5) Lock data files (read only)
(6) Users create own copy of files and save in personal
folder for analysis
Healthy Youth Survey data processing procedure
Data owner: Liz
High Level Flow
Example courtesy of Tacoma-Pierce County Health Department

Visit our website: www.doh.wa.gov/PHIP/perfmgtcenters
Public Health Performance Management Centers for Excellence
38
High Level Flow

Visit our website: www.doh.wa.gov/PHIP/perfmgtcenters
Public Health Performance Management Centers for Excellence
39 Example courtesy of Grant County Health District
High Level Flow

Visit our website: www.doh.wa.gov/PHIP/perfmgtcenters
Public Health Performance Management Centers for Excellence
40
Swim Lane/Functional/Matrix Flow
Task
Task
Task Task
Task
Task
Task Task
Function/
Dept.
Function/
Dept.
Function/
Dept.
Function/
Dept.
Function/
Dept.
Task

Visit our website: www.doh.wa.gov/PHIP/perfmgtcenters
Public Health Performance Management Centers for Excellence
41
• Documents objectives of process and what department/function is accountable
• Documents the major steps necessary to complete the objectives
• Documents relationships and hand-offs between functions/departments
• Still somewhat conceptual
• Though … can add as much detail as you like
Swim Lane/Functional/Matrix Flow

Visit our website: www.doh.wa.gov/PHIP/perfmgtcenters
Public Health Performance Management Centers for Excellence
42
Swim Lane/Functional/Matrix Flow

Visit our website: www.doh.wa.gov/PHIP/perfmgtcenters
Public Health Performance Management Centers for Excellence
43
Spaghetti Diagrams A form of flow charting from Lean

Visit our website: www.doh.wa.gov/PHIP/perfmgtcenters
Public Health Performance Management Centers for Excellence
44
Value Stream Maps

Visit our website: www.doh.wa.gov/PHIP/perfmgtcenters
Public Health Performance Management Centers for Excellence
45
Value Stream Maps – Current and Future State

Visit our website: www.doh.wa.gov/PHIP/perfmgtcenters
Public Health Performance Management Centers for Excellence
46
Value Stream Maps – Current and Future State • A Lean tool for work teams • A visual tool showing how a product moves
through the value stream • Focus on improving the whole value stream rather
than optimizing pieces of it. • Created by those who actually do the work • Time consuming to create • Displays time spent waiting, as well as time spent
touching the product • Highlights wastes like rework, waiting, inspection,
motion, batching, and errors • Future state map shows improved future process
and guides implementation

Visit our website: www.doh.wa.gov/PHIP/perfmgtcenters
Public Health Performance Management Centers for Excellence
47
Value Stream Maps – Current and Future State
TPCHD-Data requests Example courtesy of Tacoma-Pierce County Health Department

Visit our website: www.doh.wa.gov/PHIP/perfmgtcenters
Public Health Performance Management Centers for Excellence
48
Value Stream Maps – Current State
DOH-HIV Early Intervention Example courtesy of WA State Dept of Health

Visit our website: www.doh.wa.gov/PHIP/perfmgtcenters
Public Health Performance Management Centers for Excellence
49
Value Stream Maps – Future State
DOH-HIV Early Intervention

Visit our website: www.doh.wa.gov/PHIP/perfmgtcenters
Public Health Performance Management Centers for Excellence
50
Detailed Process Flow Chart • Describes every step and decision
• Calls out documents, data bases, etc.
• Shows reality of process: rework loops, undefined specifics, redundancy
• Good for detailed analysis (and design)
• Very time consuming to create
• Sometimes leads to documenting more than is necessary
• Can be hard for others to follow/understand

Visit our website: www.doh.wa.gov/PHIP/perfmgtcenters
Public Health Performance Management Centers for Excellence
51
Decision/
Inspection Step Step Step
Step Step Step
Step Wait
Decision/
Inspection
Decision/
Inspection
Decision/
Inspection
Step
Step Step Step Step
Re-work Loops – especially long ones
Multiple inspections
Wait states
Too many steps; Hand-offs
Step Step
Step
Step
Step
Step
Depends Variation
What to look for:

Visit our website: www.doh.wa.gov/PHIP/perfmgtcenters
Public Health Performance Management Centers for Excellence
52
Unclear/highly
variable
Step/
Action
Decision/
Inspection
Wait
Data Base
Document
Go to/ Connector
Terminator: Start-Stop
Detailed Process Flow Chart Shapes

Visit our website: www.doh.wa.gov/PHIP/perfmgtcenters
Public Health Performance Management Centers for Excellence
53
Detailed Process Flow Chart Shapes

Visit our website: www.doh.wa.gov/PHIP/perfmgtcenters
Public Health Performance Management Centers for Excellence
54
Flow Charting Steps • Define start and end of process
• Complete high-level flow (conceptual) with 4-7 objectives in between
• Add actions/steps to each objective as needed (consider matrix format)
• Add fine detail* as needed (e.g., inspections/decisions, re-work loops, documents, data bases, etc.)
*You may not need fine detail for every objective! Avoid flow charting the world.

Visit our website: www.doh.wa.gov/PHIP/perfmgtcenters
Public Health Performance Management Centers for Excellence
55
Flow Charting
TPCHD-STD Surveillance

Visit our website: www.doh.wa.gov/PHIP/perfmgtcenters
Public Health Performance Management Centers for Excellence
56
TPCHD-STD Surveillance
Flow Charting

Visit our website: www.doh.wa.gov/PHIP/perfmgtcenters
Public Health Performance Management Centers for Excellence
57
Root Cause Analysis

Visit our website: www.doh.wa.gov/PHIP/perfmgtcenters
Public Health Performance Management Centers for Excellence
58
Have you used or currently use root cause analysis approach to quality improvement projects?
A. Yes
B. No
C. Unsure
Participant Poll

Visit our website: www.doh.wa.gov/PHIP/perfmgtcenters
Public Health Performance Management Centers for Excellence
59
Root Cause Analysis: Where are we?
Assess
Define
Analyze
Change
Evaluate
PLAN
DO
ACT
STUDY

Visit our website: www.doh.wa.gov/PHIP/perfmgtcenters
Public Health Performance Management Centers for Excellence
60
W. Edwards Deming transformed quality control processes
by applying his beliefs
– Measuring outputs/outcomes at the end ignores
root cause and ensuing poor results.
– Addressing root causes through ongoing evaluation
and quality improvement avoids problems and
improves quality.
– Ongoing measurement with feedback loops helps
processes.
The Public Health Quality Improvement Handbook, p. 22
The Power of Root Cause Analysis

Visit our website: www.doh.wa.gov/PHIP/perfmgtcenters
Public Health Performance Management Centers for Excellence
61
• To find the real cause of a problem or issue • Understand the impact to the organization • Resolve it with a permanent fix • Encourages divergent thinking • Demonstrates the complexity of the problem • Encourages scientific analysis (rule-out) • We need to determine:
– what happened? – why it happened? – where it happened? – how to eliminate it?
Root Cause-Purpose

Visit our website: www.doh.wa.gov/PHIP/perfmgtcenters
Public Health Performance Management Centers for Excellence
62
Root cause analysis-Fishbone
TPCHD-Nurse Home Visiting

Visit our website: www.doh.wa.gov/PHIP/perfmgtcenters
Public Health Performance Management Centers for Excellence
63
Root cause analysis-Fishbone
Vital Records

Visit our website: www.doh.wa.gov/PHIP/perfmgtcenters
Public Health Performance Management Centers for Excellence
Service Coordinators
express difficulty in maintaining HMG
Caseloads
Timelines Data Entry
Partners
Paperwork/Protocol
Referrals
Management
Service Coordinator/Caseload
45 day initial
IFSP 180 days and with changes
48 hour initial contact
Billing
ET blackout days
10 day data entry rule
Improper use of forms
General documentation issues
Rapidly changing paperwork
Excessive paperwork obligation
Confusion about current paperwork
DS involvement/ Assignment
DCFS contact
Large influx of cases
Assignment of cases by location
Perception of high visit frequency (83% of cases per month)
Lengthy amount of ongoing visit time ( 33%> 2hours)
Perception of SC role involvement with family
Inaccurate perception of actual caseload
Ineffective Case tracking methods
Communication to staff
Unknown length or content of visits
FTE SCs must carry >50 cases to meet contract
Number of children needed to meet the contract amount is
greater than the FTE caseload guidelines
Transition to Schools
Can be changed or addressed
External factor larger systemic effort
Cannot be changed but can be mitigated
No Control
Help Me Grow QI Project
Aim statement: Optimize and consistently maintain Service Coordinators caseload to maximize the HMG contract ($348,086).
Information Overload
Tracking tools to ensure compliance measures.
Staff resistance to change
Low staff morale
SCs carrying for non-billable cases
64
64
Example courtesy of
Cuyahoga Co Ohio

Visit our website: www.doh.wa.gov/PHIP/perfmgtcenters
Public Health Performance Management Centers for Excellence
65
Why we don’t we have more
QI activities in our
department?
Category Category
Category Category
Category
Category
http://asq.org/learn-about-quality/cause-analysis-tools/overview/fishbone.html
Root cause analysis-Fishbone

Visit our website: www.doh.wa.gov/PHIP/perfmgtcenters
Public Health Performance Management Centers for Excellence
66
• Once the Fishbone Diagram has been constructed, the team should interpret or test for root cause(s) by one or more of the following: – Look for causes that appear more than once within or
across categories – Choose most likely root causes through an
unstructured consensus or a more formal process like Multivoting or Nominal Group Process
– Collect data on selected causes to determine relative frequencies
– Use an analysis tool, like a Pareto Chart, to identify root cause
Testing Potential Root Causes
Visit our website: www.doh.wa.gov/PHIP/perfmgtcenters
Public Health Performance Management Centers for Excellence
67
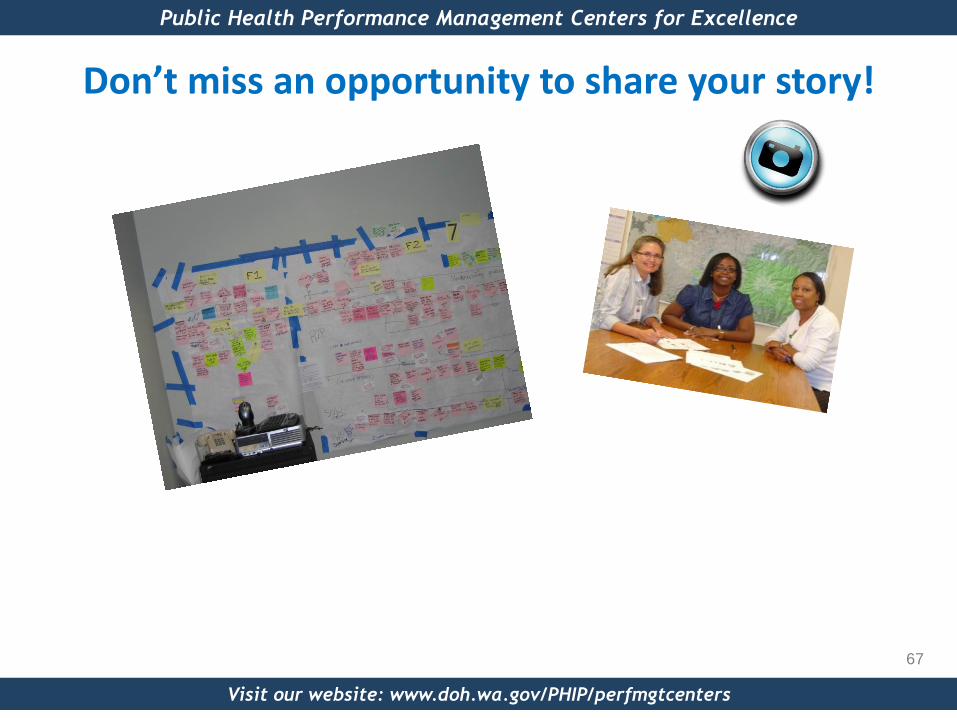
Don’t miss an opportunity to share your story!

Public Health Performance Management
Centers for Excellence
Visit our website: www.doh.wa.gov/PHIP/perfmgtcenters
68
“If You Don't Know
where You Are
Going, Any Path
Will Do.” The Cheshire Cat, in Lewis
Carroll's Alice In Wonderland
Prioritization Matrices

Visit our website: www.doh.wa.gov/PHIP/perfmgtcenters
Public Health Performance Management Centers for Excellence
Why use them?
• Decision tools are used to:
– Narrows decisions
– Limit “pet projects”
– Increases transparency and validity of decision making
– Consensus fosters buy-in
– Provides focus
– Other reasons?
69

Visit our website: www.doh.wa.gov/PHIP/perfmgtcenters
Public Health Performance Management Centers for Excellence
70
For what would I use them?
• CHA/CHIP
• Strategic plan
• Buying a car? Taking a vacation? Best wine?
• Prioritizing summer projects
• Quality improvement projects
• Other ideas?

Visit our website: www.doh.wa.gov/PHIP/perfmgtcenters
Public Health Performance Management Centers for Excellence
71
Decision tools: Where are we?
Assess
Define
Analyze
Change
Evaluate
PLAN
DO
ACT
STUDY
Visit our website: www.doh.wa.gov/PHIP/perfmgtcenters
Public Health Performance Management Centers for Excellence
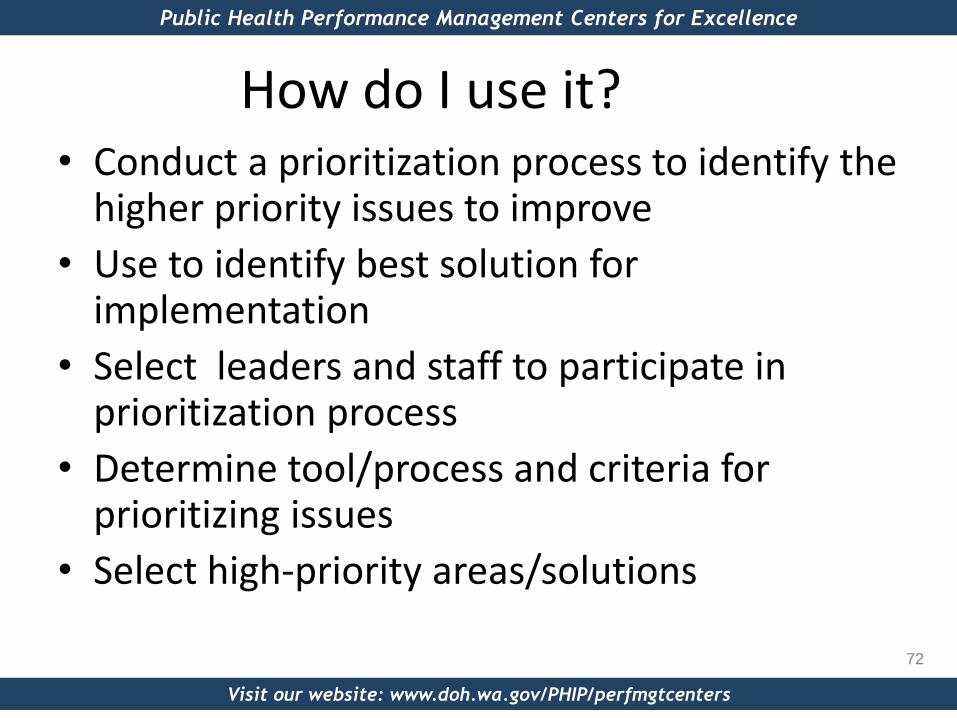
• Conduct a prioritization process to identify the higher priority issues to improve
• Use to identify best solution for implementation
• Select leaders and staff to participate in prioritization process
• Determine tool/process and criteria for prioritizing issues
• Select high-priority areas/solutions
How do I use it?
72

Visit our website: www.doh.wa.gov/PHIP/perfmgtcenters
Types of Decision Tools
73
Lower stakes
Higher stakes
73

Visit our website: www.doh.wa.gov/PHIP/perfmgtcenters
Types of Decision Tools
74
Lower stakes
Higher stakes
74

Visit our website: www.doh.wa.gov/PHIP/perfmgtcenters
Public Health Performance Management Centers for Excellence
75
• This is a conceptual tool to help give a team guidance on what to focus on when trying to pick a topic to improve
• They should focus where they have both control and knowledge
• In Public Health we may work more in the influence part of the circle or quadrant

Visit our website: www.doh.wa.gov/PHIP/perfmgtcenters
Public Health Performance Management Centers for Excellence
Stay Away
Do It Influence
Get Help
Know
ledge
No K
now
ledge
Control No Control
76

Visit our website: www.doh.wa.gov/PHIP/perfmgtcenters
Public Health Performance Management Centers for Excellence
Improving outbreak mitigation (decrease outbreak duration in LTC)
Reduce staff GI attack rate
Know
ledge
No K
now
ledge
Control No Control
77
Example courtesy of Spokane Regional Health District
GI illness in long-
term care facilities
Reduce point source outbreaks
Ensure LTC facilities are practicing infection control to community standards
Improve identification of high risk (ill) workers
Improve infection control training program within the nursing assistant curriculum

Visit our website: www.doh.wa.gov/PHIP/perfmgtcenters
Types of Decision Tools
78
Lower stakes
Higher stakes
78
Visit our website: www.doh.wa.gov/PHIP/perfmgtcenters
Public Health Performance Management Centers for Excellence
79
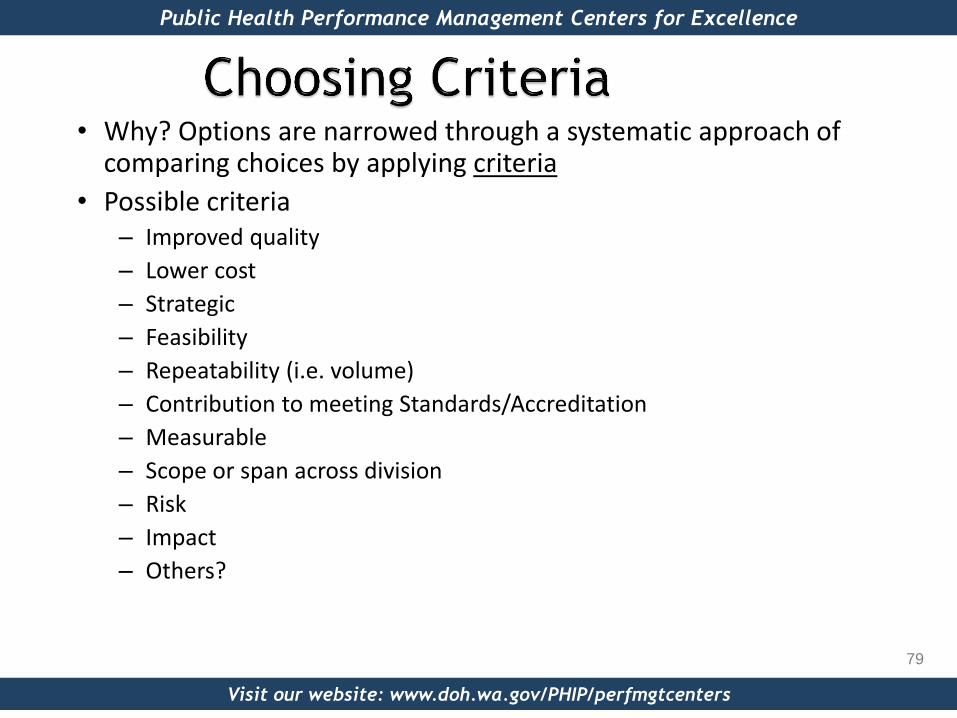
• Why? Options are narrowed through a systematic approach of comparing choices by applying criteria
• Possible criteria – Improved quality
– Lower cost
– Strategic
– Feasibility
– Repeatability (i.e. volume)
– Contribution to meeting Standards/Accreditation
– Measurable
– Scope or span across division
– Risk
– Impact
– Others?

Visit our website: www.doh.wa.gov/PHIP/perfmgtcenters
Public Health Performance Management Centers for Excellence
80
Criteria Matrix Tool
Importance Control Hi Risk Hi
Vol
Prob. Pron
e
Total points
Improvement Area
HI (3)
MED (2)
LOW (1)
HI (3)
MED (2)
LOW (1)
(1) (1) (1)
1. Vaccines X X X 6
2. Engage Community
X X X 5
3. CHIP X X X 6
4. Food Safety X X X X 7
5. Family Planning
X X X X 5

Visit our website: www.doh.wa.gov/PHIP/perfmgtcenters
Public Health Performance Management Centers for Excellence
Example courtesy of Kittitas County Public Health

Visit our website: www.doh.wa.gov/PHIP/perfmgtcenters
Public Health Performance Management Centers for Excellence
82
• Full analytical criteria method – Smaller teams
– Few options
– Relatively few criteria
– Complete consensus needed
– Stakes are high if plan fails
• Consensus criteria method – Larger teams
– Options are many
– Significant number of criteria
– Quick consensus needed
• Combination – Interrelationships among the options are high
– Finding option with greatest impact critical
PH Memory Jogger, pgs. 105- 115
Visit our website: www.doh.wa.gov/PHIP/perfmgtcenters
Public Health Performance Management Centers for Excellence
83
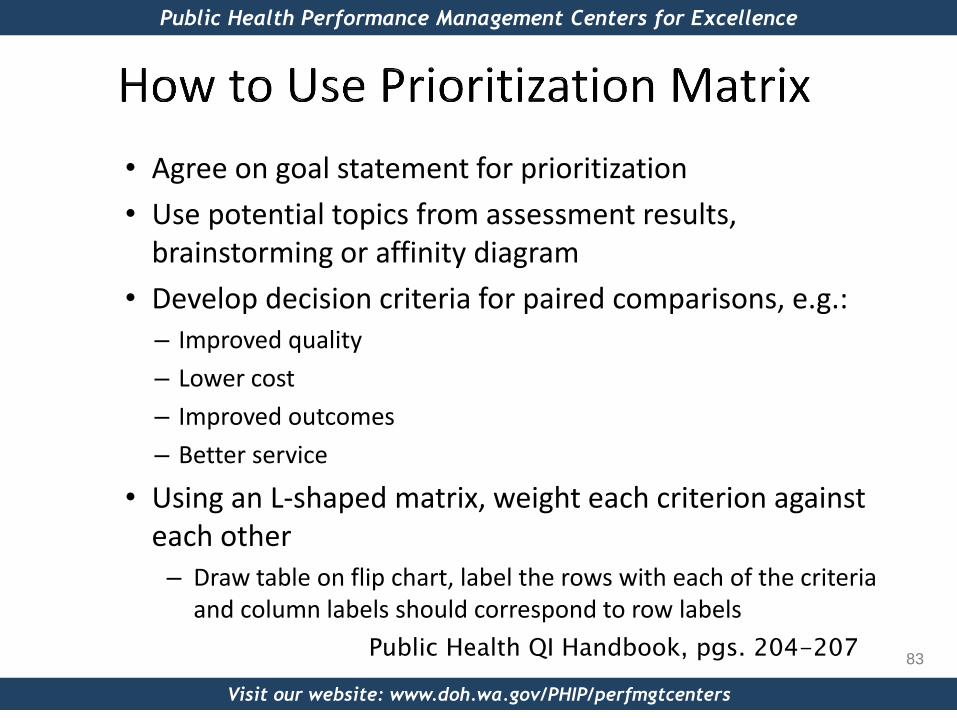
• Agree on goal statement for prioritization
• Use potential topics from assessment results, brainstorming or affinity diagram
• Develop decision criteria for paired comparisons, e.g.: – Improved quality
– Lower cost
– Improved outcomes
– Better service
• Using an L-shaped matrix, weight each criterion against each other
– Draw table on flip chart, label the rows with each of the criteria and column labels should correspond to row labels
Public Health QI Handbook, pgs. 204-207

Visit our website: www.doh.wa.gov/PHIP/perfmgtcenters
Public Health Performance Management Centers for Excellence
84
• Compare ALL options relative to each weighted criterion Take topics/issues and ask: – Does X contribute more than Y in achieving the goal, based on our
criteria? • Once you have agreement on the answer, then decide how much:
– 1 = Equally important – 5= More important – 10= Much more important – 1/5 Less important – 1/10= Much less important
• Assign agreed-upon value to the issue contributing more and the reciprocal score to the other
• Total the option scores • Create one last matrix, compare each option based on all criteria
combined – Multiply the criteria weighting by the option scores for each cell – Sum across
• Choose best option across all criteria

Visit our website: www.doh.wa.gov/PHIP/perfmgtcenters
Public Health Performance Management Centers for Excellence
1. Health Data
2. Engage Commu.
3. CHIP
4. QI Plan
5. Research Processes
Row Total
1. Health Data
5 1 5 10 21
2. Engage Community
1/5 1 5 10 16.2
3. CHIP 1 1 5 10 17
4. QI Plan 1/5 1/5 1/5 5 5.6
5. Research Processes
1/10 1/10 1/10 1/5 0.5

Visit our website: www.doh.wa.gov/PHIP/perfmgtcenters
Public Health Performance Management Centers for Excellence
86
QIG (Quality Improvement Geek)

Visit our website: www.doh.wa.gov/PHIP/perfmgtcenters
You might be a QIG if…
87
• Your colleagues says, “It’s [missing data] messing up my run chart!” and you are totally sympathetic.
• You celebrate your first histogram with a glass of wine.
• You wake up excited for a Quality Council meeting.
• You use a prioritization matrix to help you decide what car to buy.

Visit our website: www.doh.wa.gov/PHIP/perfmgtcenters
• Background
Family of four
Two kids in car seats
Have two-seater stroller
Like to go camping
We’re not rich!
88

Visit our website: www.doh.wa.gov/PHIP/perfmgtcenters
Public Health Performance Management Centers for Excellence
89
1. Agree on goal statement – Choose the best car to purchase for my family.
2. Create list of criteria – Cool factor
– Space
– MPG
– Tow capacity
3. Using an L-shaped matrix, weight each criterion against each other

Visit our website: www.doh.wa.gov/PHIP/perfmgtcenters
Public Health Performance Management Centers for Excellence
90
Criteria
Criteria
Cool factor
Space MPG Tow capacity
Row Total
Relative Decimal
Value
Cool factor
1/10 1/5 1/5 .5 .01
Space 10 1 5 5 20 .61
MPG 5 1/5 1 6.2 .19
Tow capacity
5 1/5 1 6.2 .19
32.9 1.0
Car Exercise - Criterion vs. Criterion
1 = Equally important 5 = More important 10 = Much more
important 1/5 = Less important 1/10 = Much less
important
Grand
Total

Visit our website: www.doh.wa.gov/PHIP/perfmgtcenters
Public Health Performance Management Centers for Excellence
91
4. Compare ALL options relative to each weighted criterion – There will be as many options matrices as there are criteria to be
applied
– In this example, we are considering the relative merits of the Chevy Suburban, the Dodge Caravan, and the Mini Cooper
– Use same rating scale but customize the wording for each criteria
1 = Equally … 5 = More … 10 = Much more … 1/5 = Less… 1/10 = Much less…

Visit our website: www.doh.wa.gov/PHIP/perfmgtcenters
Public Health Performance Management Centers for Excellence
92
Cool
Chevy Suburban
Dodge Caravan
Mini Cooper
Row Total Relative Decimal
Value (weight)
Chevy Suburban
Dodge Caravan
Mini Cooper
1.0
Car Exercise - Option vs. “Cool” Criterion
1 = Equally cool 5 = More cool 10 = Much more cool 1/5 = Less cool 1/10 = Much less cool
Grand
Total

Visit our website: www.doh.wa.gov/PHIP/perfmgtcenters
Public Health Performance Management Centers for Excellence
93
Tow Capacity
Chevy Suburban
Dodge Caravan
Mini Cooper
Row Total Relative Decimal Value (weight)
Chevy Suburban
Dodge Caravan
Mini Cooper
Car Exercise - Option vs. “Space” Criterion
1 = Equal space 5 = More space 10 = Much more space 1/5 = Less space 1/10 = Much less space
Grand
Total
Space
Chevy Suburban
Dodge Caravan
Mini Cooper
Row Total Relative Decimal
Value (weight)
Chevy Suburban
5 10 15 .59
Dodge Caravan
1/5 10 10.2 .40
Mini Cooper
1/10 1/10 .2 .01
25.4 1.0

Visit our website: www.doh.wa.gov/PHIP/perfmgtcenters
Public Health Performance Management Centers for Excellence
94
Tow Capacity
Chevy Suburban
Dodge Caravan
Mini Cooper
Row Total Relative Decimal Value (weight)
Chevy Suburban
Dodge Caravan
Mini Cooper
Car Exercise - Option vs. “MPG” Criterion
1 = Equal MPG 5 = More MPG 10 = Much more MPG 1/5 = Less MPG 1/10 = Much less MPG
Grand
Total
MPG
Chevy Suburban
Dodge Caravan
Mini Cooper
Row Total Relative Decimal
Value (weight)
Chevy Suburban
1
1/10 1/10 .2 .01
Dodge Caravan
10 1/5 10.2 .40
Mini Cooper
10 5 15 .59
25.4
1.0

Visit our website: www.doh.wa.gov/PHIP/perfmgtcenters
Public Health Performance Management Centers for Excellence
95
Tow Capacity
Chevy Suburban
Dodge Caravan
Mini Cooper
Row Total Relative Decimal Value (weight)
Chevy Suburban
Dodge Caravan
Mini Cooper
Car Exercise - Option vs. “Tow Capacity” Criterion
1 = Equally capable or towing
5 = More capable of towing 10 = Much more capable of
towing 1/5 = Less capable of
towing 1/10 = Much less capable
of towing Grand
Total
Tow
Chevy Suburban
Dodge Caravan
Mini Cooper
Row Total Relative Decimal
Value (weight)
Chevy Suburban
5 10 15 .73
Dodge Caravan
1/5 5 5.2 .25
Mini Cooper
1/10 1/5 .3 .02
20.5 1.0

Visit our website: www.doh.wa.gov/PHIP/perfmgtcenters
Public Health Performance Management Centers for Excellence
96
5. Using an L-shaped summary matrix, compare each option based on all criteria combined – List criteria horizontally in the first column and options vertically
in the first row
– For each cell in the matrix, multiply the option rating by the criteria weight. This creates an option score
– Add each option score across all criteria for a row total
6. Choose the best option

Visit our website: www.doh.wa.gov/PHIP/perfmgtcenters
Public Health Performance Management Centers for Excellence
97
Criteria
Options
Cool factor (weight)
Space (weight)
MPG (weight)
Tow capacity (weight)
Row Total
Chevy Suburban
(option rating X .01) =
(.59 X .61) =
.36 (.01 X .19) =
.00 (.73 X .19) =
.14
Dodge Caravan
(option rating X .01) =
(.40 X .61) =
.24 (.40 X .19) =
.08 (.25 X .19) =
.05
Mini Cooper (option rating .01) =
(.01 X .61) =
.01 (.59 X .19) =
.11 (.02 X .19) =
.00
Car Exercise - Summary Matrix
Grand
Total
For each
cell in
summary
matrix,
multiply the
option rating
by the
criteria
weight

Visit our website: www.doh.wa.gov/PHIP/perfmgtcenters
Public Health Performance Management Centers for Excellence
98
• Set the stage for prioritization – Role of our Quality Council
– Developed and reviewed process for completion of QM projects
• Assessed for potential quality improvement projects – Aggregate customer satisfaction data
– Logic model reviews and division reports
– Performance measure data
– Accreditation findings and recommendations
– Strategic planning goal group progress
• Used the Quality Council’s discussion board to generate QI project ideas
Visit our website: www.doh.wa.gov/PHIP/perfmgtcenters
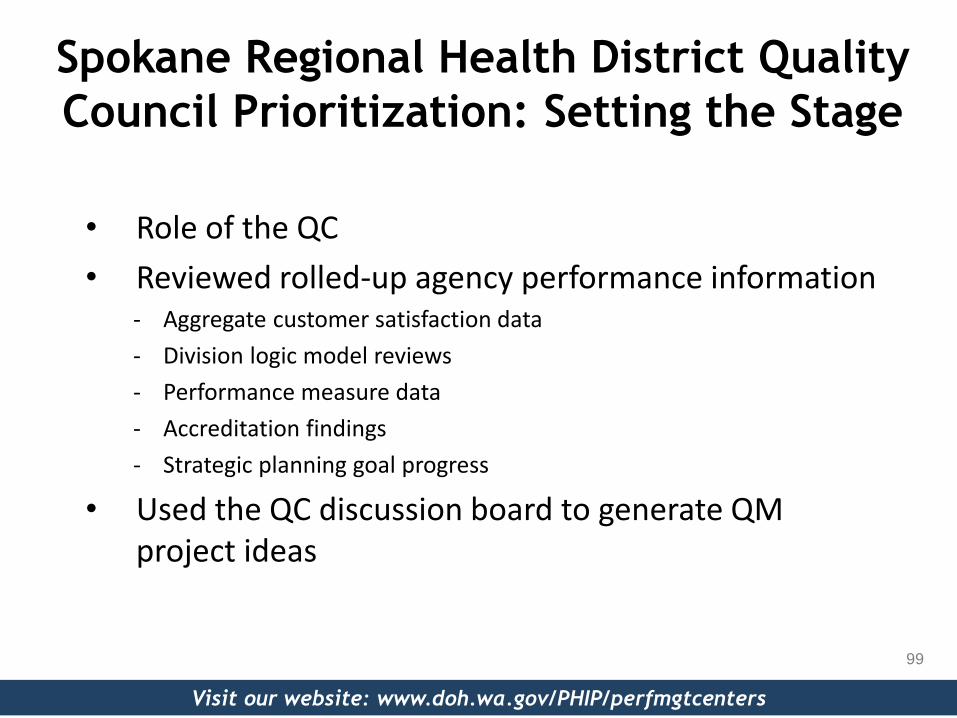
Spokane Regional Health District Quality
Council Prioritization: Setting the Stage
• Role of the QC
• Reviewed rolled-up agency performance information - Aggregate customer satisfaction data
- Division logic model reviews
- Performance measure data
- Accreditation findings
- Strategic planning goal progress
• Used the QC discussion board to generate QM project ideas
99

Visit our website: www.doh.wa.gov/PHIP/perfmgtcenters
Spokane Regional Health District Quality
Council Prioritization Exercise
Process
1. Review ground rules
2. Agree on goal statement
3. Review and gain consensus on list of decision criteria and their definitions
4. Assign weighting to criteria reaching consensus using a prioritization matrice
5. Review QM opportunities – eliminate as needed
6. Independently ranking each Quality Management Opportunity (using a SurveyMonkey survey)
7. Co-chairs to tabulate results
8. Results reported out via discussion board with opportunity for comment
9. Process and outcome debrief at August QC meeting
10. Final recommendation to Executive Leadership Team
https://www.surveymonkey.com/s/VZGSJXQ
100

Visit our website: www.doh.wa.gov/PHIP/perfmgtcenters
101
Example courtesy of Spokane Regional Health District

Example courtesy of Spokane Regional Health District

Visit our website: www.doh.wa.gov/PHIP/perfmgtcenters
Polling Scenario
A. High level
B. Matrix flow (swim
lane/functional)
C. Value stream
mapping
D. Detailed
103
Scenario: You are
developing a new
process for IT help-desk
work assignments.
Question: What type of
flow chart would you
use?
103

Visit our website: www.doh.wa.gov/PHIP/perfmgtcenters
Polling Scenario
A. High level
B. Matrix flow (swim
lane/functional)
C. Value stream
mapping
D. Detailed
104
Scenario: Program
managers have
complained to the HR
department that it takes
too long to process new
hires after accepting a
job offer.
Question: What type of
flow chart would you
use?
104

Visit our website: www.doh.wa.gov/PHIP/perfmgtcenters
Polling Scenario
A. Prioritization
matrix
B. High level flow
chart
C. Lean 5S
D. Cause & Effect
105
Scenario: The maintenance
manager at the health
department is working on a QI
project to reduce supply
(cleaning and maintenance)
costs of the agency. Through
their Analysis phase, they
learned that a great deal of
different supplies get ordered by
different programs, that then sit
on the supply shelves, taking up
limited space, and then get
thrown out unused or hardly
used when they expire.
Question: What might be one of
the tools they use in the next
phase of their project? Why? 105

Visit our website: www.doh.wa.gov/PHIP/perfmgtcenters
Polling Scenario
A. Logic model
B. Control &
Influence
C. Prioritization
matrix
D. Cause & Effect
106
Scenario: The Wellness
committee at Any County Public
Health is conducting a QI
process to increase the level of
physical activity of staff. They
are getting ready to pilot (test
and evaluate) one of the
following interventions among 2
programs to get some quick
feedback before rolling out to
agency next week: onsite yoga
class, pedometer loan program,
discounted gym membership,
agency softball team.
Question: What might be one of
the tools they use in the next
phase of their project? Why?

Visit our website: www.doh.wa.gov/PHIP/perfmgtcenters
Public Health Performance Management Centers for Excellence
107
107
• Performance Management Centers for Excellence Web site: www.doh.wa.gov/PHIP/perfmgmtcenters
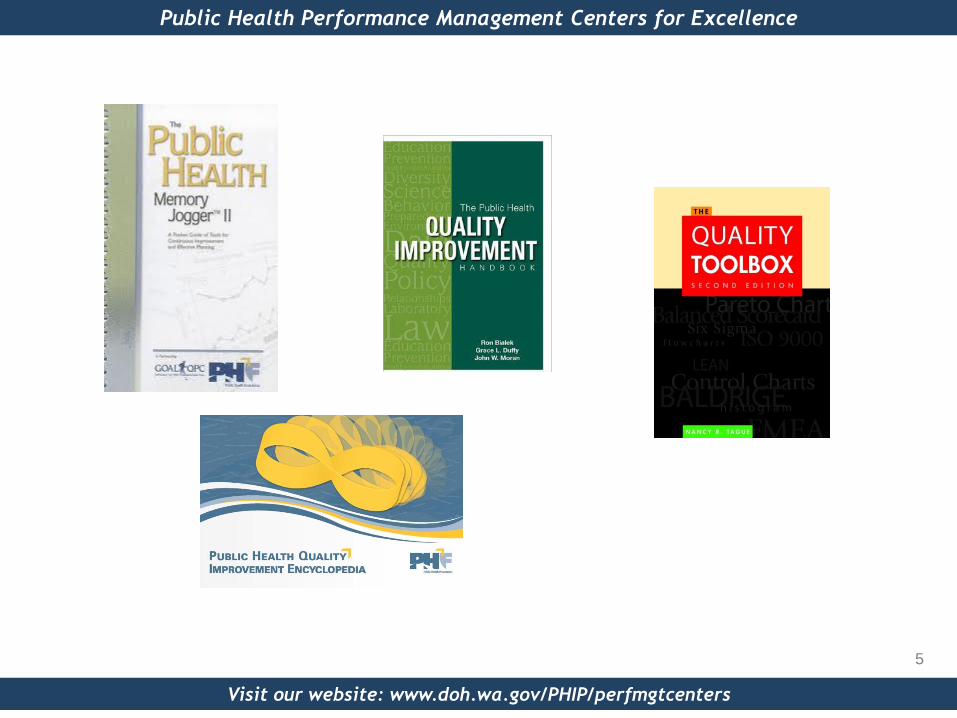
• Public Health Memory Jogger, GOAL/QPC, 2007, www.goalqpc.com
• The Public Health Quality Improvement Handbook, Bialek R, Duffy DL, Moran JW Milwaukee, WI: ASQ Quality Press; 2009
• The Improvement Guide, Langley et al. Jossey-Bass; 1996.
• Quality Toolbox, Tague, N., Milwaukee, WI: ASQ Quality Press; 2005
• Public Health Quality Improvement Encyclopedia, Kyle, E, Public Health Foundation; 2012 http://www.phf.org/news/Pages/Now_Available_Public_Health_Quality_Improvement_Encyclopedia.aspx
Additional Resources

Visit our website: www.doh.wa.gov/PHIP/perfmgtcenters
THANKS FOR YOUR PARTICIPATION! Please complete the evaluation you
receive via email.
Join us Next Time:
September 9, 2013
Performance Measures in Quality
Improvement
The contents of this presentation were selected by the author and
do not necessarily represent the official position of or endorsement
by the Centers for Disease Control and Prevention. 108

Visit our website: www.doh.wa.gov/PHIP/perfmgtcenters
Public Health Performance Management Centers for Excellence
109
What questions do you have?