problems in the comparability and harmonization of measures of community size in issp surveys
DESCRIPTION
Problems in the Comparability and Harmonization of Measures of Community Size in ISSP Surveys. Michael L. Smith, Ph.D. Institute of Sociology, Academy of Sciences of the Czech Republic. Overview. URBRURAL and NAT_SIZE: what are they supposed to measure and why are they important? - PowerPoint PPT PresentationTRANSCRIPT

Problems in the Comparability and Harmonization of Measures
of Community Size in ISSP Surveys
Michael L. Smith, Ph.D.
Institute of Sociology,
Academy of Sciences of the Czech Republic

Overview
• URBRURAL and NAT_SIZE: what are they supposed to measure and why are they important?
• Major problems in both questions• Cross-national analysis of association between
the variables: what can we learn?• Controlling for population composition, what
effect do they variables have on key dependent variables?
• Re-designing both questions: considerations for input and output harmonization
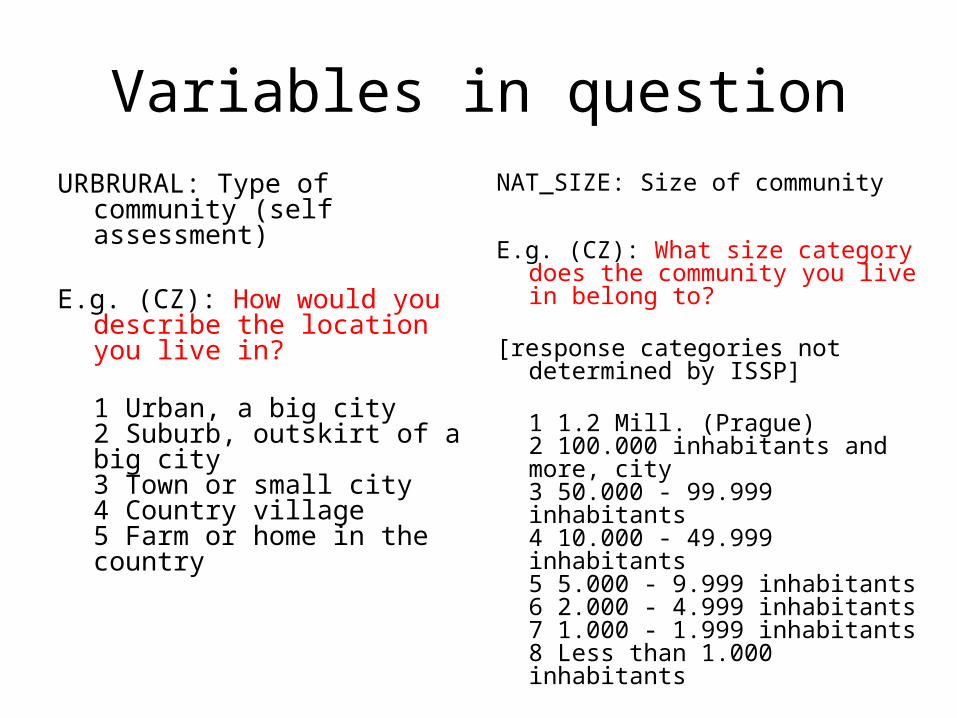
Variables in questionURBRURAL: Type of community
(self assessment)
E.g. (CZ): How would you describe the location you live in?
1 Urban, a big city2 Suburb, outskirt of a big city3 Town or small city4 Country village5 Farm or home in the country
NAT_SIZE: Size of community
E.g. (CZ): What size category does the community you live in belong to?
[response categories not determined by ISSP]
1 1.2 Mill. (Prague)2 100.000 inhabitants and more, city3 50.000 - 99.999 inhabitants4 10.000 - 49.999 inhabitants5 5.000 - 9.999 inhabitants6 2.000 - 4.999 inhabitants7 1.000 - 1.999 inhabitants8 Less than 1.000 inhabitants
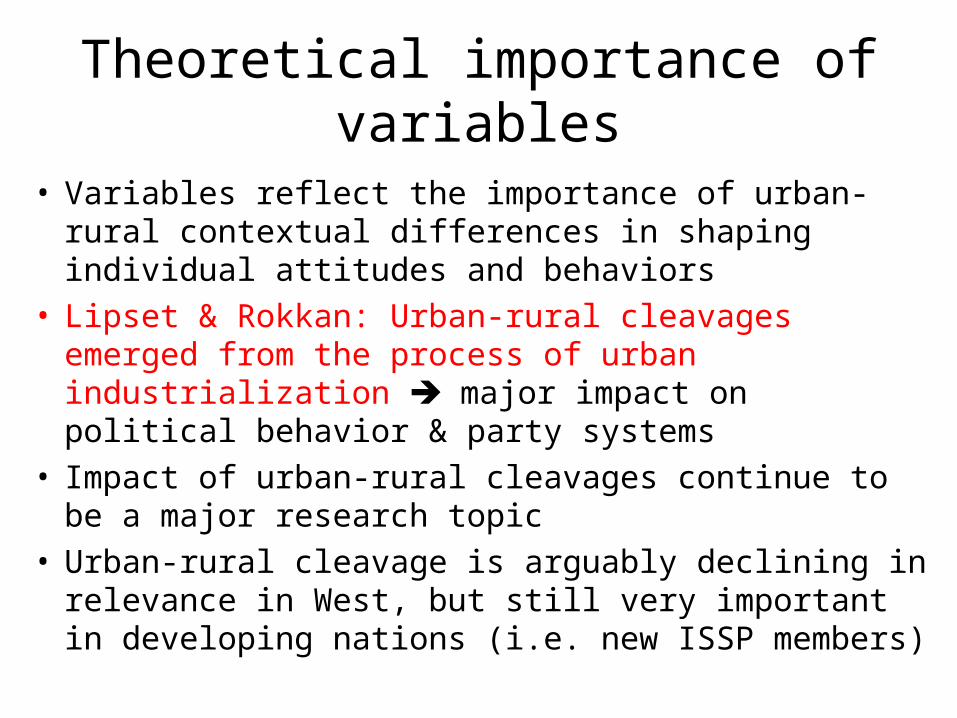
Theoretical importance of variables
• Variables reflect the importance of urban-rural contextual differences in shaping individual attitudes and behaviors
• Lipset & Rokkan: Urban-rural cleavages emerged from the process of urban industrialization major impact on political behavior & party systems
• Impact of urban-rural cleavages continue to be a major research topic
• Urban-rural cleavage is arguably declining in relevance in West, but still very important in developing nations (i.e. new ISSP members)
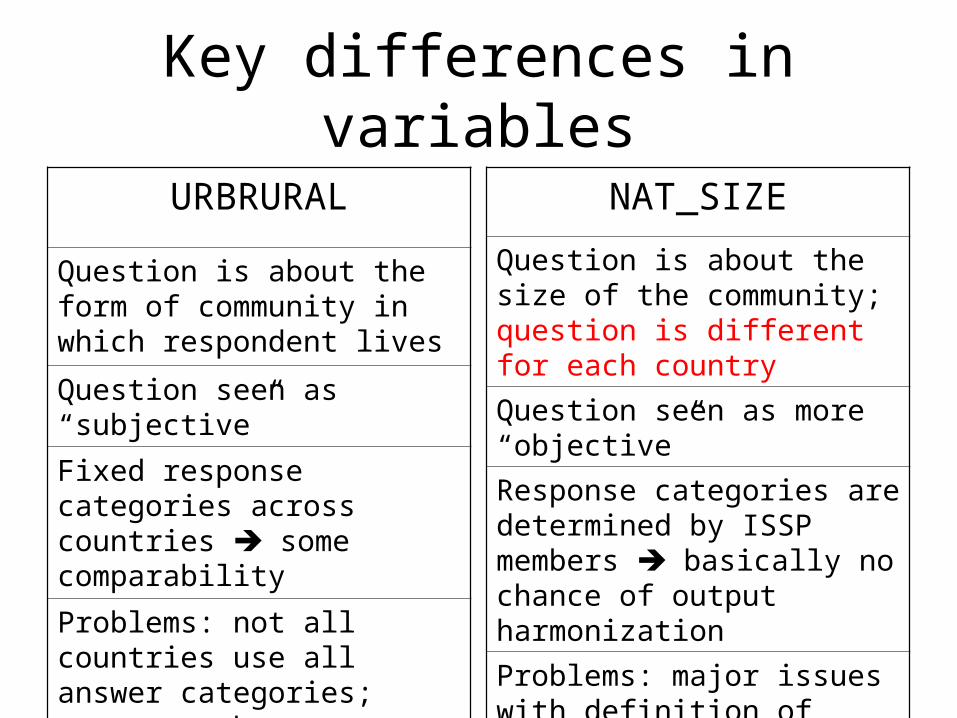
Key differences in variables
URBRURAL
Question is about the form of community in which respondent lives
Question seen as “subjective”
Fixed response categories across countries some comparability
Problems: not all countries use all answer categories; concerns about translatability
NAT_SIZE
Question is about the size of the community; question is different for each country
Question seen as more “objective”
Response categories are determined by ISSP members basically no chance of output harmonization
Problems: major issues with definition of community; no standardized response, etc.
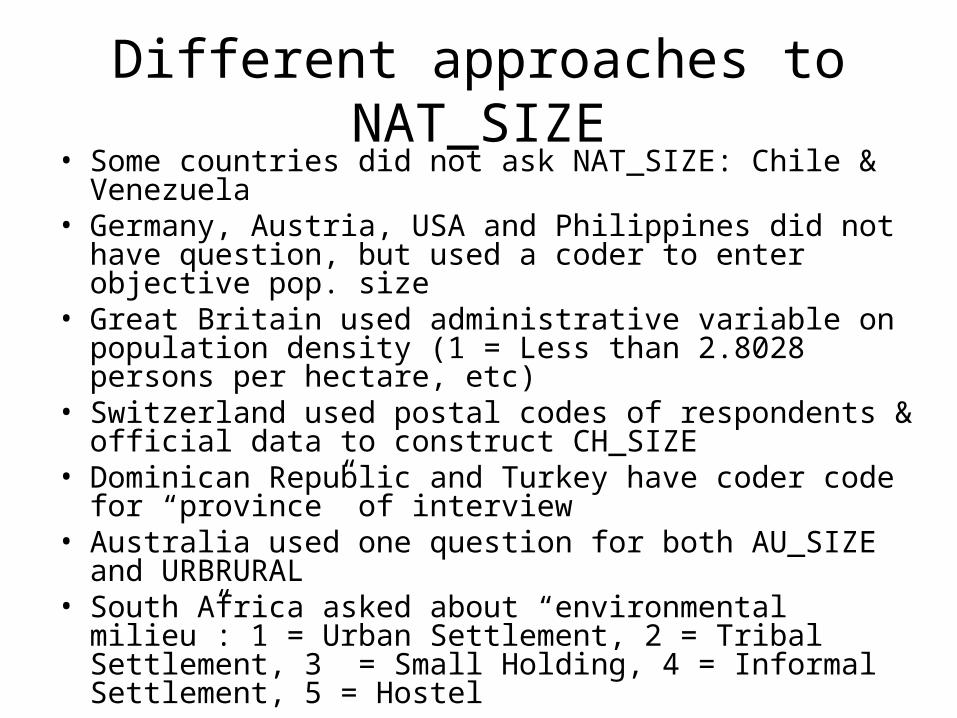
Different approaches to NAT_SIZE• Some countries did not ask NAT_SIZE: Chile &
Venezuela• Germany, Austria, USA and Philippines did not have
question, but used a coder to enter objective pop. size • Great Britain used administrative variable on population
density (1 = Less than 2.8028 persons per hectare, etc)• Switzerland used postal codes of respondents & official
data to construct CH_SIZE • Dominican Republic and Turkey have coder code for
“province” of interview• Australia used one question for both AU_SIZE and
URBRURAL• South Africa asked about “environmental milieu”: 1 =
Urban Settlement, 2 = Tribal Settlement, 3 = Small Holding, 4 = Informal Settlement, 5 = Hostel
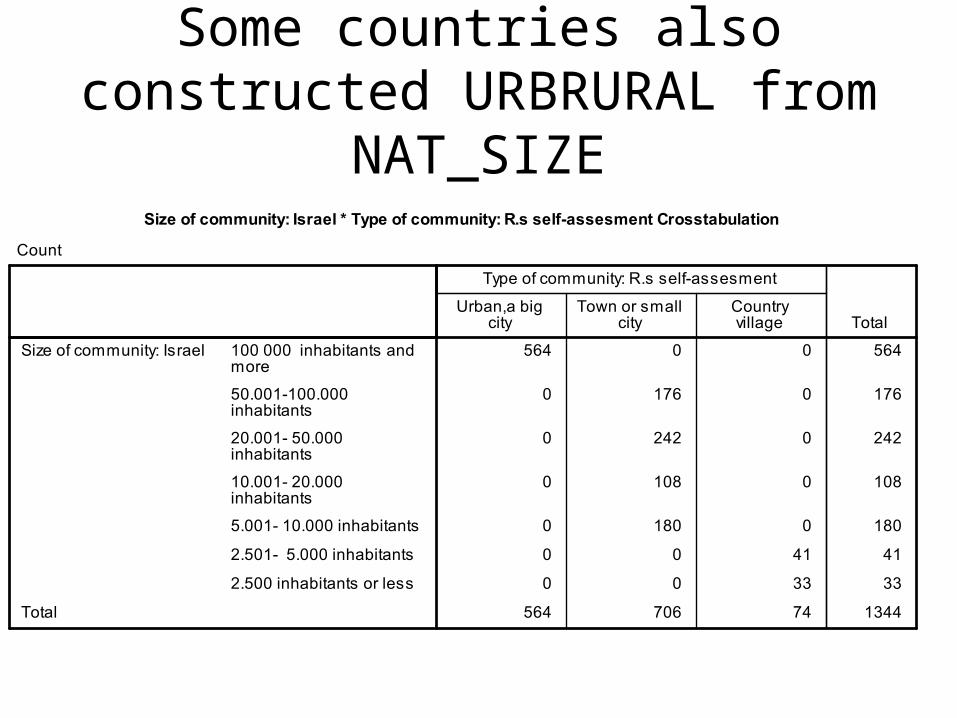
Some countries also constructed URBRURAL from NAT_SIZE
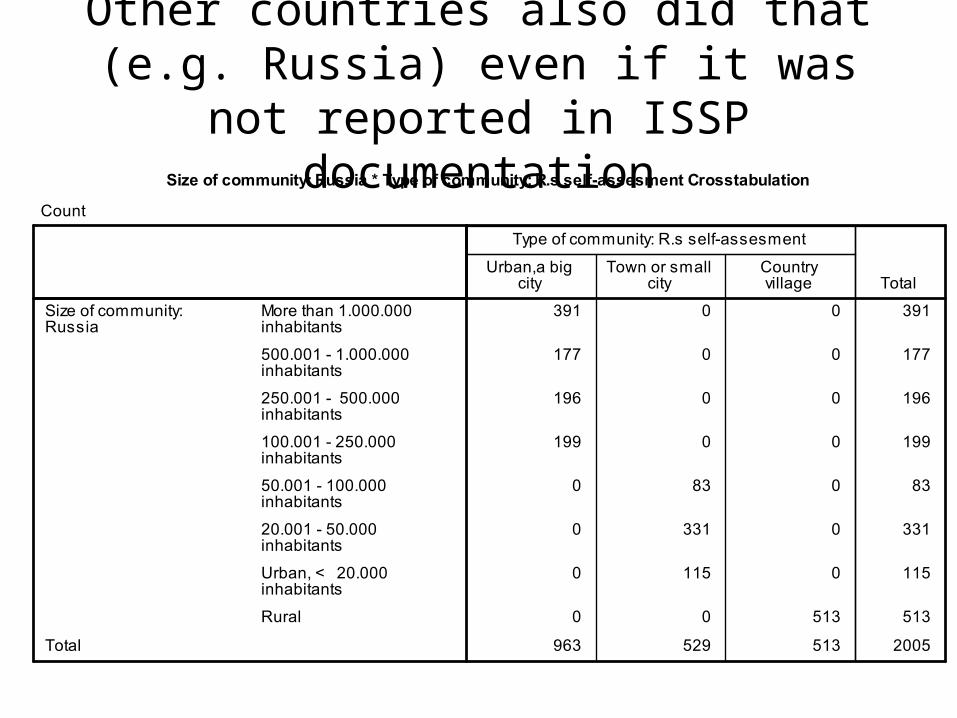
Other countries also did that (e.g. Russia) even if it was not reported in ISSP
documentation

Debate in ISSP
• ISSP Demographics & Methods Group:– In 2008, DMG raised concerns that the questions are
too subjective, and do not adequately reflect the geographic / territorial context of respondents
– DMG raised concerns over the predictive value of the variables
– DMG suggested dropping both variables
• ISSP General Meeting, Vienna 2008:– Members voted 26 to 3 to keep URBRURAL– Members voted 18 to 11 to drop NAT_SIZE, and is
no longer a required demographics variable in ISSP
Assessing URBRURAL and NAT_SIZE from the bottom up
• Data and methods:
– Followed approach of Prof. Christof Wolf (GESIS) in his excellent analysis of the variables for Germany (prior to ISSP 2009 meeting) replication for other countries
– First, analysis of variance between URBRURAL and NAT_SIZE for each country: good measurement should lead to consistent associations between variables across years
– Second, multiple classification analyses of URBRURAL and NAT_SIZE on a range of dependent variables in ISSP 2008 and ISSP 2007 in different countries (also controlling for education, sex and age), as a way to assess the significance of the variables across countries
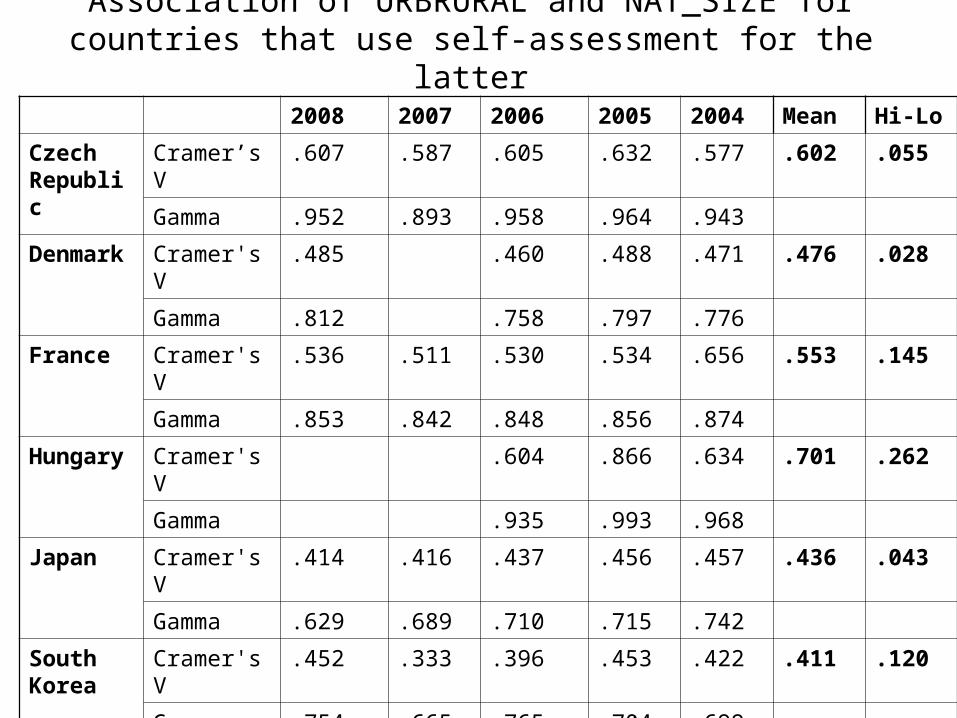
Association of URBRURAL and NAT_SIZE for countries that use self-assessment for the latter
2008 2007 2006 2005 2004 Mean Hi-Lo
Czech Republic
Cramer’s V .607 .587 .605 .632 .577 .602 .055
Gamma .952 .893 .958 .964 .943
Denmark Cramer's V .485 .460 .488 .471 .476 .028
Gamma .812 .758 .797 .776
France Cramer's V .536 .511 .530 .534 .656 .553 .145
Gamma .853 .842 .848 .856 .874
Hungary Cramer's V .604 .866 .634 .701 .262
Gamma .935 .993 .968
Japan Cramer's V .414 .416 .437 .456 .457 .436 .043
Gamma .629 .689 .710 .715 .742
South Korea
Cramer's V .452 .333 .396 .453 .422 .411 .120
Gamma .754 .665 .765 .704 .699
New Zealand
Cramer's V .607 .614 .615 .644 .625 .621 .037
Gamma .867 .852 .844 .881 .885
Slovenia Cramer's V .569 .605 .665 .633 .618 .096
Gamma .927 .869 .967 .872

Association of URBRURAL and NAT_SIZE for countries that treat the latter as an administrative variable
2008 2007 2006 2005 2004 Mean Hi-Lo
Finland Cramer’s V .440 .460 .458 .467 .437 .452 .030
Gamma .769 .793 .796 .777 .736
Germany Cramer's V .541 .533 .561 .544 .493 .534 .068
Gamma .868 .878 .877 .843 .818
Ireland Cramer's V .696 .763 .761 .740 .067
Gamma .904 .904 .925
Mexico Cramer's V .478 .420 .492 .463 .072
Gamma .753 .771 .799
Norway Cramer's V .491 .487 .492 .473 .477 .484 .019
Gamma .821 .807 .826 .791 .783
Sweden Cramer's V .398 .403 .409 .409 .411 .406 .013
Gamma .611 .634 .619 .625 .625
Taiwan Cramer's V .466 .444 .504 .419 .445 .456 .085
Gamma .776 .778 .819 .773 .806
USA Cramer's V .535 .528 .542 .537 .536 .014
Gamma .739 .726 .737 .703

Key lesson from the analysis
• On the whole, ISSP members that treat NAT_SIZE as an administrative variable have more consistent data in terms of the association between NAT_SIZE and URBRURAL over time.
• ISSP members using self-assessment for NAT_SIZE tend to have higher degrees of association between the variables, probably due to bias of question order and suggestively phrased response categories. CZ case: – 1 = 1.200.000 inhabitants (Prague)– 2 = City with 100.000 inhabitants and more– 3 = 50.000-99.999 inhabitants, large city– 4 = 10.000-49.999 inhabitants, larger town– 5 = 5.000-9.999 inhabitants, small town– 6 = 2.000-4.999 inhabitants, larger village– 7 = 1.000-1.999 inhabitants, village– 8 = Village with less than 1.000 inhabitants
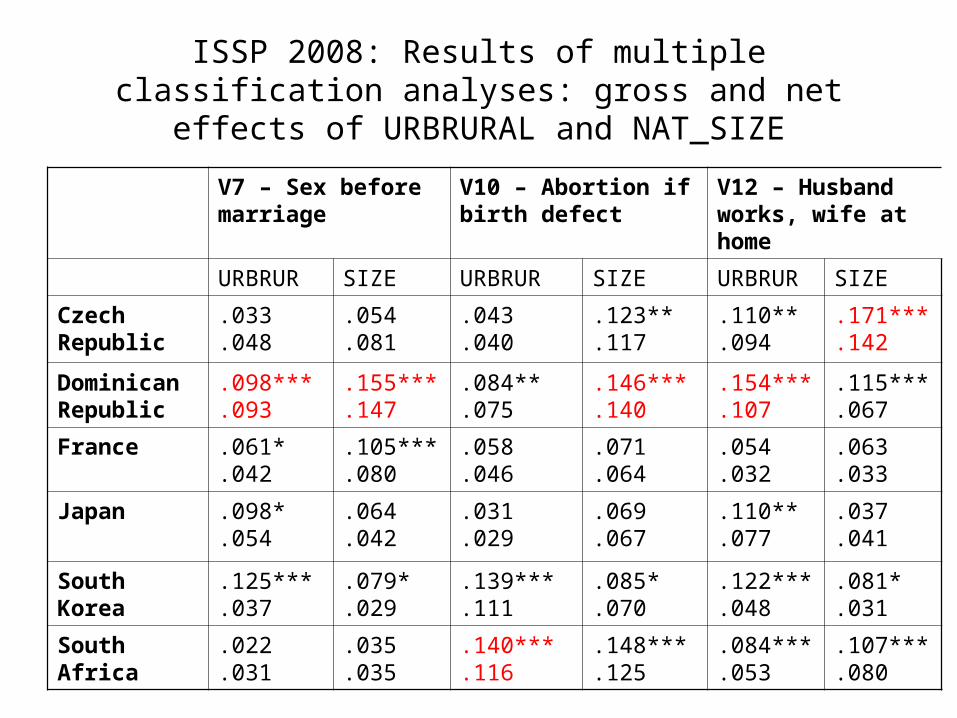
ISSP 2008: Results of multiple classification analyses: gross and net effects of URBRURAL and NAT_SIZE
V7 – Sex before marriage
V10 – Abortion if birth defect
V12 – Husband works, wife at home
URBRUR SIZE URBRUR SIZE URBRUR SIZE
Czech Republic
.033
.048.054.081
.043
.040.123**.117
.110**
.094.171***.142
Dominican Republic
.098***
.093.155***.147
.084**
.075.146***.140
.154***
.107.115***.067
France .061*.042
.105***
.080.058.046
.071
.064.054.032
.063
.033
Japan .098*.054
.064
.042.031.029
.069
.067.110**.077
.037
.041
South Korea .125***.037
.079*
.029.139***.111
.085*
.070.122***.048
.081*
.031
South Africa .022.031
.035
.035.140***.116
.148***
.125.084***.053
.107***
.080
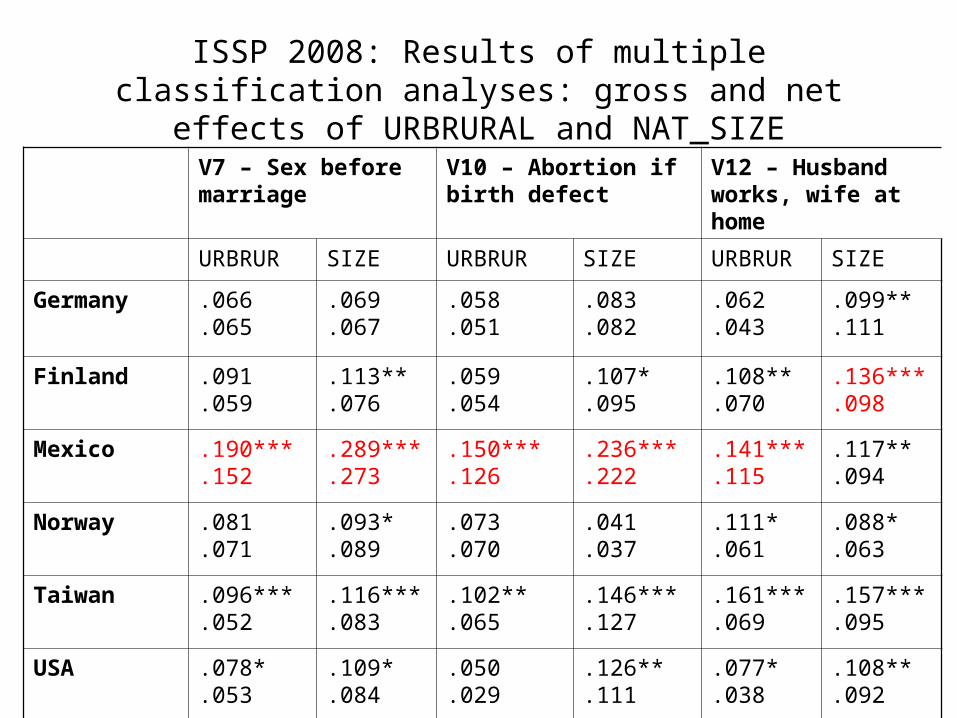
ISSP 2008: Results of multiple classification analyses: gross and net effects of URBRURAL and NAT_SIZE
V7 – Sex before marriage
V10 – Abortion if birth defect
V12 – Husband works, wife at home
URBRUR SIZE URBRUR SIZE URBRUR SIZE
Germany .066.065
.069
.067.058.051
.083
.082.062.043
.099**
.111
Finland .091.059
.113**
.076.059.054
.107*
.095.108**.070
.136***
.098
Mexico .190***.152
.289***
.273.150***.126
.236***
.222.141***.115
.117**
.094
Norway .081.071
.093*
.089.073.070
.041
.037.111*.061
.088*
.063
Taiwan .096***.052
.116***
.083.102**.065
.146***
.127.161***.069
.157***
.095
USA .078*.053
.109*
.084.050.029
.126**
.111.077*.038
.108**
.092
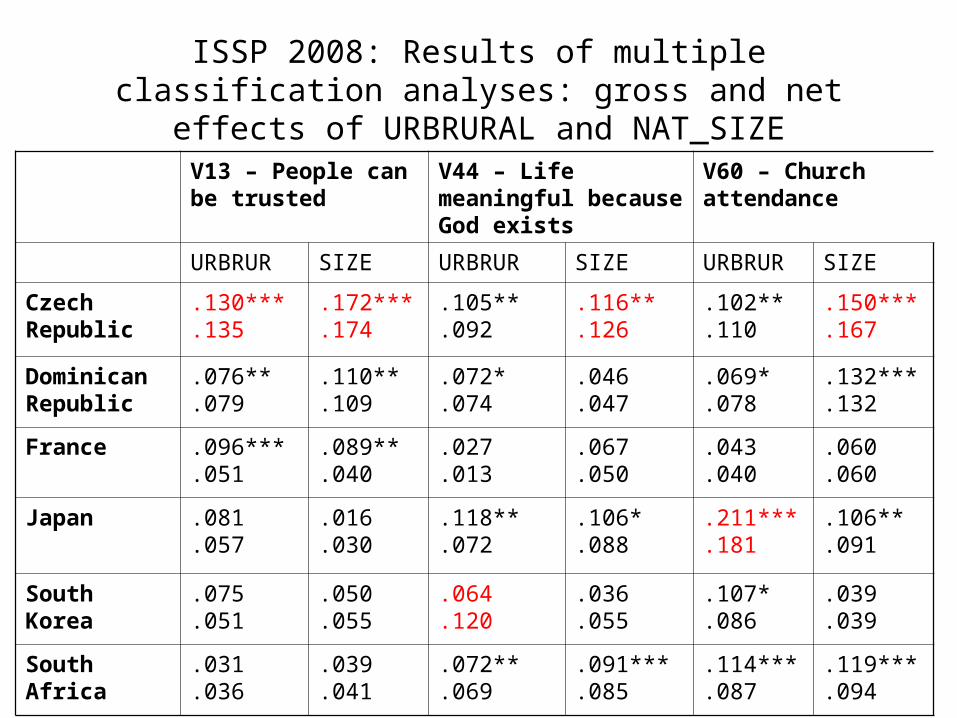
ISSP 2008: Results of multiple classification analyses: gross and net effects of URBRURAL and NAT_SIZE
V13 – People can be trusted
V44 – Life meaningful because God exists
V60 – Church attendance
URBRUR SIZE URBRUR SIZE URBRUR SIZE
Czech Republic
.130***
.135.172***.174
.105**
.092.116**.126
.102**
.110.150***.167
Dominican Republic
.076**
.079.110**.109
.072*
.074.046.047
.069*
.078.132***.132
France .096***.051
.089**
.040.027.013
.067
.050.043.040
.060
.060
Japan .081.057
.016
.030.118**.072
.106*
.088.211***.181
.106**
.091
South Korea .075.051
.050
.055.064.120
.036
.055.107*.086
.039
.039
South Africa .031.036
.039
.041.072**.069
.091***
.085.114***.087
.119***
.094
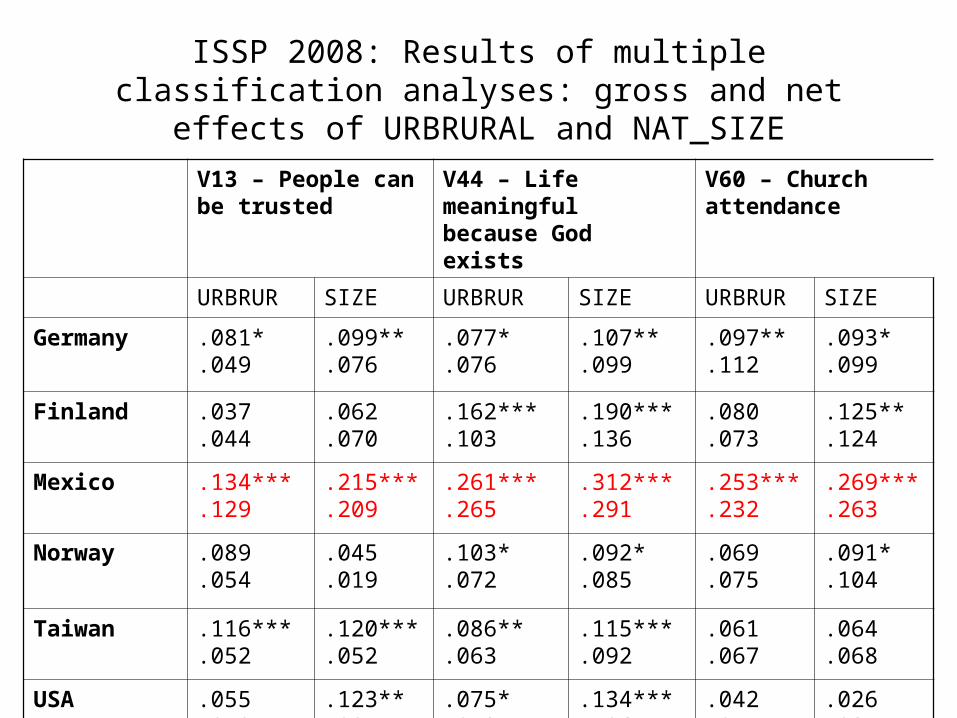
ISSP 2008: Results of multiple classification analyses: gross and net effects of URBRURAL and NAT_SIZE
V13 – People can be trusted
V44 – Life meaningful because God exists
V60 – Church attendance
URBRUR SIZE URBRUR SIZE URBRUR SIZE
Germany .081*.049
.099**
.076.077*.076
.107**
.099.097**.112
.093*
.099
Finland .037.044
.062
.070.162***.103
.190***
.136.080.073
.125**
.124
Mexico .134***.129
.215***
.209.261***.265
.312***
.291.253***.232
.269***
.263
Norway .089.054
.045
.019.103*.072
.092*
.085.069.075
.091*
.104
Taiwan .116***.052
.120***
.052.086**.063
.115***
.092.061.067
.064
.068
USA .055.019
.123**
.097.075*.052
.134***
.106.042.051
.026
.027
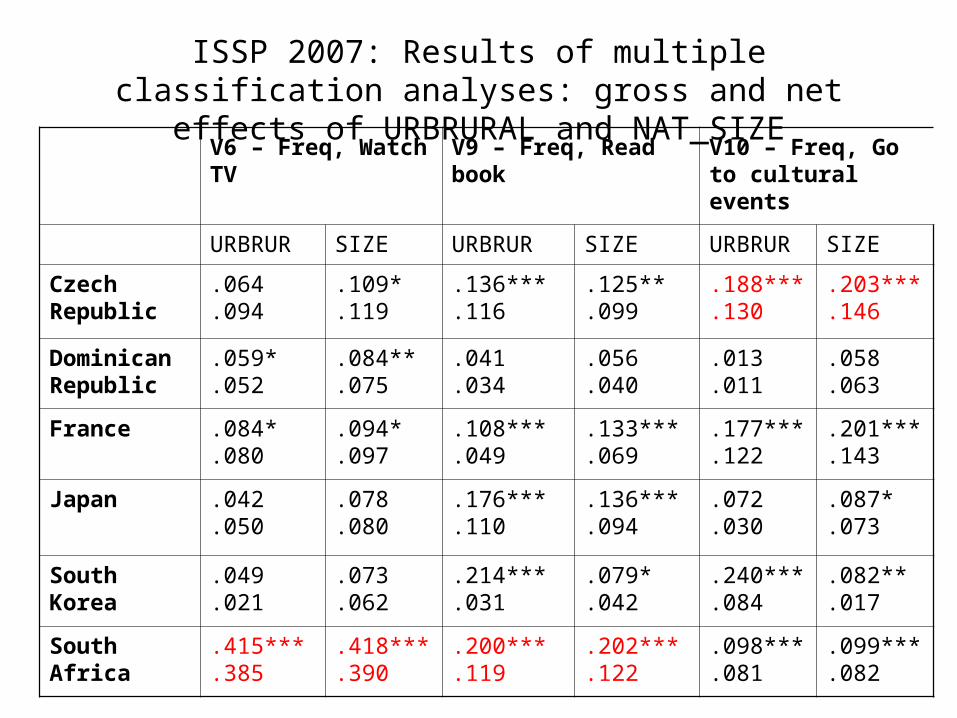
ISSP 2007: Results of multiple classification analyses: gross and net effects of URBRURAL and NAT_SIZE
V6 – Freq, Watch TV V9 – Freq, Read book V10 – Freq, Go to cultural events
URBRUR SIZE URBRUR SIZE URBRUR SIZE
Czech Republic
.064
.094.109*.119
.136***
.116.125**.099
.188***
.130.203***.146
Dominican Republic
.059*
.052.084**.075
.041
.034.056.040
.013
.011.058.063
France .084*.080
.094*
.097.108***.049
.133***
.069.177***.122
.201***
.143
Japan .042.050
.078
.080.176***.110
.136***
.094.072.030
.087*
.073
South Korea .049.021
.073
.062.214***.031
.079*
.042.240***.084
.082**
.017
South Africa .415***.385
.418***
.390.200***.119
.202***
.122.098***.081
.099***
.082
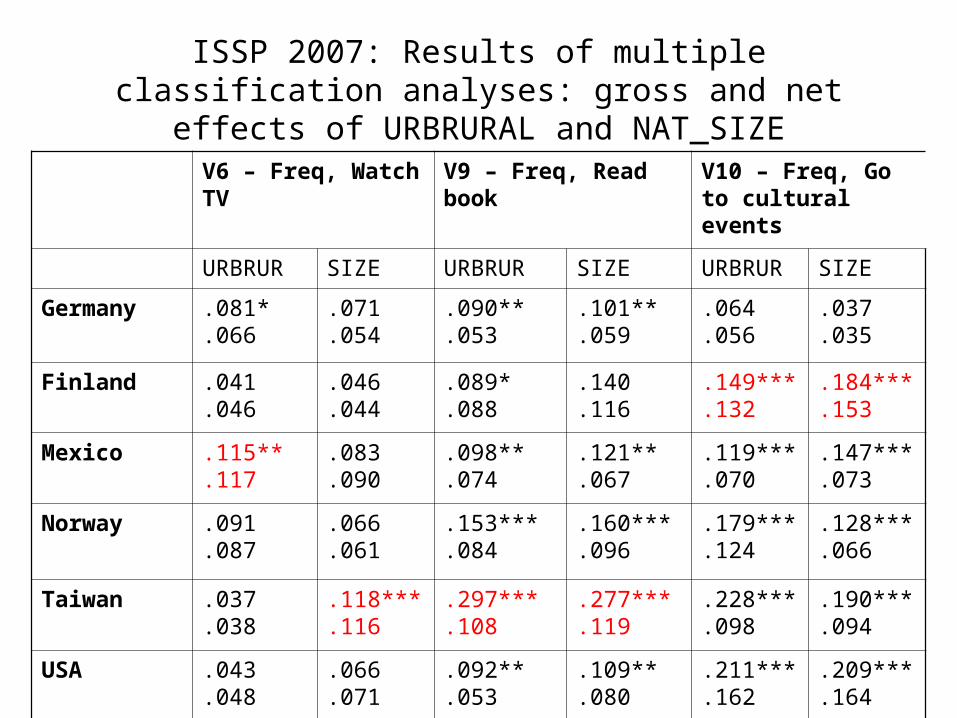
ISSP 2007: Results of multiple classification analyses: gross and net effects of URBRURAL and NAT_SIZE
V6 – Freq, Watch TV V9 – Freq, Read book V10 – Freq, Go to cultural events
URBRUR SIZE URBRUR SIZE URBRUR SIZE
Germany .081*.066
.071
.054.090**.053
.101**
.059.064.056
.037
.035
Finland .041.046
.046
.044.089*.088
.140
.116.149***.132
.184***
.153
Mexico .115**.117
.083
.090.098**.074
.121**
.067.119***.070
.147***
.073
Norway .091.087
.066
.061.153***.084
.160***
.096.179***.124
.128***
.066
Taiwan .037.038
.118***
.116.297***.108
.277***
.119.228***.098
.190***
.094
USA .043.048
.066
.071.092**.053
.109**
.080.211***.162
.209***
.164
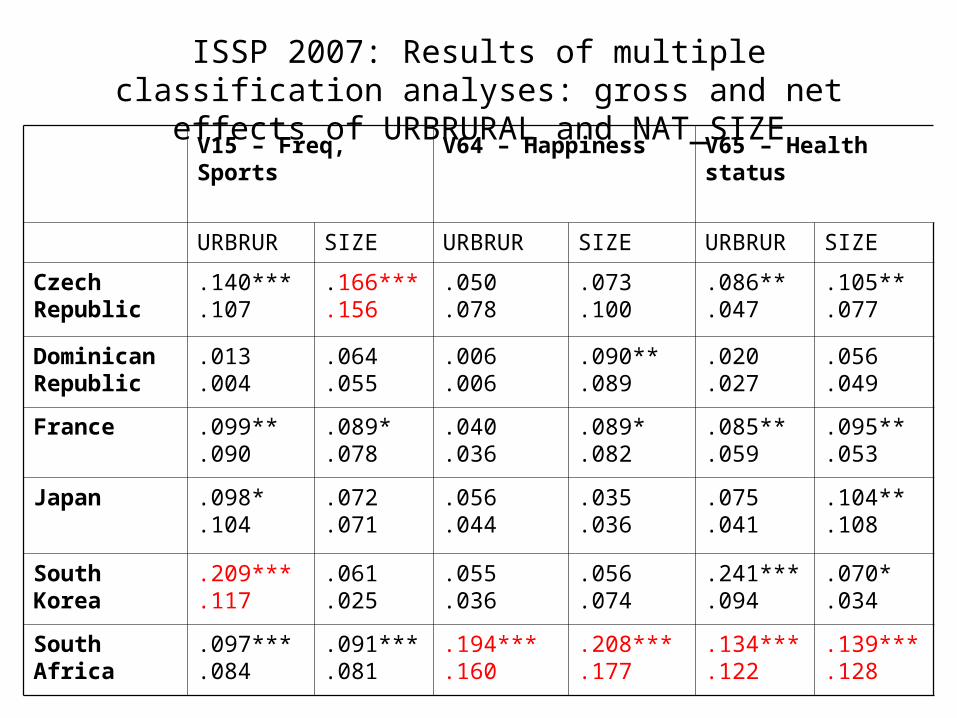
ISSP 2007: Results of multiple classification analyses: gross and net effects of URBRURAL and NAT_SIZE
V15 – Freq, Sports V64 – Happiness V65 – Health status
URBRUR SIZE URBRUR SIZE URBRUR SIZE
Czech Republic
.140***
.107.166***.156
.050
.078.073.100
.086**
.047.105**.077
Dominican Republic
.013
.004.064.055
.006
.006.090**.089
.020
.027.056.049
France .099**.090
.089*
.078.040.036
.089*
.082.085**.059
.095**
.053
Japan .098*.104
.072
.071.056.044
.035
.036.075.041
.104**
.108
South Korea .209***.117
.061
.025.055.036
.056
.074.241***.094
.070*
.034
South Africa .097***.084
.091***
.081.194***.160
.208***
.177.134***.122
.139***
.128
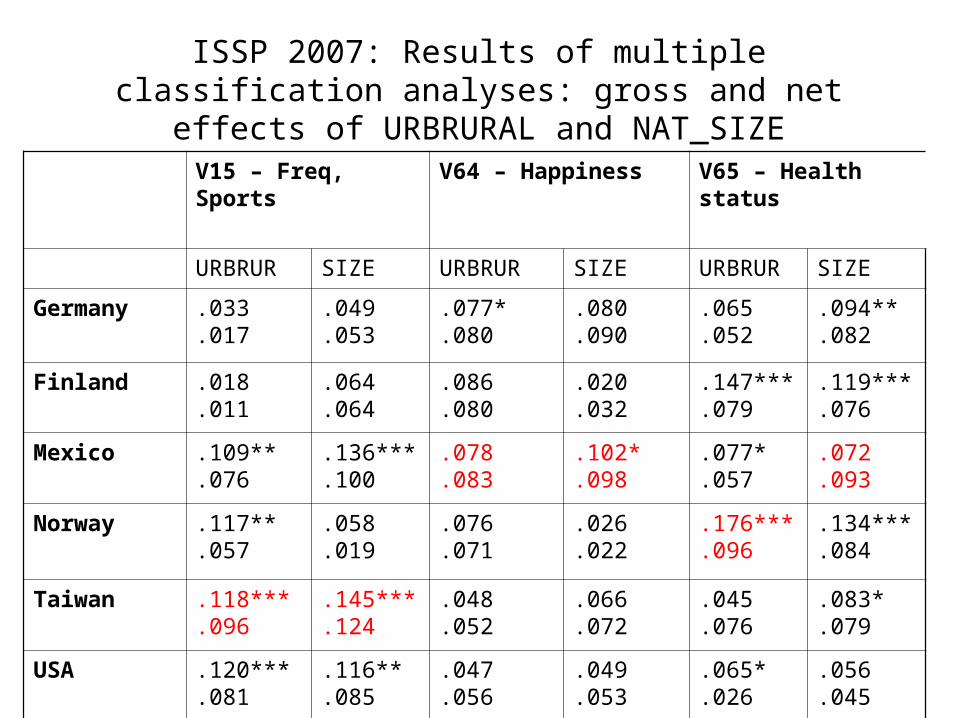
ISSP 2007: Results of multiple classification analyses: gross and net effects of URBRURAL and NAT_SIZE
V15 – Freq, Sports V64 – Happiness V65 – Health status
URBRUR SIZE URBRUR SIZE URBRUR SIZE
Germany .033.017
.049
.053.077*.080
.080
.090.065.052
.094**
.082
Finland .018.011
.064
.064.086.080
.020
.032.147***.079
.119***
.076
Mexico .109**.076
.136***
.100.078.083
.102*
.098.077*.057
.072
.093
Norway .117**.057
.058
.019.076.071
.026
.022.176***.096
.134***
.084
Taiwan .118***.096
.145***
.124.048.052
.066
.072.045.076
.083*
.079
USA .120***.081
.116**
.085.047.056
.049
.053.065*.026
.056
.045
Key lessons from the analysis
• Across a range of dependent variables, the urban-rural cleavage tends to be strongest in developing countries (Mexico, South Africa, Taiwan) and weakest in some of the Western countries
• In most cases examined, control variables reduce the effect of URBRURAL and NAT_SIZE on the margin, but do not eliminate their importance as explanatory variables
• Overall, the analysis has shown that these two variables continue to show strong effects in ISSP countries, and should remain in the ISSP demographics module.

Considerations for harmonization: URBRURAL
• There are many opportunities for cross-national analyses of urban-rural cleavages. But for those analyses to work, ISSP members must implement the full set of response categories (i.e. not reduce them)
• The question MUST be based on respondent self-assessment in all countries, without undue interference of the interviewer (the question should be “subjective” in all countries)
• The practice of computing responses based on NAT_SIZE (and vice-versa) must stop.
Considerations for harmonization:NAT_SIZE
• For the variable to be reintroduced into ISSP, it should be decided whether the question should be a demographic (respondent assessment) or an administrative variable
• The analysis above provides stronger support to the administrative variable option:– It is easier to monitor how the data is measured– It removes the “subjective” dimension of the question,
making it a pure objective demographic characteristic– It avoids potential problems 1) in bias due to question
order and 2) suggestive questions.
Considerations for harmonization:NAT_SIZE
• Some ISSP members will complain of the difficulty of collecting the data but in most cases, the fielding agency should be able to identify community size during the sampling frame
• To avoid problems in the identification of specific municipalities, response categories should still be used– Those response categories should be broad so that
they are appropriate for both countries with many small villages (France, Czech Rep.) but also for those with highly urban populations (Taiwan, Korea).
Considerations for harmonization:NAT_SIZE
• Lastly, we need to have a debate about what should be measured by NAT_SIZE:– The population of the territory of the local government
(municipality, commune, etc)? Or,– The population of the smallest distinct ‘settlement’ of
the respondent, regardless of whether or not it belongs to a larger political-administrative unit
• I personally believe the second option is far superior, as it avoids problems when municipalities encompass very large territorial areas (as in Poland, Italy, etc). However, a feasibility analysis needs to conducted about whether data is attainable on sub-municipal units in ISSP countries.