process automation criteria identification and selection
TRANSCRIPT

The Pennsylvania State University
The Graduate School
Department of Labor Studies and Employment Relations
PROCESS AUTOMATION CRITERIA IDENTIFICATION AND SELECTION: A CASE
STUDY IN A PAYROLL COMPANY
A Thesis in
Industrial Relations and Human Resources
by
Fuyu Yi
© 2009 Fuyu Yi
Submitted in Partial Fulfillment of the Requirements
for the Degree of
Master of Science
May 2009

ii
The thesis of Fuyu Yi was reviewed and approved* by the following:
Sumita Raghuram Associate Professor, Labor Studies Employment Relations Thesis Advisor
Sandeep Purao Associate Professor, College of Information Sciences and Technology
Shawn Clark Professor of Practice, College of Information Sciences and Technology
Paul Clark Professor, Labor Studies Employment Relation Head of the Department of Labor Studies and Employment Relations
*Signatures are on file in the Graduate School

iii
ABSTRACT
This research is intended to provide insights to managers making decisions on
automation. With the objective of investigating criteria for business process automation, the
research question is defined as: “What are the criteria used by managers to select processes or
part of a process for automation?” Although there is some development in the practice of
selecting and prioritizing processes for automation, no academic research exists to validate those
criteria used in the prioritization of automating processes. Due to the apparent lack of rigorous
theories, our research utilized a case study strategy to investigate the criteria for business process
automation, which can be helpful in selecting and prioritizing candidates for the automation
process.
This study will generate three major products: a series of process maps; process maps
with varying automation levels; and a list of criteria for process automation. The first product,
process maps, helps managers to better understand their business operation in order to discuss
future improvement. The second product, automation level process maps, provides a discussion
platform for managers to view technology distribution within the company and detect automation
opportunities. The automation criteria, the primary product of this project, will provide new
empirical evidence for critical factors for assessing process automation priorities, contributing to
the efforts of building an automation decision model.
iv
TABLE OF CONTENTS
LIST OF FIGURES ................................................................................................................. v
LIST OF TABLES................................................................................................................... vi
ACKNOWLEDGEMENTS..................................................................................................... vii
Objective.................................................................................................................................. 1
Literature review...................................................................................................................... 2
Definition of Business Process ........................................................................................ 2Definition of Business Process Automation .................................................................... 2Criteria in previous literatures ......................................................................................... 3
Research Methodology ............................................................................................................ 6
3.1 Why case study? ........................................................................................................ 63.2 The Overall Research Plan ........................................................................................ 7
Research Settings and Procedure............................................................................................. 10
Settings ............................................................................................................................ 10Procedure ......................................................................................................................... 11
Findings ................................................................................................................................... 12
Business Process Summary ............................................................................................. 12(1) Selling................................................................................................................. 14(2) On-boarding Process .......................................................................................... 16(3) Operating Process............................................................................................... 19(4) Billing Clients .................................................................................................... 20(5) Taxing................................................................................................................. 21
Process Automation Level Summary .............................................................................. 23Automation Criteria Summary ........................................................................................ 28
Discussion................................................................................................................................ 29
Future Studies .......................................................................................................................... 32
Bibliography ............................................................................................................................ 72

v
List of Figures
Figure 1. Methodology Roadmap............................................................................................ 8
Figure 2. Overall Process Map. ............................................................................................... 13
Figure 3. Selling Process Map................................................................................................. 15
Figure 4. On-boarding Process Map........................................................................................ 17
Figure 5. Operating Process Map ............................................................................................ 19
Figure 6. Billing Clients Process Map..................................................................................... 20
Figure 7. Taxing Process Map................................................................................................. 21
Figure 8 Colored labels of four automation levels .................................................................. 24
Figure 9. Overall Automation Level Map .............................................................................. 24
Figure 10. Automation Level Map–Selling Process................................................................ 25
Figure 11. Automation Level Map–On-boarding Process....................................................... 25
Figure 12. Automation Level Map–Operating Process ........................................................... 26
Figure 13. Automation Level Map—Billing Clients............................................................... 26
Figure 14. Automation Level Map–Taxing Process................................................................ 27

vi
List of Tables
Table 1. The Fitts MABA-MABA List ................................................................................... 33
Table 2 Automation Criteria in previous literatures ................................................................ 33
Table 3. Relevant Situations for Different Research Strategies (Source: Yin, 1994) ............. 41
Table 4. Problems with Selling Process .................................................................................. 41
Table 5. Problems with On-boarding Process ......................................................................... 42
Table 6. Problems with Operating Process.............................................................................. 43
Table 7. Problems with Taxing Process .................................................................................. 44
Table 8. Automation Level Categories.................................................................................... 44
Table 9 Overall Automation Level Table................................................................................ 45
Table 10 Automation Level Table - Selling Process ............................................................... 48
Table 11 Automation Level Table – On-boarding Process ..................................................... 49
Table 12 Automation Level Table - Operating Process .......................................................... 50
Table 13 Automation Level Table – Billing Clients Process .................................................. 52
Table 14 Automation Level Table - Taxing Process ............................................................... 53
Table 15 Ranking of Process Automation Level..................................................................... 54
Table 16. Data analysis of general automation criteria ........................................................... 54
Table 17. Data analysis of automation criteria for on-boarding process................................. 56
Table 18. Data analysis of automation criteria for operating process ..................................... 58
Table 19. Data analysis of automation criteria for billing client's process.............................. 59
Table 20. Data analysis of automation criteria for taxing process .......................................... 60
Table 21. Data analysis of automation criteria for selling process.......................................... 61
Table 22. Automation Criteria List.......................................................................................... 62

vii
ACKNOWLEDGEMENTS
I am very grateful for the cooperation and interest of the professors and the case company
who took part in my automation criteria study. It would not have been possible without their help.

1
Objective
With highly developed business process modeling tools, managers become more aware of
various business processes running in the organization. When examining all those processes,
managers contemplate which process or processes should be automated in order to have their
value-adding processes run faster. Especially when technologies are so developed that almost any
process can be automated, people become less concerned about the technology capability or the
problem of “what can be automated.” Instead, it is more in the manager’s interest to ask: “What
should be automated?” What drives a manager’s decisions on automating a process? How does he
select processes for automation from hundreds or thousands of candidates?
The objective of this research is to investigate the criteria used by managers in selecting
and prioritizing processes as automation candidates. In May 2005, Ultimus announced its
innovative tool for Prioritizing Process Automation to facilitate more informed automation
decision-making. However, until recently there has been a lack of attention in academic research
to study what criteria should be included in such automation decision-making.
To achieve this research objective, we developed a research question (RQ) with two sub-
questions for this thesis project.
RQ: What are the criteria used by managers to select processes or part of a process for
automation?
--1. Is it possible to create a comprehensive process map based on inputs from multiple
stakeholders in a company?
--2. How can we assess automation levels of each process in the process map, based on
inputs from multiple stakeholders in the organization?
2
Literature review
Definition of Business Process
There are many different ways in the literature to define a business process. A definition
from the workflow perspective given by Amit Sheth (1997) is “a series of actions, changes, or
functions that bring about an end or result.” However, such a definition neglects a vital element of
a process – the human, which has also been widely discussed as a vital concern in automation
(Parasuraman, 2008). In this paper, we use a relatively comprehensive definition given by
Davenport and Short (1990). A business process is “the logical organization of people, materials,
energy, equipment and procedures into work activities designed to produce a specified end
result.” This process definition covers all the elements (people, materials, energy, equipment and
procedures) in a business process without any bias towards either activities or people. Such a
definition opens multiple doors for searching for criteria used in automation decisions.
Definition of Business Process Automation
Automating business processes is also known as Automated Workflow (Gary et al, 1997).
The emphasis of workflow automation has largely been on automating administrative tasks and
other mostly routine processes; however, there is increased research interest in automating more
complex, mission-critical, and coordination-centric processes (Amit Sheth, 1997). With highly
developed technologies and diverse capabilities, automation has been given more possibilities and
more expectations. Automating low-level repeatable processes is not enough to maintain a highly

3
effective office operation. However, processes requiring more coordination and collaboration
require an adaptive way to approach workflow automation.
To include all types of technical capabilities, this thesis defines “Business Process
Automation” as the replacement of one or more manual parts of a business process with
automated ones, usually through the use of advanced technologies. In this definition, the word
“automation” was selected very carefully because it implies essentially what Information
Technology is doing.
Criteria in previous literatures
Based on our literature review, there is a lack of understanding about how to make a
rational automation decision; however, we can learn from practical experience, and also follow
clues in other research areas during our exploration of automation criteria.
In the process prioritizer tool developed by Ultimus, four groups of factors are used to
compute a candidate process’s Priority Index (Baker, 2005). The four groups are process features,
technical features, human factors and business alignment by BPM sponsor’s priorities. Process
features determine whether the process is suitable for automation. Then each process’s technical
suitability for automation is explored. Human factors decide whether automating a process will fit
the organizational culture. Finally, the automation candidate process is evaluated by its extent of
alignment with strategic business concerns. The four groups cover a wide range of factors, but
what specific criteria are evaluated under each group is not clear.
In assessing the automation suitability of a process, the traditional method is always to
automate routine processes, and leave processes that require more complex human skills (human-
centric processes), such as coordination, communication, collaboration, and complex decision-
making, manual (Ayachitula, Buco, Diao, & Fisher, 2007). In differentiating a routine process

4
from a human-centric process, Ayachitula et al (2007) used the number of tasks, number of
shared tasks, number of cross-role links, and number of business items as four criteria to evaluate
process complexity.
A more famous approach for making automation decisions in the human-machine
interaction discipline is Fitts list (1951) that states what “men are better at” and what “machines
are better at” (MABA-MABA). Human-machine interaction is a very different research area from
our study. The former concerns closed-system functionality design in a time-critical system, such
as in aircraft, medical and robotic systems, while our research is about allocating human and
automation processes in business organizations with less time pressure. However, these two
research areas share process features that are suitable for automation. The Fitts MABA-MABA
(see Table 1) list outlines features that shall be identified in processes considered for automation.
But, as pointed out by Price (2005), data needed for a Fitts list are context-dependent; therefore
they are not the ideal criteria, which should be completely context-independent (Botta & Bahill,
2007).
--Table 1 here—
Human-machine interaction has produced a huge range of literature since 1950, dealing
with the behavioral, social and organizational impact of automation (Grudin, 2006). Aside from
culture (Baker, 2005; Tedre, Sutinen, Kahkonen, & Kommers, 2006), other human factors are
examined when determining the automation degree in human-machine system design, such as
mental workload, situation awareness, complacency, and skill degradation (Parasuraman,
Scheridan, & Wickens, 2000). Those human concerns could constitute useful criteria to gain a
desired human performance improvement and avoid the serious consequences of human sacrifice.
Above all, beyond process features, technical features or human factors, automating a
process must be in line with organizational priorities. Organizational priorities such as company
growth or customer satisfaction should be the final judge of a process automation decision

5
because it is the overall goal of any organization-wide decision. For example, organizational
critical success factors (CSFs) are derived to select and prioritize processes for re-engineering
(Kettinger, Teng, & Guha, 1997). Since company resources are limited, any new
investment/development decision should provide maximum contributions to the company
strategy (Abendshien, 2001).
In addition to all the desired benefits mentioned above, we should also consider different
costs and risks of automating processes as a constraint criterion in most decisions/prioritizations
(Botta & Bahill, 2007). Cost not only implies money, but also includes resources like time, labor,
opportunities, and so on (Botta & Bahill, 2007). Technology costs and risks have been found
through extensive research examining prioritization models of process re-engineering (Kettinger,
Teng, & Guha, 1997), technology investment (Abendshien, 2001), and human-machine
interaction design (Parasuraman, Scheridan, & Wickens, 2000).
Other than academic research, a large number of automation benefits, such as
accountability and compliancy (Manila, 1996), responsiveness to customers (Statton-Smith, 1986;
Goldenberg, 1995), and greater control (Kennedy, 1988), can be found in popular magazines and
Internet articles. In summary, all the factors related to automation are listed in the table 2.
--Table 2 here—

6
Research Methodology
Research questions of this thesis follow from a review of the literature.
RQ: What criteria do managers use to select processes or part of a process for
automation?
1. Is it possible to create a comprehensive process map based on input from multiple
stakeholders in a company?
2. How can we assess automation levels of each process in the process map (based on
input from multiple stakeholders in the organization)?
A research method has been carefully developed to respond to these questions. This
section summarizes the research process including research strategy selection and research plan
development. Based on careful consideration of research requirements and resources available, a
case study has been designed as the research methodology. The following sections will elaborate
on the choice of the case study and the development of the case study plan.
3.1 Why case study?
To answer the research question, case study has been chosen as the research methodology
rather than Experiment, survey, Archival analysis, or History that represents the main research
strategies in Yin’s book (2003). The considerations behind this choice include the form of the
primary research question, when events or issues involved in answering the primary research
question took place, and whether or not any control existed over these events or issues.

7
Different aspects of the five research strategies have been compared in Table 3, according
to Yin (2003).
--Table 3 here—
Based on the Yin’s summary, there several reasons suggest case study as the most
appropriate strategy for this research,
1. Form of research question. Although the research question is an assessment of “what?”,
no previous studies have directly touched this problem, so an exploratory case study would be
most appropriate to investigate criteria behind a manager’s automation decision without any
contamination from a researcher’s preset expectations and biases.
2. The research question is about a contemporary issue and researchers have no control of
the issues and environment.
3. There no clear candidate criteria are found in the literature for the context of this
research question. Therefore, contextual conditions should be covered for the research
exploration. In this situation, case study is the most desirable strategy to investigate automation
criteria hiding in the big context, while any other strategies have some limitations. For instance, it
would be awkward to list all potential criteria in a survey, and it would also be possible to
mislead a participant.
In conclusion, case study offers the most appropriate strategy to explore the answer to the
research question in this thesis.
3.2 The Overall Research Plan
In this study, we draw on earlier literatures to define a business process and business
process automation, which built a discussion platform for further investigation of automation
criteria. Although no academic research has been found about automation criteria, a process-

8
prioritizing tool has been found in practice and provides a starting point for our research. Based
on four groups of factors identified in process prioritizing, extensive research has been found
either to extend automation criteria under each group or provide proof or supplemental factors to
make the automation decision.
Based on multidisciplinary literature, we can develop a significant list of automation
criteria and validate all the criteria in future studies. Without previous studies directly discussing
the topic in this paper, exploratory case study offers the best research strategy for the study. The
case was carefully selected to meet research requirements and validity considerations. We
developed four steps to complete this case study (see figure 1):
Figure 1. Methodology Roadmap

9
1) Systematic interviews. This step includes the kick-off interview, eight individual
interviews, one group interview and two follow-up interviews. All individual interviews are
structured interviews during which the researcher asks all participants a standard set of questions.
The group interview was conducted in a semistructured way: participants were asked to look at
process maps one by one, but for each process no standard questions were asked.
2) Process Modeling. This study uses the process-modeling tool Blueprint, a software
developed by Lombardi Software, Inc., a provider of Business Process Management (BPM)
software and services. Blueprint is a tool for processing documentation and workflow
diagramming. This study used Blueprint to map business processes because Blueprints include as
Inline editing, collapsible sub-processes, and linked common processes, which make process
mapping simple enough so that the user has more energy and time to explore automation criteria.
3) Exploring automation criteria through a group interview. After participants revised the
process map during the first section of the group interview, they were asked to talk about the
criteria they used in deciding the current automation level of each process. This section was also
conducted in a semistructured way, and again, no standard questions were designed in advance.
New questions popped up throughout the discussion.
4) Analyzing results. Automation criteria are derived from interview notes using content
analysis. Those criteria are then compared with those found in earlier literature. The analysis
contributes to the understanding of managers' concerns in decisions about automation and
provides information for future studies.

10
Research Settings and Procedure
Settings
The case study has been carried out in a payroll outsourcing company in central
Pennsylvania. Payroll outsourcing is a highly growing industry dominated by three players—
ADP, Paychex, and Ceridian Employer Services. According to an IDC study (IDC, 2008/06), the
three companies dominated a 44-percent share of US payroll outsourcing market; while those
small, regional companies like the company in this case study primarily operate at the very local
level. The competition in this market is furious, and it is in the interest of those small companies
to stand at the edge of technology to maintain and even expand their businesses.
The case companyhas 12 employees, including a CEO, 3 people in the operations
department (one of them takes all technical responsibilities as IT manager), 2 people in the tax
department, 2 in the conversion department and 4 in the sales department. Tax, conversion, and
IT all come under the umbrella of operations. Although each person has a distinct title, they all
share some general responsibilities, like operating payroll, answering phone calls from clients,
and other office tasks, which enables the company to provide better customer service and a
flexible work environment.
Although this company provides outsourcing services, it has outsourced some of its own
functions to other companies as well. For example, it outsourced its own payroll to Pay Choice,
and its website design and hosting are outsourced to Focal Tech.
The IT environment is relatively simple; the company uses a core system—licensed
software bought from Pay Choice—to run payrolls. Other software the company uses include
Microsoft Operating System, Microsoft Office, and Norton Anti-Virus.

11
Procedure
This case study includes four steps: systematic interviews, process modeling, group
interview and data analysis.
The first step of this study includes an initial interview and eight individual interviews.
The first interview took place at the company office with the CEO and Senior Vice President for
Operations at 9:00 a.m. on December 14, 2007. The goal of this meeting was to discuss the
overall structure of this company.
Next, structured interviews were conducted with the CEO, Senior Vice President for
Operations, two operations people, the tax manager, tax employee, conversion manager, and sales
manager. Interview questions included task allocation within department, detailed steps of the
work processes, time distribution on various steps, input and output of each step and process, time
schedule for a typical workday, workload, and personal feelings about current work.
After the Blueprint software had mapped out the results, we conducted an interview with
the CEO and Operations Manager to verify the process map and, most importantly, to discuss
automation criteria. Following this interview, two additional individual interviews were
conducted with the conversion manager and the tax manager to investigate detailed steps in
conversion validation and tax processing, respectively.
The fourth step is the data analysis phase. We derived an automation criteria list from
interview notes using content analysis. All the automation criteria were compared with the earlier
literature to investigate what factors influence automating a process or prioritizing processes as
automation candidates.

12
Findings
This study has three major outcomes: the process map of the case organization, the
process automation levels and the list of criteria in explaining the current automation levels of
different processes. The three findings are concluded in three parts: Business Process Summary,
Process Automation Level Summary, and Automation Criteria Summary. Business Process
Summary includes a process map and a brief description of and current problem for each process.
Based on these process maps, steps with different automation levels have been marked with
different colors in the Process Automation Level Summary. Next, the five business processes
have been ranked according to their automation levels in a table. To explain the current
automation rankings, 21 criteria were found during discussion with the case company . Those
criteria are summarized in the last part of this section.
Business Process Summary
The case company has five business processes: selling, on-boarding, operating, billing
clients and taxing. Two levels of sub-processes have been developed under each process except
for billing clients, which is totally automated.

13
Figure 2. Overall Process Map.
The business of the case company begins with the selling process that turns prospect
clients into real clients. To illustrate the map above, we imagine company ABC in central
Pennsylvania. ABC has previously outsourced its payroll to company Slow-Motion. Since ABC
is a local company with only 30 employees (meeting the criteria of a prospective client), the case
company is very interested in developing business with this company. Therefore, a sales person
responsible for ABC's area will make phone contact with his company.
After making many efforts, this sales person gains a chance to meet with ABC’s HR
manager and finally succeeds in getting a contract with the payroll company . Then this sales
person will collect all required documents, such as company and employee information from
ABC and deliver them to the The payroll company office, which triggers the on-boarding process.

14
The on-boarding process starts at the point when the sales person hands client documents
to the on-boarding manager. With these documents, the on-boarding manager starts building a
client shell for ABC in the Pay Choice system. In addition, on-boarding people are also
responsible for processing the first payroll.
The operating people will then take the responsibility of processing periodic payroll for
ABC according to its pay schedule (monthly for example). After processing the March payroll for
ABC, an ACH (Automated Clearing House) file will be generated to charge ABC. Ata this point,
the payroll operation is completed.
Billing clients is totally automated once the ACH file has been submitted to the online
billing center. The amount of the service fee will be transferred from ABC’s bank account to the
payroll company ’s bank account electronically.
Taxing is a relatively separate process from payroll operation. Taxes are deducted from
paychecks for ABC’s employees during the operating process, but that tax money is actually held
by the payroll company until the taxes are due. As the tax due date approaches, The payroll
company assumes the liability to pay taxes to the taxing authorities on behalf of ABC.
The following paragraphs include more detailed information for each business process.
Each business process has its own map at the beginning, followed by a brief description of its
workflow and current problems indicating future improvement opportunities.
(1) Selling
The sales people are not settled in one office but are scattered at different places. A major
task for sales people is to make phone calls to prospective clients and to try to gain a first meeting
with them. The detailed steps are illustrated in Figure 3 and described afterwards.

15
Figure 3. Selling Process Map
The sales manager will first define the characteristics of prospective clients and do
market research about them and will buy a database of the prospect's information. The sales
manager then will assign sales people in charge of the prospective client's specific area. After the
sales manager completes the first two steps, sales people start their work by making phone calls
to prospects.
The first phone call to a prospective client is called a “cold call”, which could end in one
of three situations: a successful appointment, a warm call, or a rejection.
If the prospect responds very positively and agrees to schedule an appointment with the
payroll company , this sales person will ask the appointment person to schedule it in the online
calendar. The appointment may or may not end up with a final contract. But if the prospective
client agrees to sign a contract, the business becomes a new client. The sales person then collects

16
documents containing company and employee information and delivers it to the payroll company
, along with the first payroll data, most of the time.
If the prospect says “ *** is not here, could you call us later?”, or something to the same
effect, the sales person makes a “warm call” at a later time, which may end in one of the three
situations again.
If the response is a total rejection, the sales person will still make a “warm call” after
about six months, because they don’t want to give up on any prospects. The person in charge of
the prospect company might change his or her mind or that person might have been replaced after
several months, which could create a new selling opportunity.
Current problems existing in selling process are illustrated in Table 4 at the end of this
paper.
--Table 4 here—
(2) On-boarding Process
The on-boarding process sets up a company shell and employee profile for new clients. In
addition, the on-boarding person is also responsible for running the first payroll for this new
client. The First Payroll Process will be described in this section following the process of building
new client shell. Detailed steps are illustrated in Figure 4 below.

17
Figure 4. On-boarding Process Map
To build a new client shell, the on-boarding person first receives client documents from
sales people who have direct connection with clients. The employee information usually comes
from the prior payroll company that this client previously associated with. However, most of the
time it arrives on paper rather than in an electronic format, due to the competitor’s unwillingness
to make the transition an easy one. When the on-boarding person gets all the information needed,
she will enter the data into the Pay Choice system. That completes the process of building a new
client shell.
After the client shell has been set up, the on-boarding person needs to run the first
payroll. The first payroll is run in the same way as the subsequent ones, except that the on-
boarding person needs to do more error-checking. As described by the on-boarding person
interviewed, “When operations get it (payroll data), they need to be able to just process them and

18
get them out of the door, (but) I need to check them to make sure everything’s correct before it
goes to operation.”
Processing the first payroll starts when the sales people hand over the first payroll data to
the on-boarding people. Before processing the actual payroll, the on-boarding person needs to
check the year-to-date report for this client. Take the ABC company for example, who has been
associated with Slow-Motion before contracting with the payroll company . The year-to-date
report contains all the payroll information before ABC terminated contract with Slow-Motion
within the year. Validation of the year-to-date report has two purposes: 1) making sure previous
payroll records are correct, which will influence the yearly report at the end of a year; and 2)
providing a good reference for the first payroll, because it is unlikely big differences will arise
between first payroll numbers and the year-to-date report.
After checking the year-to-date information, the on-boarding person always chose to
process the entire payroll first and validate it at the end.
Then, they will hand the checks and reports to the sales people. And the sales people will
deliver them to the client and explain the reports to them. This is a very important part of client
service as a competitive advantage, because big payroll companies usually don’t have the time for
such service.
When there are no setups to do, the on-boarding people may help out with operations to
process payrolls if needed.
Current problems existing in on-boarding process are illustrated in Table 5 at the end of
this paper.
--Table 5 here—

19
(3) Operating Process
Figure 5. Operating Process Map
The operating process starts when clients fax in payroll data. Clients have three ways of
sending data to the payroll company —fax, ftp, or phone, among which phone is the least used
method. In addition, clients can also send special notes for each payroll processing through e-
mail.
Most of the time, clients will fax payroll data. When information arrives by fax, a payroll
staff member will retrieve it if the information is payroll related. This person will start to type the
information into the Pay Choice system. Upon finishing entering data, he or she will go over it
again validating it against the fax received. Then, the payroll will be sent to the printers. This
same person or some other operation person will pick them up at the printers and wrap payrolls
for mailing. At the wrap station (a table specially set up for wrapping outgoing mail), there is a

20
schedule of payrolls that are coming in this week. When the payroll is wrapped, the operating
person will check it off the list. The periodic payroll is completed at this point.
Current problems existing in operating processes are illustrated in Table 6 at the end of
this paper.
--Table 6 here—
(4) Billing Clients
The Billing Clients process happens daily and is totally automated. Once a payroll has
been processed, the operation person will generate an ACH file to charge this client. At the end of
a business day, all ACH files generated during the day will be sent to the person in charge of it.
At the payroll company , it is the tax manager. The tax manager will then submit all the ACH
files to an online billing center. This online billing center will transfer the amount due from the
client’s bank account to the payroll company ’s account. All the transactions are processed
electronically.
Figure 6. Billing Clients Process Map

21
(5) Taxing
There are three types of taxes—federal, state and local. All those taxes have already been
deducted from employees' paychecks and held by The payroll company during the Operating
Process. When the tax due date approaches, the payroll company pays the amount to the tax
authorities on behalf of the clients. Both federal and state tax payments can be made through
Internet, while local tax payment needs to be processed manually by mailing checks to local tax
authorities. Considering the fact that townships scattered all over Pennsylvania collect their taxes
separately, the local tax payment is a very complicated and time-consuming process.
Figure 7. Taxing Process Map
For a new client's federal taxes, the tax person needs the client number at the payroll
company from the on-boarding manager to apply for a personal information number (pin)
number. Each client has a unique pin for federal taxes in the federal tax payment system called
the Electronic Filing Tax Payment System for Internal Revenue Services (EFTPIRS). Once the

22
pin is assigned to the client, the tax person can use it to pay tax on behalf of the client in the
future. Since the payment frequency of federal taxes varies from client to client and the payroll
company assumes the liability instead of its clients, the tax person pays federal tax semi-weekly,
usually on Wednesdays and Fridays, or the payroll company will be charged for late tax
payments.
The rest of the process of paying the federal tax is quite simple. The tax person usually
checks the due dates daily and exports a file with companies whose due days are two days later.
Since the Pay Choice system is in a different computer than the one where the EFTPIRS is
installed, the tax person needs to import this file into EFTPIRS and then submit the payment
through the Internet.
For state taxes, the process is very similar to federal taxes except for some minor
differences. For example, the client does not need a pin number to submit the payment, but the
tax person need to get permission to pay the state taxes on the client’s behalf before they actually
process the state tax. The tax person can either apply for permission from the state government
website or request it from some other organization that already holds it. Once the rights are
released to the payroll company Payroll, the tax person can login onto the state tax website and
pay taxes for multiple clients at the same time.
For local taxes, most payments are made manually by mailing checks to the local taxing
authorities at the end of a quarter. Thus, it is not an everyday task but can be very cumbersome
when it is coming close to the end of a quarter. The tax people print out checks and reports, wrap
it with forms sent by the tax bureau if there are any, and then send them by mail.
Current problems existing in the taxing process are illustrated in Table 7 at the end of this
paper.
--Table 7 here—

23
Process Automation Level Summary
The automation level varies among the five business processes and their sub-processes.
Based on the understanding of the five business processes presented in the previous section,
knowledge of the current automation levels enables decision makers to reflect on the automation
criteria in use and think about possibilities of further automation. In this section, we define four
levels of automation and mark them on the process map. The four levels include Manual, Partial
Automation, Predominant Automation, and Total Automation. We differentiate them according to
which parts of the process have been automated. A process usually includes three components:
input, operation, and output. Based on the principle that automating the operation of a process
increases the automation level much more than automating the format of input/output, a process
with IT operation is always more automated than a process with manual operation. The four
automation levels are defined below:
--Table 8 here—
A manual process is defined as a process with no electronic information. Partial
Automation refers to a process transferring data from paper to electric, or transporting data
manually from one device to another, such as data entry and transporting data by removable disk.
Predominant Automation refers to an automation level between Partial Automation and Total
Automation, where the Information System is usually involved in the operation system but some
manual pieces still exist. Total Automation means all human input involved in a process involves
no more than clicking buttons. The categorization of the four automation levels is illustrated in
the table 8 and label for each automation level is colored in automation level maps in following
paragraphs (colored labels are illustrated in Figure 8).

24
Figure 8 Colored labels of four automation levels
To illustrate automation levels on process maps, each process is presented by a map and a table.
In the automation level maps (Figure 9 – Figure 14), varying automation levels have been
differentiated by color. In addition to the map, details of input, operation and output of all non-
manual processes are summarized in tables (Table 9 – Table 14). Input and output are labeled by
material name. Operation name is consistent with the name of the process it belongs to, which
begins with a verb. At last, the automation rankings of the five business processes illustrate the
overall order of automation levels. It can be viewed as a summary of the automation conditions
(Table 15).
Figure 9. Overall Automation Level Map
-- Table 9 here--

25
Figure 10. Automation Level Map–Selling Process
-- Table 10 here—
Figure 11. Automation Level Map–On-boarding Process
-- Table 11 here--

26
Figure 12. Automation Level Map–Operating Process
-- Table 12 here--
Figure 13. Automation Level Map—Billing Clients
-- Table 13 here--

27
Figure 14. Automation Level Map–Taxing Process
-- Table 14 here—
-- Table 15 here--

28
Automation Criteria Summary
To investigate automation criteria, content analysis is used to analyze group interview
notes. Interview notes are listed sentence by sentence in tables. Because managers were asked to
give automation criteria for each business process in the company, interview notes about
automation criteria are organized by five business processes from Tables 16 to Table 21. For each
sentence from the notes, the researcher’s interpretation of this sentence is followed in the column
next to it.
--Table 16 here—
--Table 17 here—
--Table 18 here—
--Table 19 here—
--Table 20 here—
--Table 21 here—
Criteria are drew from those interpretations and marked in bold font, though some
sentences cannot generate any criteria but still kept in the table to keep complete original
information. Based on content analysis of all interview notes, 27 criteria are derived and then
listed in Table 22, which is the primary outcome of this study. In Table 22, the criteria are also
compared with those found from previous literatures.
--Table 22 here—

29
Discussion
1) It is possible to identify and codify criteria from determining the automation potential of
a business process. Similar to the decision model for selecting and prioritizing processes
for business process improvement, can also automation decision be rationalized by
analyzing a list of criteria. The list of criteria in this paper are very useful as a first step in
building a decision model, but this paper is limited in differentiating criteria for each
process and even sub-processes. Furthermore, the weights of processes on criteria are not
identified in this research due to limited time.
2) This study found criteria that support earlier literatures, such as business strategy,
competitive advantage, efficiency, productivity, and technology reliability. Those criteria
basically cover concerns of business alignment (business strategy and competitive
advantage), automation benefits (efficiency and productivity), technical features
(reliability and easy operation), people (available trained workers), and cost. Automation
decision is multifactor decision making. To gain the most benefits of automation, a
company will not automate a process just because it is more strategically important or
just because it has the best benefit-cost balance, but a company will try to balance many
more factors including technology possibilities and people.
3) Like any organizational decisions, automation decision is expected to be in line with
strategic concerns, including business strategy, competitive advantage, market share, and
company size. If automation can contribute to or be compatible to any of those strategic
concerns, a company will have a strong desire to increase automation, vice versa. Those
concerns may overlap depending on specific situations. For example, it may be because

30
of a large inefficient workforce that a bigger company's size requires more automation, or
it may be because of increasing market share that a bigger company needs automation to
handle increased workload. Above all, this is a proactive approach to the automating
processes, with which companies make automation decision from their own needs and
strategies.
4) External factors such as client size, type, needs, automation level and a competitor’s
automation level are also very important in automation decisions. Those automation
concerns are either reaction to clients or peer pressure from competitors, thus it is a more
reactive approach to automation. Client size, client type and its automation level may be
mediated by client needs, because automation is always intended to better serve a client’s
needs. In this paper, however, the mediation relationship has not been examined.
5) Value-add for processes are very different, thus whether automation can contribute to the
value-add of a process is a very important concern. For example, the value-add of the
selling process in this case study is to build a relationship with clients. The human touch
is appreciated very much in this process. Thus, the automation level is somewhat
constrained by this criterion. If a process values productivity and efficiency, then
automation is desired to increase them.
6) Process features such as availability of electronic data and computability of a process are
either enablers or constraints for automation. For example in this case study, automating
the data entry step of the on-boarding process is not possible because previous payroll
data are not available in electronic format—no matter how time-consuming this step is or
how strongly managers want to automate it.

31
7) Similar to process features, technical features can also be either enablers or constraints.
They include technology availability, quality, maturity, reliability and operation ease. A
few decades ago, those technical features may have played more of a constraining role
than enabler, because technologies were not well developed. But nowadays there are
extensive technology capabilities that can automate almost any process. Furthermore,
many small companies even start up around a software package covering many business
processes, like the company in this case study. In such a scenario, well-developed
technologies encourage automation by providing a package of automated processes
before managers consider which one should be automated.
8) Cost is another constraining concern, including labor cost, technology cost, and cost of
change. Cost of change has been emphasized in this case study because it starts from a
blank slate and little cost of change is a big advantage of this company to introduce a
whole package of software to automate many processes at the same time. Other costs in
the literature, such as labor costs and technology costs, are not mentioned in this study,
considering this is not a labor-intensive environment and monetary cost may not be a big
concern for growing companies when they’re looking for potential benefits in the future.
9) Compliance with government regulations is a criterion that we have not expected to find
in the literature. Just like manipulating the free market, government can exert its special
influence to encourage automation as a public policy, which is a strong driving force for
automation besides automation benefit/cost tradeoff.

32
Future Studies
The criteria found in this study are a valuable first attempt to build a pool of criteria for
automation decision-making. But this study is limited to exploring further weights of various
criteria on automation decisions. In addition, different processes have different concerns for
automation, but this paper did not categorize criteria specific for one process or one type of
process because of an inefficient amount of processes studied. It will be in the interest of future
studies to explore the possibility of building a list of common criteria to assess automation
potential of processes in general, or whether it’s better to categorize criteria and build a unique
decision model for a specific type of process such as customer facing processes. But in this case,
there will be more considerations about how to categorize processes appropriately in order to be
examined by the same group of criteria.
In addition, although this research does not particularly differentiate between types of
organizations in the discussion of automation criteria, it is believed that there will be different
criteria or different weights on the same criteria within different types of organizations. Future
studies on automation criteria are expected to make efforts to explore more criteria in different
types of organizations. In this way, companies can borrow experiences of best practices in
automation decision making from similar organizations.

33
Table 1. The Fitts MABA-MABA List
Men are better at
Detecting small amounts of visual, auditory or chemical energy
Perceiving patterns of light or sound
Improvising and using flexible procedures
Storing information for long periods of time, and recalling appropriate parts
Reasoning inductively
Exercising judgment
Machines are better at
Responding quickly to control signals
Applying great force smoothly and precisely
Storing information briefly, erasing it completely
Reasoning deductively
Table 2 Automation Criteria in previous literatures
Criteria Description Citation
Business alignment “Identify the extent of its alignment with the
priorities of BPM sponsors”
Baker, 2005; Kettinger,
Teng, & Guha, 1997
Competitive
advantage
Competitive advantage is the critical impetus
to automate a process.
Goldenberg, Barton,
1995
Process features “Determine if each candidate process has the
right characteristics to be suitable for
automation”
Baker, 2005

34
Technical features “Explore each process' technical suitability for
automation”
Baker, 2005
Continuous process
improvement
It’s easier to implement process
improvements on automated processes than
manual ones.
Captaris: Top ten
reasons to automate
workflow
Execution
Complexity
The complexity involved in performing the
tasks that make up the service process,
typically characterized by the number of
tasks.
Ayachitula, Buco, Diao,
& Fisher, 2007
Decision Complexity A sub-category of
execution complexity, quantifies decision
making according to the number of branches
in the decision, the degree of guidance, the
impact of the decision, and the visibility of the
impact.
Ayachitula, Buco, Diao,
& Fisher, 2007
Coordination
Complexity
The complexity
resulting from coordinating between multiple
roles,
either within a task or between tasks, and
depend on how business items are transferred
and processed.
Ayachitula, Buco, Diao,
& Fisher, 2007
Business Item
Complexity
The complexity involved in providing data
into the service process, and is quantified
through how the values were obtained.
Ayachitula, Buco, Diao,
& Fisher, 2007

35
Culture “Decide whether automation of each will be
advantageous within the culture of the
organization”
Baker, 2005
Mental workload The evidence suggests that well-designed
information automation can change human
operator mental workload to a level that is
appropriate for the system tasks to be
performed.
Parasuraman, Sheridan,
& Wickens, 2000
Situation awareness Automation of decision-making functions
may reduce the operator’s awareness
Parasuraman, Sheridan,
& Wickens, 2000
Complacency If automation is highly but not perfectly
reliable in executing decision choices, then
the operator may not monitor the automation
and its information sources and hence fail to
detect the occasional times when the
automation fails.
Parasuraman, Sheridan,
& Wickens, 2000
Skill degradation If the decision-making function is consistently
performed by automation, there will come a
time when the human operator will not be as
skilled in performing that function.
Parasuraman, Sheridan,
& Wickens, 2000
Increased
productivity
Automation increases productivity either by
reducing time-consuming administrative tasks
for staff to allow them focusing on more
value-added tasks or by equipping them with
Satton-Smith, Cory,
1986; Colletti, Jerome
A. 1988; Adhikari,
Richard, 1995; Buehrer,

36
more timely information to perform more
productively.
Senecal and Pullins,
2005; Manila, 1996;
Goldenberg, Barton,
1995; Crux automation:
reasons to automate
Increased
capacity/volume
Automation can increase capacity by handling
much more volume than people given the
same time period. Therefore automation can
either replace people to deal with large
volume or enable small number of staff to
handle volume that requires many more
people before.
Warren E. Schmidt,
1975; Richardson,
1991; Adhikari,
Richard, 1995;
Captaris: Top ten
reasons to automate
workflow; Crux
automation: reasons to
automate
Labor costs The more labor costs involved in a process,
the more savings are expected by automating
this process.
Kennedy, Daniel, 1988;
Adhikari, Richard,
1995; Manila, 1996;
Mark Lewis, 2005;
Captaris: Monte
Enbysk, 2008; Top ten
reasons to automate
workflow
Availability of labor The shortage of trained operators is also a Christopher A Bailey,

37
strong impetus to automate a process. 2005
Processing
time/speed/efficiency
Saving time entails two meanings: 1.
Automating routine processes increase the
efficiency of the automated process per se. 2.
Automating routine processes frees time up
for other strategic processes.
Warren E. Schmidt,
1975; Buehrer, Senecal
and Pullins, 2005;
Colletti, Jerome A.
1988; Steve A
Rosenthal, 2007;
DeMaio, Genene Marie,
1990; Steve A
Rosenthal, 2007;
Captaris: Top ten
reasons to automate
workflow
Accountability &
compliancy
The machine is much more objective than
people, therefore, accountability &
compliancy is expected to be enforced by
automation. In addition, automation is
expected to be less prone to corruption in
government.
Manila, 1996; Captaris:
Top ten reasons to
automate workflow
Connection of
customers and
suppliers
It is easier to serve customers and suppliers
through automated system.
Monte Enbysk, 2008;
Captaris: Top ten
reasons to automate
workflow
Responsiveness to Automation can increase responsiveness to Satton-Smith, Cory,

38
customer customers and suppliers, for example, the
availability of updated info enables reps to
respond more quickly to customers’ questions
1986; Goldenberg,
Barton, 1995
Timely and accurate
information
Automation can provide timely, easy access to
accurate information. For example, sales force
automation enable sales reps to make more
persuasive presentations by widening their
range of information.
Satton-Smith, Cory,
1986; DeMaio, Genene
Marie, 1990;
Goldenberg, Barton,
1995; Captaris: Top ten
reasons to automate
workflow
Maintenance of
operational
knowledge
Automated systems retain operational
knowledge without dependence on people,
especially in industries without high turnover
rates.
Captaris: Top ten
reasons to automate
workflow
Single source for
workflow
Automation offers a single source for
workflow, which reduces potential errors
produced by multiple sources.
Monte Enbysk, 2008;
Captaris: Top ten
reasons to automate
workflow
Immediate
communication
Automation enables immediate
communication
Richardson, 1991;
DeMaio, Genene Marie,
1990; Goldenberg,
Barton, 1995
Accelerate the flow of
information
Automation accelerates the flow of
information
Richardson, 1991

39
Accuracy/ precision Automation can produce more accurate
outcomes than humans, such as regional
maps.
Warren E. Schmidt,
1975; Richardson, 1991
Highly complex and
repetitive
computation
Only computers can do such highly complex
and repetitive computation. Such cases are
very common in engineering processes.
Warren E. Schmidt,
1975; Richardson, 1991
Make output
professional
Professionalism requires more standardized
and consistent output, which can only be
produced by an automation system.
DeMaio, Genene Marie,
1990
Greater control Automation enables managers to have greater
control over business processes. For example,
treasury automation enables a firm to achieve
greater control over the balances in its various
bank accounts.
Kennedy, Daniel, 1988;
Colletti, Jerome A.
1988
Better tracking
capabilities
It is much easier and faster to track historical
records with automation than with a manual
process.
Steve A Rosenthal,
2007; Monte Enbysk
(2008, Microsoft)
Sufficient training Training proved most effective in increasing
usage of technology
Buehrer, Senecal and
Pullins, 2005
Employee satisfaction
and motivation
Highly productive employees are expected to
feel more sense of achievement and therefore
feel more satisfied.
Goldenberg, Barton,
1995
Reliability The fewer uncontrolled variables in a process,
the higher the quality and more uniform the
Parasuraman, Sheridan,
& Wickens, 2000;

40
products. Richardson, 1991;
Mark Lewis, 2005;
Crux automation:
reasons to automate; J.
D. Lee and N. Moray,
1992
Predictability A reliable automation system can also
increase predictability of a process, such as
delivery dates and product quality, which is
especially important for the transportation
industry.
Richardson, 1991
Affordable The more affordable the automation
technology is, the more likely to automate a
process.
Manila, 1996; Monte
Enbysk, 2008
Easy to use The easier it is to use automation technology,
the more likely to automate a process
Monte Enbysk, 2008

41
Table 3. Relevant Situations for Different Research Strategies (Source: Yin, 1994)
Strategy Form of
research
question
Requires
control over
behavioral
events?
Focuses on
contemporary
events
Boundaries between
phenomenon and
context
Experiment How, why Yes Yes Deliberately divorces
a phenomenon from
its context
Survey Who, what,
where, how
many, how much
No Yes No, but the ability to
investigate the
context is extremely
limited
Archival
analysis
Who, what,
where, how
many, how much
No Yes/no
History How, why No No No
Case study How, why No Yes Not clearly evident
Table 4. Problems with Selling Process
Problem Description Challenge for Improvement
Challenges in
building client trust
It is challenging for sales people to
choose appropriate methods
throughout the interaction with
Since payroll usually takes 30
percent or more of the entire
budget of a company, the

42
prospective clients. prospective client needs enough
confidence in the payroll
company to handle their payroll
and expose their confidential
information such as bank
accounts.
Table 5. Problems with On-boarding Process
Problem Description Challenge for Improvement
Incompatible data
formats from clients
“The spreadsheet for my system has to
be in a specific order, so if a company
sends me over an Excel spreadsheet
that does not have the exact format
that I need, I end up spending more
time converting the files to the way I
needed than to just enter the
employees all by myself, just enter
them all by hand.”
“We sell on the point that our
on-boarding process is very
simple, you know, just give us
your report, and we take care of
it. For them, it’s so easy; it’s a
little more complicated for me”
Time consuming at
on-boarding step
On average, each company takes six
hours for set up.
For small companies, most
documents are kept on paper;
for bigger companies, electronic
documents may not be available
due to the competition's

43
unwillingness to make the
transition easy.
Time consuming at
the validation step
A ten-employee company could take
her 20 minutes to finish checking
everything, while the actual payroll-
processing step takes only minutes.
Since the company shell and
first payroll is only entered once
at the beginning of each new
client relationship, careful
validation is a critical step to
ensure that future payrolls could
be processed smoothly.
Miscommunication “I don’t think I have ever had received
such great paperwork that I never have
to call the client. And I always have to
call the clients for something.”
Mistakes are unavoidable when
data are processed manually
several times.
Table 6. Problems with Operating Process
Problem Description Challenge for Improvement
Time consuming at
data entry step
In the absence of any errors data entry
could take as little as a couple of
minutes, to as long as an hour.
For small companies, most of
documents are kept on paper;
fax is the primary method to
collect payroll data.
Time consuming to
deal with unexpected
errors
Problems happen all the time, so the
operating person needs to go back and
search the error source and correct it,
or if there is nothing wrong with either
Mistakes are unavoidable when
data are processed manually
several times.

44
data entering or software, this person
needs to call the client to check if they
have sent the wrong data.
Table 7. Problems with Taxing Process
Problem Description Challenge for Improvement
Inconsistence of tax
rates
Whether to use the tax rate based on
where the business is located or based
on where the employee lives, if the
two are different.
Government policies differ from
one town to another
Time consuming for
local tax payments
Local taxes cannot be paid
electronically, instead, can only be
paid by mailing checks to many small
local tax authorities.
Small townships scattered all
over Pennsylvania collect their
taxes separately
Table 8. Automation Level Categories

45
Table 9 Overall Automation Level Table
Automation
Level
Process Name Input Operation Output
Selling –
Assign tasks to
salesmen
Database of
prospect clients
Assign tasks to
salesmen in face,
by phone, or email
Task assignment to
each salesman
Onboarding –
Gather basic
client data
Basic client data in
paper, or electronic
format at client
company
Gather basic client
data mostly by
hand, from
salesmen, or ftp
server, or from fax
machine.
Basic client data in
paper, or electronic
format at the
payroll company
Onboarding –
gather first
payroll data
First payroll data
in paper, or
electronic format
at client company
gather first payroll
data mostly by
hand, from
salesmen, or ftp
server, or from fax
machine.
First payroll data
in paper, or
electronic format
at the payroll
company
Partial
Automation
Operating –
gather periodic
payroll data
Periodic payroll
data in paper, or
electronic format
at client company
gather periodic
payroll data mostly
by hand, from
salesmen, or ftp
server, or from fax
machine.
Periodic payroll
data in paper, or
electronic format
at the payroll
company

46
Selling –
Schedule the
appointment
online
Appointment
information on
paper
Schedule the
appointment online
Appointment
scheduled online
Onboarding –
Build client
shell
Basic client data in
paper, or electronic
format at the
payroll company
Build client shell
in the Pay Choice
system
Client shell stored
in the Pay Choice
system
Onboarding –
Process first
payroll
First payroll data
in paper, or
electronic format
at the payroll
company
Process first
payroll in the Pay
Choice system
First payroll data
stored in the Pay
Choice system
Operating –
Print out
weekly client
list
Client information
in the Pay Choice
system
Print out weekly
list of clients
whose pay period
is in the same
week
Client list on the
paper
Operating –
Process
periodic
payrolls
Periodic payroll
data in paper, or
electronic format
at the payroll
company
Process periodic
payrolls in Pay
Choice system
Periodic payroll
data stored in the
Pay Choice system
Predominant
Automation
Taxing – Tax updates Update tax Updated tax

47
Update tax
information
information in
mails/emails
information information in the
Pay Choice system
Taxing –
Process local
tax payments
Tax payment
information in the
Pay Choice system
Process local tax
payments
Tax payment
checks
Billing clients –
Collect ACH
files of clients
due daily
ACH file
generated by the
Pay Choice system
Collect ACH files
of clients due daily
ACH files in the
computer
responsible for
billing clients
Billing clients –
Login billing
center online
User name and
password of the
payroll company
Login billing
center online
Successfully login
to the the payroll
company ’s online
billing panel
Billing clients –
Submit all
ACH files
ACH files in the
computer
responsible for
billing clients
Submit all ACH
files
Online requests for
billing clients
Total
Automation
Billing clients –
Charge clients
bill
Online requests for
billing clients
Charge clients bills
by transferring
money from
clients to the
payroll company
Transaction
completed between
clients and the
payroll company

48
Taxing –
Process Federal
Tax Payments
Tax information of
clients whose taxes
are due
Process Federal
Tax Payments
through EFTPIRS1
Transaction
completed between
Federal tax bureau
and the payroll
company
Taxing –
Process State
Tax Payments
Tax information of
clients whose taxes
are due
Process State Tax
Payments through
state online system
Transaction
completed between
State tax bureau
and the payroll
company
Table 10 Automation Level Table - Selling Process
Automation
Level
Process Name Input Operation Output
Access to
prospects
database
User name and
password of the
payroll company
Access to
prospects
database
Successfully
login to the
database
Partial
automation
Group prospects
by location
List of prospects
in the database
Group prospects
by location
List of prospects
grouped by
location
Totally
automated
Login online
calendar
User name and
password of the
payroll company
Login online
calendar
Successfully
login to online
calendar
1
Electronic Filing Tax Payment System For Internal Revenue Services

49
Set up
appointments on
calendar
Appointment
information
either in paper or
electronic format
Set up
appointments on
calendar
Appointments set
up in the online
calendar
Save
appointments
online
Appointments set
up in the online
calendar
Save
appointments
online
Appointments
saved in the
online calendar
Table 11 Automation Level Table – On-boarding Process
Automation
Level
Process Name Input Operation Output
Receive basic
client data
Client documents
in paper at client
company
Receive basic
client data
through fax or
manually
Client documents
in paper at the
payroll company
Partial
Automation
Receive first
payroll data
First payroll data
at client
company
Receive first
payroll data
through fax or
manually
First payroll data
at the payroll
company
Predominate
automation
Enter client
company
information
Client company
information in
paper
Enter client
company
information into
Pay Choice
system
Client company
profile in the
system

50
Enter client
employee
information
Client employee
information in
paper
Enter client
employee
information into
Pay Choice
system
Client employee
profile in the
system
Print out checks
and reports
Payroll
information in
the system
Print out checks
and reports
Checks and
reports
Login the system User name and
password of the
payroll company
Login the system Successfully
login to Pay
Choice system
Create a new
client
Client company
information in
paper
Create a new
client
A new client
profile
uncompleted in
the Pay Choice
system
Save the client
profile
Client profile in
the Pay Choice
system
Save the client
profile
Client profile in
the Pay Choice
system
Total automation
Save first payroll First payroll in
the Pay Choice
system
Save first payroll First payroll in
the Pay Choice
system
Table 12 Automation Level Table - Operating Process

51
Automation
Level
Process Name Input Operation Output
Partial
automation
Receive periodic
payroll data
Periodic payroll
data in paper, or
electronic format
at client
Receive periodic
payroll data
mostly by hand,
from salesmen,
or ftp server, or
from fax
machine.
Periodic payroll
data in paper, or
electronic format
at the payroll
company
Enter periodic
payroll
Periodic payroll
data in paper, or
electronic format
at the payroll
company
Enter periodic
payroll data into
the Pay Choice
system
Periodic payroll
data stored in the
Pay Choice
system
Predominate
automation
Print out checks
and reports
Periodic payroll
data stored in the
Pay Choice
system
Print out checks
and reports
Checks and
reports in paper
Save periodic
payroll
Periodic payroll
data stored in the
Pay Choice
system
Save periodic
payroll
Periodic payroll
data saved in the
Pay Choice
system
Totally
automated
Generate ACH
file for this client
Periodic payroll
data saved in the
Generate ACH
file for this client
ACH file
generated for this

52
Pay Choice
system
client whose
periodic payroll
have been
completed
Table 13 Automation Level Table – Billing Clients Process
Automation
Level
Process Name Input Operation Output
Collect ACH
files of clients
due daily
ACH files
generated at
operation
department
Collect ACH
files of clients
through jump
drive
ACH files in the
computer of the
person in charge
of billing clients
Login billing
center online
Username and
password of the
payroll company
Login billing
center online
Successfully
login to online
billing center
Submit all ACH
files
ACH files in the
computer of the
person in charge
of billing clients
Submit all ACH
files
ACH files
submitted to
online billing
center
Total automation
Charge clients
bill
ACH files
submitted to
online billing
center
Charge client bill
electronically
from client bank
account to the
payroll company
Bill processed

53
account
Table 14 Automation Level Table - Taxing Process
Automation
Level
Process Name Input Operation Output
Update tax
information
Tax updates
information in
mails/emails
Update tax
information
Updated tax
information in
the Pay Choice
system
Predominate
automation
Print out tax
payment checks
and reports
Tax payment
information in
the Pay Choice
system
Print out tax
payment checks
and reports
Tax payment
checks and
reports
Login the system
(for both Federal
and State tax)
User name and
password of the
payroll company
Login the system Successfully
login to Pay
Choice system
List all tax-due
clients (for both
Federal and State
tax)
List of clients in
the Pay Choice
system
List all tax-due
clients
List of clients
whose tax
payments are due
Totally
automated
Export Tax files
of them (for both
Federal and State
tax)
Tax payment
information in
the Pay Choice
system
Export Tax files
of clients whose
tax payments are
due
Tax files in a
movable drive

54
Import Tax files
to the online
payment system
(for both Federal
and State tax)
Tax files in a
movable drive
Import Tax files
to the online
payment system
Tax files in the
online payment
system
Submit Tax
payment (for
both Federal and
State tax)
Tax files in the
online payment
system
Submit Tax
payment
Tax payment
completed
Table 15 Ranking of Process Automation Level
Process Name Automation Applied Automation Rank
Billing Clients Pay Choice system + Banking
system
1 (Totally automated)
Operating Pay Choice + FTP/Fax/Phone 2 (Mostly automated)
Taxing Pay Choice + Government tax
payment system
3 (Partly automated)
Onboarding Pay Choice + Fax 4 (Partly automated)
Selling Online schedule + emails 5 (Barely automated)
Table 16. Data analysis of general automation criteria
No. Quotations Interpretation
1. “We started with a blank slate designing the
business and the business model.”
Cost of change, such as cost of discarding
old system, difficulties of employees to

55
adjust to new work procedure. Newly
starting company has the flexibility to use
automation without constraints of existing
system and working process.
2. “We worked forward to making a software
decision by calling and around to other
payroll companies.”
Competitor’s automation level. The more
automated a firm’s competitor is, the more
likely it will increase its automation level,
either to gain competitive advantage or to
keep current market position.
3. “Once we saturate market we may go
national and increase our automation.”
Market share. When a company increases
its market share, it is more motivated to
increase automation to handle increased
businesses.
4. “Automation seems to rank with the growth
of our company. We automated core
business processes first. Others may come
later.”
Company size. Bigger company size
implies increased volume of work and also
increased ability to invest in automation.
5. “We do not automate some aspects of our
business because our business strategy
involves a more high-touch approach than
our competitors.”
Business Strategy. Automation level
should be in line with business strategy.
6. “We have abandoned some automation. For
example, the database we set up was too
slow. Probably because we didn’t
Technology quality and easy operation.
The better a technology is, a company is
more willing to use it. Also, the easier to

56
understand the product well enough.” understand and operate an automation
system, the more likely a company will
implement the automation.
7. “Sometimes manual is faster.” Technology quality and easy operation.
8. “Sometimes automation requires more
training.”
Availability of trained workers. The more
trained workers are available, the easier and
less costly to automate a process, because
lack of trained workers will bring extra
investment in training or recruiting
professionals.
Table 17. Data analysis of automation criteria for on-boarding process
No Quotations Interpretation
9. “We could have client data automated in a
spreadsheet.”
Client data can be automated, but for some
other reasons, it is not necessarily being
automated.
10. “Would have to manually key in data.” For some constraints, manual is a must to
complete a process.
11. “Client's ability to automate affects our
automation decisions.”
Client’s automation level. For client-facing
processes, company’s automation may be
constrained or encouraged by client’s ability
to automate. In this case, it has been
constrained by small client’s automation
ability.

57
12. “One obstacle–lack of ability to get
automation to work due either to time or
internal skills. ”
Availability of trained workers.
13. “Cost savings’ a consideration.” Cost. Saving costs is always a primary
reason for automation. Cost includes labor
cost, material cost, and operating cost.
14. “Prior automation at the client or other
payroll company may decide whether or not
something can be automated during the
conversion task.”
Client’s automation level and
competitor’s automation level.
15. “On the other hand, if the client is getting
transferred from another payroll process
company, it is unlikely that they will give us
access to their electronic data, (we will only
likely get the printouts). ”
Electronic data availability. This is the
reason for line #10. Unavailable electronic
data or no access to them will constrain the
automation possibility.
16. “Scale of clients is a key attribute. Because
the sweet spot for this payroll company is
about 200 employees, you are likely to find
less automation at the clients when they
join.”
Client size. Similar to size of the company,
the smaller its client is, the less automation
is expected to exist in the client’s company,
thus less automation is needed in the
company of interest. This factor may be
mediated by client’s automation level in
influencing automation decision.
17. “Conversion/transition speed is an
important reason for automating this
Efficiency. When efficiency can be
enormously improved, automation of this

58
process, doing this manually takes time, and
if there is a way to do this quickly, this may
be a selling point.”
process is strongly desired to gain
competitive advantage (selling point).
Table 18. Data analysis of automation criteria for operating process
No Quotations Interpretation
18. “Components of software drive value.” Automating value-add process facilitates the
flow and increases the speed of value
creating process.
19. “Our value-add is accommodating our
clients needs.”
Client needs. Client is the final judge of an
appropriate automation decision.
Automation level depends on whether it can
fulfill client’s needs.
20. “The type of client we work with dictates
the level of automation required.”
Client type. Different types of clients have
different needs, which decides the
automation level.
21. “The clients we work with has up to 200
employees, beyond that they look to other
vendors.”
Client size.
22. “If they have an HR director, then they may
not become a client.”
Client needs. Payroll outsourcing exists to
fulfill client’s needs for professional payroll
processing when an HR director is not
available.
23. “The client’s own automation Client needs. Besides need of service,

59
needs/capabilities drive (this payroll
company) ’s automation.”
client may have specific need for
automation level or technology.
24. “Size of client provides a threshold on what
parts of the process can be automated.”
Client size.
Table 19. Data analysis of automation criteria for billing client's process
No Quotations Interpretation
25. “Automated because we could license the
system and it is reliable.”
Technology maturity and technology
reliability. Maturity means the technology
has been well developed and can be
provided and supported professionally.
Reliability refers to whether the automation
system can be operated flawlessly.
26. “We started blank slate, which allowed us to
automate right off the bat.”
Cost of change.
27. “Because software is available, it is reliable,
allows us to deal with volume, and increases
speed.”
Technology availability, technology
reliability, productivity and efficiency.
28. “More importantly, our business is actually
built around this software, it is their
business model itself –the business was
started from software.”
Automation timing. If automation is done
at the beginning of a business, its processes
are built around the technology. Otherwise,
technology is used to support or improve
existing processes.

60
Table 20. Data analysis of automation criteria for taxing process
No Quotations Interpretation
29. “Software automates many steps.” Design of software. What steps are
automated is supported or constrained by
current design of software.
30. “Local tax requirements make our business
model work.”
Compliance with government
regulations. In an area with special policy,
automation may be not desired. In an
environment either impossible or very hard
to automate, lower automation level is
desired.
31. “Because we must perform some steps
manually.”
For some constraints, manual is a must to
complete a process.
32. “Avoiding automation in this process area is
considered our competitive advantage.”
Competitive advantage. Certain
automation levels have various
contributions to competitive advantage of a
process. The final decision of an automation
level should contribute the most to
competitive advantage.
33. “PA/local taxes is a key issue–the software
does not handle these.”
Design of software. Software is usually
designed for general situations and some
special situations may not be covered in the
software package.
34. “There are too many jurisdictions–the Computability of the process. For steps

61
software cannot handle these.” that cannot be automated, manual is the only
way to process it. But this factor may
change as technology develops.
35. “Another subtle point that was brought up
had to deal with the importance of this to
avoid competition.”
Competitive advantage.
Table 21. Data analysis of automation criteria for selling process
No Quotations Interpretation
36. “Shaking hands, high touch appreciated by
client in our region of the state.”
Appreciation of human touch. The more
appreciated human touch is in a process, the
less necessary to automate it.
37. “We have used ‘Act’ software before for
contact management, but with traveling
salespeople they have found it difficult to
use this.”
Easy operation.
38. “Personal touch is important.” Appreciation of human touch.
39. “If the salespeople are ‘untrainable,’ that
becomes a significant obstacle.”
Technology trainability of workforce. The
more trainable the workers involved in a
process, the more likely a process will be
automated than those with untrainable
workers.
40. “The ‘value-add’ that is provided and more
importantly, explained during the selling
Value-add of a process. Whether a certain
level of automation can contribute the most

62
process is a key barrier to full automation.” to value-add tasks of a process determines
favorite automation decision.
Table 22. Automation Criteria List
Criteria Description Quotes Citation
1. Cost of change Cost of change, such as
cost of discarding old
system, difficulties of
employees to adjust to
new work procedure.
1. “We started with a
blank slate designing the
business and the business
model.”
26. “We started blank slate
which allowed us to
automate right off the bat.”
Marchionini,
G., 1995;
2. Competitor’s
automation level
The more automated a
firm’s competitor is, the
more likely it will
increase its automation
level, either to gain
competitive advantage or
to keep current market
position.
2. “We worked forward to
making a software
decision by calling and
around to other payroll
companies”
14. “Prior automation at
the client or other payroll
company may decide
whether or not something
can be automated during
the conversion task,”
Barua, A.,
1991;
3. Client’s For client-facing 11. “Clients ability to

63
automation level processes, company’s
automation may be
constrained or
encouraged by client’s
ability to automate. In
this case, it has been
constrained by small
client’s automation
ability.
automate affects our
automation decisions.”
14. “Prior automation at
the client or other payroll
company may decide
whether or not something
can be automated during
the conversion task,”
4. Market share When a company
increases its market
share, it is more
motivated to increase
automation to handle
increased businesses.
3. “Once we saturate
market we may go
national and increase our
automation.”
5. Company size Bigger company size
implies increased volume
of work and also
increased ability to invest
in automation.
4. “Automation seems to
rack with the growth of
our company. We
automated core business
processes first. Others may
come later.”
6. Client size The smaller its client is,
the less automation is
expected to exist in the
16. “Scale of clients is a
key attribute. Because the
sweet spot for this payroll

64
client’s company, thus
less automation is needed
in the company of
interest.
company is about 200
employees, you are likely
to find less automation at
the clients when they
join.”
21. “The clients we work
with has up to 200
employees, beyond that
they look to other
vendors.”
24. “Size of client
provides a threshold on
what parts of the process
can be automated.”
7. Client needs Client is the final judge of
an appropriate
automation decision.
Automation level
depends on whether it can
fulfill client’s needs.
19. “Our value-add is
accommodating our clients
needs.”
22. “If they have an HR
director then they may not
become a client.”
23. “The client’s own
automation
needs/capabilities drive
(this payroll company) ’s
Frith, K.,
2000;
Brunner, R.,
Maissen, T.,
1997;
Venkatraman,
N., 1994;

65
automation.”
8. Client type Different types of clients
have different needs,
which decides the
automation level.
“The type of client we
work with dictates the
level of automation
required.”
9. Business
Strategy
Automation level should
be in line with business
strategy.
5. “We do not automate
some aspects of our
business because our
business strategy involves
a more high-touch
approach than our
competitors.”
Baker, 2005;
Kettinger,
Teng, &
Guha, 1997;
Abendshien,
2001;
10. Technology
quality
The better a technology
is, a company is more
willing to use it.
6. “We have abandoned
some automation. For
example, the database we
set up was too slow.
Probably because we
didn’t understand the
product well enough.”
7. “Sometimes manual is
faster.”
11. Technology
maturity
Maturity means the
technology has been well
developed and can be
25. “Automated because
we could license the
system and it is reliable.”

66
provided and supported
professionally.
12. Technology
reliability
Reliability refers to
whether the automation
system can be operated
flawlessly.
25. “Automated because
we could license the
system and it is reliable.”
27. “Because software is
available, it is reliable,
allows us to deal with
volume, and increases
speed.”
Richardson,
1991; Mark
Lewis, 2005;
Crux
automation:
reasons to
automate; J.
D. Lee and N.
Moray, 1992;
A. J.
Masalonis and
R.
Parasuraman,
1999;
Parasuraman
& Sheridan,
2000;
13. Technology
availability
Technology availability
can either encourage
when it’s available or
discourage automation
when technology is not
27. “Because software is
available, it is reliable,
allows us to deal with
volume, and increases
speed.”

67
available.
14. Easy
operation
The easier to understand
and operate an
automation system, the
more likely a company
will implement the
automation.
6. “We have abandoned
some automation. For
example, the database we
set up was too slow.
Probably because we
didn’t understand the
product well enough.”
7. “Sometimes manual is
faster.”
37. “We have used ‘Act’
software before for contact
management but with
traveling salespeople they
have found it difficult to
use this.”
Monte
Enbysk, 2008
15. Design of
software
What steps are automated
is supported or
constrained by current
design of software.
29. “Software automates
many steps.”
33. “PA/local taxes is a
key issue –the software
does not handle these.”
16. Computabili
ty OF the
process
For steps that cannot be
automated, manual is the
only way to process it.
34. “There are too many
jurisdictions –the software
cannot handle these.”

68
But this factor may
change as technology
develops.
17. Availability
of trained
workers.
The more trained workers
are available, the easier
and less costly to
automate a process,
because lack of trained
workers will bring extra
investment in training or
recruiting professionals.
8. “Sometimes automation
requires more training.”
12. “One obstacle – lack
of ability to get
automation to work due
either to time or internal
skills. ”
Christopher A
Bailey, 2005;
Buehrer,
Senecal and
Pullins, 2005;
Browning,
R.A., 2004;
18. Technology
trainability of
workforce
The more trainable the
workers involved in a
process, the more likely a
process will be automated
than those with
untrainable workers.
39. “If the salespeople are
‘untrainable’, that
becomes a significant
obstacle.”
19. Electronic
data availability
Unavailable electronic
data or no access to them
will constrain the
automation possibility.
15. “On the other hand, if
the client is getting
transferred from another
payroll process company,
it is unlikely that they will
give us access to their
electronic data, (we will
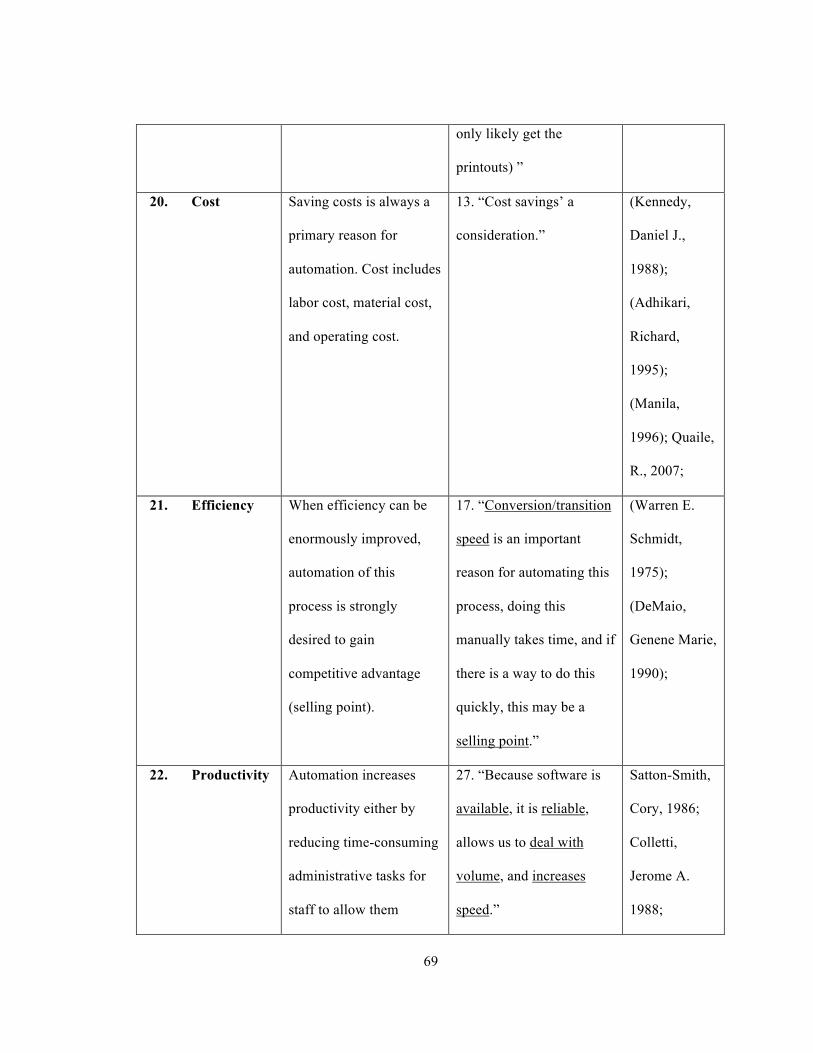
69
only likely get the
printouts) ”
20. Cost Saving costs is always a
primary reason for
automation. Cost includes
labor cost, material cost,
and operating cost.
13. “Cost savings’ a
consideration.”
(Kennedy,
Daniel J.,
1988);
(Adhikari,
Richard,
1995);
(Manila,
1996); Quaile,
R., 2007;
21. Efficiency When efficiency can be
enormously improved,
automation of this
process is strongly
desired to gain
competitive advantage
(selling point).
17. “Conversion/transition
speed is an important
reason for automating this
process, doing this
manually takes time, and if
there is a way to do this
quickly, this may be a
selling point.”
(Warren E.
Schmidt,
1975);
(DeMaio,
Genene Marie,
1990);
22. Productivity Automation increases
productivity either by
reducing time-consuming
administrative tasks for
staff to allow them
27. “Because software is
available, it is reliable,
allows us to deal with
volume, and increases
speed.”
Satton-Smith,
Cory, 1986;
Colletti,
Jerome A.
1988;

70
focusing on more value-
added tasks or by
equipping them with
more timely information
to perform more
productively.
Adhikari,
Richard, 1995;
Buehrer,
Senecal and
Pullins, 2005;
Manila, 1996;
Goldenberg,
Barton, 1995;
Crux
automation:
reasons to
automate;
23. Automation
timing
If automation is done at
the beginning of a
business, its processes are
built around the
technology. Otherwise,
technology is used to
support or improve
existing processes.
28. “More importantly, our
business is actually built
around this software, it is
their business model itself
–the business was started
from software.”
24. Compliance
with government
regulations.
In an area with special
policy, automation may
be not desired. In an
environment either
30. “Local tax
requirements make our
business model work.”

71
impossible or very hard
to automate, lower
automation level is
desired.
25. Competitive
advantage
Certain automation levels
have various
contributions to
competitive advantage of
a process. The final
decision of an automation
level should contribute
the most to competitive
advantage.
32. “Avoiding automation
in this process area is
considered out competitive
advantage.”
35. “Another subtle point
that was brought up had to
deal with the importance
of this to avoid
competition. ”
Goldenberg,
Barton, 1995
26. Appreciation
of human touch
The more appreciated
human touch is in a
process, the less
necessary to automate it.
36. “Shaking hands, high
touch appreciated by client
in our region of the state.”
38. “Personal touch is
important.”
27. Value-add of
a process
Whether a certain level of
automation can contribute
the most to value-add
tasks of a process
determines favorite
40. “The ‘value-add’ that
is provided and more
importantly, explained
during the selling process
is a key barrier to full

72
automation decision. automation.”

73
73
Bibliography
Abendshien, J. (2001). Managing the future. Health Forum Journal , 44 (1).
Adesola, S., & Baines, T. (2005). Developing and evaluating a methodology for business process
improvement. Business process management journal , 11 (1), 37.
Adhikar, R. (1995, May). Support Shops Call on Automated Tools. Software Magazine , 15 (5), p. 48.
Ayachitula, N., Buco, M., Diao, Y., & Fisher, B. ( 2007). IT Service Management Automation - An
Automation Centric Approach Leveraging Configuration Control, Audit Vrification and Process
Analytics. IFIP International Federation for Information Processing , 195-198.
Ayachitula, N., Buco, M., Diao, Y., Maheswaran, S., Pavuluri, R., & Shwartz, L. (2007). IT service
management automation - A hybrid methodology to integrate and orchestrate collaborative
human centric and automation centric workflows. IEEE International Conference on Service
Computing .
Bailey, C. A. (2005, Aug). Automation for the masses. Welding Design & Fabrication , 78 (8), p. 15.
Baker, K. (2005, May 25). Ultimus develops innovative tool for prioritizing process automation; process
prioritizer facilicates more informed decision making and reduced risk. Retrieved Dec 3, 2008,
from Business Wire: http://www.businesswire.com/
Blackwell, G. (1988, Aug). Information Technology: automation blues. Canadian Business , 61 (8), p. 73.
Botta, R., & Bahill, A. T. (2007). A Prioritization Process. Engineering Management Journal , 19 (4), 20.
Brown, S. A., Chervany, N. L., & Reinicke, B. A. (2007). What matters when introducing new
information technology. Communications of the ACM , 50 (9).
Bruin, B. d., Verschut, A., & Wierstra, E. (2000). Systematic Analysis of Business Processes. Knowledge
and Process Management , 7 (2).

74
74
Bullen, C. V., & Rockart, J. F. (1981, June). A primer on critical success factors. working paper at Center
for Information Systems Research .
Business Wire. (2005, May). Ultimus Develops Innovative Tool for Prioritizing Porcess Automation;
Process Prioritizer Facilitates More Informed Decision Making and Reduced Risk. Retrieved
from Business Wire: http://www.businesswire.com/
Captaris Inc. (2005). Captaris Workflow. Retrieved from Captaris Inc.:
http://my.captaris.com/forms/Web-WF-Top10-Reasons
Cheung, Y. (1998). Process analysis techniques and tools for business improvement. Business
Management Journal , 4 (4), 274.
Cohen, A. M. (1982, Jun 15). The Growth of Corporate Electronic Banking. Bankers Monthly , 99 (6), p.
20.
Colletti, J. A. (1988, Feb). Integrating computers into the selling process. Small business report , 13 (2),
p. 56.
Crux Automation, Inc. (2006). Special Topics. Retrieved from Crux Automation: http://www.crux-
engineering.com/Special/Reasons_to_Automate.html
CTQ Media LLC. (n.d.). Combining Business Process Management and IT. Retrieved from
BPMEnterprise.com: http://www.bpmenterprise.com/content/c060403a.asp
Davenport, T. H. (1993). Book review: Reengineering the Corporation. Sloan Management Review , 35
(1), 103.
Davenport, T. H., & Beers, M. C. (1995). Managing Information about Processes. Journal of
Management Information Systems , 12 (1).
Davenport, T. H., & Short, J. E. (1990). The new industrial engineering: information technology and
business process redesign. Sloan Management Review , 31 (4).
Davenport, T. H., Jarvenpaa, S. L., & Beers, M. C. (1996). Improving Knowledge Work Processes. Sloan
Management Review , 37 (4), 53.

75
75
Diana Farrell, T. T. (2003). Getting IT spending right this time. The McKinsey Quarterly .
Enbysk, M. (2008). 10 reasons to automate your retail store. Retrieved from Microsoft Small Business
Center: http://www.microsoft.com/smallbusiness/resources/startups/budgeting-expenses/10-
reasons-to-automate-your-retail-store.aspx#reasonstoautomateyourretailstore
Fitts, P. M. (1951). Human engineering for an effective air navigation and traffic control system. Ohio
State University Foundation Report .
Galliers, R. D., & Baker, B. S. (1995). An approach to business process reengineering: the contribution of
socio-technical and soft OR concepts. INFOR , 33 (4), 263.
Gary, K., Lindquist, T., Sauer, H. K., & Ly. (Nov 16-19, 1997). Automated process support for
organizational and personal processes. the International ACM SIGGROUP Conference on
Supporting Group Work (pp. 221-230). Phoenix, AZ, USA : ACM .
Goldenberg, B. (1995, Apr). Re-engineering sales & marketing with advanced information. Sales and
Marketing Management , 147 (4), p. 32.
Grover, V., Teng, J. T., & Fiedler, K. D. (1994). Re-designing Business Processes Using Information
Technology. Long Range Planning , 27 (1), 95.
Grudin, J. (2006, May/June). A Missing Generation: Office Automation/Information Systems and
Human-Computer Interaction. Interactions , 13 (3), pp. p 58-61.
Hanafizadeh, P., Moayer, S., & Rezaei, M. (2008). Defining CSFs for Information Systems Strategic
Planning in Holding Companies: A Case Study of an Iranian Managerial Holding Company.
Journal of Information Technology Case and Application Research , 10 (1), 7.
Harrington, H. J. (1995). Continuous versus breakthrough improvement finding the right answer.
Business Process Re-engineering & Management Journal , 1 (3), 31.
Harrington, H. J. (1998). Performance improvement: the rise and fall of reengineering. The TQM
Magazine , 10 (2), 69.
Hopelain, D. (1983). Flexibility, not productivity. Data processing .

76
76
IDC . (2008/06). U.S. Payroll Outsourcing Services 2008-2012 Forecast and Analysis.
Jamsa-Jounela, S.-L. (2007). Future trends in process automation. Annual Reviews in Control , 31.
Kennedy, D. J. (1988, Nov). Automating Treasury. Corporate Cashflow , 9 (11), p. 45.
Kettinger, W. J., Teng, J. T., & Grover, V. (2000, Jan - Mar). Business Process Change in the 21st
Century. Business & Economic Review .
Kettinger, W. J., Teng, J. T., & Guha, S. (1998). Aligning BPR to Strategy: a Framework for Analysis.
Long Range Planning , 31 (1).
Kettinger, W. J., Teng, J. T., & Guha, S. (1997). Business Process Change: A Study of Methodologies,
Techniques, and Tools. MIS Quarterly , p. 55.
Kettinger, W. J., Teng, J. T., & Guha, S. (1993). Information Technology enabled business process
redesign: an integrated planning framework. OMEGA International Journal of Management
Science , 21 (4), 433-447.
Kettinger, W. J., Teng, J. T., & Guha, S. (1996). Informational Architectural Design in Business Process
Reengineering. Journal of Information Technology .
Kuhl, C. (2008, Jul 28). There's More to Automate. Broadcasting & Cable , 138 (29), p. 28.
Majors, L. J. (1988). An analysis of certain factors contributing to the automation of school library media
technical and user services. Dissertation, Georgia State University, College of Education.
Miron, M., Bradicich, K., Hall, G., & Cecil, J. (1988, Oct 01). The Myths and Realities of Competitive
Advantage. Datamation , 34 (19), p. 71.
Parasuraman, R., Scheridan, T. B., & Wickens, C. D. (2000). A Model for Types and Levels of Human
Interaction with Automation. IEEE Transactions on Systems, Man, and Cybernetics , 30.
Parasuraman, R., Sheridan, T., & Wickens, C. (2000). A model for types and levels of human interaction
with automation. IEEE Transactions on Systems , 30 (3), 286-97.
Price, H. E. (1985). The allocation of functions in systems. Human Factors , 27, 33-45.

77
77
Richardson, H. L. (1991, October). Computers support container movement. Transportation &
Distribution , 32 (10), p. 40.
Riemenschneider, C. K., Harrison, D. A., & Mykytyn Jr., P. P. (2001, December). Understanding IT
adoption decisions in small business: integrating current theories. Information & Management .
Rosenthal, S. A. (2007, Feb). Combining benefits with other total compensation processes under one roof.
Workspan , p. 65.
Scherr, A. L. (1993). A new approach to business processes. IBM Systems Journal , 32 (1).
Schmidt, W. E. (1975). Decision Day for Automating. Retrieved from the Cartography and Geographic
Information Society : http://www.mapcontext.com/autocarto/proceedings/auto-carto-
2/pdf/decision-day-for-automating.pdf
Sheridan, T. B. (2000). Function allocation: algorithm, alchemy or apostasy. International Journal of
Human-Computer Studies , 203-216.
Sheth, A. (1-2 Sept. 1997). From contemporary workflow process automation to adaptive and dynamic
work activity coordination and collaboration. Database and Expert Systems Applications, 1997.
Eighth International Workshop on , (pp. 24 - 27).
Statton-Smith, C. (1986, Aug). Sales Force Automation. Canadian Datasystems , 18 (8), p. 42.
SuccessFactors, Inc. (2008). 9 Critical Reasons to Automate Performance Management (for SMBs).
Retrieved from SuccessFactors, Inc.: http://www.successfactors.com/docs/automate-performance-
management/smb/
Talluri, S. (2000). A benchmarking method for business-process reengineering and important.
International Journal of Flexible Manufacturing Systems , 12 (4), 291.
Tedre, M. (2008, Sep & Oct). What should be automated? Interactions , pp. 47 - 49.
Tedre, M., Sutinen, E., Kahkonen, E., & Kommers, P. (2006). Ethnocomputing: ICT in cultural and social
context. Communications of the ACM , 49 (1).
Vollmer, K. (2008). The EA View: BPM Has Become Mainstream. Forrester Research, Inc.

78
78
Wang, M., & Wang, H. (2006). From process logic to business logic --A cognitive approach to business
process management. Information & Management .
Wei, Z., Macwan, A., & Wieringa, P. Experimental investigation on mental load and task effect on
system performance. Proceedings of 6th IFAC/IFIP/IFORS/IEA Symposium on Analysis, Design
and Evaluation of Man-Machine Systems. Oxford, UK: Pergamon.
Yang, D.-H., Kim, S., Nam, C., & Min, J.-W. (2006, May). Developing a decision model for business
process outsourcing. Computers & Operations Research .
Ylijoki, J. (2007, Nov). Process automation in the future: shall we see a revolution like the last fifty
years? International Paperworld IPW , pp. 60-62.
Zairi, M., & Sinclair, D. (1995). Business process re-engineering and process management: a survey of
current practice and future trends in integrated management. Management Decision , 33 (3), 3-16.