process simulation and parametric study of a …saiche.co.za/files/filedoc/v19 n2 2014 pp...
TRANSCRIPT

South African Journal of Chemical Engineering, vol. 19, 2014, no. 2, pp 18-31 18
Process Simulation And Parametric Study Of A Biogas Upgrading Plant Using Gas
Permeation Technique For Methane Enrichment
Masebinu Samson, Aboyade Akinwale, Muzenda Edison
University of Johannesburg, Chemical Engineering
University of Johannesburg, Process, Energy and Environmental Technology Station
Keywords :Biogas cleaning, Methane enrichment, Parametric study, Membrane, Gas
processing cost
Abstract- An operational biogas upgrading plant with cleaning process and methane (CH4)
enrichment has been presented in this study. Parametric study was carried out to investigate
the effect of varying the operating conditions on CH4 recovery, product purity and gas
processing cost (GPC). Double stage with permeate recycle gave a good approximation of the
plant upgrading result. An increase in %CO2 in the feed composition from 10-60% reduces
the CH4 recovery by 4.1%. Increase in membrane selectivity from 5.6 to 33.33 increased CH4
recovery by 7.11% and reduced the membrane area required for separation by 47.73%.
Pressure increase also increased CH4 recovery up to the module design configuration limit.
Increasing feed flow rate from 80-140m3/h increased CH4 recovery by 6.2% with 2.6%
increase in membrane area. The GPC at optimal condition was $0.36/Nm3 with 96% CH4
recovery and 91% product purity.
INTRODUCTION
The development of renewable energy has attracted a great deal of interest not only because of the steady rise in
oil prices, but also because of the limit of fossil fuel reserves and its impact on the climate (Drapcho et al.,
2008). Global perception on climate change has increased research on environmentally friendly energy sources
that mitigate the production of greenhouse gas emissions. To reduce greenhouse gas emission and secure long-
term energy supply globally, our exploitation of the earth’s finite resource such as fossil fuel must be reduced,
while renewable energy must be developed as alternatives. The proportion of energy generated from renewable
resources is expected to increase to >20% by 2020 (Deng & Hagg, 2010). During the same period, the
greenhouse gas should decrease by 14% in 2020 compared with 2005 (Deng & Hagg, 2010). The use of biogas
is considered as one of the most efficient means of utilizing the renewable energy and reducing greenhouse gas
emission.
Biogas is typically produced from the anaerobic decomposition of organic matters by bacteria (Makaruk et al.,
2010; Masebinu et al., 2013). The decomposition caused by bacteria can occur at landfills, sewage treatment
plants (sludge fermentation stage) and sites with agricultural and industrial organic waste (Johansson, 2008;
Ryckebosch et al., 2011). For an optimal biogas yield, suitable operating temperature range of 30-40°C for
mesophilic digestion is required and 50-60°C for thermophilic digestion (Karagiannidis & Perkoulidis, 2009).
Other conditions which can improve the quality and volume of biogas produced are factors of; concentration of
feedstock, feed material composition, hydraulic retention time, pH value, carbon-nitrogen ratio, toxicity,
agitation, air tightness and moisture content (Kigozi et al., 2014; Zhang et al., 2006).
Biogas is a renewable fuel which is environmentally friendly when used. It is cheaply sourced and versatile
(Chandra et al., 2012). Biogas comprises of mainly methane (CH4), carbon dioxide (CO2), and smaller traces of
acidic gases and impurities such as hydrogen sulphide (H2S), nitrogen (N2), water vapour (H2O) and traces of
other volatile organic gases (VOCs) (Chmielewski et al., 2013). The precise concentration of these gases in any
particular biogas sample depends on the source of substrate and operating process conditions, however, of the
reported range is typically 40-70% vol. of CH4 while CO2 and other trace gases takes up the remaining
percentage volume (Chmielewski et al., 2013). CH4 is a greenhouse gas which when released to the atmosphere
has a global warming potential which is 21 times as that of CO2 (Dirkse, 2008). The earliest strategy of
disposing excess biogas was burning it as a waste gas and only a small portion of it was been utilised to provide
heat (Shao et al., 2012). Due to the global call for reduction in greenhouse gas emissions and increasing demand
for cleaner forms of energy, biogas have been applied to more productive energy uses. In Brazil, biogas is
South African Journal of Chemical Engineering, vol. 19, 2014, no. 2, pp 18-31 19
mainly used as substitute for petrol and diesel in the automotive sector while in Germany, electricity generation
has up till recently being the main application of biogas production (Mitzlaff, 1988). Increasingly, the focus has
been shifting to upgrading biogas to fuel grade biomethane, for use as vehicular fuel (Eriksson & Olsson, 2007).
Biomethane creates lesser emissions when compared to other fossil based transport fuels like petrol and diesel.
Well-to-wheel (WTW) life cycle analysis for gasoline vehicles indicated that 170-190g CO2,eq/Km is emitted
while for compressed biogas (CBG) vehicles, it ranges from -180-90g CO2,eq/Km depending on the source and
type of substrate used to produce the biogas (Edwards et al., 2011). The use of biogas as a substitute for
transport fuel is also reported to have economic advantages over its use in power or heating applications
(Murphy et al., 2004).
Upgrading biogas to fuel grade biomethane involves two major processes; cleaning and CH4 enrichment. The
cleaning of the biogas consists of removal of acidic gases and impurities, while the enrichment process is for
separation of CO2 from biogas. The removal of trace impurities and the elimination of CO2 from the biogas,
which leads to a corresponding increase in CH4 concentration will not only increase the calorific value of the
biogas, but will also, reduce corrosion of combustion engine parts caused by acid gas components. After
upgrading, the final product is referred to as biomethane, typically containing 90-99% CH4 and 1-3% CO2
which makes it suitable as vehicular fuel. Current technologies for cleaning of biogas and its subsequent CH4
enrichment are physiochemical processes which can be grouped as follows (Ahmad et al., 2012)
• Absorption process (physical and chemical absorption)
• Hybrid solution (mixed physical and chemical solvent)
• Physical separation (adsorption on solid surface; membrane; cryogenic)
Each of the mentioned technologies, except for cryogenic separation process, are in operation on large scale and
can deliver biomethane that meets vehicular fuel standard (Ryckebosch et al., 2011). The use of membranes,
which is the main technology of interest in this study, exhibit many advantages in comparison to other
conventional method of biogas upgrading, including lower operation cost, easier maintenance and greater
process flexibility, no need for chemicals, and the absence of phase and temperature changes, which results in
low energy requirement (Chmielewski et al., 2013; Chowdhury, 2011; Masebinu et al., 2013). Despite these
advantages, it is difficult for membrane permeation systems to compete with the more common absorption
based processes such as amine scrubbing, especially when processing high volumes of biogas (Makaruk et al.,
2010). Higher CH4 losses generated by membrane systems increases the biogas processing cost (Makaruk et al.,
2010). However, the CH4 lost during the upgrading process of biogas obtained from anaerobic digesters, can be
used as fuel for heat generation since anaerobic digestion typically requires higher than ambient temperature for
optimal operation (Makaruk et al., 2010).
Recently, many simulation-based research results have been published on CH4 enrichment using membranes
without consideration of the pre-cleaning process. Most of such studies are based on theoretical and laboratory
test performed using a model gas mixture containing CO2 and CH4 (Harasimowicz et al., 2007; Lock et al.,
2014; Scholes et al., 2012; Tin et al., 2004). Kim and Lee (2004) simulated a CO2 separation process for hollow
fiber membrane with and without permeate recycle by incorporating FORTRAN into Aspen plus. It was
determined that large amounts of CO2 could be separated from the mixed gas if more hollow fiber bundle area
was provided during enrichment. The optimum conditions for CO2 separation process were obtained by
analysing the design and operation parameters when energy required was lowest. Makaruk et al. (2010)
simulated a biogas upgrading process based on membranes, using numerical modelling. The work proposes a
basic concept for integrating membrane separation into biogas plants while taking into account the permeate
utilisation and heating requirement of the plant. Improvement on membrane material and structural design over
permeability and selectivity was recommended. Ahmad et al. (2012) developed a two dimensional cross flow
mathematical model for simulating various membrane configurations. The sensitivity analysis carried out
indicated that a double stage configuration with permeate recycle has the minimum gas processing cost with
considerable high CH4 recovery. Belaissaoui et al. (2012) performed a systemic parametric analysis for the
energy requirement of a single stage membrane gas separation module for CO2 capture. A multistage
configuration was preferred over a single stage if the process is to achieve 90% CO2 purity and 90% CO2
recovery when the feed CO2 mole fraction is less than 10%. Reducing the CO2 recovery ratio can significantly
decrease the energy requirement of the process. Shao et al. (2012) simulated a two stage membrane system with
a dedicated cleaning process to remove acidic gases using temperature swing adsorption system (TSA). The gas
processing cost which includes the capital cost and operating cost for using a multi component progressive cell
balance solution algorithm incorporated into Aspen Hysys. An increase in the recycle ratio increased the
membrane area and compressor power required while improving the CH4 recovery for a high CO2 feed
concentration and low membrane selectivity. Chmielewski et al. (2013) investigated the membrane separation of
South African Journal of Chemical Engineering, vol. 19, 2014, no. 2, pp 18-31 20
binary gas mixture of CO2/CH4 and also extended the research work to include a plant study where biogas from
agricultural waste was used. A cleaning process was integrated into the plant upgrading operation. Parametric
study investigating the effect of feed pressure and stage cut was conducted on the membrane separation process.
It was reported that an increase in feed pressure increased the CH4 concentration in the product stream while a
stage cut below 50% was recommend to yield the desired CH4 recovery. The process was efficient with <5%
vol. CH4 in the permeate stream (waste stream), low in energy consumption and compact.
Of all the literature reviewed, only Chmielewski et al. (2013) and Shao et al. (2012) considered a cleaning of the
gas mixture before enrichment. Membrane separation was more commonly presented as a process for CH4
enrichment alone. However, it is arguably important to consider biogas composition as it is been generated from
source. The removal of impurities and acidic gases is also vital from an operational point of view. This work
therefore presents an operational study of an existing biogas upgrading plant with descriptive detail of the
cleaning process and simulation of possible membrane configuration of the plant for CH4 enrichment. Feed
composition, operating pressure and feed flow rate are the most critical process parameters that affect upgraded
biogas quality and CH4 recovery in a biogas upgrading process. A parametric study investigating the effects of
variations of these parameters was conducted, with a view to determine optimal conditions for maximising the
concentration of CH4, its recovery and the required compressor power. The gas processing cost (GPC) was
estimated on the optimal configuration and process condition.
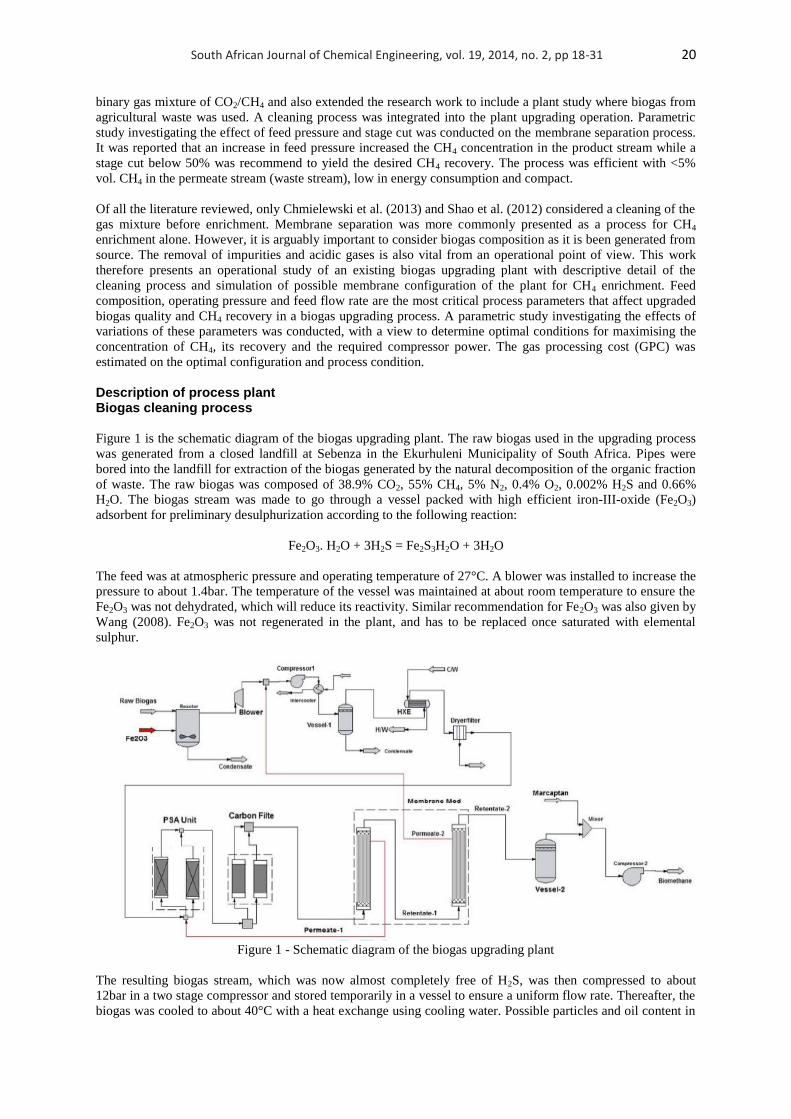
Description of process plant Biogas cleaning process Figure 1 is the schematic diagram of the biogas upgrading plant. The raw biogas used in the upgrading process
was generated from a closed landfill at Sebenza in the Ekurhuleni Municipality of South Africa. Pipes were
bored into the landfill for extraction of the biogas generated by the natural decomposition of the organic fraction
of waste. The raw biogas was composed of 38.9% CO2, 55% CH4, 5% N2, 0.4% O2, 0.002% H2S and 0.66%
H2O. The biogas stream was made to go through a vessel packed with high efficient iron-III-oxide (Fe2O3)
adsorbent for preliminary desulphurization according to the following reaction:
Fe2O3. H2O + 3H2S = Fe2S3H2O + 3H2O
The feed was at atmospheric pressure and operating temperature of 27°C. A blower was installed to increase the
pressure to about 1.4bar. The temperature of the vessel was maintained at about room temperature to ensure the
Fe2O3 was not dehydrated, which will reduce its reactivity. Similar recommendation for Fe2O3 was also given by
Wang (2008). Fe2O3 was not regenerated in the plant, and has to be replaced once saturated with elemental
sulphur.
Figure 1 - Schematic diagram of the biogas upgrading plant
The resulting biogas stream, which was now almost completely free of H2S, was then compressed to about
12bar in a two stage compressor and stored temporarily in a vessel to ensure a uniform flow rate. Thereafter, the
biogas was cooled to about 40°C with a heat exchange using cooling water. Possible particles and oil content in
South African Journal of Chemical Engineering, vol. 19, 2014, no. 2, pp 18-31 21
the biogas were removed by passing it through a mechanical filter and an oil separator because the compressor
was oil based for lubrication. A pressure swing adsorption (PSA) unit with activated alumina (Al2O3) was used
for completed dehydration of the biogas. The N2, siloxane, possible H2S and other traces of volatile organic
gases (VOCs) were adsorbed using an activated carbon filter. All unit operations up to this point were
considered part of the cleaning process. The resulting biogas has about <5% vol. N2, 1ppm H2S and ppb levels
for VOCs and siloxanes which is deemed not harmful to the membranes in the subsequent enrichment process.
Methane enrichment
The most important task required to achieve fuel grade biomethane is the separation of CO2 from the product
gas stream. The plant studied used cascade configuration of hollow fiber membrane for the separation of CO2
from the biogas to achieve the desired fuel grade biomethane. The first membrane module was fed from the bore
side at 10.311bar & 36°C as shown in Figure 1. The permeate stream of the first membrane module which
leaves at about 1.082bar was used to purge the PSA unit. The retentate stream exit the membrane at 8.82bar and
a slight temperature drop, with a high concentration of CH4. This serves as the feed stream for the second stage
separation. A sampling point is available for each membrane module. Gas species of the product stream can be
randomly evaluated and the composition of gases through the membrane can be known. The permeate stream of
the second membrane module, which contains significantly higher amounts of CH4 as compared to permeate of
the first stage, was recycled back for recompression through the suction of the compressor. Biomethane produce
during the second stage separation is the desired product which is stored into a vessel after which it was
odourised with mercaptan as a safety procedure and for leak detection. The last stage is compression of the
biomethane to 220bar into high pressure cylinders.
Methodology Process simulation The simulation of the cleaning and enrichment process was done using ChemCAD, a steady state process
simulator, from Chemstation. The PSA unit, a dynamic and unsteady state process, was represented with a
component separator unit operation and was constrained to plant result for H2O and H2S removal. The cleaning
process according plant data effectively eliminated vapour and H2S content in the biogas while N2 was reduced
to acceptable limit; hence in the enrichment process simulated, CO2 and CH4 were only considered.
Data collection The process operating conditions were data collected from the plant. The membrane intrinsic properties
(selectivity and permeability), configurations and module design data were not shared due to intellectual
property infringement and confidentiality concerns. Intrinsic properties were gotten from literature while the
module design data was provided by Almeesoft Engineering, USA. The module design data were verified by the
plant manager and was accepted to be inconformity with industrial standard.
Membrane module design and simulation validation
A built-in membrane model for gas permeation available in ChemCAD 6.5.5 was used for the CH4 enrichment.
Almeesoft Engineering gas permeation software was also interface with ChemCAD during sensitivity analysis
to study the effect of variation in process conditions on CH4 recovery and compressor power requirement. The
important process parameter specified for the simulation of the membrane is given in Table 1 and represents
base condition for the simulation.

South African Journal of Chemical Engineering, vol. 19, 2014, no. 2, pp 18-31 22
Table 1
Process parameter for membrane simulation
Parameter
Feed pressure 9.9bar
Permeate pressure 1.08bar
Feed flow rate 80m3/h
Flow mode Counter-current
Feed side bore
Temperature 30°C
Compressor stages 2
Cooling medium water
CO2 permeability 440 Barrera
CH4 permeability 28.2 Barrera
N2 permeability 35.6 Barrera
O2 permeability 111 Barrera
CO2/CH4 selectivity 15.6a
CO2/N2 selectivity 12.4a
CH4/N2 selectivity 0.79a
CO2/O2 selectivity 3.96a
Account for shell pressure drop yes a(Harasimowicz et al., 2007)
Two membrane configurations was considered for this study; single stage without recycle (SSWR) and double
stage with permeate recycle (DSPR) as shown in Figure 2. The configurations were simulated to determine
which gave a good approximation to the plant upgrading result. The following assumptions were considered for
the hollow fiber membrane module for the study. (1) Transport properties of the membrane are independent of
variation in gas composition throughout the separation. (2) No flux coupling between gas components. (3)
Deformation of the hollow fiber under pressure is negligible. Based on these assumptions, sensitivity analysis
was carried out on the best configuration to determine the optimal process conditions and the results were
discussed.
The membrane data for each module was computed based on the module specification provided by the end user
into the simulation. Parameters considered in the membrane module design are as listed in the Table 2. The
process simulation for the cleaning and CH4 enrichment process was validated by the plant upgrading process
result.
Table 2
Membrane module design parameters
Properties Units
Fiber internal diameter 220.98 μm
Fiber outer diameter 370.84 μm
No. of fibres 10,000
Active length 1.1 m
Membrane area per module 11.6293 m2
Pot length 0.0509 mm
No. of shell 1
CO2 viscosity 0.0153 cp
Packing porosity 73.8% %
Module housing Stainless steel

South African Journal of Chemical Engineering, vol. 19, 2014, no. 2, pp 18-31 23
Figure 2 - Schematic diagram of the membrane configuration having (A) Single stage without recycle (SSWR),
(B) Double stage with permeate recycle (DSPR)
Process economics
The processing cost for biogas could be expressed as the cost per cubic metre of feed after cleaning (removal of
trace impurities) if it is meant for domestic use. It will be unjustifiable to measure the processing cost of biogas
used as vehicular fuel as cost per cubic meter of feed due to the high volume of non-combustible CO2 present in
the biogas. Therefore, processing cost per cubic meter of product after upgrading will be considered. For natural
gas, the upgraded natural gas is sold on the basis of product volume rather than on the feed volume (Ahmad et
al., 2012; Hao et al., 2002).
The two membrane configurations considered were based on economic consideration and end use of the
product. On economic consideration, three important elements are considered; the cost of membrane plant
(membrane element and pressure housing); the capital and operating cost; and product losses. The economic
assessment of any given separation process varies in different location as well as the values assigned to the
selected economic parameters used. Hao et al. (2008) procedure for calculating natural gas processing cost
(GPC) was modified to include the cleaning cost for biogas upgrading process as presented in Table 3. The
cleaning cost is largely dependent on the composition and volume of the biogas to be treated (Hao et al., 2002).
The cleaning cost for removal of vapour and other acidic gases except CO2 was reported to be within the range

South African Journal of Chemical Engineering, vol. 19, 2014, no. 2, pp 18-31 24
of 30-100% of the capital cost of the membrane unit (Hao et al., 2002). The pre-treatment process consists of a
Fe2O3 adsorbent, heat exchanger, an Al2O3 dehydrant and activated carbon. The plant used in this study was a
small scale plant with a capacity of producing 100m3/h of biomethane hence, 80% of the membrane unit cost
was considered as the cost for the pre-treatment process. Post-treatment cost was not considered since there was
no regeneration process for sulphur recovery from Fe2O3. Final compression cost, mercaptan cost for
odourization and high pressure cylinder cost was also not considered for this calculation. Assumptions made to
simplify the evaluation of the GPC were as summarised in Table 3. The optimum membrane configuration i.e.
which gave an approximate result of the plant upgrading process, was investigated both from process design and
economic assessment studies. The assessment focuses on the effect of increasing CO2 in feed, feed pressure and
feed flow rate on the GPC.
Table 3
Economic parameters and assumptions for gas processing costa
Total plant investment cost (TPI)
Total membrane module cost (MC)b MC = $125/m2
Pre-treatment cost (PTC) PTC = 0.8 x MC Vessel cost (VC)
c VC = 2400 x 50.5
Installed compressor cost (CC) CC = $8650 x (HP/ƞ)^0.82 Fixed cost (FC) FC = MC + PTC + CC + VC
Base plant cost (BPC) BPC = 1.12 x FC Project contingency (PC) PC = 0.20 x BPC
Total facilities investment cost (TFI) TFI = BPC + PC Start-up cost (SC) SC = 0.10 x VOM
TPI = TFI+ SC Annual variable operating and maintenance cost (VOM)
Contract and material maintenance cost (CMC) CMC = 0.05 x TFI Local taxes and insurance (LTI) LTI = 0.015 x TFI
Direct labour cost (DL) $15/h Labour overhead cost (LOC) LOC = 1.15 x DL
Membrane replacement cost (MRC) $63/m2 Utility cost (UC) $0.07/KWh
VOM = CMC + LTI + DL + LOC + MRC+UC
Annual Cost of CH4 lost in permeate stream (CH4LS)
Annual biogas lost (BGLS) BGLS =365 x OSF x Lf x Yp(CH4) x Xp(CH4)
CH4LS = BGLS x BGHV x BGWP
Gas processing cost (GPC)
Annual capital related cost (CRC) CRC = 0.2 x TPI
GPC = ((CRC + [CH]_4LS + VOM)) /[365xOSF L_f x(1-SCE)x24]
Other assumptions
Membrane life (t) 5 years
Price of biomethane (BGWP) $0.2/Nm3
Heating value of biogas (BGHV) 34.37MJ/m3
On-stream factor (OSF) 96%
Compressor efficiency (ƞ) Ƞ = 0.80 a(Hao et al., 2008),
b(Shao et al., 2012),
c(Sinnott, 2005)
GPC includes the capital related cost (CRC), the variable operating and maintenance cost (VOM) and the cost of
CH4 lost in the permeate stream (CH4LS). If digesters were used for biogas generation, the cost of CH4LS can
be deducted from the GPC since the permeate stream will serve as a fuel to heat up the digester and as such not
a waste process stream. The plant compressor was a two stage compressor with intercoolers using water as a
cooling medium. The compressor power was estimated for each condition simulated by the expression (Ahmad
et al., 2012).
Wcp(HP) = RgT Σi2Vp,n ln(Ph/Pl,n) x1.341
Compressor power (Wcp), universal gas constant (Rg), temperature (T), permeate flow rate (Vp), index of stage
configuration (n), retentate pressure (Ph) and permeate pressure (Pl).

South African Journal of Chemical Engineering, vol. 19, 2014, no. 2, pp 18-31 25
RESULT AND DISCUSSION
Process simulation validation Table 4 shows the simulation result against plant upgrading result. The plant had 91.16% CH4 recovery with
87.2% CH4 purity. The two proposed configurations for this analysis were simulated to determine which gave a
good approximation of the plant data. SSWR yielded 87.47% CH4 recovery with 77.89% CH4 purity while
DSPR yielded 89.01% CH4 recovery with 84.59% CH4 purity. The simulated DSPR process suggests a good
approximation to the plant data with a percentage error of 2.64%. The error in the comparison could be
attributed to higher CO2/CH4 selectivity of the plant membrane and feed pressure drop within the membrane
module. A 3-stage configuration may result in better separation (Deng & Hagg, 2010) but the complexity of the
process variable control, an extra compressor requirement and costs limited its application, thus it was not
considered in this study. Sensitivity study was carried out on DSPR to study the effect of varying process
operating condition on CH4 recovery and compressor power requirement.
Table 4 :Validation of the process simulation with plant data
Plant result Simulated result
Final
stage SSWR DSPR
Initial
stage
Final
stage
Feed Permeate
Retentate
(Sale gas)
Permeate Retentate
Mixed feed
with
recycle
Compr Discharge
/cleaned
Feed 1
Permeate Retentate
Permeate
to recycle
Retentate
(product)
Flow
(m3/hr) 80.000 23.000 46.000 30.060 49.410 98.550 98.030 33.210 64.820 18.560 46.300
Pressure (bar)
1.000 1.802 8.280 1.080 9.400 1.000 9.900 1.500 9.230 0.800 8.769
Av.
Mol.
Wt.
27.606 31.847 18.384 38.501 21.079 28.890 28.949 39.594 23.496 34.426 19.111
CH4
(%mol.) 55.000 40.120 87.200 18.351 77.892 50.660 50.934 14.657 69.518 31.947 84.590
CO2
(%mol.) 38.934 53.997 4.900 79.201 14.854 43.626 43.862 83.265 23.677 63.843 7.563
N2 (% mol.)
5.000 4.543 7.693 2.049 6.849 4.756 4.756 1.685 6.329 3.566 7.437
O2
(%mol.) 0.4000 0.964 0.265 0.399 0.405 0.446 0.448 0.393 0.476 0.643 0.410
H2S
(%mol.) 0.002 0.000 0.000 0.000 0.000 0.000 0.000 0.000 0.000 0.000 0.000
H2O (%mol.)
0.661 0.372 0.005 0.000 0.000 0.000 0.000 0.000 0.000 0.000 0.000
Heat values (BTU/SCF)
HHV 967.4 202.9 882.0 130.4 861.2 LLV 870.9 182.7 794.0 117.3 775.3
% CH4
Recovery 91.16 87.47 89.01
Methane recovery Effect of %CO2 in feed Figure 3a shows the effect of increased %CO2 content in the feed on CH4 recovery. 90.5% CH4 recovery was
achieved with 10% CO2 in the feed stream requiring 51.75m2 of membrane area. As the CO2 concentration was
increased to 60%, CH4 recovery reduces as well as purity of product but with an increase in membrane area.
53.58m2 membrane area was required to achieve 86.84% CH4 recovery. The CH4 purity in the product stream
reduced from 90.6% to 81.82% as CO2 increased from 10% to 60% in the feed as shown in Table 5. It was also
observed that an increase in CO2 in the feed increased CH4 loss from 9.5% to 13.1% in the permeate stream of
the first stage membrane separation. Increase in CO2 in feed increased the amount of CO2 permeating through
the membrane as well as the CH4 hence a higher CH4 loss. Also it was observed that as the %CO2 increases in
the feed, the %CH4 in the permeate/recycled stream of the second stage separation decreases. This reduces both
the concentration of CH4 in the product and its recovery. Also the reduction in product purity could be attributed
to insufficient membrane area for separation as compared to the percentage increase of CO2 in the feed as shown
in Table 5.

South African Journal of Chemical Engineering, vol. 19, 2014, no. 2, pp 18-31 26
Figure 3 - Effect of variation of process parameters on CH4 recovery
Figure 3a – Effect of %CO2 in feed, 3b - Effect of feed pressure, 3c – Effect of membrane selectivity, 3d –
Effect of feed flow
Table 5 :Effect of increased %CO2 in the feed a
%
CO2
In
feed
%CH4
in feed
Feed
Flow (m3/h)
%CH4
In product
Product Flow
rate
(m3/h)
%CH4
recovery
Purge
Flowrate (m3/h)
%CH4
In purge
%CH4
lost
%CH4
In recycle
Recycle
flow Rate(m3/h)
%CH4
In recycle
Area
(m2)
10 83.93 80.00 90.69 66.99 90.48 12.47 51.24 9.52 60.41 10.89 9.80 51.75
20 73.93 80.00 88.03 60.48 90.01 18.99 31.11 9.99 45.65 13.87 10.70 52.95
30 63.93 80.00 86.03 53.21 89.50 26.26 20.46 10.51 37.11 16.47 11.95 52.95 40 53.93 80.00 84.43 45.41 88.86 34.06 14.11 11.14 31.44 18.79 13.69 53.12
50 43.93 80.00 63.10 37.23 88.03 42.23 9.95 11.96 27.49 20.75 16.23 53.14
60 33.93 80.00 81.82 28.81 86.84 50.66 7.05 13.16 24.86 22.12 20.26 53.58
aN2 balances the feed composition
Effect of feed pressure
Figure 3b shows the effect of feed pressure on CH4 recovery. The process condition and membrane shell data
remains the same as earlier described except for the feed pressure been varied. It was observed that increasing
the feed pressure increased CH4 recovery until a limit was reached where further increase in the pressure does
not improve the CH4 recovery rate. As the feed pressure increases from 10bar to 30bar, the CH4 recovery
increases rapidly from 90.4% to 92.7% and thereafter the increase in pressure causes only a negligible increase
in CH4 recovery. The increase in CH4 recovery was due to fact that the increased pressure creates a greater
driving force across the membrane surface area. As a result, a net increase in permeation through the membrane
increases CH4 recovery. At lower pressure, the high packing density advantage of hollow fiber membrane in
DSPR configuration becomes increasingly important due to the high membrane area available hence higher
purity can still be achieved. The almost constant CH4 recovery after its peak limit in this case 40 bar is due to
the membrane module design. Improving the overall structural design will increase the membrane performance
with

South African Journal of Chemical Engineering, vol. 19, 2014, no. 2, pp 18-31 27
variation in process condition (Makaruk et al., 2010). This suggests that achieving high CH4 recovery does not
only depend on improving the process condition but also ensuring that an appropriate equipment design is
implemented to accommodate changes in process condition. Aside the higher CH4 recovery achieved as the feed
pressure increases, a reduction in membrane area was also observed as shown in Figure 3b. As the feed pressure
increases from 10-30bar, the membrane area decreases from 57.6m2 to 19.6m
2. The reduction in area can be
attributed to greater driving force of CO2 molecules across the membrane surface area. The almost constant area
after 20bar also shows that the module design can only show significant CH4 recovery and membrane area
reduction between 20 and 30bar. Further increase in pressure causes fluctuation in membrane area. It may be
economically justified in some circumstances to increase the compression pressure of the feed stream to reduce
membrane area cost and improve recovery but the structural design of the membrane casing to safely
accommodate such pressure must be considered. Hence a feed pressure of 20bar will be considered as an
optimal and safe operating pressure based on the module design.
Effect of membrane selectivity Membrane intrinsic properties have high influence on CH4 recovery which increases with the increase in the
selectivity of the membrane (Ahmad et al., 2012). Figure 3c shows the effect of selectivity on CH4 recovery. An
increase in the membrane selectivity from 15.8 to 33.3, while other process conditions were held constant,
resulted in a spontaneous increase in the CH4 recovery from 88.9% to 95.3%. CH4 concentration in the purge
stream was reduced by 50% with a reduction in the purge flow rate. It was also observed that the product purity
increased from 84.6% to 85.3% as selectivity increased from 15.6 to 23.3. A reduction in product purity to
82.7% was observed as selectivity increases to 33.6. This reduction could be attributed to selectivity properties
of the membrane toward CO2. It has been reported in literature that highly permeable polymers have low
selectivity and vice versa (Kanehashi et al., 2010). Hence a general trade off relationship between permeability
and selectivity is required in an industrial operation. Aside increase in CH4 recovery, increasing the selectivity
reduces the membrane area required for separation as shown in Figure 3c. With CO2/CH4 selectivity of 15.6, the
membrane area required to achieve 88.9% CH4 recovery was 53.4m2 while at a selectivity of 33.3, 27.4m
2 was
required to achieve 95.3%CH4 recovery.
Feed flow rate Figure 3d shows the effect of increasing feed flow rate on CH4 recovery. The plant been studied has the capacity
to produce between 20-100m3/h biomethane. The base feed flow rate been used for this study was 80m
3/h. As
the feed flow rate increases from 80m3/h to 140m
3/h, CH4 recovery increased from 88.86% to 94.37% with the
product flow rate peaking at 100.53m3/h. This shows that if the plant is operating at full capacity, more CH4 will
be recovered in the process and CH4 lost will be reduced. A reduction in CH4 loss will reduce the GPC as will
be discussed in subsequent section. As the feed flow rate increases, a reduction in CH4 concentration in the
product was observed. The concentration reduced from 85.02% to 72.29%. This reduction in product purity was
attributed to insufficient membrane area to facilitate the separation. The membrane area increased by 2.6% from
53.2m2 to 54.6m
2 which were considered not sufficient for the volume of biogas to be enriched in CH4.
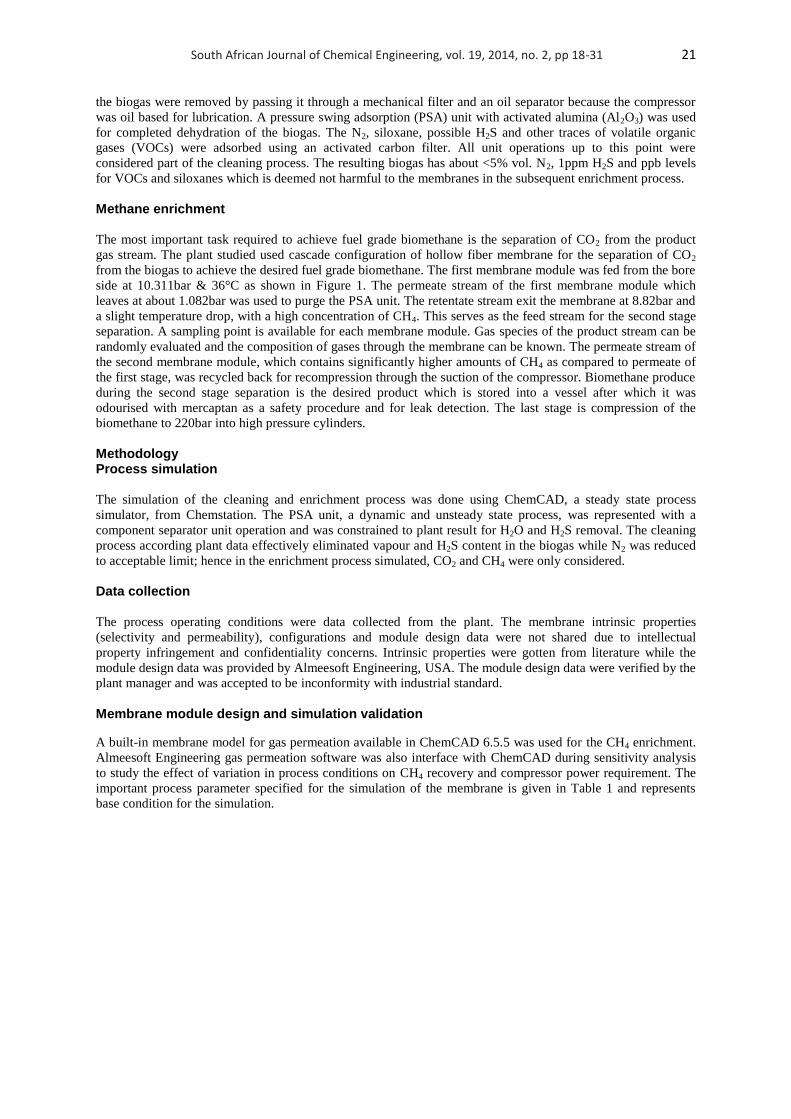
Compressor power requirement The effect of feed composition on compression power required for the DSPR configuration has been
investigated. Figure 4a and 4b shows the effect of increased %CO2 in feed and feed pressure on compressor
power required for separation. As CO2 increases in the feed stream from 10-60%, an increase in the feed
pressure will be required to achieve the desired CH4 recovery. The required power per pressure increase is the
minimum driving force to ensure that CO2 permeate through the membrane surface area available and the target
CH4 recovery was achieved. Continuous increase of CO2 increases the compression power from 17hp to 53hp.
Increasing feed pressure, 10-50bar, increased the required compressor power from 40hp to 70hp. As earlier
discussed, increasing feed pressure reduces the required membrane area but the limit of the feed pressure
depends on the membrane module design pressure capacity. From the simulated conditions the optimal
operating pressure is 20bar to keep the energy requirement low.
Increasing feed flow rate increased the compressor power required for separation as show in figure 4c. As the
feed flow rate increases from 80m3/hr to 140m3/hr, %CO2 in the recycled stream increased from 60.62 to
79.18%. As earlier discussed, increasing CO2 in the suction of the compressor increases the required power for
membrane separation to achieve the desired CH4 recovery.
South African Journal of Chemical Engineering, vol. 19, 2014, no. 2, pp 18-31 28
Figure 4 - Effect of process variables on compressor power
Figure 4a – Effect of feed composition, 4b – Effect of feed pressure, 4c – Feed flow rate
The result of the parametric sensitivity analysis is consistent with previously published simulated work of
Chmielewski et al. (2013), Ahmad et al. (2012) and Deng and Hagg (2010).
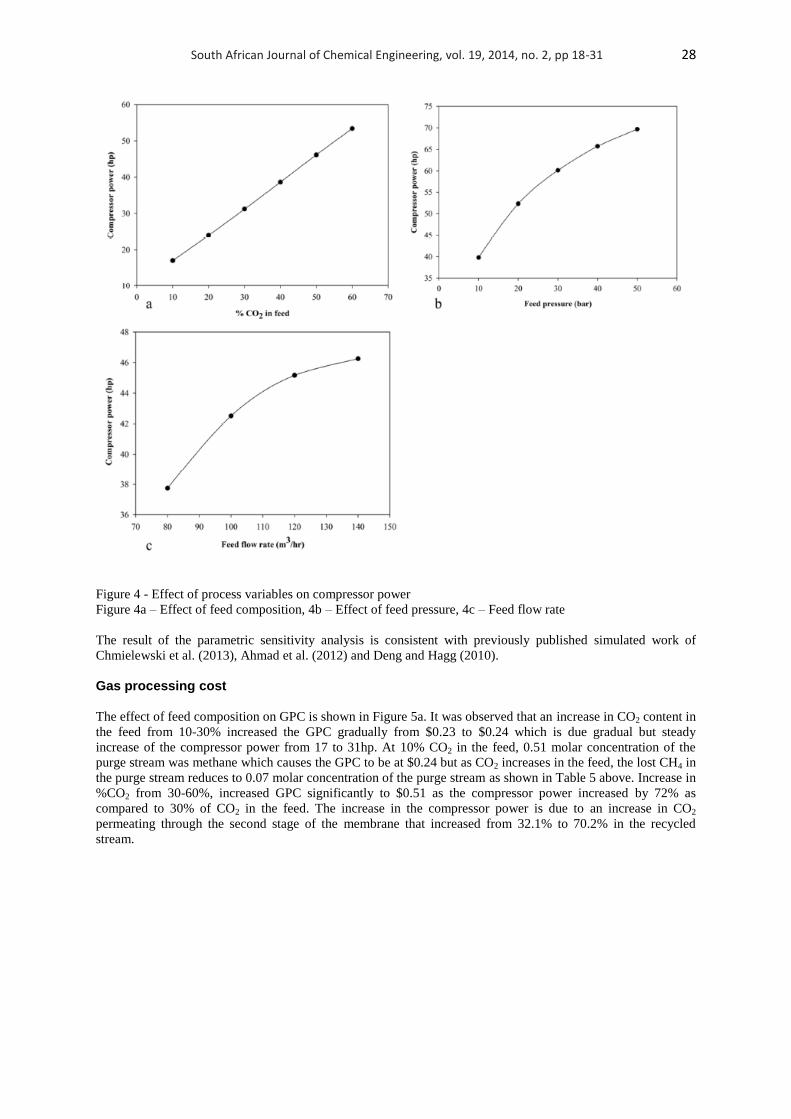
Gas processing cost
The effect of feed composition on GPC is shown in Figure 5a. It was observed that an increase in CO2 content in
the feed from 10-30% increased the GPC gradually from $0.23 to $0.24 which is due gradual but steady
increase of the compressor power from 17 to 31hp. At 10% CO2 in the feed, 0.51 molar concentration of the
purge stream was methane which causes the GPC to be at $0.24 but as CO2 increases in the feed, the lost CH4 in
the purge stream reduces to 0.07 molar concentration of the purge stream as shown in Table 5 above. Increase in
%CO2 from 30-60%, increased GPC significantly to $0.51 as the compressor power increased by 72% as
compared to 30% of CO2 in the feed. The increase in the compressor power is due to an increase in CO2
permeating through the second stage of the membrane that increased from 32.1% to 70.2% in the recycled
stream.

South African Journal of Chemical Engineering, vol. 19, 2014, no. 2, pp 18-31 29
Figure 5 - Effect of Feed composition and feed pressure on GPC
Figure 5a – Effect of feed composition, 5b – Effect of feed pressure
The effect of feed pressure on GPC was investigated as shown in figure 5b. Increasing feed pressure increased
the required compressor power. As the compressor power increases from 39.78hp to 69.68hp, the GPC
increased from $0.28 to $0.38/m3 of biogas. An increase in feed pressure increases the CO2 permeating through
the membrane to increase the CH4 purity and recovery. A reduction in membrane area and CH4 lost in the purge
stream lowers the impact of the compressor power on GPC. The optimal operating pressure for a membrane
module will be determined by the pressure limit of the module design.
Maximising the plant production capacity to produce 100m3/hr biomethane, reduces the GPC as shown in figure
6. At 80m3/hr the GPC was $0.25/m
3 of biogas with a product flow rate of 45.99m
3/hr. As the feed flow rate
increases to 140m3/hr, the GPC reduces by 41.71% to $0.14/m
3 with a product flow rate of 100.55m
3/hr. The
reduction in GPC was due to a reduction in the CH4 lost in the upgrading process which reduces from 14.77% to
11.4% in the purge stream.
Figure 6 - Effect of feed flow rate
Simulation result for optimal process In principle, the optimization of a process is based on economic considerations including reducing capital and
operating cost of the process while still achieving the desired quality of the end product. CH4 purity and
recovery are the most important technical factors in determining an optimal module arrangement and process
conditions in order to ensure a low CH4 loss and meet the gas product specifications while the required
membrane area and compression energy are critical economic factors (Deng & Hagg, 2010). Table 6 shows the
optimised process condition for simulated process configuration. The feed composition was as defined in Table
4, membrane CO2/CH4 selectivity of 15.6 was maintained while target CH4 purity was 91%.

South African Journal of Chemical Engineering, vol. 19, 2014, no. 2, pp 18-31 30
Table 6 :Simulation result of the optimal process
Process parameter for membrane simulation
Parameters Simulation result
Feed flow rate 9.9bar Feed pressure at 1st stage and 2nd stage 18 bar, 16.66 bar
Temperature and pressure at permeate side 30°C, 1.08bar Membrane area required 46.5m2
Upgraded biogas flow rate 82.26m3/hr
CH4 purity 91% vol CH4 recovery 96.1%
CO2 recovery in purge 97% vol. Compression duty 194hp
Total investment cost USD $1,157,730.30 Annual variable operating and maintenance cost USD $94,823.15
Annual capital related cost USD $231,546.06 Gas processing cost per m3 USD $0.3569 USD $0.3569
In the simulated process, the cost for producing fuel grade biomethane is approximately $0.36/Nm3 with a
product flow rate of 82.26m3/h. The pump price of CNG in South Africa with 93% purity is $0.92/l (NGV,
2014) while 95 grade octane gasoline is $1.29/l (Department of Energy, 2014). The plant in this study dispense
CBG on production site, hence cost of transporting CBG is not incurred. Also special incentives are given to
renewable fuel sources in South Africa. This paper has not factored such incentives to determine profitability
margin of the simulated conditions. The cost of biogas upgrading varies considerably on biogas resources,
upgrading technology, plant capacity, location and economic parameters used in assessing the GPC. Biogas
processing cost has been reported in literature to be roughly in the range of $0.18- 0.7/Nm3 (Deng & Hagg,
2010). Post treatment cost, compression to 220bar, mercaptan cost for odourization and high pressure cylinder
cost was not considered for this calculation.
CONCLUSION
The parametric study investigated the effect of varying process parameters on CH4 recovery and GPC. Increase
in %CO2 in the feed from 10-60% reduces the CH4 recovery by 4.1%. An increase in membrane selectivity from
5.68 to 33.33 increased CH4 recovery by 7.11% with a 47.73% reduction in membrane area. Pressure increase
also increased CH4 recovery up to the module design configuration limit. Increasing feed flow rate from 80-
140m3/hr increased CH4 recovery by 6.2%. Increasing %CO2 and feed pressure increased the GPC. At optimal
operating condition, the GPC was approximately $0.36/Nm3 of biogas with 96.1% CH4 recovery and 91%
purity.
REFERENCES
1. Ahmad, F., Lau, K.K., Shariff, A.M., Murshid, G. 2012. Process simulation and optimal design of
membrane separation system for CO2 capture from natural gas. Computers & Chemical Engineering,
36(0), 119-128.
2. Belaissaoui, B., Willson, D., Favre, E. 2012. Membrane gas separation and postcombustion carbon
dioxide capture: Parametric sensitivity and process integration strategies. Chemical Engineering
Journal, 211-212, 122-132.
3. Chandra, R., Vijay, V.K., Subbarao, P.M.V. 2012. Vehicular quality biomethane production from
biogas by using an automated water scrubbing system. ISRN Renewable Energy, 2012, 1-6.
4. Chmielewski, A.G., Urbaniak, A., Wawryniuk, K. 2013. Membrane enrichment of biogas from two-
stage pilot plant using agricultural waste as a substrate. Biomass & Bioenergy, 58, 219-228.
5. Chowdhury, M.H.M. 2011. Simulation, design and optimization of membrane gas separation, chemical
absorption and hybrid processes for CO2 capture. in: Chemical Engineering, Vol. PhD, University of
Waterloo. Waterloo, Ontario, pp. 407.
6. Deng, L.Y., Hagg, M.B. 2010. Techno-economic evaluation of biogas upgrading process using CO2
facilitated transport membrane. International Journal of Greenhouse Gas Control, 4(4), 638-646.
7. Department of Energy. 2014. Fuel prices June, Vol. 2014,
www.energy.gov.za/files/esources/petroleum_fuelprices.html. Pretoria.
8. Dirkse, E.H.M. 2008. Biogas upgrading using the DMT TS-PWS technology. DMT Environmental
Technology.

South African Journal of Chemical Engineering, vol. 19, 2014, no. 2, pp 18-31 31
9. Drapcho, C.M., Nhuan, N.P., Walker, T.H. 2008. Biofuels engineering process technology. 1st ed.
McGraw Hill.
10. Edwards, R., Larive, J.-F., Beziat, J.-C. 2011. Well-to-wheel analysis of future automotive and
powertrains in the European context. Institute for Energy and Transport. 978-9279-21395-3.
11. Eriksson, P., Olsson, M. 2007. The potential of biogas as vehicle fuel in europe - A technological
innovation system analysis of the emerging biomethane technology. Chalmers University of
Technology. 1404-8167.
12. Hao, J., Rice, P.A., Stern, S.A. 2008. Upgrading low-quality natural gas with H2S- and CO2- selective
polymer membranes Part II. Process design, economics and selectivity study of membrane stages with
recycle stream. Journal of Membrane Science, 320, 108- 122.
13. [Hao, J., Rice, P.A., Stern, S.A. 2002. Upgrading low-quality natural gas with H2S- and CO2-selective
polymer membranes Part I. Process design and economics of membrane stages without recycles
streams. Journal of Membrane Science, 209, 177-206.
14. Harasimowicz, M., Orluk, P., Zakrzewska-Trznadel, G., Chmielewski, A.G. 2007. Application of
polyimide membranes for biogas purification and enrichment. Journal of Hazardous Material, 144(3),
698-702.
15. Johansson, N. 2008. Production of liquid biogas, LBG, with cryogenic and conventional upgrading
technology-description of systems and evaluation of energy balances. Lunds Universitet.
16. Kanehashi, S., Sato, S., Nagai, K. 2010. Synthesis and gas permeability of hyperbranched and cross-
linked polyimide membranes. in: Membrane gas separation, (Eds.) Y. Yampolskii, B. Freeman, Wiley.
United Kingdom, pp. 3-27.
17. Karagiannidis, A., Perkoulidis, G. 2009. A multi-criteria ranking of different technologies for the
anaerobic digestion for energy recovery of the organic fraction of municipal solid wastes. Bioresource
Technology, 100(8), 2355-60.
18. Kigozi, R., Aboyade, A., Muzenda, E. 2014. Biogas production using the organic fraction of municipal
solid waste as feedstock. International Journal of Research in Chemical, Metallurgical and Civil
Engineering, 1(1), 107-114.
19. Kim, H.-T., Lee, D.-H. 2004. Simulation study for CO2 separation process by using hollow fiber
membrane. Ajou University.
20. Lock, S.S.M., Lau, K.K., Shariff, A.M. 2014. Effect of recycle ratio on the cost of natural gas
processing in countercurrent hollow fiber membrane system. Journal of Industrial and Engineering
Chemistry.
21. Makaruk, A., Miltner, M., Harasek, M. 2010. Membrane biogas upgrading processes for the production
of natural gas substitute. Separation and Purification Technology, 74(1), 83-92.
22. Masebinu, S.O., Aboyade, A.O., Muzenda, E. 2013. Enrichment of biogas for use as vehicular fuel: A
review of the upgrading techniques. International Journal of Research in Chemical, Metallurgical and
Civil Engineering, 1(1), 89-98.
23. Mitzlaff, K.V. 1988. Engines for biogas: Theory, modification and economic operation. Friedrick
Vieweg & Son, Wiesbaden, Viewweg, Germany.
24. Murphy, J.D., McKeogh, E., Kiely, G. 2004. Technical/economic/environmental analysis of biogas
utilization. Journal of Applied Energy, 77(4), 407-427.
25. NGV. 2014. Launch of NGV Station in Johannesburg, (Ed.) S.O. Masebinu. Johannesburg.
26. Ryckebosch, E., Drouillon, M., Veruaeren, H. 2011. Techniques for transformation of
27. biogas to biomethane. Biomass & Bioenergy, 35(5), 1633-1645.
28. Scholes, C.A., Stevens, G.W., Kentish, S.E. 2012. Membrane gas separation applications in natural gas
processing. Fuel, 96(1), 15-28. Shao, P.H., Dal-Cin, M., Kumar, A., Li, H.B., Singh, D.P. 2012. Design
and economics of a hybrid membrane-temperature swing adsorption process for upgrading biogas.
Journal of Membrane Science, 413, 17-28.
29. Sinnott, R.K. 2005. Chemical Engineering Design. Coulson & Richardson's, New York, USA.
30. Tin, P.S., Chung, T.S., Liu, Y., Wang, R. 2004. Separation of CO2/CH4 through carbon molecular
sieve membranes derived from P84 polyimide. Carbon, 42(15), 3123-3131.
31. Wang, D.M. 2008. Breakthrough behavior of H2S removal with an iron oxide based CG-4 adsorbent in
a fixed-bed reactor. in: Chemical Engineering, Vol. Master of Science, University of Saskatchewan.
Saskatoon, pp. 136.
32. Zhang, R., El-Mashad, H.M., Hartman, K., Wang, F., Liu, G., Choate, C., Gamble, P. 2006.
Charaterization of food waste as feedstock for anaerobic digestion. Bioresource Technology(98), 929-
935.