produced water management plan for pel 285 - gloucester
TRANSCRIPT

Produced Water Management Plan for PEL 285 - Gloucester Date: 22 October 2014

AGL_PEL285_PWMP_V1-5_221014_Final.docx_22.10.2014
Table of Contents
Glossary ................................................................................. 1
1. Introduction ..................................................................... 6 1.1. Overview .................................................................................................... 6
1.2. Definition ................................................................................................... 6
1.3. Purpose ...................................................................................................... 6
1.4. Scope ......................................................................................................... 6
1.5. Location ..................................................................................................... 7
1.6. Approvals ................................................................................................... 9
1.6.1. PEL 285 .................................................................................................... 9
1.6.2. EPL 20358 .............................................................................................. 10
1.6.3. Water licences ......................................................................................... 10
2. Environmental Context .................................................... 11 2.1. General .................................................................................................... 11
2.2. Hydrogeology ........................................................................................... 11
3. Produced Water Management Options ............................... 13 3.1. Options for Produced Water Reuse and Disposal ...................................... 13
3.2. Adopted Options for Produced Water ....................................................... 13
3.3. Waukivory Pilot activities ......................................................................... 14
3.3.1. Flooding ................................................................................................. 20
3.3.2. Contingency planning and emergency management ..................................... 20
3.4. Exploration program water management ................................................. 21
3.5. Staging of the implementation of the PWMP ............................................ 22
4. Produced Water.............................................................. 23 4.1. Sources .................................................................................................... 23
4.2. Estimated Quantity .................................................................................. 23
4.3. Water Quality ........................................................................................... 24
4.4. Containment and Treatment Measures ..................................................... 26

AGL_PEL285_PWMP_V1-5_221014_Final.docx_22.10.2014
4.4.1. Waukivory Pilot ....................................................................................... 26
4.4.2. Workover Activities .................................................................................. 27
4.5. Beneficial Reuse or Disposal .................................................................... 27
4.6. Controls ................................................................................................... 29
4.6.1. Infrastructure and Containment - Pilots ...................................................... 29
4.6.2. Leak detection at TED .............................................................................. 32
4.6.3. Water quality monitoring .......................................................................... 32
4.6.4. Water volume monitoring ......................................................................... 33
4.7. Records .................................................................................................... 33
5. Flowback Water .............................................................. 35 5.1. Source and Estimated Quantity ................................................................ 35
5.2. Containment and Treatment Measures ..................................................... 35
5.3. Beneficial Reuse or Disposal .................................................................... 36
5.4. Controls ................................................................................................... 36
5.5. Records .................................................................................................... 37
6. Natural Groundwater ...................................................... 39 6.1. Source and Estimated Quantity ................................................................ 39
6.2. Containment and Treatment Measures ..................................................... 39
6.3. Beneficial Reuse or Disposal .................................................................... 39
6.4. Controls ................................................................................................... 40
6.5. Records .................................................................................................... 41
7. Water Monitoring ............................................................ 42 7.1. Monitoring water quality .......................................................................... 42
7.2. Monitoring water volumes ........................................................................ 42
7.3. Data Archival............................................................................................ 43
8. References .................................................................... 45
Appendices ............................................................................ 47
Appendix 1: Water Management Plan for the Tiedman Irrigation Program - Gloucester ............................................................. 48
Appendix 2: Surface water and Groundwater approvals ............ 49 Legislation .......................................................................................................... 49
Licences ............................................................................................................. 49
Aquifer Interference Approvals .......................................................................... 51
Appendix 3: MDR Report Section 1.3 Leak Detector ................. 53

AGL_PEL285_PWMP_V1-5_221014_Final.docx_22.10.2014
Document Revision History
Date Version Author Comment
WMP for Tiedman Irrigation Program
6 January 2012
V1-1 John Ross Draft for Internal Review
20 January 2012
V1-2 John Ross Final for submittal to NOW, DTIRIS and EPA for REF approval
14 May 2012 V1-3 John Ross Final for public release with REF approval
PWMP for PEL 285
22 September 2014
V1-1 John Ross Draft for Internal Review
24 September 2014
V1-2 John Ross/Jenny MacMahon
Final Draft for Internal Review
26 September 2014
V1-3 John Ross/Jenny MacMahon
Final for submittal to Office of Coal Seam Gas (OCSG)
14 October 2014
V1-4 John Ross Revised Final for submittal to Office of Coal Seam Gas (OCSG) after NOW review
22 October 2014
V1-5 James Duggleby Revised Final following Ministers approval

AGL_PEL285_PWMP_V1-5_221014_Final.docx_22.10.2014 1
Glossary
Alluvium Unconsolidated sediments (clays, sands, gravels and other materials) deposited by flowing water. Deposits can be made by streams on river beds, floodplains, and alluvial fans.
Alluvial aquifer Permeable zones that store and produce groundwater from unconsolidated alluvial sediments. Shallow alluvial aquifers are generally unconfined aquifers.
Aquifer Rock or sediment in a formation, group of formations, or part of a formation that is saturated and sufficiently permeable to transmit economic quantities of water.
Aquifer properties The characteristics of an aquifer that determine its hydraulic behaviour and its response to abstraction.
Aquifer, confined An aquifer that is overlain by low permeability strata. The hydraulic conductivity of the confining bed is significantly lower than that of the aquifer.
Aquifer, semi-confined An aquifer overlain by a low-permeability layer that permits water to slowly flow through it. During pumping, recharge to the aquifer can occur across the confining layer – also known as a leaky artesian or leaky confined aquifer.
Aquifer, unconfined Also known as a water table aquifer. An aquifer in which there are no confining beds between the zone of saturation and the surface. The water table is the upper boundary of an unconfined aquifer.
Aquitard A low-permeability unit that can store groundwater and also transmit it slowly from one aquifer to another. Aquitards retard but do not prevent the movement of water to or from an adjacent aquifer.
Bore A structure drilled below the surface to obtain water from an aquifer or series of aquifers.
Coal A sedimentary rock derived from the compaction and consolidation of vegetation or swamp deposits to form a fossilised carbonaceous rock.

AGL_PEL285_PWMP_V1-5_221014_Final.docx_22.10.2014 2
Coal seam A layer of coal within a sedimentary rock sequence.
Coal seam gas (CSG) Coal seam gas is a form of natural gas (predominantly methane) that is extracted from coal seams.
Contamination Contamination is the presence of a non natural compound in soil or water, or unwanted compound in chemicals or other mixtures.
Dewatering The process of removing formation water from a targeted coal seam. Dewatering is required to reduce pressure in the coal so gas can desorb and produce.
Discharge The volume of water flowing in a stream or through an aquifer past a specific point in a given period of time.
Electrical Conductivity (EC) A measure of a fluid’s ability to conduct an electrical current and is an estimation of the total ions dissolved. It is often used as a measure of water salinity.
Extracted water Extracted water is the collective term for both flowback water and produced water.
Fracture stimulation A technique that increases the productivity of a gas well by creating a pathway into the targeted coal seam under high pressure.
Flowback The process of allowing fluids to flow from a gas well following a treatment, either in preparation for exploration testing, a subsequent phase of treatment / workover, or in preparation for returning the well to production.
Flowback water The return to surface of fracture stimulation fluids before transition to natural formation water (groundwater), after which water flowing from the well is termed produced water.
Fractured rock aquifer Aquifers that occur in sedimentary, igneous and metamorphosed rocks which have been subjected to disturbance, deformation, or weathering, and which allow water to move through joints, bedding planes, fractures and faults. Although fractured rock aquifers are found over a wide area, they generally contain much less groundwater than alluvial and porous sedimentary

AGL_PEL285_PWMP_V1-5_221014_Final.docx_22.10.2014 3
aquifers.
Groundwater The water contained in interconnected pores or fractures located below the water table in an unconfined aquifer or located at depth in a confined aquifer.
Groundwater system A system that is hydrogeologically more similar than different in regard to geological province, hydraulic characteristics and water quality, and may consist of one or more geological formations.
Limit of Reporting (LOR) This is the detection level for a particular analyte when a sample is submitted for analysis at a NATA laboratory. If the result is less than the LOR the analyte is “non detect”.
micro Siemens per centimetre (µS/cm)
A measure of water salinity commonly referred to as EC (see also Electrical Conductivity). Most commonly measured in the field with calibrated field meters.
Monitoring bore A non-pumping bore, is generally of small diameter that is used to measure the elevation of the water table and/or water quality. Bores generally have a short well screen against a single aquifer through which water can enter.
pH potential of Hydrogen; the logarithm of the reciprocal of hydrogen-ion concentration in gram atoms per litre; provides a measure on a scale from 0 to 14 of the acidity or alkalinity of a solution (where 7 is neutral, greater than 7 is alkaline and less than 7 is acidic).
Produced water Water that is taken in the course of a prospecting operation that is part of, or incidental to, that prospecting operation, including water that is encountered within and extracted from boreholes, petroleum wells or excavations.
Recharge The process which replenishes groundwater, usually by rainfall infiltrating from the ground surface to the water table and by river water reaching the water table or exposed aquifers. The addition of water to an aquifer.

AGL_PEL285_PWMP_V1-5_221014_Final.docx_22.10.2014 4
Salinity classification Fresh water quality – water with a salinity <800 µS/cm.
Marginal water quality – water that is more saline than freshwater and generally waters between 800 and 1,600 µS/cm.
Brackish quality – water that is more saline than freshwater and generally waters between 1,600 and 4,800 µS/cm.
Slightly saline quality – water that is more saline than brackish water and generally waters with a salinity between 4,800 and 10,000 µS/cm.
Moderately saline quality – water that is more saline than brackish water and generally waters between 10,000 and 20,000 µS/cm.
Saline quality – water that is almost as saline as seawater and generally waters with a salinity greater than 20,000 µS/cm.
Seawater quality – water that is generally around 55,000 µS/cm.
Sandstone Sandstone is a sedimentary rock composed mainly of sand-sized minerals or rock grains (predominantly quartz).
Sedimentary rock aquifer These occur in consolidated sediments such as porous sandstones and conglomerates, in which water is stored in the intergranular pores, and limestone, in which water is stored in solution cavities and joints. These aquifers are generally located in sedimentary basins that are continuous over large areas and may be tens or hundreds of metres thick. In terms of quantity, they contain the largest volumes of groundwater.
Source Water Water used to carry the sand and minor chemical
additives used for fracture stimulation programs.
Standing water level (SWL) The height to which groundwater rises in a bore after it is drilled and completed, and after a period of pumping when levels return to natural atmospheric or confined pressure levels.
Water bearing zone Geological strata that are saturated with groundwater but not of sufficient permeability to be called an aquifer.
Water quality Term used to describe the chemical, physical, and

AGL_PEL285_PWMP_V1-5_221014_Final.docx_22.10.2014 5
biological characteristics of water, usually in respect to its suitability for a particular purpose.
Water table The top of an unconfined aquifer. It is at atmospheric pressure and indicates the level below which soil and rock are saturated with water.
Well Pertaining to a gas exploration well or gas production well.

AGL_PEL285_PWMP_V1-5_221014_Final.docx_22.10.2014 6
1. Introduction
1.1. Overview
AGL Upstream Investments Pty Ltd (AGL) is the holder of Petroleum Exploration Licence (PEL) 285 for the Gloucester Basin (which includes the Waukivory Pilot Project Approval) issued for the Gloucester Gas Project (GGP) coal seam gas exploration activities. PEL 285 expired on 15 April 2012 and was renewed on 6 August 2014.
AGL has prepared this Produced Water Management Plan (PWMP) to meet the requirements of PEL 285 Conditions 16, 17 and 18. The PWMP has been prepared in consultation with the NSW Office of Water and is submitted to the NSW Office of Coal Seam Gas for approval by the Minister administering the Petroleum (Onshore) Act 1991.
1.2. Definition
Produced water is the water that is taken in the course of a prospecting operation that is part of, or incidental to, that prospecting operation, including water that is encountered within and extracted from boreholes, petroleum wells or excavations (PEL, 6 August 2014).
1.3. Purpose
The purpose of the PWMP is to describe the management of produced water that will be brought to the surface in the course of PEL 285 exploration activities.
The plan will be updated annually or whenever new exploration activities are approved that involve the capture, transport, reuse or disposal of produced water.
1.4. Scope
This PWMP is applicable to water that is taken (brought to the surface) in the course of PEL 285 prospecting operations such as:
Pilot testing of new gas wells for appraisal purposes (including hydraulic fracturing);
Workover activities on (exploration) gas wells.
The PWMP focuses on the management of produced water; however the PWMP also addresses the management of:
Flowback water; and
Natural shallow groundwater (from air drilling, development and purging of test and monitoring bores).
The PWMP is separate to the Extracted Water Management Strategy (EWMS) (AGL, 2014c) required under the Part 3A project approval for the Stage 1 Gloucester Field Development Area (GFDA).

AGL_PEL285_PWMP_V1-5_221014_Final.docx_22.10.2014 7
In addition to the PWMP, there are a number of other water management plans required for different exploration program activities within PEL 285 by different agencies (refer Figure 1.1).
Figure 1.1: Water Management Plans for Exploration Activities The PWMP does not include:
Water monitoring and management activities associated with water resource protection (covered under the Groundwater Monitoring and Modelling Plan (GMMP); and the respective Surface Water and Groundwater Management Plans (SGMPs) for individual exploration pilot activities – which is limited to the Waukivory Pilot at present (AGL, 2014b).
Water management activities (monitoring network/frequency etc.) associated with the Tiedman Irrigation Program (TIP). There is a separate Water Management Plan that covers this project activity (AGL, 2012). A copy of this plan is provided in Appendix 1.
This PWMP covers produced water management up to the point where it is stored in the Tiedman dams, and the plan should be read in conjunction with the TIP Water Management Plan, which covers the beneficial reuse of produced water together with the associated monitoring and reporting.
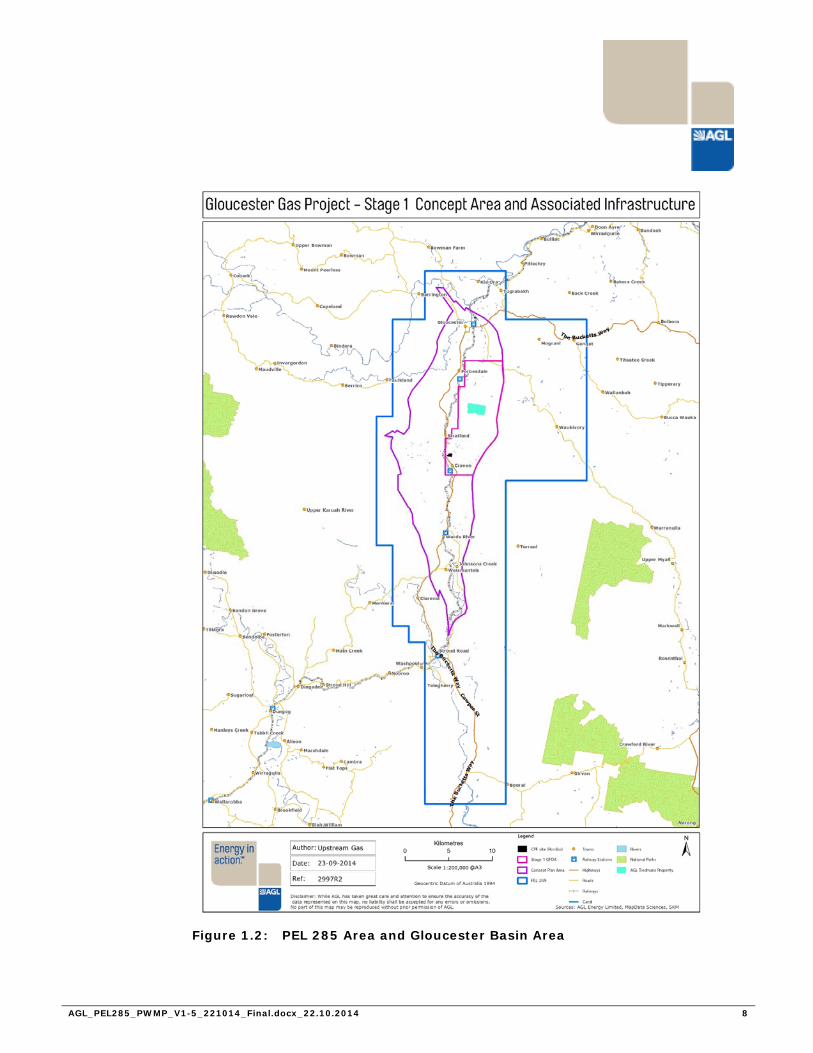
1.5. Location
The PEL 285 area and the Gloucester Basin area are shown in Figure 1.2.
AGL_PEL285_PWMP_V1-5_221014_Final.docx_22.10.2014 8
Figure 1.2: PEL 285 Area and Gloucester Basin Area

AGL_PEL285_PWMP_V1-5_221014_Final.docx_22.10.2014 9
1.6. Approvals
The following approvals are relevant to the PWMP:
PEL 285 renewed on 6 August 2014;
Environment Protection Licence (EPL) 20358 issued on 6 August 2014;
Various bore licence approvals for groundwater abstraction and use;
Various surface water approvals for surface water abstraction and use; and
Approval of the TIP Review of Environmental Factors (REF) to irrigate blended water.
1.6.1. PEL 285
PEL 285 includes the following conditions for a PWMP:
16. Prior to conducting prospecting operations with the potential to generate more than three (3) megalitres per year of produced water (as a result of cumulative prospecting operations within the exploration licence area), the licence holder must obtain the Minister's approval for a Produced Water Management Plan prepared in accordance with the requirements set out in conditions 17 and 18. 17. The Produced Water Management Plan must be prepared in consultation with the NSW Office of Water. 18. The Produced Water Management Plan must address the following matters:
a) the expected sources and estimated quantity of the produced water; b) the proposed containment and treatment measures for the produced water; c) the proposed beneficial reuse or disposal methods for the produced water; d) the controls to be implemented to prevent and/or minimise pollution; e) how records of all relevant parameters for the quality, quantity, transport and disposal of all water will be maintained; f) the staging process for implementation of the plan; and g) any additional requirements prescribed by the Secretary.
The requirements of Conditions 16, 17 and 18 and where they are addressed in this PWMP are provided in Table 1-1.
Table 1-1: PEL Conditions 16, 17 and 18
PEL 285 Condition PWMP Reference Condition 16 Ministers Approval granted: 21 October 2014 Condition 17 Consultation summary:
TIP Water Management Plan (WMP) (AGL, 2012) was discussed and referred to NOW for feedback on numerous occasions in 2011 and 2012.
Consultation with NSW Office of Water (NOW) on the PWMP commenced in September 2014 and consisted of review of the final draft PWMP (V1-3) and provision of comments.
Condition 18

AGL_PEL285_PWMP_V1-5_221014_Final.docx_22.10.2014 10
PEL 285 Condition PWMP Reference Part a) relates to the sources and estimated quantities of produced water
Section 4.1 and 4.2
Part b) relates to the proposed containment and treatment measures for produced water
Section 4.4
Part c) relates to the proposed beneficial reuse or disposal methods for produced water
Section 4.5
Part d) relates to the controls to be implemented to prevent and/or minimise pollution
Section 4.6
Part e) relates to how records of all relevant parameters for the quality, quantity, transport and disposal of all water will be maintained
Section 4.7
Part f) relates to the staging process for implementation of the plan
Section 3.5
Part g) any additional requirements prescribed by the Secretary.
Part g) is not dealt with at this time because there are no additional requirements prescribed by the Secretary.
1.6.2. EPL 20358
Monitoring of water quality and water pollution is regulated by the NSW Environment Protection Authority (EPA) under the Protection of the Environment Operations Act 1997 (NSW). Environment Protection Licence (EPL) 20358 has been issued for approved exploration activities within PEL 285 including the TIP.
For the Waukivory Pilot, there are substantial monitoring requirements for surface water and groundwater levels and quality. Baseline monitoring programs commenced in 2013 (PB, 2014c) and have continued into 2014. The required locations, analytical suites, and monitoring frequencies are described in the EPL and reflected in our Waukivory Surface Water and Groundwater Management Plan (SGMP) (AGL, 2014b).
The management controls imposed by the EPA under the EPL water conditions are focused on identifying water level and water quality trends, and protecting adjacent and underlying water resources.
1.6.3. Water licences
The access, taking and use of groundwater in NSW is managed and implemented by the NSW Office of Water (NOW) under two primary legal instruments — the Water Management Act 2000 (WMAct) and the Water Act 1912 (WAct).
The main focus of the production bore licences for pilot testing is to regulate and monitor the water volumes extracted from this sedimentary rock groundwater system.
Information regarding the surface water and groundwater licences that are current for the exploration activities within PEL 285 are provided in Appendix 2.

AGL_PEL285_PWMP_V1-5_221014_Final.docx_22.10.2014 11
2. Environmental Context
2.1. General
Gas wells can be located at many different sites in the landscape from the valley floor to ridgeline areas. The Waukivory Pilot area is located at the confluence of the Avon River and Waukivory Creek (Forbesdale). The Avon River and Waukivory Creek are normally permanent streams, although they can be reduced to water holes and these streams do not flow for long periods of time during extended dry periods.
Similarly the Avon River at the Tiedman property is normally a permanent stream, although it can be reduced to water holes and does not flow for long periods of time during extended dry periods. Water levels are highly variable and water quality becomes increasingly brackish during dry periods. Salinities (pre-irrigation) up to 1300 µS/cm have been observed in the Avon River adjacent to the Stage 1A irrigation area (PB, 2013b).
2.2. Hydrogeology
In the Gloucester Basin the produced water yield from the deep groundwater systems (predominantly the coal seam water bearing zones) is low (i.e. the production rates and volumes extracted from individual gas wells are low) and the water quality is brackish to slightly salty.
Substantial exploration and water investigation studies have been completed across PEL 285, including several pilot testing programs. AGL has collected a reasonable database on both water volumes and water quality characteristics of produced water within the Gloucester Basin.
Gas wells are constructed to maximise the recovery of gas and to minimise volume of the produced water. However as depressurising (and dewatering) coal seams is necessary to flow gas, the pumping of deep groundwater from coal seams to surface is a necessary process. In order to minimise produced water volumes, coal seams below 200m are targeted and for the Waukivory Pilot the shallowest seams that are targeted will be below 300m.
Based on the water level, water quality and isotope data from extensive water studies (e.g. PB, 2013b and PB, 2014c), there is a good appreciation of groundwater recharge, discharge and flow processes through the different groundwater systems of the Gloucester Basin. These hydrogeological units (based on PB, 2013a) are:
Alluvial aquifers - water levels in the alluvial aquifers are less than 5 metres bgl;
Shallow bedrock aquifers - water levels are deeper and generally about 10 metres bgl;
Coal seam water bearing zones - very poor aquifers/aquitards; and
Confining units (claystones or indurated sandstones) - very poor aquitard/aquiclude.
The alluvium is only shallow (maximum 12m thickness) and in some areas contains an unconfined (sand and gravel) aquifer. Groundwater flow processes are relatively simple with rainfall being the predominant recharge source on the floodplain. Flooding occasionally adds additional recharge water to the alluvial water table. Groundwater discharge from the alluvium is to the rivers as baseflow and shallow groundwater is also expected to be transpired by riparian vegetation.

AGL_PEL285_PWMP_V1-5_221014_Final.docx_22.10.2014 12
The bedrock contains mostly tight siltstone and indurated sandstone rock types with occasional thin semi-confined sedimentary/fractured aquifers (typically to around 75m depth). Water tables are generally deeper than 10m below surface with deepest levels at elevated sites and in areas of active coal mining. Rainfall is the only recharge source to the bedrock aquifers and recharge does not occur everywhere in the landscape. Recharge mostly occurs in areas of rock outcrop. In areas where there is a weathered (clayey) profile, brackish to saline water quality suggests there is negligible (vertical) rainfall recharge. Groundwater flow in bedrock aquifers is lateral, either within local fracture zones or individual strata if there are no interconnecting and open fracture zones. Groundwater discharge is via seepage to springs and to the alluvium (and indirectly to creeks and rivers) along the floor of the valley.
The groundwater in the deeper bedrock units is moving very slowly with lateral movement within each rock unit predominating. Confining rock permeabilities are very low, coal seam permeabilities are slightly higher (but are still not high enough to be considered useful aquifers).
There are no known groundwater dependent ecosystems (GDEs) (apart from stream baseflow accessions) although there may be some uptake of shallow groundwater (from the alluvium) by native terrestrial vegetation on the floodplain. Diffuse discharge of saline groundwater from bedrock seeps is thought to occur into the alluvium as stream salinity increases during dry periods. Groundwater discharge is diffuse and discharge does not occur at any one point in the landscape.

AGL_PEL285_PWMP_V1-5_221014_Final.docx_22.10.2014 13
3. Produced Water Management Options
3.1. Options for Produced Water Reuse and Disposal
The following options have been considered in recent years for managing produced water:
Temporary storage in lined dams at the Tiedman property and Stratford holding dams.
Off-site disposal.
With no or limited treatment:
o Industrial use
o Blended water irrigation use
o Stock use.
With treatment (desalination or other water treatment technology):
o Industrial use
o Irrigation use
o Stock use
o Stream disposal.
Most of the water from historical drilling and pilot exploration programs was stored in Tiedman North Dam (TND) and Tiedman South Dam (TSD) (40 ML capacity). This water was blended and used for irrigation in accordance with the TIP WMP and the TIP REF approval. In addition, produced water was also stored in the two smaller Stratford holding dams (16 ML capacity). The Stratford dams have been decommissioned and the sites reinstated. Prior to the start of the TIP in late 2012 there was about 52 ML of produced water in storage. This historical water is relevant to this PWMP as around 7 ML remains to be blended and irrigated.
3.2. Adopted Options for Produced Water
For the relatively small volumes of produced water expected from exploration activities within PEL 285, a combination local reuse with no or limited treatment technologies and no off-site disposal has been adopted.
The only ‘treatment’ proposed is the blending of produced water with freshwater sources to achieve a blended water with a salinity of less than 2000 µS/cm. There are no residual products arising from the adopted reuse options.
The adopted options for produced water, flowback water and natural groundwater from monitoring bore locations, associated with the current exploration program activities are:
Industrial use (i.e. for drilling and/or fracture stimulation source water) – for produced and/or blended waters stored within the three Tiedman Dams.
Irrigation use – blended water taken from TSD (which is mostly produced water blended with fresh source waters to achieve a salinity of less than 2000 µS/cm).

AGL_PEL285_PWMP_V1-5_221014_Final.docx_22.10.2014 14
Stock use – natural groundwater from monitoring bore drilling programs and from produced and/or blended waters stored within the three Tiedman Dams (not implemented yet).
Off-site disposal – produced water with greater than 15,000 µS/cm (if ever encountered) (not implemented yet because water of that salinity has not been encountered), flowback water and saline groundwater.
AGL is committed to the beneficial reuse of all produced water from exploration activities across PEL 285. Blended water irrigation under the TIP is AGL’s preference for reuse, although occasional industrial use is likely. At the conclusion of the current TIP approval period (30 April 2015) there may be some residual produced water in storage in Tiedman East dam (TED).
In the unlikely event that no development proceeds beyond the current exploration activities then AGL will ensure that all produced water in storage is beneficially reused for irrigation and stock purposes subject to the appropriate regulatory approvals being in place and the water quality meeting the commitments in the respective plans.
In this regard, the current Tiedman REF approval for the blended water irrigation program will expire in April 2015. Any blended water irrigation program beyond that date will require a modification to the current approvals, or a new approval.
3.3. Waukivory Pilot activities
The Waukivory Pilot involves the fracture stimulation and pilot testing of four gas wells concurrently (WK11, WK12, WK13, and WK14). The full impact assessment is provided in the REF documentation being:
Waukivory Pilot REF (EMGA/Mitchell McLennan, 2013a);
Addendum to the REF – Preferred Activity Report (PAR) (EMGA/Mitchell McLennan, 2013b);
Further Addendum to the REF – Preferred Activity (EMGA/Mitchell McLennan, 2014);
Waukivory Fracture Stimulation Management Plan (AGL, 2014).
The Waukivory Pilot REF and associated documents (including the Surface Water and Groundwater Management Plan) undertook a detailed impact assessment of the Waukivory Pilot, including produced water, on:
Water quality;
Hydrogeology and the water table;
Aquatic ecology;
Aquifers;
Soil;
Socio-economic impacts;
Human health and environment risk assessment;
Agricultural impact statement – assessment on agricultural resources.
The Waukivory REF and associated documents are available on AGL’s website, and should be referred to for detailed impact assessment information.

AGL_PEL285_PWMP_V1-5_221014_Final.docx_22.10.2014 15
The maximum volume of flowback water and produced water likely to be pumped for the four gas wells is 20 ML. Discounting this volume by 4 to 6ML to account for the anticipated flowback water volume, this leaves a maximum of 14 to 16ML of produced water to be piped to the TED and reused. Beneficial re‐use of produced water is the preferred option.
The water balance for the Waukivory Pilot/TIP and the expected volume of produced water to be reused is shown in Table 3-1. This simple water balance assumes that the pilot goes for 6-9 months and the irrigation program activities do not extend beyond 30 April 2015 during which time average climatic conditions prevail.
Input volumes are expected to be greater than output volumes for the next 7 months. This scenario (if there is no extension to the TIP approval) will mean that a percentage of produced water generated from the Waukivory Pilot remains in storage for future reuse (drilling, fracture stimulation programs etc). If there is a further extension to the TIP approval then most of the water in storage will be blended and irrigated.
For the future Stage 1 development:
TND and TSD are proposed freshwater irrigation dams (treated water from the desalination plant): and
TED will be an in-field produced water storage pond (if required).
Dams would be managed in accordance with the requirements of the Extracted Water Management Strategy (EWMS). If the Stage 1 development does not proceed, the dams would be managed as for any other off-river storages used by local farmers for irrigation purposes.
Table 3-1: Simple Water Balance Reconciliation for Waukivory Pilot
Storage Inputs/Outputs
Maximum Capacity(ML)
Current Storage (ML)
End of Current Exploration
Approvals (ML) Storage TED 20 1 15TSD 20 14-16 1TND 20 5-7 1Inputs * Maximum Volume (ML) Likely Volume (ML) Produced Water 14-16 ~12 0Rain # 10.4 17.8 **Catch Dams ~ 6 0
Sub-Total ~28.4 17.8 Outputs Maximum Volume (ML) Likely Volume (ML) Irrigation @ 19-23 ~5 0 Industrial 0 0 Stock 0 Evaporation ^ 7.8 13.4 **
Sub Total ~12.8 13.4
Key: * - Does not include freshwater harvested for blending (assumes there is sufficient for produced water volumes) # - Based on average rainfall of 1000 mm per annum (but pro-rataed over 7 months to end April 2015) and TSD/TND area of 7850m2 and TED area of 9970 m2 ~ - Catch dam volume based on two overflow events and 3ML per event @ - This is the expected produced water volume not blended water volume ^ - Based on average evapotranspiration rate of 750 mm per year (but pro-rataed over 7 months to end April 2015) ** - per annum estimates

AGL_PEL285_PWMP_V1-5_221014_Final.docx_22.10.2014 16
AGL has allowed for additional water from pilot testing programs to be blended and irrigated under the TIP. The TIP approval allows for a maximum of 70ML of produced water to be blended and irrigated. Currently 45ML has been irrigated, so there is capacity to irrigate some of the produced water from the Waukivory pilot testing program under the current approval.
The current irrigation program at the Tiedmans property has demonstrated that produced water from pilot wells can be beneficially reused for the irrigation of salt tolerant crops.
The overall produced water strategy allows:
storage of produced water from AGL’s offsite operations and transport of this water within the Tiedman property;
blending of produced water with freshwater for irrigation reuse, subject to the water quality meeting relevant ANZECC criteria;
storage for blending and/or direct reuse for stock use, subject to the water quality meeting the relevant ANZECC criteria;
storage for blending and/or direct reuse for industrial uses such as fracture stimulation, dust suppression and firefighting, subject to water quality meeting the relevant ANZECC criteria; and
storage for future drilling and hydraulic fracture stimulation purposes.
It is proposed to reuse all produced water from the pilot unless the water quality exceeds a pre‐blending salinity (i.e. electrical conductivity or EC) of 15,000 µS/cm. The produced water would be blended with fresh water sources (mostly river water) to obtain a blended water irrigation water mix (i.e. with a salinity level of up to 2,000 µS/cm) suitable for the irrigation of salt tolerant crops.
Produced water with a salinity in excess of 15,000 µS/cm will be transported off-site to an approved water recycling facility.
The other proposed onsite uses are for stock use, dust suppression and firefighting. These reuses will only occur directly if the produced water salinity is less than 6,000 µS/cm, and the water quality meets the relevant ANZECC criteria (6,000 µS/cm will be the criteria for stock use while 2,000 µS/cm will be the criteria for dust suppression and firefighting). If salinities are higher; the water will be blended, tested and re‐used for these activities.
The onsite water management strategy (after the fracture stimulation program) involves:
water gathering lines from each pilot well to the water staging point at WK13;
storing water in a large above ground storage tank at WK13 and monitoring storage levels (it is expected that up to 6ML in flowback water will be produced from the pilot);
monitoring the salinity of the flowback water – water quality is unlikely to exceed 5,000 µS/cm;
transportation of flowback water for disposal at a licensed facility;
the transition from flowback water to produced water is 100% recovery of the injected water volume plus a salinity of 5000 µS/cm;
monitoring the salinity of the produced water– water quality is unlikely to exceed 15,000 µS/cm and more likely to be around 7,000 µS/cm;
storing water in a large above ground storage tanks at WK13 and monitoring storage levels (it is expected that up to 16ML in produced water will be produced from the pilot); and

AGL_PEL285_PWMP_V1-5_221014_Final.docx_22.10.2014 17
transportation of produced water via a water pipeline to the Tiedmans property for storage, blending and reuse.
The raw produced water quality will vary slightly from each of the pilot wells (with the deeper zones in each well expected to have the highest salinities).
The storage, blending and reuse of produced water from AGL exploration operations at the Tiedmans property is subject of an existing approval granted by OCSG in July 2012 then modified and approved July 2014.
The proposed water infrastructure (wells and water pipeline between the Waukivory Pilot and the Tiedmans property) is illustrated in Figure 3.1. This figure shows the:
source water options (Pontilands Dam and the TND) and the water transfer pipeline;
four pilot wells to be fracture stimulated and flow tested;
water gathering lines internal to the pilot that connect each of the gas wells to the tankage at WK13; and
water transfer pipeline that will transfer produced water from the above ground storage tank at WK13 to TED.
The water management infrastructure (source water tanks, flowback tanks, and the large above ground tanks) located on the pad at WK13 is shown in Figure 3.2.
Further details regarding the water monitoring programs, triggers and responses are provided in the SGMP (AGL, 2014b).

AGL_PEL285_PWMP_V1-5_221014_Final.docx_22.10.2014 18
Figure 3.1: Waukivory wells and water gathering and transfer lines

AGL_PEL285_PWMP_V1-5_221014_Final.docx_22.10.2014 19
Figure 3.2: WK13 proposed site layout – Water infrastructure

AGL_PEL285_PWMP_V1-5_221014_Final.docx_22.10.2014 20
3.3.1. Flooding
A quantitative assessment of floodplain obstruction and contingency management of the Waukivory Pilot activities has been completed and is provided in the Preferred Activity Report for the Waukivory REF (EMGA MM, 2013b).
The proposed installation of water and gas gathering lines by HDD under Waukivory Creek effectively removes the interaction between the gathering lines and flood water at the Avon River and Waukivory Creek. Therefore, flood impacts are expected to be negligible.
Well surface infrastructure at WK12, WK13 and WK14 is within the 1 in 100 year AEP flood level. Well surface infrastructure including the temporary above‐ground water tanks at WK13 and the three 20 foot flares at WK12 are relatively small and were considered by the flood assessment to be insignificant from a flood impact point of view.
The proposed changes to the preferred activity in the Further Addendum to the REF did not include any significant change to the noise barriers assessed in the Preferred Activity Report (PAR). Noise barriers were considered to be the most significant infrastructure from a flood impact point of view, however the flood impacts were still assessed to be negligible.
The risk of a significant flood event resulting in the mixing of flowback water or produced water with flood waters is also very small. The well heads are fully enclosed and water gathering lines buried. The above-ground water tanks at WK13 will be constructed to have 500 mm freeboard above the 1 in 100 year AEP flood level and an operating freeboard of 500 mm will be maintained in the water tanks at all times to allow for heavy rainfall. The maintenance of an operating freeboard will be monitored through the AGL ‘daily environmental checklist’ procedure and remotely monitored and alarmed continuously through telemetry.
The implementation of the mitigation strategy outlined in the REF and the PAR are considered appropriate to manage flood impacts and minimise the impacts of floodplain obstruction arising from the Preferred Activity.
Measures to protect the floodplain, as stated in the REF and PAR, include:
the 1.5ML above‐ground water tanks at the water staging point will be designed to have 500 mm freeboard above the 1 in 100 year AEP flood level to prevent overtopping during a flood event. This will prevent the mixing of flowback water and produced water with flood waters;
the operating procedure for the 1.5ML above‐ground water tanks at the water staging point will include maintaining 500 mm freeboard in the tanks at all times. The level of freeboard in the tanks will be monitored through the AGL’s ‘daily environment checklist’ procedure;
weather will be monitored, and in the event of a flood, pumping will cease and any flowback water levels will be decreased through transportation to appropriate facilities;
noise barriers will only be installed on site for the duration of fracturing; and
if enough time is allowed prior to a flood, noise barriers will either be dropped flat or opened to allow water flow through the area.
3.3.2. Contingency planning and emergency management
AGL has prepared a detailed Environmental Management Plan (EMP) for all our exploration activities associated with PEL 285 (AGL, 2014d). This EMP details environmental

AGL_PEL285_PWMP_V1-5_221014_Final.docx_22.10.2014 21
management requirements around our exploration (flow testing) programs. In regard to flow testing and associated produced water management there are also separate sub-plans for:
Flood Management; and
Soil and Water Management.
In addition, AGL has prepared an Emergency Response Plan (ERP) and Pollution Incident Response Management Plan (PIRMP) for all PEL 285 activities (AGL, 2014e). These plans deal with responses to:
Flooding;
Oil and chemical spills which include produced water management; and
Notification and reporting to regulatory agencies, including regulatory agency contact details.
These documents would be available for inspection if required by the relevant agencies. The PIRMP is available on AGL’s website.
Specifically in regard to the Waukivory Pilot, there are:
Extra frac tanks on each well pad to deal with any surcharges of flowback water and produced water, or should temporary storage be required prior to pumping to the large above-ground tanks for off-site disposal or further pumping to the TED;
Alarmed systems on the 1.5ML above-ground storages that alert operators regarding leaks and storage levels; and
An on-site vac truck to capture any spills within the ‘duck pond’ and water transfer areas.
3.4. Exploration program water management
Most water is generated from pilot testing activities (i.e. the flowback water and the produced water). However, to describe all waters that are stored and either reused or disposed as part of the PEL 285 exploration activities, AGL has included in this PWMP:
water generated from groundwater drilling activities where natural groundwater is produced from shallow aquifers during the construction and development of monitoring bores; and
residual water from previous drilling and pilot testing programs.
Exploration program water management activities are shown schematically in Figure 3.3.

AGL_PEL285_PWMP_V1-5_221014_Final.docx_22.10.2014 22
Figure 3.3: Extracted water types and adopted reuse/disposal options
3.5. Staging of the implementation of the PWMP
As the (produced water) exploration work program activities relates only to the TIP and the Waukivory Pilot program at this time, there is limited staging information included for the implementation of this plan. Different Water Management Plans (WMPs) for the different exploration activities will describe the detailed water management and monitoring requirements.
As at the date of this version of the PWMP, there is one approved pilot testing program (Waukivory), one approved blended water irrigation program (TIP), and several minor approvals relating to pumping/flow tests and water monitoring bore drilling and sampling programs. The following WMPs apply to these activities:
This PWMP;
The TIP WMP (AGL, 2012) applies to the historical produced water that was stored in Tiedman Dams (TSD and TND), plus the beneficial reuse of new produced water from new flow tests and pilot testing programs during the currency of the approval; and
The Waukivory surface water and groundwater management plan (AGL, 2014b).

AGL_PEL285_PWMP_V1-5_221014_Final.docx_22.10.2014 23
4. Produced Water
4.1. Sources
Expected sources of produced water across the PEL 285 area are:
Pilot testing of new gas wells for appraisal purposes (including hydraulic fracturing); and
Workover activities on (exploration) gas wells.
4.2. Estimated Quantity
Produced water volumes from pilot testing depend on the length of the pilot testing programs; however volumes typically diminish over time. Typical water production curves are shown in Figure 4.1.
Figure 4.1: Typical gas and water production profiles
At Gloucester, produced water rates from pilot testing generally peak around 0.5 litres per second (L/s) per well at the commencement of pilot testing programs but quickly diminish to much lesser volumes (typically an order of magnitude lower). A recent example is the flow testing of the Craven 06 well (PB, 2014d) that produced a peak 0.7 L/s at the commencement of the program but quickly diminished to less than 0.05 L/s.

AGL_PEL285_PWMP_V1-5_221014_Final.docx_22.10.2014 24
Maximum expected volumes for wells on test would be around 5 ML per year (ML/year) if the wells were continually operating. Pilot tests are rarely longer than 3 to 9 months.
At Gloucester, the peak production rate of any new gas well (especially after fracture stimulation) would be in the first 2 months of operation. It is not possible to provide an accurate water production rate or volume for any particular gas well or any particular pilot without completing a pilot testing program. The pilot testing is akin to a long term pumping test on a new water supply bore to determine the optimum pumping rate, pump setting and likely extraction volume.
For the Waukivory Pilot, there are four wells that will be pilot tested concurrently (WK11, WK12, WK13, and WK14). Each of these wells is licensed for 5 ML/year (this is the combined flowback and the produced water volume). This volume is based on historical pilot testing programs, the most recent of which produced about 2ML for a 6 to 9 month period of operation (for each of CR06 in 2013/2014 and WK03 in 2013). An estimate of the quantity for the expected sources of produced water is included in Table 4-1.
Table 4-1: Estimated of produced water volume for a typical pilot well
Source Maximum estimated produced water (ML/year)
Pilot testing (per well) 5Workover (per well) <0.1
4.3. Water Quality
The water quality of the produced water varies according to the geology of the region. Water quality data is available from historical flow testing programs across the Gloucester basin with the most recent testing programs on Waukivory 03 (WK03) located towards Gloucester and Craven 06 (CR06) located south of the Stage 1 GFDA. Water testing undertaken at the CR06 well to the south of the Stage 1 GFDA provides an indication of expected produced water quality in the average to maximum water salinity range.
Typical groundwater quality characteristics of produced water are described below.
Salinity
The CR06 well is located near the centre the Gloucester Basin. Wells located more centrally within the basin are expected to produce water with a higher salinity than wells located further east. This is due to the groundwater recharge which mostly occurs along the eastern coal seam outcrop area.
Based on the available water quality data and existing groundwater salinity classifications, deep groundwater in the Gloucester Basin may be classified as brackish to moderately saline. Most produced waters are expected to be either brackish or slightly saline. The produced water is generally dominated by sodium, chloride and bicarbonate. Salinities can range from 3000 to 12000 µS/cm with CR06 having a salinity of around 7000 µS/cm.
Produced water from the Waukivory pilot program (for the purpose of transition from flowback to produced water) is natural groundwater extracted after recovery of 100% of the volume injected plus the water quality reaching a salinity of 5000 µS/cm.
pH.
The pH of most natural waters ranges between 5.0 and 8.0. The pH of produced water at Gloucester is slightly alkaline (7.5 – 9.5).

AGL_PEL285_PWMP_V1-5_221014_Final.docx_22.10.2014 25
Alkalinity
Alkalinity is the measure of water's ability to neutralise acids. Carbonate ions (CO3-) from dissolved salts such as calcium carbonate (CaCO3), bicarbonate ions (HCO3-) from dissolved salts such as calcium bicarbonate (Ca[HCO3]2), sodium bicarbonate (NaHCO3), and magnesium bicarbonate (Mg[HCO3]2) are the major chemicals contributing to alkalinity in the produced water.
Hydroxide ions (OH-) are a minor contributor in most cases which is the case for the Gloucester water with a hydroxide alkalinity figure of <1 mg/L expressed as CaCO3.
The bicarbonate levels in the produced water are predicted to range from 1,400 mg/L to 4,000 mg/L (expressed as CaCO3) with CR06 showing a concentration of 2,020 mg/L indicating a high alkalinity.
Sodium and Chloride
Sodium and chloride are two of the most common elements in produced water (ranging from 1,200 mg/L to 3,400mg/L for sodium with CR06 showing a concentration of 1,710 mg/L and chloride levels ranging from 900 mg/L to 2,500 mg/L with CR06 showing a concentration of 1,270 mg/L).
Potassium
The potassium levels in the produced water at Gloucester are low with a predicted range of 8 mg/L to 18 mg/L, with CR06 showing a concentration of 12 mg/L.
Calcium and Magnesium
For the produced water at Gloucester the calcium and magnesium content is relatively low. Calcium is predicted to range from 6 mg/L to 18 mg/L with CR06 showing a concentration of 9 mg/L whereas magnesium is predicted to range from 3 mg/L to 8 mg/L with CR06 showing a concentration of 4 mg/L.
Manganese
The manganese levels in the produced water are predicted to range from 0.3 mg/L to 1.0 mg/L with CR06 showing a concentration of 0.475 mg/L.
Iron
The iron levels in the produced water are predicted to range from 30 mg/L to 70 mg/L, with CR06 showing a content of 37.8 mg/L. This is a high iron concentration but is typical of natural groundwater.
Strontium
The strontium levels in the produced water are predicted to range from 2 mg/L to 6 mg/L, with CR06 showing a content of 3.06 mg/L.
Other Trace Metals & Inorganics
The arsenic, beryllium, boron, cadmium, chromium, cobalt, lead, mercury, molybdenum, nickel, selenium, uranium and vanadium content of CR06 produced water were below the limit of reporting (i.e. results are ’non detect’) for the particular metal, and do not present any issues with regard to reuse or disposal (i.e., are well within the ANZECC guidelines for irrigation).
The aluminium, barium, copper, and zinc content of CR06 were at low levels and do not present any issues with regard to reuse or disposal (i.e., are well within the ANZECC guidelines for irrigation).
Trace metals and inorganics are found in negligible concentrations in the produced water from the Gloucester Basin groundwater systems.

AGL_PEL285_PWMP_V1-5_221014_Final.docx_22.10.2014 26
Fluoride
Fluoride is found in most natural waters at low concentrations 0.01 mg/L to 0.5 mg/L. The fluoride present in the produced water is predicted to range from 1.0 mg/L to 3.0 mg/L, with CR06 showing a content of 1.4 mg/L.
Boron
The boron present in the produced water is predicted to range from 0.2 mg/L to 0.5 mg/L with CR06 showing a content of 0.27 mg/L.
The water quality at a particular gas well is unlikely to change over the period of a 6-9 month pilot testing program, as all coal seams are likely to be contributing to the produced water volume. However as water volumes diminish and some coal seams produce less water, the water quality may change. Again this water quality profile cannot be predicted without first completing the pilot testing program.
Response triggers and notifications regarding changing water quality at any of the pilot gas wells is outlined in the SGMP (AGL, 2014) – Section 6.5. Essentially AGL is proposing that NOW will be notified if the water salinity from any of the gas wells swaps between the nominated salinity classes (see salinity classification in the Glossary).
4.4. Containment and Treatment Measures
4.4.1. Waukivory Pilot
The Waukivory pilot comprises the following produced water infrastructure and containment facilities:
Containment:
o A 1.5 ML, purpose built, double lined above ground tank (originally used for source water) will remain on site at WK13 as a balance tank for the temporary storage of produced water, or until such time that produced water volumes are low enough for either an alternate (smaller) tank to be installed or water is transferred directly via buried pipeline to the Tiedman East Dam (TED); and
o ‘Duck pond’ secondary containment for several above ground storage tanks with tank capacity up to 75,000 L (excluding the 1.5 ML above ground tank) will be used at each well site to capture 110% of potential stored volume of ancillary tanks.
Infrastructure:
o Four gas wells (WK11, WK12, WK13 and WK14) will produce produced water. Produced water will be tested prior to storage in the 1.5 ML above ground storage tank at WK 13;
o Water pipelines (buried) to and from each gas well (WK11, WK12 and WK14) to and from the WK13 above ground storage tank; and
o A produced water pipeline (buried) to discharge produced water from the above ground storage tank at WK13 to the Tiedman East Dam (TED).
The TIP comprises three dams located on the Tiedman property, to store produced water from various exploration activities and freshwater from approved surface water sources for blending and irrigating:
TND;

AGL_PEL285_PWMP_V1-5_221014_Final.docx_22.10.2014 27
TSD; and
TED.
Each of these dams is of a ‘turkey’s nest’ style construction, HDPE lined, 20ML in capacity, and located on high ground (beyond the floodplain) and are designed to prevent ingress from surface run off.
The two older dams (TND and TSD) are single lined ponds that have contained produced water from historical pilot testing programs and drilling programs. Currently TSD is the blended water irrigation dam for the TIP, and TND contains the residual produced water from historical programs that has not yet been blended and irrigated.
The newer dam (TED) is a double lined dam purpose built for the produced water for the Waukivory Pilot and any future exploration pilots that are approved and commissioned. Recently this dam has been used to store freshwater harvested from the Avon River prior to its being used for blending and irrigation for the TIP.
4.4.2. Workover Activities
Workovers will comprise the following produced water containment facilities:
Containment:
o Several above ground tanks (75,000L capacity each) for the temporary storage of produced water prior to transfer via either the buried pipeline or road tanker to the TED.
Infrastructure:
o Individual gas wells that require a workover will generate produced water during the workover.
4.5. Beneficial Reuse or Disposal
Produced water stored in the TED shall be beneficially re-used as follows:
Industrial uses such as:
o Fracture stimulation. If water from the Pontilands Dam was not available for fracture stimulation purposes then stored produced water from the TND or TED could be used as the source water for fracture stimulation purposes. However given availability and in accordance with all necessary approvals, Pontilands Dam water is to be used for the Waukivory Pilot fracture stimulation program. Future pilots however may require stored produced water for fracture stimulation purposes.
o Drilling and workovers. Small quantities of stored produced water may be required from time to time for drilling and workover programs. This water could be taken from any of the Tiedman dams depending on the quality and availability of water in each of these dams. Water volumes are expected to be small and less than 50,000 L per well. There are no drilling programs planned for 2014/15 that would use this water but some recycled produced water may be required at Waukivory for well workover purposes in the coming months.
o Miscellaneous industrial purposes. Very small quantities of produced water may be used for miscellaneous agricultural / industrial purposes such dust suppression and fire-fighting (if required). Water would only be used for

AGL_PEL285_PWMP_V1-5_221014_Final.docx_22.10.2014 28
these purposes if the water quality was suitable and the water salinity was less than 2,000 µS/cm.
Blended and re-used for irrigation:
As part of its current exploration program, AGL has approval to irrigate a maximum of 70 ML of produced water over a maximum area of 40 ha over a two to three year period (the original approval was for two years from 5 July 2012 to 4 July 2014. This approval has recently been extended to 30 April 2015). Irrigation includes water from historical exploration programs which is stored in the Tiedman dams, as well as any rainfall which falls in the dams. This water is blended with freshwater from sources including the Avon River to optimise the quality of the irrigated water.
A surface water and groundwater monitoring program commenced in October 2011 and was established in accordance with the approved Water Management Plan (AGL, 2012). The monitoring aims to ensure that the quality of the water used for irrigation is appropriate and that the application of irrigated water does not result in impacts on the local surface water or groundwater resources.
The 40 ha irrigation area is divided into two areas, being the Stage 1A and Stage 1B areas:
o Stage 1A is the intensive irrigation area serviced by a lateral move irrigator in the north-west portion of the Tiedman property. The lateral move irrigator irrigates a maximum area of 18.2 ha, including 16 x 0.75 ha plots (12 ha) incorporating four different soil improvements.
o Stage 1B comprises the existing irrigation area of about 8.6 ha (of which about 4 ha is currently under irrigation) plus an expansion area to the west and south (if required). It is highly unlikely that this additional area of 21 ha will be required.
The irrigation water is a blended water mix with an electrical conductivity (EC) of around 1,500 µS/cm (although 2,000 µS/cm is the upper limit for the irrigation of blended water). The target water salinity is expected to be mostly in the range 1,400 to 1,600 µS/cm. The blended water comprises an approximate ratio of three parts fresh water and one part produced water. The irrigation program allows salt tolerant crops to be grown, with continuous cropping over summer and winter.
Regional groundwater level monitoring commenced in January 2011 and surface water level monitoring commenced in March 2011. A baseline groundwater and surface water monitoring program was conducted between October 2011 and September 2012 to define pre-irrigation conditions (PB, 2013a). Subsequent irrigation program water compliance 6 monthly reports have been submitted to the OCSG since August 2013. This monitoring program will continue for the period of the Tiedman irrigation approval.
The main irrigation program began on 29 April 2013 for the Stage 1A area and on 1 May 2013 for the Stage 1B area (using blended water). Lower salinity produced water was also irrigated across the Stage 1B area from 16 October to 8 December 2012, to create some space in the TSD for blending the remaining produced water with fresh water sources. Depending on the availability of new sources of produced water and freshwater for blending, the irrigation program will continue to 30 April 2015.
For the entire irrigation program to 4 July 2014, 45 ML of produced water has been irrigated and only 7 ML of produced water remained in TND. There was no blended water remaining in TSD. Recent rainfall has allowed the harvesting of some additional freshwater which is now stored in TSD.

AGL_PEL285_PWMP_V1-5_221014_Final.docx_22.10.2014 29
The beneficial reuse option selected will be dependent upon the status of the TIP approvals. Currently the TIP approval allows the irrigation of blended water until the 30 April 2015.
4.6. Controls
4.6.1. Infrastructure and Containment - Pilots
The control measures that are in place to prevent and/or minimise pollution from infrastructure and containment of produced water at the Waukivory Pilot area and the TED are listed in Table 4-2.
Table 4-2: Produced Water Infrastructure and Containment Control Measures
Containment Control Measures
Frequency Responsibility Records
1.5 ML above ground storage tank (at WK13) and associated infrastructure.
Double HDPE lining
N/A
Alarmed and activated sump that recirculates water to the tank
Continuous – check weekly
Operations Manager
Field sheet
Visual inspection of the collection sump that drains between the double liners.
Weekly Operations Manager
Field sheet
Visual inspection to assess the integrity of the liner; condition of secondary containment; fill level; signs of seepage around the tank base; alarms, and potential impact from flood.
Weekly unless pending high rainfall or local flood event (inspections then to be daily for the duration of rainfall event) *
Operations Manager
Field sheet
Water quality monitoring at WK11, WK12, WK13 and WK14
Every fortnight for first 8 weeks then every 2 months thereafter
Senior Hydrogeologist
Field sheets and CoCs
TED ** Double HDPE lining.
N/A

AGL_PEL285_PWMP_V1-5_221014_Final.docx_22.10.2014 30
Containment Control Measures
Frequency Responsibility Records
Visual inspection of the collection sump that drains the mesh between the double liners.
Weekly Operations Manager
Field sheet
Water quality sampling and analysis of TED produced water and water from the TED inspection sump.
Quarterly Senior Hydrogeologist
Field sheets and CoCs
Water quality sampling (EC) of water in the inspection sump at TED
Monthly Environmental Manager
Field sheet
Visual inspection to assess the integrity of the liner; fill level; signs of seepage around the pond base and downgradient of TED.
Weekly Operations Manager
Field sheet
TSD and TND ** Visual inspection to assess the integrity of the liner of each dam, fill level; signs of seepage around the base and downgradient of TSD and TND.
Weekly Operations Manager
Field sheet
Water quality sampling and analysis of TSD and TND waters
Quarterly Senior Hydrogeologist
Field sheets and CoCs
Calibration of salinity logger in TSD
Quarterly Senior Hydrogeologist
Check against manual WQ records on field sheet

AGL_PEL285_PWMP_V1-5_221014_Final.docx_22.10.2014 31
Containment Control Measures
Frequency Responsibility Records
Calibration of hand held salinity meter
Monthly Environmental Manager/Farm Manager
Calibration sheet
Water level monitoring of the two seepage monitoring bores around TND and TSD.
Continuous Senior Hydrogeologist
Excel data file
Calibration of water level loggers in two seepage monitoring bores
Quarterly Senior Hydrogeologist
Check against manual WL records on field sheet
Water quality monitoring of the two seepage monitoring bores around TND and TSD.
Quarterly Senior Hydrogeologist
Field sheets and CoCs
Water gathering lines Pressure testing of water gathering lines.
Prior to commissioning
Operations Manager
Construction Records
Inspection of water gathering lines within the immediate pilot area
Daily Operations Manager
Field Sheet
Inspection of water gathering lines from WK13 to TED
Weekly Operations Manager
Field Sheet
Comparison of volumes discharged from the WK13 above ground storage tank meter to the volumes received at the TED meter.
Daily Operations Manager
Field Sheet
Calibration records for in-line water meters
Tba Operations Manager
Field Sheet

AGL_PEL285_PWMP_V1-5_221014_Final.docx_22.10.2014 32
Containment Control Measures
Frequency Responsibility Records
Above ground storage tanks with capacity up to 75,000 L
Inspection of ‘duck pond’ secondary containment
Daily Operations Manager
Field Sheet
Visual inspection to assess the integrity of the tanks; condition of secondary containment; fill level; signs of leakage around the tanks; and potential impact from flood.
Daily Operations Manager
Field Sheet
Notes: * if the WK13 site is inundated by flooding and access is not possible to inspect the tanks then the inspection will occur on the first day after floods recede and the site is accessible ** additional monitoring bores are proposed around TSD, TND and TED as part of the EWMS and the 2015/16 water management strategy for the Stage 1 GFDA
4.6.2. Leak detection at TED
As all produced water is to be stored in the TED, the leak detection inspection sump at this dam is fundamental to assessing leaks to the liner. The details regarding the installation and the specifications of the inspection sump are provided in Appendix 3. It is proposed that the inspection sump be monitored weekly and a water level be taken relative to the top of casing.
Field water quality monitoring is proposed on a monthly basis (EC and other field parameters) to ensure that the salinity is not increasing and approaching the salinity of produced waters stored in the TED.
It is proposed that the sump be purged every three months and water samples be taken for analysis. This water sample will be taken in combination with the quarterly water samples of the water in TED.
There is no requirement for additional monitoring bores upgradient and downgradient of the new double lined storage dam (TED) at this time. Maximum produced water volumes from Waukivory are expected to be 14-16 ML, and most likely (depending on length of test etc) to be less than 10 ML. If the TIP approval is extended beyond the length of the Waukivory flow test, then most of this water will be blended and irrigated in 2015 so little will remain in storage in TED. Additional monitoring bores are proposed as part of the EWMS to be implemented in 2015/16.
4.6.3. Water quality monitoring
For the Waukivory pilot testing program, water quality monitoring will occur at the following locations:
Individual wells (WK11, WK12, WK13 and WK14) where produced water will be monitored;

AGL_PEL285_PWMP_V1-5_221014_Final.docx_22.10.2014 33
TED and TND storages for produced water;
TSD storage for blended produced water;
Seepage monitoring bores surrounding TSD and TND; and
Seepage monitoring at inspection sump between double liners on TED.
For the Waukivory Pilot, full details of water monitoring (including parameters monitored, sampling procedures, sampling frequency for each parameter, sampling locations, reporting and availability of monitoring results and monitoring data, and proposed response triggers for reporting to agencies) are provided in AGL, 2014b.
All testing is carried out by a National Association of Testing Authorities registered facility.
For the TIP, water quality monitoring will occur at the following locations:
Each of the three Tiedman dams (TSD TSN and TED);
Three surface water locations;
Six groundwater monitoring locations;
Two catch dams;
Seepage monitoring bores surrounding TSD and TND; and
Selected perched soil water monitoring locations.
Full details of the TIP water quality monitoring (including parameters monitored, sampling procedures, sampling frequency for each parameter, sampling locations, reporting and availability of monitoring results and monitoring data, and proposed response triggers for reporting to agencies) are provided in the Tiedman WMP (AGL, 2012).
Similar water quality monitoring programs would be in place for any future pilots.
4.6.4. Water volume monitoring
There is substantial monitoring of water volumes around pilot testing programs. Metering (or monitoring) of water volumes occurs at the following locations for the Waukivory Pilot:
At the Pontilands Dam pump site within the water supply line to the 1.5 ML above ground tank at WK13 receiving the source water;
At individual wells (WK11, WK12, WK13 and WK14) during produced water extraction; and
Between the 1.5 ML above ground tank at WK13 receiving the produced water from individual wells and at the TED receiving dam.
Further details regarding the water monitoring network are provided in the Surface and Groundwater Management Plan (SGMP) for the Waukivory Pilot (AGL, 2014b).
4.7. Records
Records of control measures that prevent and/or minimise pollution from infrastructure and containment are listed in Table 4-2.
Data from the Waukivory Pilot will be collated and analysed and the results interpreted and written up into detailed technical reports that include:
For the water monitoring program under the PEL approval, AGL will produce:

AGL_PEL285_PWMP_V1-5_221014_Final.docx_22.10.2014 34
o Baseline data reports (to February 2014) (PB, 2014c);
o Baseline data reports (March to October 2014) (PB in Prep); and
o Final technical report of all the water data collected through the fracture stimulation and flow testing program.
Trend analysis and reporting occurs in respect of:
o Water level data;
o Water quality data and several key analytes; and
o Water volume data.
Several graphical methods are used to assess the water quality data and apparent trends including:
o Piper tri-linear diagrams; and
o Time series plots (with ANZECC thresholds).
Under the recently granted EPL, AGL will publish monthly water monitoring reports and compile information into an annual report regarding the:
o Water level and water quality trend data.
Data from the TIP is collated and analysed and the results interpreted and written up into detailed technical reports that include:
For the water monitoring program under the REF approval, AGL has produced:
o Baseline data report (February 2012) (PB, 2013c); and
o Monitoring reports within 2 months of the conclusion of each 6-monthly reporting period (6-monthly periods being end of June and end of December each year – ongoing) (PB, 2013d, PB, 2014a, PB, 2014b).
Trend analysis and reporting occurs in respect of:
o Water level data;
o Water quality data and several key analytes; and
o Water volume data.
Several graphical methods are used to assess the water quality data and apparent trends including:
o Piper tri-linear diagrams; and
o Time series plots (with ANZECC thresholds).
Under the recently granted EPL, AGL will publish monthly water monitoring reports and compile information into an annual report regarding the:
o Water level and water quality trend data.

AGL_PEL285_PWMP_V1-5_221014_Final.docx_22.10.2014 35
5. Flowback Water
5.1. Source and Estimated Quantity
For the purposes of pilot programs at Gloucester, flowback water is defined as the return to surface of fracture stimulation fluids before transition to natural formation water (groundwater), after which fluid flowing from the well is termed produced water (i.e. the first return water after a fracture stimulation program being 100% of the volume of fracture stimulation fluids injected at each well plus all return water with a salinity up to 5,000 µS/cm).
This is the current criteria adopted for the Waukivory pilot program; however the water quality criteria may change from pilot to pilot.
5.2. Containment and Treatment Measures
The Waukivory pilot comprises the following flowback water infrastructure and containment facilities:
Containment:
o One 40,000 L open-top, purpose built steel flowback tank with internal diffuser will be located at each well site for immediate storage of flowback water during fracture stimulation and well completion. Once the surface production skid is installed, flowback water will be piped back to the WK13 staging area; and
o One purpose built, double lined, 1.5 ML above ground tank at the WK13 staging area for the temporary storage of flowback water prior to the off-site disposal of this water to a licensed water recycling facility.
o ‘Duck pond’ secondary containment for several above ground storage tanks with tank capacity up to 75,000 L (excluding the 1.5 ML above ground tank) will be used at each well site to capture 110% of potential storage volume of ancillary tanks.
Infrastructure:
o Four gas wells (WK11, WK12, WK13 and WK14) will produce flowback water. Flowback water will be tested prior to storage in the 1.5 ML above ground storage tank(s) at WK 13; and
o Water pipelines (buried) to and from each gas well (WK11, WK12 and WK14) to and from the WK13 above ground storage tank(s).
There will only be temporary storage of flowback water in the open-top flowback tank associated with each well until such time that the water is tested and approved for offsite disposal at an approved water recycling facility.
The 1.5 ML flowback water tank will be constructed and used for approximately three months while flowback of the fracture stimulation water occurs and off-site disposal is required. Pumping to this tank and continuous offsite disposal of water will ensure that there is at least a 500 mm freeboard maintained at this tank. Three to five truck movements per day are anticipated. If heavy rain is predicted, offsite disposal will be accelerated to ensure there is a greater capacity to store flowback waters. Water for disposal at the approved offsite facility will be from a load area adjacent to this tank.

AGL_PEL285_PWMP_V1-5_221014_Final.docx_22.10.2014 36
Disposal of flowback water offsite to appropriately licenced facilities will be at a similar rate to what is being generated to ensure that a large volume is not stored on site. The flowback water tank will be dismantled and taken away after use.
Water quality from individual wells will be monitored in accordance with the methodology in the SGMP (AGL, 2014b) and the water monitoring conditions of EPL 20358. No water treatment is proposed for flowback water.
Similar containment and offsite disposal is planned if any future pilots are planned and approved across PEL 285.
5.3. Beneficial Reuse or Disposal
No beneficial uses for flowback water generated from exploration activities have been recommended at this time (even though the water quality would be suitable for irrigation reuse). All flowback water is to be trucked to an approved and licenced facility either in the Hunter Valley or the greater Sydney metropolitan area.
5.4. Controls
The control measures that are in place to prevent and/or minimise pollution from infrastructure and containment of flowback water at the Waukivory Pilot area are listed in Table 5-1.
Table 5-1: Flowback Water Infrastructure and Containment Control Measures
Containment Control Measures
Frequency Responsibility Records
1.5 ML above ground storage tank (at WK13) and associated infrastructure.
Double HDPE lining
N/A
Alarmed and activated sump that recirculates water to the tank
Continuous – check weekly
Operations Manager
Field sheet
Visual inspection of the collection sump that drains between the double liners.
Weekly Operations Manager
Field sheet
Visual inspection to assess the integrity of the liner; fill level; signs of seepage around the tank base; alarms, and potential impact from flood.
Weekly unless pending high rainfall or flood event
Operations Manager
Field sheet

AGL_PEL285_PWMP_V1-5_221014_Final.docx_22.10.2014 37
Containment Control Measures
Frequency Responsibility Records
Water quality monitoring at WK11, WK12, WK13 and WK14
Every fortnight for first 8 weeks then every 2 months thereafter
Senior Hydrogeologist
Field sheets and CoCs
Water gathering lines and miscellaneous liners
Pressure testing of water gathering lines.
Prior to commissioning
Operations Manager
Construction Records
Inspection of water gathering lines within the immediate pilot area
Daily Operations Manager
Field sheet
Calibration records for in-line water meters
Tba Operations Manager
Field sheet
Inspection of ‘duck pond’ liners
Daily Operations Manager
Field sheet
Water tankers removing flowback water from site
Inspection of containment/ bunds around load areas
Daily Operations Manager
Field Sheet
Tracking volumes delivered offsite to a licenced facility
Daily Environmental manager
Waste disposal dockets
Assessment that that licenced facility is certified for disposal of flowback water.
Monthly Environmental manager
Disposal facility licence
5.5. Records
Records of control measures that prevent and/or minimise pollution from infrastructure and containment are listed in Table 5-1.
Further details regarding the flowback water monitoring network are provided in the Surface and Groundwater Management Plan (SGMP) for the Waukivory Pilot (AGL, 2014b).

AGL_PEL285_PWMP_V1-5_221014_Final.docx_22.10.2014 38
Data from the flowback water monitoring program will be collated and analysed and the results interpreted and written up into a detailed technical report (in combination with the produced water program – see Section 4.7) and will include:
Trend analysis and reporting occurs in respect of:
o Water quality data and several key analytes; and
o Water volume data.
Several graphical methods are used to assess the water quality data and apparent trends including:
o Piper tri-linear diagrams; and
o Time series and trend plots for the fracture stimulation elemental constituents.
Under the recent EPL, AGL will publish monthly water monitoring reports and compile information into an annual report regarding the:
o Water level and water quality trend data.

AGL_PEL285_PWMP_V1-5_221014_Final.docx_22.10.2014 39
6. Natural Groundwater
6.1. Source and Estimated Quantity
In drilling and developing shallow water monitoring bores using air-rotary techniques, natural groundwater is brought to the surface as each hole is drilled to the required target depths. Depths are typically less than 250m and most monitoring bores are completed in shallow aquifers in either the alluvium or fractured rock.
Airlifted groundwater volumes vary from site to site depending on the permeability of the sediments and rocks being targeted. A nested water monitoring bore site with three or four monitoring bores could produce up to 1 ML of natural groundwater. Typically water volumes are between 0.1 and 0.3 ML per nested site. Water quality varies from brackish to slightly salty. Water quality characteristics are similar to those described above for produced water although being shallower groundwater systems, water qualities tend to be slightly less saline.
These airlifted waters are captured in above ground tanks and either reused locally (if the water quality is suitable and there are agreements in place with local landowners) or transported back to the Tiedman holding dams for irrigation reuse. To date at Gloucester, all waters have been transported back to the Tiedman dams for reuse.
6.2. Containment and Treatment Measures
Produced water from monitoring bore construction programs is stored on site in above ground tanks (75,000 L capacity) or open top tanks (40,000 L capacity) and then transferred by road tanker to the Tiedman dams for either industrial use or blended water irrigation (refer Section 4.4, 4.5 and 4.6).
No treatment is required.
6.3. Beneficial Reuse or Disposal
Natural groundwater from monitoring bore programs is usually co-disposed and stored with the produced water at the Tiedman dams.
If the water quality is suitable for local reuse (such as for stock use and dust suppression purposes) it may be beneficially used on the properties where the drilling has occurred. If the water quality is not suitable for local reuse, natural groundwater from groundwater monitoring drilling, development, purging and sampling programs may be transferred to the Tiedman dams for storage prior to reuse.
Further details are provided in individual WMP for these programs (such as AGL, 2013).
For the water monitoring bores constructed with air rotary, local reuse for stock use is preferred but would only be undertaken with the agreement of the local landholder and if the following assessment is undertaken:
If the (airlifted) groundwater salinity is less than 2000 µS/cm (about 1300 mg/L TDS) then water will be either:
o used for dust suppression;

AGL_PEL285_PWMP_V1-5_221014_Final.docx_22.10.2014 40
o transported to selected farm dams/tanks and reused for watering of stock (cattle); and / or
o transported back to the Tiedman produced water dams (if the water is surplus to local requirements).
If the (airlifted) groundwater salinity is greater than 2000 EC (about 1300 mg/L TDS) but less than 6000 µS/cm (about 4000 mg/L TDS) then the water will be:
o transported to selected farm dams/tanks and reused for watering of stock (cattle);
o will only be used for dust suppression if blended with low salinity water so as to achieve a salinity of less than 2000 µS/cm (about 1300 mg/L TDS); and/or
o transported back to the Tiedman produced water dams (if the water is surplus to local requirements)
If the (airlifted) groundwater quality is greater than 6000 µS/cm (about 4000 mg/L TDS) then the water will be captured and transported back to the Tiedman produced water dams.
The salinity threshold of 6000 µS/cm is based on the ANZECC (2000) guidelines for beef cattle.
For shallow monitoring bores, the water type is expected to be a (brackish to slightly salty) sodium bicarbonate (Na-Cl-HCO3) water with neutral pH and low dissolved metals.
Local reuse will also minimise vehicle movements to and from private properties on the local lanes and roads, and along the Bucketts Way.
6.4. Controls
The control measures that are in place to prevent and/or minimise pollution from the above ground tanks on site during groundwater monitoring drilling, development, purging and sampling programs are listed in Table 6-1.
Table 6-1: Groundwater monitoring program Control Measures
Containment Control Measures Frequency Responsibility Records
Above ground storage tanks (capacity up to 75,000 L) or open top tanks
Multiple above ground tanks and float controls/ inspection
Pre-commencement
Operations Manager
Completion Records
Visual inspection of the tank float / inspection control
Daily Operations Manager or Supervising Consultant
Daily sheet
Water tankers removing natural groundwater from site
Inspection of load areas
Daily Operations Manager
Daily sheet
Tracking volumes delivered to Tiedman dams
As required Environmental Manager
Transport Dockets

AGL_PEL285_PWMP_V1-5_221014_Final.docx_22.10.2014 41
6.5. Records
Records of control measures that prevent and/or minimise pollution from groundwater monitoring programs are listed in Table 6-1.
Water quality and volume data from groundwater intersected during the air-lift drilling programs is monitored and collated, and written up into detailed drilling and completion reports.

AGL_PEL285_PWMP_V1-5_221014_Final.docx_22.10.2014 42
7. Water Monitoring This section of the PWMP is an overview of water monitoring requirements associated with produced water, flowback water and natural groundwater within PEL 285. Full details are provided in the specific WMPs for each of the exploration activities (e.g. AGL, 2012, AGL, 2013 and AGL, 2014b).
7.1. Monitoring water quality
In addition to the PEL, the main water quality monitoring requirements arise from the EPL for AGL’s exploration activities across the PEL. For pilot testing programs, water quality monitoring will occur at the following locations:
Source water locations (or at the large above-ground water tank located on the main pad);
Individual wells where fracture stimulation fluid mixtures are monitored in parallel with the fracture stimulation program;
Individual wells where flowback water is monitored;
Individual wells where produced water is monitored;
TED which is the storage for produced water;
Seepage monitoring bores surrounding TSD and TND; and
Seepage monitoring inspection sump associated with TED.
For the Waukivory Pilot, full details are provided in the Surface Water and Groundwater Management Plan (AGL, 2014b).
For the TIP, water quality monitoring will occur at the following locations:
Each of the three Tiedman dams (TSD, TSN and TED);
Three surface water locations;
Six groundwater monitoring locations;
Two catch dams;
Seepage monitoring bores surrounding TSD and TND; and
Selected perched soil water monitoring locations.
Full details are provided in the TIP WMP (AGL, 2012).
7.2. Monitoring water volumes
There is substantial monitoring of water volumes around pilot testing programs. Metering (or monitoring) of water volumes occurs at the following locations:
At the site of the source water (required under our water licences);
At each individual well to monitor the fracture stimulation (injection) volumes;
At individual wells during flowback;
At individual wells during produced water extraction; and

AGL_PEL285_PWMP_V1-5_221014_Final.docx_22.10.2014 43
Between the above ground tank receiving the produced water and at the TED receiving dam.
For the Waukivory Pilot, full details are provided in Surface Water and Groundwater Management Plan (AGL, 2014b).
For the irrigation program, metering (or monitoring) of water volumes occurs at the following locations:
At the pumps site on the Avon River (required under our water licences);
At the pump site on Pontilands Dam (required under our water licences); and
An in-line meter located on the cart of the linear move irrigator for the Stage 1A area.
Monitoring of volumes irrigated across the Stage 1B area are estimated based on pump rates and hours of operation.
Full details are provided in the TIP WMP (AGL, 2012).
7.3. Data Archival
Key records associated with this PWMP that will be stored and managed include:
Inspection and status monitoring records for pumps, tanks, pipelines and dams;
Metering information for all pumps and delivery lines;
Transport records for road tanker deliveries to Tiedman dams;
Calibration records for water meters;
Water sampling records, field parameter checklist and records, and laboratory analytical reports;
Calibration records for field instruments and continuous loggers (water levels and salinity); and
Waste transportation and disposal certificates;
There are numerous water data sets collected in relation to extracted water management programs. It is proposed that:
water level data from the monitoring bores continue to be archived with our technical specialists;
water quality data from the monitoring bores continue to be archived with our technical specialists;
water level data from the surface water locations (and dam storages) continue to be archived with our technical specialists;
water quality data from the surface water locations continue to be archived with our technical specialists;
volumes used for drilling and fracture stimulation are tracked and archived in spreadsheets by AGL Operations; and
volumes used for irrigation and stock use are tracked and archived in spreadsheets by AGL Agriculture.

AGL_PEL285_PWMP_V1-5_221014_Final.docx_22.10.2014 44
Most data is collected around the blended water irrigation program and associated infrastructure and monitoring networks. Field and laboratory data is interpreted and reported by our technical specialists, and reviewed by subject matter experts in AGL.
Trend analysis and reporting occurs in respect of:
Water level data;
Water quality data and several key analytes; and
Water volume data.
Several graphical methods are used to assess the water quality data and any apparent trends including:
Piper tri-linear diagrams; and
Time series plots (with ANZECC thresholds).

AGL_PEL285_PWMP_V1-5_221014_Final.docx_22.10.2014 45
8. References AGL, 2012, Water Management Plan for the Tiedmans Irrigation Program – Gloucester dated May 2012.
AGL, 2013, Draft Water Management Plan for Wards River Drilling Program dated February 2013.
AGL, 2014a, Fracture Stimulation Management Plan – Gloucester NSW dated June 2014.
AGL, 2014b, Surface Water and Groundwater Management Plan for the Waukivory Pilot Program – Gloucester Gas Project. Version 4.1 dated 21 September 2014.
AGL, 2014c, Gloucester Gas Project –Extracted Water Management Strategy - Consultation Draft dated 21 August 2014.
AGL, 2014d, Gloucester Gas Project, Exploration – Environmental Management Plan dated August 2014
AGL, 2014e, Emergency Response Plan for AGL Upstream Gas Gloucester Gas Project Petroleum Exploration Licence 285 dated August 2014
DWE, 2009, Report Card for Avon River source. Dated August 2009.
EMGA/Mitchell McLennan, 2013a, Review of Environmental Factors – Proposed Fracture Stimulation and Flow Testing Waukivory dated September 2013.
EMGA/Mitchell McLennan, 2013b, Addendum to the Review of Environmental Factors – Preferred Activity Report dated December 2013.
EMGA/Mitchell McLennan, 2014, Further Addendum to the Review of Environmental Factors – Preferred Activity dated June 2014.
NOW, 2012, NSW Aquifer Interference Policy Stage 1 dated September 2012.
Parsons Brinckerhoff, 2011, Irrigation Proposal, Review of Environmental Factors – Gloucester Gas Project. Report PR_5506 Rev B dated June 2011.
Parsons Brinckerhoff, 2012, Phase 2 Groundwater Investigations – Stage 1 Gas Field Development Area Gloucester Gas Project. Report PR_5630 dated January 2012.
Parsons Brinckerhoff, 2013a, Hydrogeological Conceptual Model of the Gloucester Basin, Report PR_7266 dated June 2013.
Parsons Brinckerhoff, 2013b, 2013 Gloucester Groundwater and Surface Water Monitoring - Annual Status Report, report dated 11 October 2013.
Parsons Brinckerhoff 2013c, Gloucester Gas Project – Tiedman Irrigation Trial Baseline Water Monitoring Program, Report PR_6306 dated January 2013.
Parsons Brinckerhoff 2013d, Tiedman Irrigation Trial – August 2013 Water Compliance Report Gloucester Gas Project, report dated 21 August 2013.
Parsons Brinckerhoff 2014a, Tiedman Irrigation Program – Water Compliance Report for the Period 1 July to 31 December 2013 Gloucester Gas Project, report dated 31 January 2014.
Parsons Brinckerhoff, 2014b Tiedman Irrigation Program – Water Compliance Report for the Period 1 January to 4 July 2014 Gloucester Gas Project, report dated 28 August 2014.
Parsons Brinckerhoff, 2014c, Drilling Completion Report: Waukivory Groundwater Monitoring Bores Gloucester Gas Project, report dated 30 July 2014.

AGL_PEL285_PWMP_V1-5_221014_Final.docx_22.10.2014 46
Parsons Brinckerhoff, 2014d, 2013 Flow Testing of Craven 06 and Waukivory 03 Gas Wells, report dated 13 February 2014

AGL_PEL285_PWMP_V1-5_221014_Final.docx_22.10.2014 47
Appendices Appendix 1: Water Management Plan for Tiedman Irrigation Program - Gloucester
Appendix 2: Surface water and Groundwater approvals
Appendix 3: MDR Report Section 1.3 Leak Detector

AGL_PEL285_PWMP_V1-5_221014_Final.docx_22.10.2014 48
Appendix 1: Water Management Plan for the Tiedman Irrigation Program - Gloucester

Water Management Plan for the Tiedman Irrigation Program - Gloucester Date: 14 May 2012

AGL_WMP Tiedman Irrigation_V1-3_140512_Final.docx_14.05.2012
Table of Contents
Glossary ................................................................................. 1
1. Introduction ..................................................................... 5
1.1. Irrigation proposal ..................................................................................... 5
1.2. Objectives .................................................................................................. 7
1.3. Responsibilities .......................................................................................... 7
2. Background ..................................................................... 8
2.1. Landform ................................................................................................... 8
2.2. Catchment and Local Hydrology ................................................................. 8
2.3. Geological and Hydrogeological Setting ..................................................... 8
2.3.1. Geology .................................................................................................... 8
2.3.2. Hydrogeology ............................................................................................ 9
3. Water Management Framework ........................................ 11
3.1. Legislation ............................................................................................... 11
3.1.1. Water Act (1912) ......................................................................................11
3.1.2. Water Management Act (2000) ...................................................................11
3.2. Licences ................................................................................................... 11
4. Monitoring, Contingency Plan and Reporting ...................... 14
4.1. Proposed Monitoring Network .................................................................. 14
4.2. Monitoring Frequency .............................................................................. 18
4.2.1. Water Levels ............................................................................................19
4.2.2. Water Quality ...........................................................................................19
4.3. Water Quality Analytes ............................................................................ 21
4.4. Water Volumes ......................................................................................... 22
4.5. Possible Risks and Mitigation Measures ................................................... 23
4.6. Contingency Plan ..................................................................................... 24
4.7. Reporting ................................................................................................. 25
5. References .................................................................... 26

AGL_WMP Tiedman Irrigation_V1-3_140512_Final.docx_14.05.2012
Figures ................................................................................. 27
Appendices ............................................................................ 28

AGL_WMP Tiedman Irrigation_V1-3_140512_Final.docx_14.05.2012
Document Revision History
Date Version Author Comment
6 January 2012
V1-1 John Ross Draft for Internal Review
20 January 2012
V1-2 John Ross Final for submittal to NOW, DTIRIS and EPA for REF approval
14 May 2012 V1-3 John Ross Final for public release with REF approval

AGL_WMP Tiedman Irrigation_V1-3_140512_Final.docx_14.05.2012 1
Glossary
Alluvium Unconsolidated sediments (clays, sands, gravels and other materials) deposited by flowing water. Deposits can be made by streams on river beds, floodplains, and alluvial fans.
Alluvial aquifer Permeable zones that store and produce groundwater from unconsolidated alluvial sediments. Shallow alluvial aquifers are generally unconfined aquifers.
Aquifer Rock or sediment in a formation, group of formations, or part of a formation that is saturated and sufficiently permeable to transmit economic quantities of water.
Aquifer, unconfined Also known as a water table aquifer. An aquifer in which there are no confining beds between the zone of saturation and the surface. The water table is the upper boundary of an unconfined aquifer.
Australian Height Datum
(AHD)
The reference point (very close to mean sea level) for all elevation measurements, and used for correlating depths of aquifers and water levels in bores.
Bore A structure drilled below the surface to obtain water from an aquifer or series of aquifers.
Coal A sedimentary rock derived from the compaction and consolidation of vegetation or swamp deposits to form a fossilised carbonaceous rock.
Coal seam A layer of coal within a sedimentary rock sequence.
Coal seam gas (CSG) Coal seam gas is a form of natural gas (predominantly methane) that is extracted from coal seams.
Contamination Contamination is the presence of a non natural compound in soil or water, or unwanted compound in chemicals or other mixtures.
Deficit irrigation Deficit irrigation is an optimization strategy in which irrigation is applied during drought-sensitive growth stages of a crop. Outside these periods, irrigation is limited if rainfall provides a minimum supply of water.

AGL_WMP Tiedman Irrigation_V1-3_140512_Final.docx_14.05.2012 2
Total irrigation application is therefore not proportional to the irrigation requirements throughout the crop cycle but it does maximise irrigation water productivity.
Dewatering The process of removing formation water from a targeted coal seam. Dewatering is required to reduce pressure in the coal so gas can desorb and produce.
Discharge The volume of water flowing in a stream or through an aquifer past a specific point in a given period of time.
Drawdown A lowering of the water table in an unconfined aquifer or the pressure surface of a confined aquifer caused by pumping of groundwater from bores and wells.
Electrical Conductivity (EC) A measure of a fluid’s ability to conduct an electrical current and is an estimation of the total ions dissolved. It is often used as a measure of water salinity.
Fractured rock aquifer Aquifers that occur in sedimentary, igneous and metamorphosed rocks which have been subjected to disturbance, deformation, or weathering, and which allow water to move through joints, bedding planes, fractures and faults. Although fractured rock aquifers are found over a wide area, they generally contain much less groundwater than alluvial and porous sedimentary aquifers.
Groundwater The water contained in interconnected pores or fractures located below the water table in an unconfined aquifer or located at depth in a confined aquifer.
Groundwater system A system that is hydrogeologically more similar than different in regard to geological province, hydraulic characteristics and water quality, and may consist of one or more geological formations.
microSiemens per
centimetre (µS/cm)
A measure of water salinity commonly referred to as EC (see also Electrical Conductivity). Most commonly measured in the field with calibrated field meters.
Monitoring bore A non-pumping bore, is generally of small diameter that is used to measure the elevation of the water table and/or water quality. Bores generally have a short well screen against a single aquifer through which water can

AGL_WMP Tiedman Irrigation_V1-3_140512_Final.docx_14.05.2012 3
enter.
pH potential of Hydrogen; the logarithm of the reciprocal of hydrogen-ion concentration in gram atoms per litre; provides a measure on a scale from 0 to 14 of the acidity or alkalinity of a solution (where 7 is neutral, greater than 7 is alkaline and less than 7 is acidic).
Piezometer See monitoring bore
Produced water Natural groundwater generated from coal seams during flow testing and production dewatering.
Recharge The process which replenishes groundwater, usually by rainfall infiltrating from the ground surface to the water table and by river water reaching the water table or exposed aquifers. The addition of water to an aquifer.
Sandstone Sandstone is a sedimentary rock composed mainly of sand-sized minerals or rock grains (predominantly quartz).
Screen A type of bore lining or casing of special construction, with apertures designed to permit the flow of water into a bore while preventing the entry of aquifer or filter pack material.
Sedimentary rock aquifer These occur in consolidated sediments such as porous sandstones and conglomerates, in which water is stored in the intergranular pores, and limestone, in which water is stored in solution cavities and joints. These aquifers are generally located in sedimentary basins that are continuous over large areas and may be tens or hundreds of metres thick. In terms of quantity, they contain the largest volumes of groundwater.
Standing water level (SWL) The height to which groundwater rises in a bore after it is drilled and completed, and after a period of pumping when levels return to natural atmospheric or confined pressure levels.
Stratigraphy The depositional order of sedimentary rocks in layers.
Water bearing zone Geological strata that are saturated with groundwater but not of sufficient permeability to be called an aquifer.

AGL_WMP Tiedman Irrigation_V1-3_140512_Final.docx_14.05.2012 4
Water quality Term used to describe the chemical, physical, and biological characteristics of water, usually in respect to its suitability for a particular purpose.
Water table The top of an unconfined aquifer. It is at atmospheric pressure and indicates the level below which soil and rock are saturated with water.
Well Pertaining to a gas exploration well or gas production well.

AGL_WMP Tiedman Irrigation_V1-3_140512_Final.docx_14.05.2012 5
1. Introduction This Water Management Plan (WMP) has been prepared in advance of the REF approval for the further irrigation of produced water from AGL’s CSG exploration programs within PEL 285 at Gloucester. This WMP relates to the exploration phase produced water that is in storage on AGL’s property known as Tiedmans. The proposal is not related to the Part 3A project approval for the Stage 1 GFDA of the Gloucester Gas Project (GGP) and is a “Pre-Construction” activity.
The data and results of analysis collected from this irrigation trial will however provide relevant and extensive input information for preparation of the Extracted Water Management Strategy (EWMS) required under the Part 3A project approval for the Stage 1 GFDA.
The irrigation areas are located on Tiedmans as described in the REF (PB, 2011). The property is located at Stratford about 9km south of Gloucester as shown in Figure 1. The WMP is only for the Tiedman irrigation areas as outlined in Figure 2.
The REF is to be approved by the NSW Department of Trade and Investment, Regional Infrastructure and Services (DTIRIS) – Industry and Investment (Environmental Sustainability Branch), even though the specific requirements outlined in this WMP have been requested by the NSW Office of Water (NOW).
The WMP is based on the outline provided in the REF, NOW’s letter of 12 August 2011, baseline monitoring initiated by AGL (and its consultants Parsons Brinckerhoff and Fodder King), and discussions with NOW in December 2011. The GMP covers both surface water and groundwater monitoring across the property and focuses on the adjacent receptors (Avon River, Dog Trap Creek and alluvial aquifers) and the underlying shallow rock aquifers.
This WMP is written to address the baseline monitoring program and the proposed monitoring program during the irrigation trial. The irrigation period is expected to be 18-24 months but may extend to 36 months depending on the final volume of produced water from exploration program activities that is required to be reused.
The majority of the monitoring network for this program was installed as part of the extensive groundwater studies for the Stage 1 GFDA as described in PB, 2012. This report also provides useful information and characterisation of the shallow and deep groundwater systems across the Tiedman property to depths of more than 330m.
1.1. Irrigation proposal
The proposal is to irrigate a maximum of 70 megalitres (ML) of produced water over a maximum area of 40 hectares (ha) over a period of three years. This will include water from exploration programs which is already stored in the Tiedman and Stratford dams as well as any rainfall which falls in the dams and any additional produced water from 2012/2013/2014 exploration activities. This water will be blended with water from the Avon River to optimise water quality of the irrigated water.
Within the 40ha irrigation area, there will be a Stage 1A area and a Stage 1B area. The Stage 1A area is the location of an intensive irrigation trial, that involves a lateral move irrigator to:
• Irrigate a maximum area of 18.2ha comprising 16 x 0.77 ha plots (12.3ha) incorporating four different soil improvements

AGL_WMP Tiedman Irrigation_V1-3_140512_Final.docx_14.05.2012 6
• Irrigate a small additional (adjacent) area for enhancements to the trial program in the second or third years
• Grow salt tolerant crops (currently forage sorghum, lucerne and cereals e.g. oats) to provide continuous cropping over summer and winter
• Irrigate with a blended water mix that has a salinity (EC) in the range of 1500 to 2000 µS/cm
• Use blended water at a ratio of about 3 parts river water: 1 part produced water
Irrigation will only occur when there is a soil moisture deficit in the underlying improved soil profile. It is expected that around 50 ML of the produced water in storage (assuming there will be a maximum 70 ML to reuse) will be used across this area. The expected river water volumes to be used for blending with the produced water will be around 150 ML, giving a total of around 200 ML that will need to be irrigated over this 2 to 3 year period.
Two catch dams will be constructed to capture runoff from the trial area during larger rainfall events. The irrigation plan is to maintain an irrigation deficit so there will always be capacity in the treated soil profile to accept rain events in a similar manner to the surrounding soils. Subject to the frequency, intensity and duration of larger rain events, surface runoff may occur from the irrigation area. In such instances, it is planned to capture the initial runoff from the area in the catch dams and return it to the produced water storage dams. After capturing the first flush, it is planned to let any further runoff to overflow the catch dams and become normal overland flow. Soil moisture monitoring will verify the irrigation deficit during the trial period.
The important (irrigation trial) design elements to protect adjacent water sources are:
• Amelioration of the clayey sub-soils by adding organic matter, lime and gypsum to counter deficiencies in the soil and water to be irrigated, and to improve the water holding capacity of the soil profile
• Installation of bund walls and diversion banks to minimise ingress of any overland flow and egress of applied water and thus minimise the volume of run-off into catch dams
• Installation of high-flow float-activated recycle pumps at each catch dam to remove/reduce the risk of overflows from the catch dams by constantly keeping them empty
• Installation of a state-of-the-art irrigation system, real time soil moisture monitoring and carry out daily water balance calculations
• Operation of the irrigation system on a deficit irrigation basis with the deficit to be determined from daily water balance and weather monitoring
• A number of automatic shut down features which include:
o When wind velocities exceed a pre-set level
o When rainfall exceeds a pre-set level
o When there is a mechanical or electrical system fault
• An emergency stop button which can be activated at any time by an operator
• The system knows where it is via GPS and can be set for automatic stops at the physical extremity of the trial area
• Physical barricades anchored into the ground at both extremities of the trial area which will prevent the irrigator from leaving the trial area and activate an emergency stop should the irrigation machine come within 0.5m of the barricade

AGL_WMP Tiedman Irrigation_V1-3_140512_Final.docx_14.05.2012 7
• There is also an automatic shut down provision in the event of pressure losses (e.g. pipe burst) within the supply line from the pump station. The shut off valve is located on the irrigation machine. In addition, there is a hand-operated shut off valve at the pump station
The remaining area (Stage 1B) will be less intensively irrigated using the existing travelling irrigator. This will only be used for the lower salinity produced water (generally water with a salinity (EC) under 3000 µS/cm) and will be directly irrigated during drier periods (mainly spring and summer) onto improved pasture (clovers and kikuyu grass). It is expected that around 15 ML will be irrigated across this area. This will mostly be in the first irrigation season but it could extend into the second summer irrigation season.
There will be no irrigation on the alluvial floodplain soils where water tables are highest, so this reduces potential pathways to shallow aquifers and the Avon River. The intention is that all irrigation water is transpired by the planted crops and pasture.
1.2. Objectives
The purpose of this WMP is to outline the water management strategy and the monitoring network for the quality and quantity of water used for irrigation across the site. The WMP is designed to ensure that the quality of the water used for irrigation is appropriate and that the application of produced/blended water does not result in negative impacts on the local surface water or groundwater resources.
This WMP recognises three stages of irrigation (from PB, 2011):
• Existing irrigation areas (see Figure 1) - current area is 8.6ha, and covers irrigation of the following paddocks:
o Rough Paddock north
o Rough paddock south
o Dairy paddock.
• Stage 1A – is mostly the trial irrigation area serviced by the new linear move irrigator in the north west of the site (Figure 2). Even though this envelope is about 22ha, it is unlikely that any more than 18ha will be involved in the irrigation trial.
• Stage 1B - is an expansion of the existing irrigation area to include the irrigation of improved pasture to the west and south of the existing area. There is an additional 21ha in this envelope but it is uncertain whether any of this additional area will be irrigated during the period of this REF.
This WMP replaces all the initial monitoring and contingency plan details outlined in the REF (PB, 2011).
1.3. Responsibilities
AGL Upstream Investments Pty Ltd (AGL) is responsible for compliance with this WMP. Periodic monitoring of the water quality from the monitoring network will mostly be carried out by AGL’s groundwater consultants Parsons Brinckerhoff. Some additional (monthly) sampling may be undertaken by AGL Operations staff based at Gloucester or technical officers employed by Fodder King who are AGL’s agricultural advisors for the trial.

AGL_WMP Tiedman Irrigation_V1-3_140512_Final.docx_14.05.2012 8
2. Background This chapter provides summary information relating to the landform, geology and hydrogeology for the Stratford area. More details are provided in the REF (PB, 2011) and the Phase 2 groundwater investigation report for the wider region that is the Stage 1 GFDA (PB, 2012).
2.1. Landform
The Gloucester geological basin straddles the Manning River Catchment to the north and the Karuah River Catchment to the south.
The landforms of the locality are guided by the geology of the Stroud Gloucester Syncline and comprise ridges to the east and west, undulating low hills and flat land in the centre where the Avon River flows to the north. The lowest points in the area are on the Avon River floodplain at an elevation of approximately 100 mAHD.
2.2. Catchment and Local Hydrology
The Tiedman property is within the Manning River Catchment (approximately 8,200 km2 in size) and the Avon River Sub Catchment. The Avon River originates to the south west of Gloucester and joins the Gloucester River to the north of the township of Gloucester. Waukivory Creek, Dog Trap Creek and Avondale Creek are also located within the Sub Catchment.
Two produced water storage dams are present on the site (Tiedman North and South dams). A third dam is proposed as part of this irrigation upgrade. These dams are of a ‘turkey’s nest’ style construction and located on high ground (beyond the floodplain) and are designed to prevent ingress from surface run off. Stratford 1 and 3 dams are also of a turkey’s nest construction and are located on the adjacent property owned by Gloucester Coal to the south of the site (Figure 1).
Groundwater recharge contributes to base-flow in local tributaries and creeks following periods of elevated rainfall. The Avon River is a gaining stream most of the time. The exception is when the river is in flood and stream levels are more elevated than the water table levels in the adjacent alluvial aquifer.
Historically correlation between water quality and stream flow typically shows a salinity peak immediately after runoff followed by a reduction in salinity after a prolonged rain event followed by a general increase in salinity as the stream flow reduces and groundwater baseflows increase. The surface water (from the available records) is generally fresh (100 < EC < 1000 µS/cm) and near neutral to slightly alkaline (PB, 2012).
2.3. Geological and Hydrogeological Setting
2.3.1. Geology
The Gloucester Basin is a synclinal structure formed by Permian consolidated sediments. The Permian Rocks display steep dips of up to 90° on the edge of the basin, dipping towards

AGL_WMP Tiedman Irrigation_V1-3_140512_Final.docx_14.05.2012 9
the north south axis, and flattening towards the basin centre. They lay on a basement composed of Early and Late Carboniferous sedimentary and volcanic units that are part of the New England Fold Belt. The geology of the region comprises Quaternary sediments along
the valley floor and Permian rocks along the flanks and over most of the catchment. Carboniferous volcanics form the major east and west ridgelines.
The geological strata of the Gloucester Basin (from youngest to oldest) on a local scale can be summarised as:
• Unconsolidated alluvial deposits along the Avon River (Quaternary in age)
• Sedimentary rocks (including substantial coal measures at depth) of the Gloucester Coal Measures (Permian in age)
• Fractured basement rocks of the New England Fold Belt below the sedimentary rocks (Palaeozoic age)
2.3.2. Hydrogeology
Based on the latest water level, water quality and isotope data from the Phase 2 studies (PB, 2012), there is a good appreciation of groundwater recharge, discharge and flow processes through the different hydrogeological units of the Gloucester Basin. These units (based on SRK Consulting, 2010) are confirmed as:
• Alluvial aquifers;
• Shallow bedrock aquifers;
• Coal seam water bearing zones;
• Confining units.
Only the first two units are aquifers. The deeper rock types are either very poor aquifers/aquitards (coal seams, siltstones and sandstones) or confining aquitard/aquiclude layers (claystones or indurated sandstones).
The alluvium is only shallow (maximum 12m thickness) and in some areas contains an unconfined (sand and gravel) aquifer. Groundwater flow processes are relatively simple with rainfall being the predominant recharge source on the floodplain. Flooding occasionally adds additional recharge water to the alluvial water table. Groundwater discharge from the alluvium is to the rivers as baseflow and shallow groundwater is also expected to be transpired by riparian vegetation.
The bedrock (to a maximum 150m depth) contains mostly tight siltstone and indurated sandstone rock types with occasional thin semi-confined sedimentary/fractured aquifers. Rainfall is the only recharge source to the bedrock aquifers and recharge does not occur everywhere in the landscape. Recharge only appears to occur in areas of rock outcrop. In areas where there is a weathered (clayey) profile, brackish to saline water quality suggests there is negligible (vertical) rainfall recharge. Groundwater flow in bedrock aquifers is lateral, either within local fracture zones or individual strata if there are no interconnecting and open fracture zones.
The groundwater in the deeper bedrock units is moving very slowly with lateral movement within each rock unit predominating. Confining rock permeabilities are very low, coal seam permeabilities are slightly higher (but are still not high enough to be considered useful aquifers).
There are no known groundwater dependent ecosystems (apart from stream baseflow accessions) although there may be some uptake of shallow groundwater (from the alluvium) by native terrestrial vegetation. Diffuse discharge of saline groundwater from bedrock seeps is thought to occur into the alluvium as stream salinity increases during dry

AGL_WMP Tiedman Irrigation_V1-3_140512_Final.docx_14.05.2012 10
periods. Groundwater discharge is diffuse and discharge does not occur at any one point in the landscape.

AGL_WMP Tiedman Irrigation_V1-3_140512_Final.docx_14.05.2012 11
3. Water Management Framework The access, taking and use of groundwater and surface water in NSW is currently managed and implemented by the NOW under two primary legal instruments — the Water Management Act 2000 (WMA) and the Water Act 1912 (WA).
All groundwater in the GGP area is located within two groundwater systems – the alluvial sediments associated with the unregulated streams, and the sedimentary/fractured bedrock aquifers. The alluvial sediments are managed under the Lower North Coast Unregulated and Alluvial Water Sources Water Sharing Plan (WSP) and the WMA, while the deeper sedimentary/fractured rock groundwater is currently managed under the WA.
3.1. Legislation
3.1.1. Water Act (1912)
Since 2003 the Water Act 1912 has been progressively phased out (repealed) and replaced by the Water Management Act 2000.
All of AGL’s bore licences for the GGP are issued under the Water Act 1912 as this is the current water regulation for CSG exploration activity for this water source.
3.1.2. Water Management Act (2000)
There is no Water Sharing Plan for the sedimentary (porous) rocks of the Gloucester Basin at this time and therefore the Water Management Act 2000 currently does not apply to these groundwater sources. The Water Management Act 2000 will come into force for the Gloucester CSG project once the Water Sharing Plan for this water source commences, and the Water Act 1912 is repealed. The timeframe for this to occur is likely to be within the next two years.
The unregulated Avon River and the associated alluvial groundwater source is managed under the Lower North Coast Unregulated and Alluvial Water Sources Water Sharing Plan (WSP). AGL has a Water Access Licence and works approval under this WSP for surface water abstraction from the Avon River.
3.2. Licences
AGL holds seven bore licences for the commercial/industrial extraction/irrigation reuse of groundwater pumped during flow testing programs. The bore licences are linked into a combined allocation of 20 ML per year (two licenses) and 15 ML per year (five licences). No new produced water has been pumped in recent years and further flow testing is not planned at any of these seven Stratford wells in the foreseeable future.
The last five bore licences issued have conditions relating to dewatering volumes and irrigation areas (Condition 9); impact assessment prior to taking water (Condition 10); and prepare, implement and report on the findings of a groundwater management plan (Condition 11). The REF and Irrigation Drainage Management Plan (PB, 2011) addresses Condition 10 while this WMP addresses the monitoring items in Condition 11. More specifically Condition 11(a) (parameter/analytes to be monitored), and Condition 11(b)

AGL_WMP Tiedman Irrigation_V1-3_140512_Final.docx_14.05.2012 12
(monitoring at frequencies of no less than 6 months) are presented in this WMP while Condition 11(c) (details of baseline survey results) are presented in PB, 2011 and PB, 2012.
This produced water is currently stored in the four storage dams. If new pilots are commissioned then additional industrial/irrigation bore licences will be obtained for these gas wells. Details of the current bore licences are provided in Table 3-1.
Table 3-1 Bore Licences held by AGL for irrigation
Lot/DP Licence No.
Issue Date
Period Purpose Allocation (ML/yr)
Local Bore
Names
1/718347 20BL168850 16-Oct-08 5 years Commercial 20* Stratford 1
80/979859 20BL168851 16-Oct-08 5 years Commercial 20* Stratford 3
85/979859 20BL172557 8-Oct-10 5 years Industrial and
Irrigation
15^ Stratford 4
85/979859 20BL172558 8-Oct-10 5 years Industrial and
Irrigation
15^ Stratford 5
85/979859 20BL172559 8-Oct-10 5 years Industrial and
Irrigation
15^ Stratford 6
83/979859 20BL172560 8-Oct-10 5 years Industrial and
Irrigation
15^ Stratford 8
85/979859 20BL172561 8-Oct-10 5 years Industrial and
Irrigation
15^ Stratford 9
Key - * joint allocation between these two licences; ^ - joint allocation between these five licences
AGL also holds a water access licence (WAL 19521) and works approval (20CA204347) to extract 32 ML/yr from the Avon River source adjacent to the site for irrigation. This fresher surface water will be blended with the stored produced water for irrigation of salt tolerant crops.
The access to and use of this water is governed by the current WSP. The key features of water availability and use in the Avon are sourced from the report card for the Avon River water source (DWE, 2009) as outlined below:
• 43 surface water licences
• 1,997 ML allowed to be extracted annually
• Water cannot be traded into the Avon from downstream connected rivers (Lower Manning, Lower Barrington and Gloucester)
Under the WSP, permanent and temporary trading of water licences is allowed but can only be sourced from within the licences allocated for the Avon River source.

AGL_WMP Tiedman Irrigation_V1-3_140512_Final.docx_14.05.2012 13
AGL may seek to purchase water from other licensees along the Avon River to make up possible shortfalls in fresh water for blending (a maximum of 90 ML over three years is anticipated).
Accordingly, any additional water will be sourced under permanent transfer or temporary transfer agreements with other licensees on the Avon River, with such transfers to be approved by NOW. It is noted that the WSP states, “WSPs set the rules by which irrigation licences can be traded. It is expected that over time, there will be an enhanced water market, where licences will be traded both permanently and temporarily.”
If permanent or temporary transfers are not obtained then river usage will be restricted to the volumes available under WAL 19521 and the appropriate blend ratio amount of produced water. No water purchases are required for the current water year (2011/12).
The turkey nest dams do not require licensing as they are holding dams only, they have no catchment, and the water sources feeding them are licensed.

AGL_WMP Tiedman Irrigation_V1-3_140512_Final.docx_14.05.2012 14
4. Monitoring, Contingency Plan and Reporting
Government (through the NSW Office of Water (NOW)) is now requiring a higher level of water monitoring associated with all CSG exploration and production programs. Irrigation of produced water is one of these activities requiring extensive monitoring. These requirements generally relate to:
• A formal water management plan (WMP)
• Installation of dedicated monitoring bores
• Collection of periodic water level, water quality and volumetric data
• Reporting of data and trends
For this irrigation proposal, maximum irrigation rates are likely to be 4-6 ML/ha and the irrigation water quality will not exceed 3000 µS/cm, and for the main trial area the target is to use a blended water mix with a salinity between 1500 and 2000 µS/cm.
Even though the activities associated with this irrigation program are described as a trial it will gather wide-ranging data for development of a comprehensive Extracted Water Management Strategy (EWMS) as required under the Part 3A project approval for the Stage 1 GFDA. The trial aims to collect extensive data to demonstrate the viability and sustainability of irrigating produced water, growing salt tolerant crops at Gloucester and developing design information for future water treatment and irrigation designs.
For this REF the primary objective of the water monitoring network and associated monitoring program is to:
• protect the quality of the surface water flow in the adjacent Avon River
• protect the shallowest aquifers used for water supply across the area. These are the alluvial aquifers and the uppermost sedimentary/fractured rock aquifers.
The baseline monitoring program (for water quality) commenced in April 2011 (with subsequent events in October and December 2011). Water level monitoring across the site commenced in January 2011 as part of the broader Gloucester Gas Project (GGP) program. There is considered to be sufficient baseline data for the irrigation program to commence.
4.1. Proposed Monitoring Network
The proposed water monitoring network is focused on shallow groundwater and the adjacent surface water receptors. The network (together with the broader network that is installed for the GGP) is shown on Figure 3 and described below and in Table 4-1. The following locations are the primary monitoring network:
Climate
• AGL Tiedmans weather station
• Evapotranspiration (Eto) data via iWater from Bureau of Meteorology
Produced water
• Tiedman south dam

AGL_WMP Tiedman Irrigation_V1-3_140512_Final.docx_14.05.2012 15
• Tiedman north dam
• Tiedman new dam (when constructed)
Seepage Monitoring
• Seepage monitoring bores TMB04 and 05, screened in the weathered rock profile adjacent to the existing Tiedmans dams to monitor soil/perched water
Surface water
• Stream gauge ASW01 on the Avon River upstream from the site (Atkins property)
• Stream location TSW02 on Dog Trap Creek upstream of the irrigation areas (Tiedman Property)
• Stream gauge TSW01 on the Avon River down gradient of the irrigation areas Stage 1A and 1B (Tiedman Property).
Groundwater
• Monitoring bores TMB01, 02 and 03, screened in the shallow alluvial aquifer adjacent to Dog Trap Creek and the Avon River (Tiedman Property)
• Monitoring bore S4MB01 screened in the first fractured bedrock aquifer (Tiedman Property)
• Four new (paired) shallow piezometers (0.3-1.2m and 1.5m deep) in the trial irrigation area (Stage 1A) plus an additional site near Catch Dam west– yet to be constructed.
In addition, there will be additional surface water locations monitored during high rainfall events:
Irrigation plot runoff
• Western catch dam (Stage 1A)
• Eastern catch dam (Stage 1A)
Surface water
• Stream location FSW01 on Avon River downstream of Tiedman Property (on the Farley property)
Water quality is the primary monitoring requirement at all sites, although water levels will also be measured continuously at the dedicated stream gauge locations (ASW01 and TSW01) and the dedicated shallow monitoring bore locations (TMB01, 02 and 03 and S4MB01). This network was installed for the broader GGP water monitoring program and has been in place since January 2011.
Additional water level and water quality data can be obtained from the other dedicated monitoring locations across the property (if required for this irrigation monitoring program) should there be any unusual changes in the shallow water monitoring program adopted for this irrigation trial. Contingency plan details are provided in Section 4.6.

AGL_WMP Tiedman Irrigation_V1-3_140512_Final.docx_14.05.2012 16
Table 4-1 Summary of Surface Water and Groundwater Monitoring Locations
Sample ID Location Water Levels
Routine Water Quality and Sampling Frequency by PB
Event Sampling by AGL/FK
Tiedman Nth Tiedman North Dam
Not required
Metals, nutrients, cations/anions quarterly Hydrocarbons annually
Physical parameters – monthly
Tiedman Sth #
Tiedman South Dam
Not required
Salinity logger continuous Metals, nutrients, cations/anions quarterly Hydrocarbons annually
Physical parameters – monthly
Tiedman #3 (new)
Tiedman #3 Dam Not required
Metals, nutrients, cations/anions quarterly Hydrocarbons annually
Physical parameters – monthly
Catch Dam east (small) (new)
North East of Irrigation trial area
Not required
Salinity logger continuous
Physical parameters, metals, nutrients, cations/anions Subject to test results from Catch Dam west overflow event
Catch Dam west (large) (new)
South West of Irrigation trial area
Not required
Salinity logger continuous
Physical parameters, metals, nutrients, cations/anions Sample and test first overflow event only Assess for future events
TMB04 Seepage MB west Dipped quarterly
Physical parameters then purge dry and assess inflows quarterly If inflow within 12 hours then physical parameters again, metals, nutrients, cations/anions
Physical inspection of surrounding area - monthly

AGL_WMP Tiedman Irrigation_V1-3_140512_Final.docx_14.05.2012 17
Sample ID Location Water Levels
Routine Water Quality and Sampling Frequency by PB
Event Sampling by AGL/FK
TMB05 Seepage MB east Dipped quarterly
Physical parameters then purge dry and assess inflows quarterly If inflow within 12 hours then physical parameters again, metals, nutrients, cations/anions
Physical inspection of surrounding area - monthly
ASW01 Avon River (upgradient)
Yes continuous
Salinity logger continuous, physical parameters quarterly Metals, nutrients, cations/anions quarterly Hydrocarbons annually.
Physical parameters, metals, nutrients, cations/anions Sample and test first overflow event. Assess for future events
TSW02 (new) Dog Trap Creek Yes continuous
Salinity logger continuous, physical parameters quarterly Metals, nutrients, cations/anions quarterly Hydrocarbons annually.
TSW01 Avon River (downgradient Tiedman boundary)
Yes continuous
Salinity logger continuous, physical parameters quarterly Metals, nutrients, cations/anions quarterly Hydrocarbons annually.
FSW01 (new) Avon River (downgradient on Farley property)
No Physical parameters, metals, nutrients, cations/anions Sample and test first overflow event only. Assess for future events
TMB01 Avon River Alluvium (downgradient site boundary)
Yes continuous dipped quarterly
Physical parameters quarterly Metals, cations/anions quarterly Hydrocarbons and nutrients, annually

AGL_WMP Tiedman Irrigation_V1-3_140512_Final.docx_14.05.2012 18
Sample ID Location Water Levels
Routine Water Quality and Sampling Frequency by PB
Event Sampling by AGL/FK
TMB02 Avon River/Dog Trap Creek Alluvium (mid site)
Yes continuous dipped quarterly
Physical parameters quarterly Metals, cations/anions quarterly Hydrocarbons and nutrients, annually
TMB03 Dog Trap Creek Alluvium (southern site)
Yes continuous dipped quarterly
Physical parameters quarterly Metals, cations/anions quarterly Hydrocarbons and nutrients, annually
S4MB01 Northern site boundary (rock aquifer)
Yes continuous dipped quarterly
Physical parameters quarterly Metals, cations/anions quarterly Hydrocarbons and nutrients annually
Four (paired) shallow piezometers ^ Plus one additional shallow piezometer on western boundary near Catch Dam west
Within and adjacent to the trial irrigation area
Manual each visit
(All sites) Physical parameters quarterly (each visit) Metals, cations/anions and nutrients (as required)
Monitor and assess WLs after each irrigation Sample and test if >30cm of infiltrated water. Purge after each inspection - ongoing monitoring during trial.
Notes: Physical parameters are salinity (EC), pH, redox (or Eh), dissolved oxygen (DO) and temperature
# - assumed to be the blend irrigation dam (ie river water plus CSG produced water in other dams)
^ -there would be a very shallow piezometer within the irrigation trial area to assess the irrigation application rates and the efficiency of the crops to transpire all the irrigation water (variable depths 0.3 to 1.2m deep depending on plot type) then another piezometer just outside the irrigation area to ensure that no perched water table was developing in the parent sub-soils (each to a depth of 1.5m).
4.2. Monitoring Frequency
Continuous water level dataloggers are present at seven sites, and EC loggers are present (or will be installed) at six sites. Monthly water quality sampling of the groundwater sites is not justified given that this is a deficit irrigation program and the irrigation area is located off the floodplain. There will be continuous salinity loggers and tracking of field parameters monthly at selected surface water sites. Quarterly water quality sampling is proposed for most sites plus event sampling at selected sites.

AGL_WMP Tiedman Irrigation_V1-3_140512_Final.docx_14.05.2012 19
4.2.1. Water Levels
Produced water – Dams
No water level monitoring in any of the dams is proposed although gauges in the dams allow the volume in storage to be estimated.
Surface water - Stream Gauges
The two stream gauges that are part of the larger GGP program are equipped with level dataloggers and salinity (EC) probes. A new gauge with a level and EC logger has been installed on Dog Trap Creek. These sites will continue indefinitely at the current data collection rate (one reading every 6 hours).
The GGP monitoring program commenced in March 2011 and currently there is 14 months of continuous data. Baseline hydrographs and salinity responses (from PB, 2012) are provided in Appendix A.
Groundwater - Monitoring Bores and Piezometers
The four dedicated monitoring bores are all equipped with dataloggers. These will continue indefinitely at the current data collection rate (one reading every 6 hours). The paired shallow piezometers constructed to maximum 1.5m depth will not have dataloggers installed but will be periodically inspected to take manual water levels. Manual water levels are proposed to be taken pre irrigation and then after each irrigation event.
The monitoring program for the dedicated monitoring bores commenced in January 2011 and currently there is 16 months of continuous data. Baseline hydrographs (from PB, 2012) are provided in Appendix B.
4.2.2. Water Quality
The proposed frequencies vary depending on whether the water sampling is baseline, during the irrigation program or event sampling, and depending on the monitoring location. Details are summarised below and in Table 4-1.
Produced water – Dams
• Four baseline events (April, October and December 2011, March 2012) then during the irrigation program
o Physical parameters monthly
o Metals, nutrients, cations/anions quarterly
o Hydrocarbons annually
• A salinity (EC) probe is also located in the main blended water dam (i.e. Tiedmans South - the dam from which irrigation water will be withdrawn). It was installed in October 2011. This logger will operate for the life of the trial at the current data collection rate (one reading every 6 hours).
Surface water - Stream Gauges and Dog Trap Creek location
• Four baseline events (April, October and December 2011, March 2012) at the two Avon River sites then during the irrigation program
o Physical parameters quarterly
o Metals, nutrients, cations/anions quarterly
o Hydrocarbons annually

AGL_WMP Tiedman Irrigation_V1-3_140512_Final.docx_14.05.2012 20
• Salinity (EC) probes are also located at the three stream gauge sites. These loggers will continue indefinitely at the current data collection rate (one reading every 6 hours). Salinity trends are shown in the graphs in Appendix A.
• For the Dog Trap Creek site, monitoring commenced in December 2011 – water quality parameters are as for Avon River sites.
Seepage water – Monitoring Bores
• One baseline event (April 2011) then during the irrigation program
o Physical parameters quarterly
o Metals, nutrients and cations/anions quarterly (if inflow after purging)
Groundwater - Monitoring Bores
• Four baseline events (April, October and December 2011, March 2012) then during the irrigation program
o Physical parameters quarterly
o Metals and cations/anions quarterly
o Hydrocarbons and nutrients annually
The event sampling locations and their sampling frequencies are:
Irrigation plot runoff
• Western catch dam (Stage 1A – overflow to Avon River)
o Salinity (EC) probe to be installed at data collection rate (one reading every 6 hours)
o Sample and test first overflow event for:
Physical parameters
Metals, cations/anions and nutrients
o Assess necessity for future events
• Eastern catch dam (Stage 1A – overflow to unnamed gully)
o Salinity (EC) probe to be installed at data collection rate (one reading every 6 hours)
o Sample only if necessary after reviewing western catch dam results
Surface water
• Stream location FSW01 on Avon River downstream of Tiedman Property (on the Farley property)
o Sample and test first overflow event for:
Physical parameters
Metals, cations/anions and nutrients
o Assess necessity for future events
Groundwater - Piezometers
• Four paired locations within Stage 1A irrigation trial area, plus an additional site adjacent to Catch Dam west
o Check, sample and test every irrigation for:

AGL_WMP Tiedman Irrigation_V1-3_140512_Final.docx_14.05.2012 21
Physical parameters, then select one site (if there is a water profile of more than 30cm) for:
• Metals, cations/anions and nutrients
4.3. Water Quality Analytes
The specific analytical suites that are recommended for each of the monitoring locations are as follows:
Produced water – Dams
Water samples (at the three Tiedman dam sites) will be analysed for:
• Physical parameters, EC pH, redox, DO, temperature
• Major cations and anions: sodium, potassium, calcium, magnesium, bicarbonate, chloride, sulphate, total alkalinity, ionic balance
• Heavy metals: Aluminium, arsenic, beryllium, barium, cadmium, cobalt, copper, lead, manganese, molybdenum, nickel, selenium, strontium, uranium, vanadium, zinc, boron, iron, bromine
• Hydrocarbon indicators: TPH, BTEX (only for the main baseline event (October 2011), and then annually in September 2012, 2013 etc)
• Nutrients: ammonia, nitrate, nitrite, NOx, total phosphorus, reactive phosphorus, total organic carbon.
SAR and TDS values will be calculated either by the laboratory or based on the results.
Seepage water – Monitoring Bores
Water samples (at the two seepage sites) will be analysed (provided there is recharge water after purging) for:
• Physical parameters, EC pH, redox, DO, temperature
• Major cations and anions: sodium, potassium, calcium, magnesium, bicarbonate, chloride, sulphate, total alkalinity, ionic balance
• Heavy metals: Aluminium, arsenic, beryllium, barium, cadmium, cobalt, copper, lead, manganese, molybdenum, nickel, selenium, strontium, uranium, vanadium, zinc, boron, iron, bromine
• Nutrients: ammonia, nitrate, nitrite, NOx, total phosphorus, reactive phosphorus, total organic carbon.
SAR and TDS values will be calculated either by the laboratory or based on the results.
Surface water - Stream Gauges
Water samples (both Avon River sites and the Dog Trap Creek site) will be analysed for:
• Physical parameters, EC pH, redox, DO, temperature
• Major cations and anions: sodium, potassium, calcium, magnesium, bicarbonate, chloride, sulphate, total alkalinity, ionic balance
• Heavy metals: Aluminium, arsenic, beryllium, barium, cadmium, cobalt, copper, lead, manganese, molybdenum, nickel, selenium, strontium, uranium, vanadium, zinc, boron, iron, bromine
AGL_WMP Tiedman Irrigation_V1-3_140512_Final.docx_14.05.2012 22
• Hydrocarbon indicators: TPH, BTEX (only for the main baseline event (October 2011), and then annually in September 2012, 2013 etc)
• Nutrients: ammonia, nitrate, nitrite, NOx, total phosphorus, reactive phosphorus, total organic carbon.
SAR and TDS values will be calculated either by the laboratory or based on the results.
Groundwater - Monitoring Bores and Piezometers
Water samples (at all four dedicated monitoring bore sites) will be analysed for:
• Physical parameters, EC pH, redox, DO, temperature
• Major cations and anions: sodium, potassium, calcium, magnesium, bicarbonate, chloride, sulphate, total alkalinity, ionic balance
• Heavy metals: Aluminium, arsenic, beryllium, barium, cadmium, cobalt, copper, lead, manganese, molybdenum, nickel, selenium, strontium, uranium, vanadium, zinc, boron, iron, bromine
• Hydrocarbon indicators: TPH, BTEX (only for the main baseline event (October 2011), and then annually in September 2012, 2013 etc)
• Nutrients: ammonia, nitrate, nitrite, NOx, total phosphorus, reactive phosphorus, total organic carbon.
For the shallow (paired) piezometer sites, if there is more than 30cm of water present in any of the sites upon checking after each irrigation, then water samples will be analysed for:
• Physical parameters, EC pH, redox, DO, temperature (all sites)
• And then for one representative site (if sufficient water is present after purging):
o Major cations and anions: sodium, potassium, calcium, magnesium, bicarbonate, chloride, sulphate, total alkalinity, ionic balance
o Heavy metals: Aluminium, arsenic, beryllium, barium, cadmium, cobalt, copper, lead, manganese, molybdenum, nickel, selenium, strontium, uranium, vanadium, zinc, boron, iron, bromine
o Nutrients: ammonia, nitrate, nitrite, NOx, total phosphorus, reactive phosphorus, total organic carbon.
Each shallow piezometer is to be purged dry after each inspection, irrespective of the volume of water present.
SAR and TDS values will be calculated either by the laboratory or based on the results.
4.4. Water Volumes
Water volumes irrigated across the trial irrigation area in the Stage 1A area will be measured via an in-line meter located on the cart of the linear move irrigator. Meter readings will be taken at commencement and on completion of each irrigation.
In addition, water use will be estimated based on the known application rates through the overhead sprays and the hours of operation.
Estimated water application will be cross-checked with actual rainfall data on site and a network of physical rain gauges within the trial area to verify the performance of the irrigation system.

AGL_WMP Tiedman Irrigation_V1-3_140512_Final.docx_14.05.2012 23
Monitoring of volumes irrigated in the Stage 1B area will be estimated based on pump rates and hours of operation.
4.5. Possible Risks and Mitigation Measures
Irrigation is carried out across the Avon River catchment and other sub-catchments of the Manning River Catchment as part of the area’s typical agricultural development. Most local irrigation is for improved pasture for dairying and beef cattle. The only difference with this scheme proposed by AGL for the reuse of produced water is that:
• The water quality is brackish but suitable for salt tolerant cropping on the improved soils of the sideslope areas adjacent to the Avon River
• The irrigation is intensive as the plan is to maximise the application rate within the overall strategy of deficit irrigation
• The parent soils will be substantially improved to be able to accept intensive levels of irrigation
The assessed (water related) risks to the environment are:
• Leakage from the produced water storage dams (forming either a perched water table or infiltration to the shallow rock aquifer)
• High infiltration rates of irrigated water that migrates below the root zone and are unable to be transpired (forming either a perched water table or infiltration to the shallow rock aquifer)
• High rainfall events which cause runoff and overflow the catch dams to the Avon River
There are no (water related) risks identified to nearby water users as:
• AGL owns the (eastern) upstream and downstream properties either side of Tiedmans and there are no water supply withdrawals from the Avon River on these properties (all water comes from farm dams)
• There are no groundwater users in the immediate area (there are no works tapping the shallow alluvial or rock aquifer groundwater systems on adjacent properties)
There are no risks to surface water users further downstream as the volumes proposed to be irrigated (maximum 70 ML of produced water and 220 ML in total over 3 years) are negligible compared to the Avon River stream flow volumes (as shown by the Waukivory gauging station on the Avon River - #208028) and subsequent tributary flow increases downstream.
The extensive monitoring network is designed to identify:
• The formation of a perched water table below the root zone within and adjacent to the irrigation area
• Whether there are any seepage losses from the produced water storage dams
• Any accessions to the water table in the underlying rock aquifer
• The water quality of upstream creek and river water sources entering the site
• Any impact (outside of the normal range of responses) to the adjoining Avon River and Dog Trap Creek
The proposed mitigation measures (apart from the extensive monitoring program) are:

AGL_WMP Tiedman Irrigation_V1-3_140512_Final.docx_14.05.2012 24
• Repair immediately any leaks (HDPE liner and/or dam walls) identified from either inspection of the holding dams or monitoring of shallow water levels and water quality
• Reduce irrigation application rates if a perched water table develops adjacent to the irrigation trial area
• Reduce irrigation application rates if increases in the shallow water table occur in either the shallow rock area or the nearby alluvium
• Enlarge or install extra catch dams to collect run-off from the trial area
All of the design elements described in Section 1.1 plus all of the above measures will be considered with the aim of minimising risks of impacts to the Avon River at all times. If there are identifiable impacts to the Avon River at the FSW01 (downstream) monitoring location immediately after a major rainfall event, AGL will further revise and/or improve the above measures.
4.6. Contingency Plan
Water levels in the alluvial aquifers are relatively shallow at 2.5 to 5.5 metres bgl. In the shallow rock, water levels are deeper and generally range between 5.5 and 17 metres bgl. Rising groundwater levels outside of the natural range would warrant action. For this trial, AGL recommends that an appropriate threshold (or action trigger) be a water level rise that is more than 0.5m per annum beyond the normal range (Note that based on the baseline data, 0.1m increases could not be separated from natural trends).
For the river and alluvial water quality, there is a large variation in natural salinity and other chemical analytes. It is proposed to use the background levels from the baseline sampling event and the river salinity trends over the last 12 months as the thresholds for action. Regular sampling of the dam water intended for irrigation, will ensure that it is suitable for irrigation and is consistent with the ANZECC (2000) water quality criteria for irrigation purposes.
Table 4-2 details the actions and responses to be implemented should any threshold be triggered during the intensive irrigation program on the Stage 1A trial area.
The contingency plan for the Stage 1B irrigation area is to immediately cease irrigation (and change to a new area) if there is visible overland flow or breakout areas.
Table 4-2 Contingency Plan
Indicator Action Response
Irrigation water EC (at Tiedman south dam) exceeds 2000 S/cm for the trial area
Stop irrigating Investigate
Blend with additional fresh water to dilute Monitor EC levels in produced water and restart irrigation when EC falls below 2000 S/cm If none of these options are available, store water until production phase of project for future water treatment by Reverse Osmosis or other appropriate technologies.
Visible overland flow or breakout areas while irrigating
Stop irrigating Investigate
Reduce irrigation application rate
Seepage water around the produced water dams that indicates dam leakage
Inspect dam to identify leak
Reduce dam levels to repair liner/banks as necessary

AGL_WMP Tiedman Irrigation_V1-3_140512_Final.docx_14.05.2012 25
Indicator Action Response
Development of perched water table in natural soils adjacent to the irrigation trial area
Stop irrigating Investigate
Reduce irrigation application rate Determine need for additional sites
Rising shallow (regional) groundwater level trend outside of natural range and more than 0.5m per annum (at S4MB01 site)
Stop irrigating Investigate
Reduce irrigation application rate Stop altogether if levels reach 5 metres bgl in the bedrock aquifers (currently ~ 5.5-17 metres bgl) Check deep monitoring bores at S4MB site and more remote locations on Tiedmans for similar trends and the (unlikely) possibility of very deep drainage Store produced water pending outcome of investigations
Surface water salinity to exceed by 20% the baseline levels at downstream Avon River site (FSW01)
Stop irrigating Investigate
Reduce irrigation application rate Store produced water Blend with additional fresh water to dilute If none of these options are available, store water until production phase of project for future water treatment by Reverse Osmosis or other appropriate technologies.
4.7. Reporting
All data from the baseline investigation and the irrigation program will be collated and analysed and the results assessed and written up into several detailed technical reports:
• For the water monitoring program it is proposed to produce:
o Brief baseline data report (February 2012)
o Monitoring reports at the conclusion of each water year (first report by September 2012, then September 2013 etc)

AGL_WMP Tiedman Irrigation_V1-3_140512_Final.docx_14.05.2012 26
5. References DWE, 2009, Report Card for Avon River source. Dated August 2009
Parsons Brinckerhoff, 2011, Irrigation Proposal, Review of Environmental Factors – Gloucester Gas Project. Report PR_5506 Rev B dated June 2011
Parsons Brinckerhoff, 2012, Phase 2 Groundwater Investigations – Stage 1 Gas Field Development Area Gloucester Gas Project. Report PR_5630 dated January 2012
SRK Consulting, 2010, Gloucester Basin Stage 1 Gas Field Development Project: Preliminary Groundwater Assessment and Initial Conceptual Hydrogeological Model, Report No. AGL002_Gloucester Basin Hydrogeology Study_Rev2.

AGL_WMP Tiedman Irrigation_V1-3_140512_Final.docx_14.05.2012 27
Figures Figure 1: Tiedman Property and Existing Development
Figure 2 (Tiedmans) Gloucester Irrigation Project
Figure 3 (Tiedmans) Water Monitoring Network

\\APS
YDFIL
01\pr
oj\A\
AGL_
Energ
y\216
2156
A_AG
L_GL
OUCE
STER
_IRRI
GATIO
N_AP
P\10_
GIS\P
rojec
ts\ES
RI\20
00a_
2162
156A
_Figu
re_01
.mxd
Avon River
Dog Trap Creek
Stratford 3
TiedemanSouth Dam
Stratford 1
TiedemanNorth DamRough
Pdk NthRough
Pdk SthDairyPdk
WENHAM COX ROAD
WHEA
TLEY
S ROA
D
0 1Kilometres
Gloucester Irrigation Location Map Figure 1
RoadsTracks
Atkins PropertyTeideman Property
Existing irrigation areaDams
WYONG
TAREE
GOSFORD
FORSTER
TAMWORTH
MAITLANDCESSNOCK
SINGLETON
NEWCASTLE
NELSON BAY
PORT MACQUARIE

\\APS
YDFIL
01\pr
oj\A\A
GL_E
nergy
\2162
156A
_AGL
_GLO
UCES
TER_
IRRI
GATIO
N_AP
P\10
_GIS
\Proj
ects\
ESRI
\Irriga
tion_
REFF
igures
\3004
_216
2156
A_Pr
ojectO
vervi
ewSt
age2
_Fig3
_3.m
xd
// vb -
15.05
.2011
TiedemanNorth Dam
TiedemanSouth Dam
Stratford 1
Stratford 3
PROPOSEDDAM
ALT DAMLOCATION
STAGE 1A
STAGE 1B
River pumpsite
Avon
River
Dog T
rap C
reek
WHEATLEYS ROAD
0 500
Metres
Gloucester Irrigation Project
RoadsTracks
Atkins PropertyTeideman Property
Existing irrigation areaExisting dam
Proposed damAlternate dam location
Stage 1- Proposed irrigation areaStage 2 - Proposed irrigation area*
*Note: Unlikely to proceed as part of the 'preproject' irrigation scheme
Figure 2

!!
!!!
!
!
!!!!
!
!!
!
!!
!
!
!
!
!
!
!!
! !
!
!
!
!
TTPB01
Dog Trap Creek gauge
TTPB
TMB05
TMB04
TMB03
TMB02
TMB01
TCMB04TCMB03
TCMB01
TPMB02 TPMB01
S5MB03
S5MB02
S5MB01
S4MB03S4MB02
S4MB01
Piezo 4Piezo 3Piezo 2Piezo 1Catch Dam West
Tiedmans South
Tiedmans North
Avon Stream gauge ASW01
Avon Stream gauge TSW01
TCMB02
Catch Dam East
Farley Site
±1:10,000Scale
0 500250MetresFigure 3
Geocentric Datum of Australia 1994
AGL Energy Limited, MapData Sciences, SKMSources:
Disclaimer: While AGL has taken great care and attention to ensure the accuracy of the data represented on this map, no liability shall be accepted for any errors or omissions.No part of this map may be reproduced without prior permission of AGL.
Author:Upstream Gas
Date: 18/01/2012
Ref: 2879R2
!!!!
!
!
!
!
TMB05
TMB04
TCMB04TCMB03
TCMB02TCMB01
Tiedmans SouthTiedmans North
!!
!
!
!
!
!!
!!
S4MB03
S4MB02
S4MB01
Piezo 4Piezo 3Piezo 2Piezo 1
Catch Dam East
Catch Dam West
Legend
RiverCadastreTiedemans Property
Tiedman Water Monitoring Network! Abandoned! Primary – Alluvial! Primary – Perched
! Primary – River! Primary – Seepage! Primary – Shallow Rock
! Primary – catch dam! Primary – holding dam! Secondary
Irrigation Trial Area

AGL_WMP Tiedman Irrigation_V1-3_140512_Final.docx_14.05.2012 28
Appendices Appendix A Surface Water Hydrographs and Salinity Profiles
Appendix B Groundwater Hydrographs

Figure XX Stream levels and rainfall at TSW01
Figure XX EC levels and rainfall at TSW01
Client: AGL Energy LtdProject: Gloucester groundwater investigation and monitoringLocation: Gloucester, NSW
0
20
40
60
80
100
101.0
101.5
102.0
102.5
103.0
103.5
104.0
104.5
105.0
105.5
106.0
106.5
107.0
Rainfall (m
m)
Stream
level (m AHD)
Rainfall Manual readings TSW01
0
20
40
60
80
100
0
100
200
300
400
500
600
700
800
900
1000
Rainfall (m
m)
EC (m
icroS/cm
)
Rainfall TSW01 Manual readings

Figure XX Stream levels and rainfall at ASW01
Figure XX EC levels and rainfall at ASW01
Client: AGL Energy LtdProject: Gloucester groundwater investigation and monitoringLocation: Gloucester, NSW
0
20
40
60
80
100
102.0
102.5
103.0
103.5
104.0
104.5
105.0
105.5
106.0
106.5
107.0
107.5
108.0
Rainfall (m
m)
Stream
level (m AHD)
Rainfall Manual readings ASW01
0
20
40
60
80
100
0
100
200
300
400
500
600
700
800
900
1000
Rainfall (m
m)
EC (m
icroS/cm
)
Rainfall Manual readings ASW01

Figure Stream levels and rainfall at TSW01, ASW01, ASW02
Figure XX EC levels and rainfall at TSW01, ASW01, ASW02
Client: AGL Energy LtdProject: Gloucester groundwater investigation and monitoringLocation: Gloucester, NSW
0
20
40
60
80
100
101.0
102.0
103.0
104.0
105.0
106.0
107.0
108.0
109.0
110.0
111.0
112.0
Rainfall (m
m)
Stream
level (m AHD)
Rainfall ASW01 ASW02 TSW01
0
20
40
60
80
100
0
100
200
300
400
500
600
700
800
900
1000
Rainfall (m
m)
EC (m
icroS/cm
)
Rainfall ASW02 ASW01 TSW01

Figure A-1 Groundwater levels and rainfall TMB01
Figure A-2 Groundwater levels and rainfall at TMB02
Client: AGL Energy LtdProject: Gloucester groundwater investigation and monitoringLocation: Gloucester, NSW
0
20
40
60
80
100
101101.5
102102.5
103103.5
104104.5
105105.5
106R
ain
fall (
mm
)
Gro
un
dw
ate
r le
vel (m
AH
D)
TMB02 RainfallTMB02Manual Dips
0
20
40
60
80
100
101101.5
102102.5
103103.5
104104.5
105105.5
106
Rain
fall (
mm
)
Gro
un
dw
ate
r le
vel (m
AH
D)
TMB01 RainfallTMB01Manual Dips

Figure A-3 Groundwater levels and rainfall at TMB03
Figure A-4 Groundwater levels and rainfall at AMB01
Client: AGL Energy LtdProject: Gloucester groundwater investigation and monitoringLocation: Gloucester, NSW
0
20
40
60
80
100
101101.5
102102.5
103103.5
104104.5
105105.5
106
Rain
fall (
mm
)
Gro
un
dw
ate
r le
vel (m
AH
D)
TMB03 RainfallTMB03Manual Dips
0
20
40
60
80
100
101101.5
102102.5
103103.5
104104.5
105105.5
106R
ain
fall (
mm
)
Gro
un
dw
ate
r le
vel (m
AH
D)
AMB01 RainfallAMB01Manual Dips

Figure A-5 Groundwater levels and rainfall at AMB02
Figure A-6 Groundwater levels and rainfall at S4MB01
Client: AGL Energy LtdProject: Gloucester groundwater investigation and monitoringLocation: Gloucester, NSW
0
20
40
60
80
100
103103.5
104104.5
105105.5
106106.5
107107.5
108
Rain
fall (
mm
)
Gro
un
dw
ate
r le
vel (m
AH
D)
AMB02 RainfallAMB02Manual Dips
0
20
40
60
80
100
106107108109110111112113114115116
Rain
fall (
mm
)
Gro
un
dw
ate
r le
vel (m
AH
D)
S4MB01 RainfallS4MB01Manual Dips
samplingdrilling recovery

Figure A-7 Groundwater levels and rainfall at S4MB02
Figure A-8 Groundwater levels and rainfall at S4MB03
Client: AGL Energy LtdProject: Gloucester groundwater investigation and monitoringLocation: Gloucester, NSW
0
20
40
60
80
100
111111.5
112112.5
113113.5
114114.5
115115.5
116
Rain
fall (
mm
)
Gro
un
dw
ate
r le
vel (m
AH
D)
S4MB02 RainfallS4MB02Manual Dips
0
20
40
60
80
100
111111.5
112112.5
113113.5
114114.5
115115.5
116R
ain
fall (
mm
)
Gro
un
dw
ate
r le
vel (m
AH
D)
S4MB03 RainfallS4MB03Manual Dips
slug test sampling

Figure A-9 Groundwater levels and rainfall at S5MB01
Figure A-10 Groundwater levels and rainfall at S5MB02
Client: AGL Energy LtdProject: Gloucester groundwater investigation and monitoringLocation: Gloucester, NSW
0
20
40
60
80
100
60
70
80
90
100
110
120
Rain
fall (
mm
)
Gro
un
dw
ate
r le
vel (m
AH
D)
S5MB01 RainfallS5MB01Manual Dips
sampling
0
20
40
60
80
100
109109.5
110110.5
111111.5
112112.5
113113.5
114R
ain
fall (
mm
)
Gro
un
dw
ate
r le
vel (m
AH
D)
S5MB02 RainfallS5MB02Manual Dips

Figure A-11 Groundwater levels and rainfall at S5MB03
Figure A-12 Groundwater levels and rainfall at WMB01
Client: AGL Energy LtdProject: Gloucester groundwater investigation and monitoringLocation: Gloucester, NSW
0
20
40
60
80
100
109109.5
110110.5
111111.5
112112.5
113113.5
114
Rain
fall (
mm
)
Gro
un
dw
ate
r le
vel (m
AH
D)
S5MB03 RainfallS5MB03Manual Dips
0
20
40
60
80
100
105105.5
106106.5
107107.5
108108.5
109109.5
110R
ain
fall (
mm
)
Gro
un
dw
ate
r le
vel (m
AH
D)
WMB01 RainfallWMB01Manual Dips

Figure A-19 Groundwater levels and rainfall at BMB02
Figure A-20 Groundwater levels and rainfall at TCMB01
Client: AGL Energy LtdProject: Gloucester groundwater investigation and monitoringLocation: Gloucester, NSW
0
20
40
60
80
100
100100.5
101101.5
102102.5
103103.5
104104.5
105
Rain
fall (
mm
)
Gro
un
dw
ate
r le
vel (m
AH
D)
BMB02 RainfallBMB02Manual Dips
slug testing sampling
0
20
40
60
80
100
110110.5
111111.5
112112.5
113113.5
114114.5
115R
ain
fall (
mm
)
Gro
un
dw
ate
r le
vel (m
AH
D)
TCMB01RainfallTCMB01Manual Dips

Figure A-21 Groundwater levels and rainfall at TCMB02
Figure A-22 Groundwater levels and rainfall at TCMB03
Client: AGL Energy LtdProject: Gloucester groundwater investigation and monitoringLocation: Gloucester, NSW
0
20
40
60
80
100
110110.5
111111.5
112112.5
113113.5
114114.5
115
Rain
fall (
mm
)
Gro
un
dw
ate
r le
vel (m
AH
D)
TCMB02RainfallTCMB02Manual Dips
slug testing
sampling
0
20
40
60
80
100
110110.5
111111.5
112112.5
113113.5
114114.5
115R
ain
fall (
mm
)
Gro
un
dw
ate
r le
vel (m
AH
D)
TCMB03RainfallTCMB03Manual Dips
sampling purging

Figure A-23 Groundwater levels and rainfall at TCMB04
Client: AGL Energy LtdProject: Gloucester groundwater investigation and monitoringLocation: Gloucester, NSW
0
20
40
60
80
100
110110.5
111111.5
112112.5
113113.5
114114.5
115
Rain
fall (
mm
)
Gro
un
dw
ate
r le
vel (m
AH
D)
TCMB04 RainfallTCMB04Manual Dips
samplingpurging

Figure XX Groundwater levels and rainfall at the Tiedeman/Atkins alluvial bores
Figure XX Groundwater levels and rainfall at Stratford 4 nested sites
Client: AGL Energy LtdProject: Gloucester groundwater investigation and monitoringLocation: Gloucester, NSW
0
20
40
60
80
100
102102.5
103103.5
104104.5
105105.5
106106.5
107107.5
Rain
fall (
mm
)
Gro
un
dw
ate
r le
vel (m
AH
D)
Rainfall TMB01 TMB02 TMB03 AMB01 AMB02
0
20
40
60
80
100
100
102
104
106
108
110
112
114
116
118
120
Rain
fall
(mm
)
Gro
un
dw
ate
r le
vel (m
AH
D)
Rainfall S4MB01 S4MB02 S4MB03
ground level

Figure XX Groundwater levels and rainfall at S5MB nested sites
Figure XX Groundwater levels and rainfall at WMB nested sites
Client: AGL Energy LtdProject: Gloucester groundwater investigation and monitoringLocation: Gloucester, NSW
0
20
40
60
80
100
70
80
90
100
110
120
130
Rain
fall (
mm
)
Gro
un
dw
ate
r le
vel (m
AH
D)
Rainfall S5MB01 S5MB02 S5MB03
ground level
0
20
40
60
80
100
100101102103104105106107108109110111112
Rain
fall (
mm
)
Gro
un
dw
ate
r le
vel (m
AH
D)
Rainfall WMB01 WMB02 WMB03 WMB04
ground level

Figure XX Groundwater levels and rainfall at TCMB nested sites
Client: AGL Energy LtdProject: Gloucester groundwater investigation and monitoringLocation: Gloucester, NSW
0
20
40
60
80
100
110
112
114
116
118
120
122
124
Rain
fall (
mm
)
Gro
un
dw
ate
r le
vel (m
AH
D)
Rainfall TCMB01 TCMB02 TCMB03 TCMB04
ground level

AGL_PEL285_PWMP_V1-4_141014_Final.docx_14.10.2014 49
Appendix 2: Surface water and Groundwater approvals
All groundwater used for beneficial purposes is located within two groundwater systems – the alluvial sediments associated with the unregulated streams, and the sedimentary/fractured bedrock aquifers. The alluvial sediments are managed under the Lower North Coast Unregulated and Alluvial Water Sources Water Sharing Plan (WSP) and
the Water Management Act (WMAct), while the deeper sedimentary/fractured rock groundwater systems are currently managed under the Water Act (WAct).
Legislation
Water Act (1912)
The WAct has been in place since 1912. Since 2003 the WAct has been progressively phased out (repealed) and replaced by the WMAct across NSW as new Water Sharing Plans are gazetted.
AGL’s bore licences for the GGP have been issued under the WAct as this is the appropriate water regulation for CSG exploration activity at this time for this water source. AGL currently holds 15 production bore licences for exploration (pilot testing) activities
across the PEL as at 1 September 2014. Details are provided in Table A1.1.
Water Management Act (2000)
AGL holds two Water Access Licences (WALs) for surface water abstractions from the Avon River water source under the current surface water and alluvial Water Sharing Plan (WSP).
There is no WSP for the sedimentary (porous) rocks of the Gloucester Basin at this time
and therefore the WMAct currently does not apply to this groundwater source.
Licences
AGL bore licences are for the commercial/industrial/irrigation reuse of groundwater pumped during pilot testing programs across the PEL. Two licences have recently been surrendered with the plug and abandonment of two gas wells. The bore licences are linked
into a combined allocation of 20 ML per year (two licenses), 15 ML per year (five licences) together with another six licences with individual allocations of 5 ML per year.
The most recent Waukivory Pilot production bore licences have conditions relating to dewatering volumes (Condition 7); water quality testing (Condition 8); blended water irrigation (Condition 9); use (Conditions 4, 10, and 11); abandonment (Condition 12, 13 and 14); and water injection volumes (Condition 15).
The five Stratford Pilot bore licences have conditions relating to dewatering volumes and
irrigation areas (Condition 9); impact assessment prior to taking water (Condition 10); and prepare, implement and report on the findings of a groundwater management plan (Condition 11).
Other individual bore licences have similar conditions.
Produced water from these pilot testing programs is currently stored in the three storage dams on the Tiedman property. The Tiedman South Dam (TSD) is predominantly used for
blended water, the Tiedman North Dam (TND) is predominantly used for historical produced water from the Stratford wells and more recently water from the Craven06 and

AGL_PEL285_PWMP_V1-4_141014_Final.docx_14.10.2014 50
Waukivory03 testing programs, while the Tiedman East Dam (TED) is for storing the produced water from the Waukivory Pilot and any future pilot projects that are approved.
If new pilots are approved and commissioned then additional industrial/irrigation bore licences will be obtained for these gas wells. Details of the current bore licences are
provided in Table A1-1.
Table A1-1 Production Bore Licences held for Industrial/Irrigation Purposes
Lot/DP Licence No.
Issue Date
Period Purpose Allocation (ML/y)
Local Bore Names
1/718347 20BL168850 16-Oct-13 5 years Commercial 20* Stratford 1
80/979859 20BL168851 16-Oct-13 5 years Commercial 20* Stratford 3
85/979859 20BL172557 8-Oct-10 5 years Industrial /
Irrigation
15^ Stratford 4
85/979859 20BL172558 8-Oct-10 5 years Industrial /
Irrigation
15^ Stratford 5
85/979859 20BL172559 8-Oct-10 5 years Industrial /
Irrigation
15^ Stratford 6
83/979859 20BL172560 8-Oct-10 5 years Industrial /
Irrigation
15^ Stratford 8
85/979859 20BL172561 8-Oct-10 5 years Industrial /
Irrigation
15^ Stratford 9
20/1164626 20BL173465 10-May-13 5 years Industrial /
Irrigation
5 Craven 06
31/571522 20BL173466 10-May-13 5 years Industrial /
Irrigation
5 Waukivory
03 #
1/877783 20BL173468 10-May-13 5 years Industrial /
Irrigation
5 Faulklands
03 #
9/804536 20BL173467 10-May-13 5 years Industrial /
Irrigation
5 Weismantels
03
11/841445 20BL173595 22-Aug-14 1 year Industrial /
Irrigation
5 Waukivory
11
251/785579 20BL173599 22-Aug-14 1 year Industrial /
Irrigation
5 Waukivory
12
11/841445 20BL173600 22-Aug-14 1 year Industrial /
Irrigation
5 Waukivory
13
251/785579 20BL173601 22-Aug-14 1 year Industrial /
Irrigation
5 Waukivory
14
Key - * joint allocation between these two licences; ^ - joint allocation between these five licences; # - gas well recently P&A’d
AGL also holds two surface water access licences (WAL) and works and use approvals for
slightly different purposes:

AGL_PEL285_PWMP_V1-4_141014_Final.docx_14.10.2014 51
WAL 19521 and works approval (20CA204347) to extract 32 ML/y from the Avon River for irrigation purposes.
WAL 36616 and works approval (20CA212873) to extract 20 ML/y from a large off river storage dam for irrigation, industrial and stock purposes.
This fresher surface water can be irrigated direct to established irrigation areas or blended with the stored produced water for irrigation of salt tolerant crops across the approved Tiedman irrigation area (Stage 1A and Stage 1B areas). WAL 19521 has been used to obtain freshwater for the TIP during 2012/13 and 2013/14, however WAL 36616 has not been used for irrigation purposes at this time.
The access to and use of this surface water is governed by the current WSP. The key
features of water availability and use are sourced from the report card for the Avon River
water source (DWE, 2009) as outlined below:
43 surface water licences
1,997 ML allowed to be extracted annually
Water cannot be traded into the Avon from downstream connected rivers (Lower Manning, Lower Barrington and Gloucester)
Under the WSP, permanent and temporary trading of water licences is allowed but can only be sourced from within the licences allocated for the Avon River source. AGL sourced
a small amount of water in the 2013/14 water year for irrigation purposes from a local landholder, however further water transfers are unlikely at this time.
The turkey nest dams do not require licensing as they are holding dams only, they have no catchment, and the water sources feeding them are licensed.
Aquifer Interference Approvals
The AI Policy (NOW, 2012) defines exemptions based on the level of risk. The exempt activities are those considered to pose a minimal risk to water sources, their dependent ecosystems and other water users.
The policy also requires those new CSG exploration activities where groundwater is taken (irrespective of volume) to have a water access licence or a volumetric bore licence
approval. Details regarding these activities are described in the Surface Water and Groundwater Management Plan (AGL, 2014b). The AI policy also applies to the reuse/disposal of produced water.
The pilot testing proposed at Waukivory (and any future pilots) involves dewatering, and therefore under the policy, new production bore licences are required for this pilot testing program. NOW has issued AGL with a licence for industrial and irrigation purposes for each
of the four pilot wells (and each for an annual allocation of 5 ML per annum commencing 1 July). The four bore licences are valid to the 21 August 2015.
The amount of 5 ML for each pilot well is based on the maximum likely extraction from each well during an extended pilot testing program, and includes approximately 1 ML of flowback water recovered immediately after the fracture stimulation program.
Volumes recovered during the pilot testing program may be less than this total volume of 20 ML/y, but based on the early pilot testing programs at Stratford, these volumes are
considered to be reasonable upper limits. It is not possible to provide a firmer estimate of the water production profiles at this time without completing the Waukivory pilot testing program.

AGL_PEL285_PWMP_V1-4_141014_Final.docx_14.10.2014 52
The flowback water is to be pumped to a large holding tank and disposed offsite at a licensed water recycling facility. The produced water is to be pumped to the Tiedman East Dam (TED) and either stored or blended and reused for irrigation purposes.
Characterisation of the local groundwater systems
‘Highly productive groundwater sources’ are defined in the AI Policy (NOW, 2012) as having the following properties:
Total dissolved solids of less than 1,500 mg/L, and
Water supply works that can yield water at a rate greater than 5 litres per second (L/s).
Table A1.2 provides information on the groundwater productivity of aquifers based on
water bore and monitoring bore data in the vicinity of the Waukivory site.
Table A1.2: Local characteristics for the Waukivory Pilot Testing Program
Aquifer Yield (L/s) Electrical Conductivity (EC) (µS/cm)
(approx) Total Dissolved Solids (mg/L)
Alluvium <2 2,000 – 7,500 (1) 1,500 – 6,000
Fractured rock <0.5 3,500 – 5,000 (1) 3,000 – 4,250
Note (1) values based on nearby monitoring bore data
Both the yields from the alluvial aquifer and the fractured rock aquifer are too low, and the total dissolved solids (TDS) of the groundwater are too high to classify local groundwater systems as a highly productive groundwater source. Therefore, aquifer systems at Stratford and Waukivory are classified as ‘less productive groundwater sources’, as defined
by the AI Policy (NOW, 2012).

AGL_PEL285_PWMP_V1-5_221014_Final.docx_22.10.2014 53
Appendix 3: MDR Report Section 1.3 Leak Detector

Manufacturers
Data Report
AGL
Gloucester Storage Dam
2012/2013

DESIGN
1.3 Leak Detector


Horizontal pipe compaction done with a hand operated whacker packer until heavy
compaction equipment could be used.
Leak detector installation using 5mm minus crusher dust with a 2% cement incorporation.

A 1 metre concrete apron surrounds the pipe inlet.
Pumping from the leak detector prior to the primary liner installation

Position of leak detector to the dam wall and perimeter fence