production activity control
DESCRIPTION
Production Activity ControlTRANSCRIPT
9/1/2015 Production Activity Control
http://www.mdcegypt.com/Pages/Purchasing/Material%20Management/Production%20Activity%20Control.asp 1/19
Management & Development Center About Us | Our Services | Training | Consulting |
M&DC Purchasing & Supply Chain: Material Management
Production Activity Control
Contents
1. Introduction
2. Data Requirements
3. Order Preparation
4. Scheduling
5. Load Leveling
6. Scheduling Bottlenecks
7. Theory Of Constraints And DrumBufferRope
8. Implementation
9. Control
1. Introduction
The time comes when plans must be put into action. Production activity control (PAC) is responsiblefor executing the master production schedule and the material requirements plan. At the same time, itmust make good use of labor and machines, minimize workinprocess inventory, and maintaincustomer service.
The material requirements plan authorizes PAC:
To release work orders to the shop for manufacturing.
To take control of work orders and make sure they are completed on time.
To be responsible for the immediate detailed planning of the flow of orders throughmanufacturing, carrying out the plan, and controlling the work as it progresses to completion.
To manage daytoday activity and provide the necessary support.
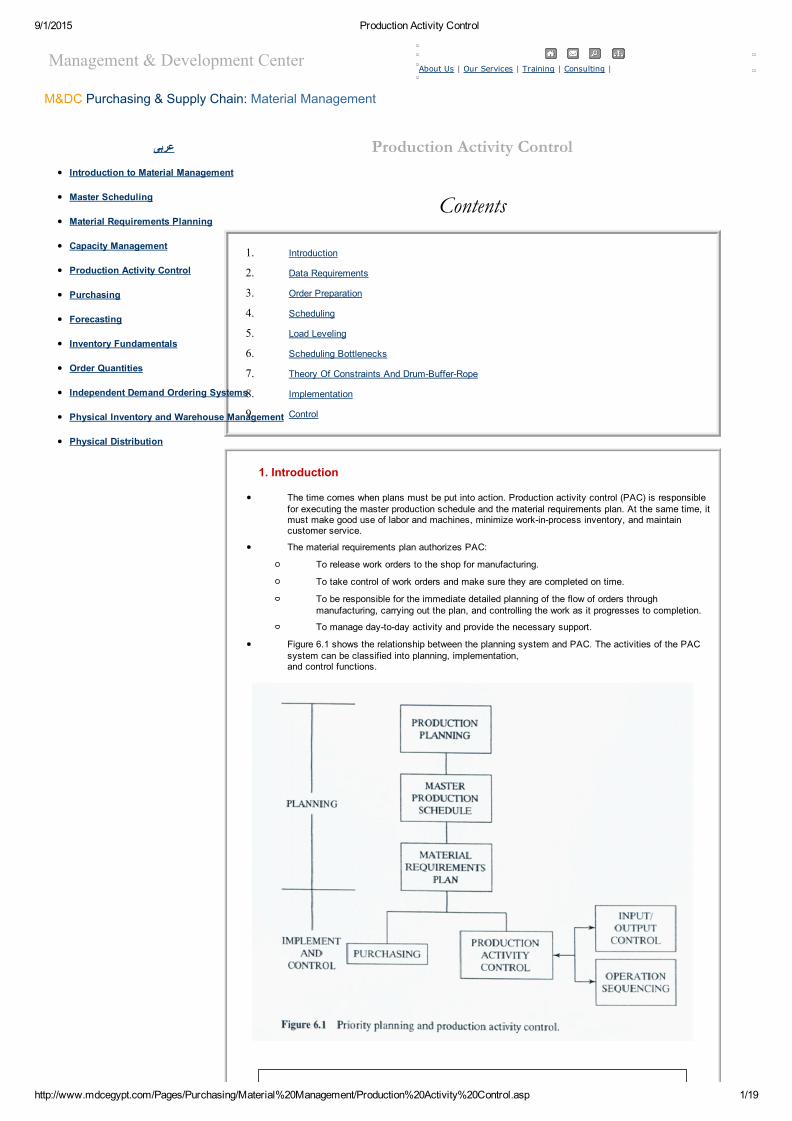
Figure 6.1 shows the relationship between the planning system and PAC. The activities of the PACsystem can be classified into planning, implementation,and control functions.
عربى
Introduction to Material Management
Master Scheduling
Material Requirements Planning
Capacity Management
Production Activity Control
Purchasing
Forecasting
Inventory Fundamentals
Order Quantities
Independent Demand Ordering Systems
Physical Inventory and Warehouse Management
Physical Distribution
9/1/2015 Production Activity Control
http://www.mdcegypt.com/Pages/Purchasing/Material%20Management/Production%20Activity%20Control.asp 2/19
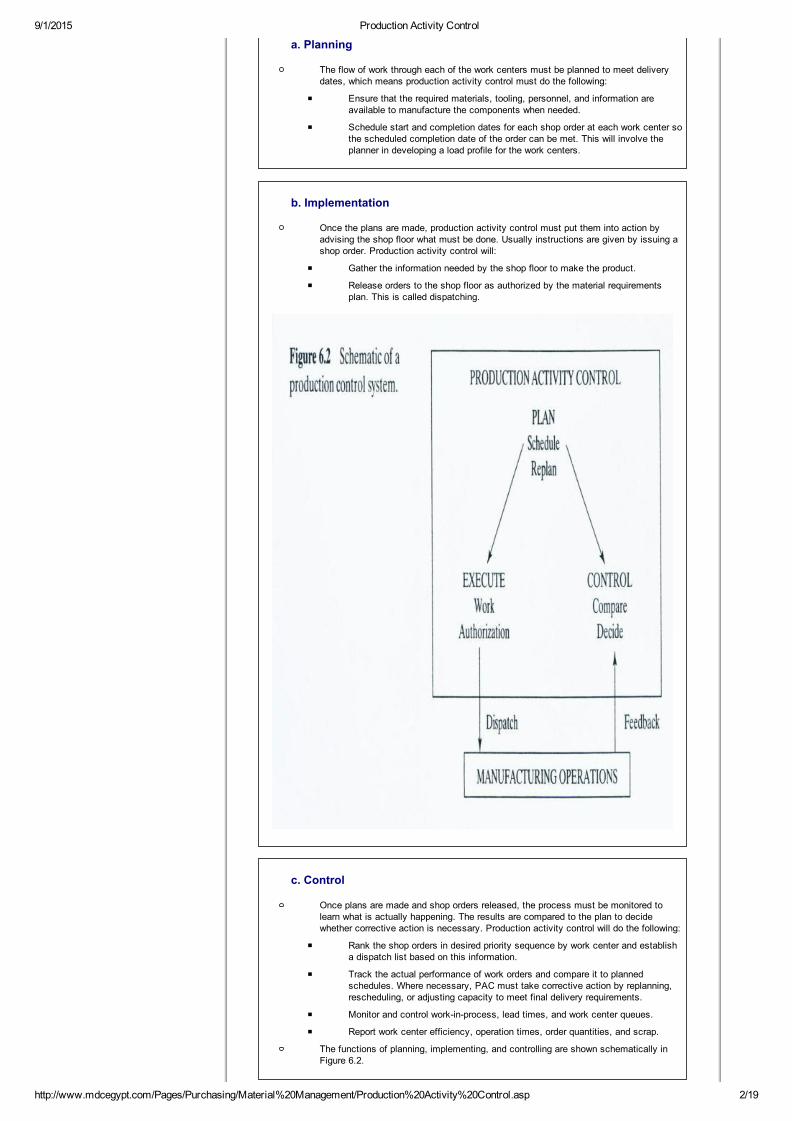
a. Planning
The flow of work through each of the work centers must be planned to meet deliverydates, which means production activity control must do the following:
Ensure that the required materials, tooling, personnel, and information areavailable to manufacture the components when needed.
Schedule start and completion dates for each shop order at each work center sothe scheduled completion date of the order can be met. This will involve theplanner in developing a load profile for the work centers.
b. Implementation
Once the plans are made, production activity control must put them into action byadvising the shop floor what must be done. Usually instructions are given by issuing ashop order. Production activity control will:
Gather the information needed by the shop floor to make the product.
Release orders to the shop floor as authorized by the material requirementsplan. This is called dispatching.
c. Control
Once plans are made and shop orders released, the process must be monitored tolearn what is actually happening. The results are compared to the plan to decidewhether corrective action is necessary. Production activity control will do the following:
Rank the shop orders in desired priority sequence by work center and establisha dispatch list based on this information.
Track the actual performance of work orders and compare it to plannedschedules. Where necessary, PAC must take corrective action by replanning,rescheduling, or adjusting capacity to meet final delivery requirements.
Monitor and control workinprocess, lead times, and work center queues.
Report work center efficiency, operation times, order quantities, and scrap.
The functions of planning, implementing, and controlling are shown schematically inFigure 6.2.

9/1/2015 Production Activity Control
http://www.mdcegypt.com/Pages/Purchasing/Material%20Management/Production%20Activity%20Control.asp 3/19
d. Manufacturing Systems
The particular type of production control system used varies from company tocompany, but all should perform the preceding functions. However, the relativeimportance of these functions will depend on the type of manufacturing process.Manufacturing processes can be conveniently broken down into three categories:
1. Flow manufacturing.
2. Intermittent manufacturing.
3. Project manufacturing.
Flow manufacturing.
Flow manufacturing. Flow manufacturing is concerned with theproduction of highvolume standard products. If the units are discrete(e.g., cars and appliances), the process is usually called repetitivemanufacturing, and if the goods are made in a continuous flow(e.g., gasoline), continuous manufacturing. There are four majorcharacteristics to flow manufacturing:
1. Routings are fixed, and work centers are arranged accordingto the routing. The time taken to perform work at one workcenter is almost the same as at any other work center in theline.
2. Work centers are dedicated to producing a limited range ofsimilar products. Machinery and tooling are especiallydesigned to make the specific products.
3. Material flows from one workstation to another using someform of mechanical transfer. There is little buildup in workinprocess inventory, and throughput times are low.
4. Capacity is fixed by the line.
Production activity control concentrates on planning the flow of workand making sure that the right material is fed to the line as stated inthe planned schedule. Since work flows from one workstation toanother automatically, implementation and control are relativelysimple.
Intermittent manufacturing.
Intermittent manufacturing is characterized by many variations inproduct design, process requirements, and order quantities. Thiskind of manufacturing is characterized by the following:
1. Flow of work through the shop is varied and depends on thedesign of a particular product. As orders are processed, theywill take more time at one workstation than at another. Thus,the work flow is not balanced.
2. Machinery and workers must be flexible enough to do thevariety of work. Machinery and work centers are usuallygrouped according to the function they perform (e.g., alllathes in one department).
3. Throughput times are generally long. Scheduling work toarrive just when needed is difficult, the time taken by an orderat each work center varies, and work queues before workcenters, causing long delays in processing. Workinprocessinventory is often large.
4. The capacity required depends on the particular mix ofproducts being built and is difficult to predict.
Production activity control in intermittent manufacturing is complex.Because of the number of products made, the variety of routings,and scheduling problems, PAC is a major activity in this type ofmanufacturing. Planning and control are typically exercised usingshop orders for each batch being produced. Our discussion of PACassumes this kind of environment.
Project manufacturing.
Project manufacturing usually involves the creation of one or a smallnumber of units. Large shipbuilding is an example. Because thedesign of a product is often carried out or modified as the projectdevelops, there is close coordination between manufacturing,marketing, purchasing, and engineering.
2. Data Requirements
To plan the processing of materials through manufacturing, PAC must have the following information:

9/1/2015 Production Activity Control
http://www.mdcegypt.com/Pages/Purchasing/Material%20Management/Production%20Activity%20Control.asp 4/19
What and how much to produce.
When parts are needed so the completion date can be met.
What operations are required to make the product and how long the operations will take.
What the available capacities of the various work centers are.
Production activity control must have a data or information system from which to work. Usually thedata needed to answer these questions are organized into databases. The files contained in thedatabases are of two types: planning and control.
a. Planning Files
Four planning files are needed: item master file, product structure file, routing file, andwork center master file.
Item master file.
There is one record in the item master tile for each part number. Thefile contains, in one place, all of the pertinent data related to the part.For PAC, this includes the following:
Part number, a unique number assigned to a component.
Part description.
Manufacturing lead time, the normal time needed to make thispart.
Quantity on hand.
Quantity available.
Allocated quantity, quantities assigned to specific work ordersbut not yet withdrawn from inventory.
Onorder quantities, the balance due on all outstanding orders.
Lotsize quantity, the quantity normally ordered at one time.
Product structure file (bill of material file).
The product structure tile (bill of material file) contains a list of thesinglelevel components and quantities needed to assemble a parent.It forms a basis for a “pick list” to be used by storeroom personnel tocollect the parts required to make the assembly.
Routing file.
The routing file contains a record for each part manufactured. Therouting consists of a series of operations required to make the item.For each product, this file contains a stepbystep set of instructionsdescribing how the product is made. It gives details of the following:
The operations required to make the product and the sequencein which those operations are performed.A brief description of each operation.
Equipment, tools, and accessories needed for each operation.
Setup times, the standard time required for setting up theequipment for each operation.
Run times, the standard time to process one unit through eachoperation.
Lead times for each operation.
Work center master file.
The work center master file collects all of the relevant data on a workcenter. For each work center, it gives details on the following:
Work center number.
Capacity.
Number of shifts worked per week.
Number of machine hours per shift.
Number of labor hours per shift.
Efficiency.
Utilization.
Queue time, the average time that a job waits at the workcenter before work is begun.
Alternate work centers, work centers that may be used asalternatives.

9/1/2015 Production Activity Control
http://www.mdcegypt.com/Pages/Purchasing/Material%20Management/Production%20Activity%20Control.asp 5/19
b. Control Files
Control in intermittent manufacturing is exercised through shop orders and controlfiles that contain data on these orders. There are generally two kinds of files: theshop order master file and the shop order detail file.
Shop order master file
Each active manufacturing order has a record in the shop ordermaster file. The purpose is to provide summarized data on eachshop order such as the following information:
Shop order number, a unique number identifying the shoporder.
Order quantity.
Quantity completed.
Quantity scrapped
150 Chapter 6
Quantity of material issued to the order.
Due date, the date the order is expected to be finished.
Priority, a value used to rank the order in relation to others.
Balance due, the quantity not yet completed.
Cost information.
Shop order detail file.
Each shop order has a detail file that contains a record for eachoperation needed to make the item. Each record contains thefollowing information:
Operation number.
Setup hours, planned and actual.
Run hours, planned and actual.
Quantity reported complete at that operation.
Quantity reported scrapped at that operation.
Due date or lead time remaining.
3. Order Preparation
Once authorization to process an order has been received, production activity control is responsible forplanning and preparing its release to the shop floor. The order should be reviewed to be sure that thenecessary tooling, material, and capacity are available. If they are not, the order cannot be completedand should not be released.
Tooling is not generally considered in the material requirements planning (MRP) program, so at thisstage, material availability must be checked. If MRP software is used, it will have checked theavailability of material and allocated it to a shop order so no further checking is necessary. If MRPsoftware is not used, production activity control must manually check material availability.
If a capacity requirements planning system has been used, necessary capacity should be available.However, at this stage, there may be some differences between planned capacity and what is actuallyavailable. When capacity requirements planning is not used, it is necessary to determine if capacity isavailable.
Checking capacity availability is a twostep process. First, the order must be scheduled to see whenthe capacity is needed, and second, the load on work centers must be checked in that period.Scheduling and loading are discussed in the next two sections.
4. Scheduling
The objective of scheduling is to meet delivery dates and to make the best use of manufacturingresources. It involves establishing start and finish dates for each operation required to complete anitem. To develop a reliable schedule, the planner must have information on routing, required andavailable capacity, competing jobs, and manufacturing lead times (MLT) at each work center involved.
a. Manufacturing Lead Time
Manufacturing lead time is the time normally required to produce an item in a typicallot quantity. Typically, MLT consists of five elements:
1. Queue time, amount of time the job is waiting at a work center before operationbegins.

9/1/2015 Production Activity Control
http://www.mdcegypt.com/Pages/Purchasing/Material%20Management/Production%20Activity%20Control.asp 6/19
2. Setup time, time required to prepare the work center for operation.
3. Run time, time needed to run the order through the operation.
4. Wait time, amount of time the job is at the work center before being moved tothe next work center.
5. Move time, transit time between work centers.
The total manufacturing lead time will be the sum of order preparation and release plusthe MLTs for each operation. Figure 6.3 shows the elements making up manufacturinglead time. Setup time and run time are straightforward, and determining them is theresponsibility of the industrial engineering department. Queue, wait, and move timesare under the control of manufacturing and PAC.\
The largest of the five elements is queue time. Typically, in an intermittentmanufacturing operation, it accounts for 85%—95% of the total lead time. Productionactivity control is responsible for managing the queue by regulating the flow of workinto and out of work centers. If the number of orders waiting to be worked on (load) isreduced, so is the queue time, the lead time, and workinprocess. Increasing capacityalso reduces queue. Production activity control must manage both the input of ordersto the production process and the available capacity to control queue and workinprocess.
A term that is closely related to manufacturing lead time is cycle time. The ninthedition of the APICS Dictionary defines cycle time as the length of time from whenmaterial enters a production facility until it exits. A synonym is throughput time.
b. Example Problem
An order for 100 of a product is processed on work centers A and B. The setup timeon A is 30 minutes, and run time is ten minutes per piece. The setup time on B is 50minutes, and the run time is five minutes per piece. Wait time between the twooperations is four hours. The move time between A and B is ten minutes. Wait timeafter operation B is four hours, and the move time into stores is 15 minutes. There isno queue at either workstation. Calculate the total manufacturing lead time for theorder.
Answer Work Center A operation time = 30 + (100 x 10) = 1030 minutes Wait time = 240 minutes Move time from A to B = 10 minutes Work Center B operation time = 50 + (100 x 5) = 550 minutes Wait time = 240 minutes Move time from B to stores = 15 minutes Total manufacturing lead time = 2085 minutes = 34 hours, 45 minutes
c. Scheduling Techniques.
There are many techniques to schedule shop orders through a plant, but all of themrequire an understanding of forward and backward scheduling as well as finite andinfinite loading.
Forward scheduling assumes that material procurement and operation scheduling fora component start when the order is received, whatever the due date, and thatoperations are scheduled forward from this date. The first line in Figure 6.4 illustratesthis method. The result is completion before the due date, which usually results in abuildup of inventory. This method is used to decide the earliest delivery date for aproduct.Forward scheduling is used to calculate how long it will take to complete a task. Thetechnique is used for purposes such as developing promise dates for customers orfiguring out whether an order behind schedule can be caught up.
Backward scheduling is illustrated by the second line in Figure 6.4. The last operationon the routing is scheduled first and is scheduled for completion at the due date.

9/1/2015 Production Activity Control
http://www.mdcegypt.com/Pages/Purchasing/Material%20Management/Production%20Activity%20Control.asp 7/19
Previous operations are scheduled back from the last operation. This schedules itemsto be available as needed and is the same logic as used in the MRP system. Workinprocess inventory is reduced, but because there is little slack time in the system,customer service may suffer.
Backward scheduling is used to determine when an order must be started. Backwardscheduling is common in industry because it reduces inventory.
Infinite loading is also illustrated in Figure 6.4. The assumption is made that theworkstations on which operations 1, 2, and 3 are done have capacity available whenrequired. It does not consider the existence of other shop orders competing forcapacity at these work centers. It assumes infinite capacity will be available. Figure6.5 shows a load profile for infinite capacity. Notice the over and under load.
Finite loading assumes there is a defined limit to available capacity at anyworkstation. If there is not enough capacity available at a workstation because of othershop orders, the order has to be scheduled in a different time period. Figure 6.6illustrates the condition.
In the forwardscheduling example shown in Figure 6.6, the first and second operationscannot be performed at their respective workstations when they should be because therequired capacity is not available at the time required. These operations

9/1/2015 Production Activity Control
http://www.mdcegypt.com/Pages/Purchasing/Material%20Management/Production%20Activity%20Control.asp 8/19
must be rescheduled to a later time period. Similarly, in the example of schedulingback, the second and first operations cannot be performed when they should be andmust be rescheduled to an earlier time period. Figure 6.7 shows a load profile for finiteloading. Notice the load is smoothed so there is no overload condition.
Chapter 5 gives an example of backward scheduling as it relates to capacityrequirements planning. The same process is used in PAC.
d. Example Problem
A company has an order for 50 brand X to be delivered on day 100. Draw a backwardschedule based on the following:
Only one machine is assigned to each operation
The factory works one 8hour shift five days a week
The parts move in one lot of 50.
Part Operation Time
A 10 5
A 20 3
B 10 10
Assembly X 5
Answer
e. Operation Overlapping
In operation overlapping, the next operation is allowed to begin before the entire lot iscompleted on the previous operation. This reduces the total manufacturing lead timesbecause the second operation starts before the first operation finishes all the parts inthe order. Figure 6.8 shows schematically how it works and the potential reduction inlead time.
An order is divided into at least two lots. When the first lot is completed on operationA, it is transferred to operation B. In Figure 6.8, it is assumed operation B cannot beset up until the first lot is received, but this is not always the case. While
9/1/2015 Production Activity Control
http://www.mdcegypt.com/Pages/Purchasing/Material%20Management/Production%20Activity%20Control.asp 9/19
operation A continues with the second lot, operation B starts on the first lot. Whenoperation A finishes the second lot, it is transferred to operation B. If the lots are sizedproperly, there will be no idle time at operation B. The manufacturing lead time isreduced by the overlap time and the elimination of queue time.
Operation overlapping is a method of expediting an order, but there are some costsinvolved. First, move costs are increased, especially if the overlapped operations arenot close together. Second, it may increase the queue and lead time for other orders.Third, it does not increase capacity but potentially reduces it if the second operation isidle waiting for parts from the first operation.
The problem is deciding the size of the sublot. If the run time per piece on operation Bis shorter than that on A, the first batch must be large enough to avoid idle time onoperation B.
f. Example Problem
Refer to the data given in the example problem in the section on manufacturing leadtime. It is decided to overlap operations A and B by splitting the lot of 100 into twolots of 70 and 30. Wait time between A and B and between B and stores iseliminated. The move times remain the same. Setup on operation B cannot start untilthe first batch arrives. Calculate the manufacturing lead time. How much time hasbeen saved?
AnswerOperation time for A forlot of 70
= 30 + (70x
10) = 730 minutes
Move time between Aand B
= 10 minutes
Operation time for B forlot of 100
= 50 + (100 x 5) = 550 minutes
Move time from B tostores
= 15 minutes
Total manufacturinglead time
= 1305 minutes
= 21 hours, 45minutes
Time saved = 2085 —1305 =
780 minutes = 13 hours
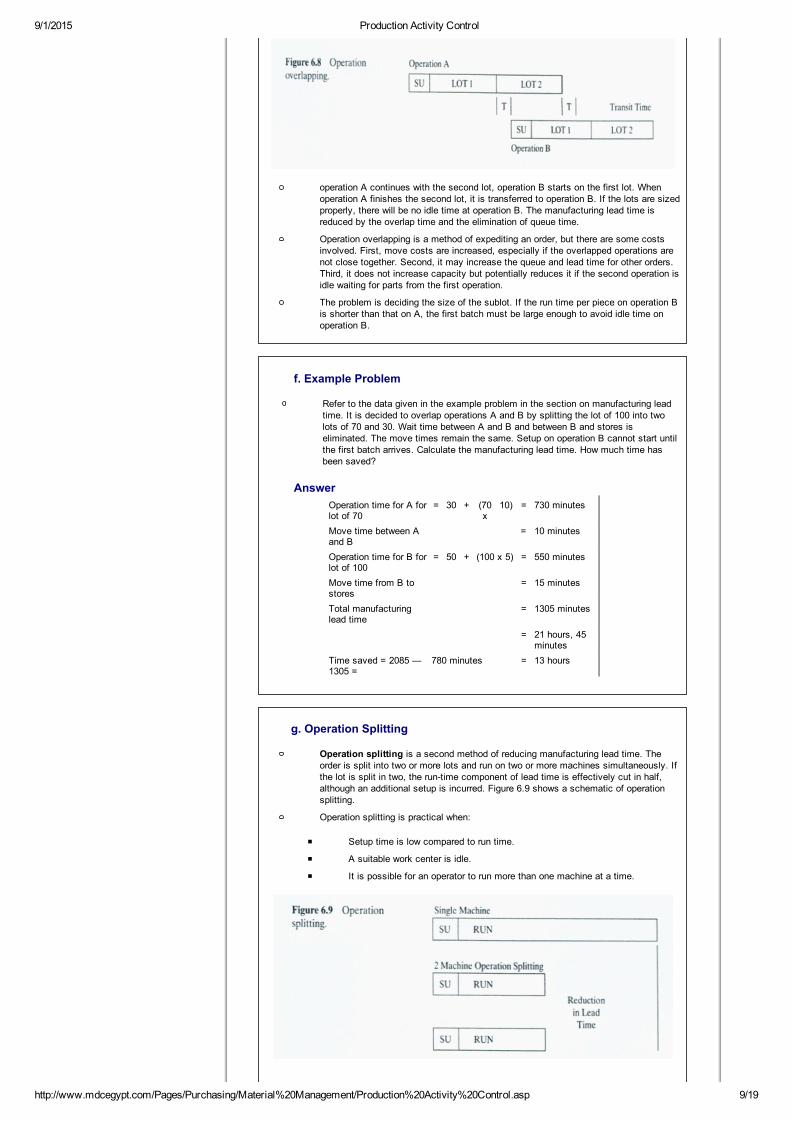
g. Operation Splitting
Operation splitting is a second method of reducing manufacturing lead time. Theorder is split into two or more lots and run on two or more machines simultaneously. Ifthe lot is split in two, the runtime component of lead time is effectively cut in half,although an additional setup is incurred. Figure 6.9 shows a schematic of operationsplitting.
Operation splitting is practical when:
Setup time is low compared to run time.
A suitable work center is idle.
It is possible for an operator to run more than one machine at a time.

9/1/2015 Production Activity Control
http://www.mdcegypt.com/Pages/Purchasing/Material%20Management/Production%20Activity%20Control.asp 10/19
The last condition often exists when a machine cycles through its operationautomatically, leaving the operator time to set up another machine. The time needed tounload and load must be shorter than the run time per piece. For example, if theunload/load time was two minutes and the run time was three minutes, the operatorwould have time to unload and load the first machine while the second was running.
h. Example Problem
A component made on a particular work center has a setup time of 100 minutes anda run time of three minutes per piece. An order for 500 is to be processed on twomachines simultaneously. The machines can be set up at the same time. Calculatethe elapsed operation time.
AnswerElapsed operation time 100 + 3 X 250 = 850 minutes
= 14 hours and 10 minutes
5. Load Leveling
Load profiles were discussed in Chapter 5 in the section on capacity requirements planning. The loadprofile for a work center is constructed by calculating the standard hours of operation for each order ineach time period and adding them together by time period. Figure 6.10 is an example of a load report.
This report tells PAC what the load is on the work center. There is a capacity shortage in week 20 of30 hours. This means there was no point in releasing all of the planned orders that week. Perhapssome could be released in week 18 or 19, and perhaps some overtime could be worked to help reducethe capacity crunch.
Work Center: 10 Available Time: 120 hours/week
Description: Lathes Efficiency: 115%
Number of Machines: 3 Utilization 80%
Rated Capacity:
110 standard hours/week
Week 18 19 20 21 22 23 Total
Released Load 105 100 80 30 0 0 315
Planned Load 60 80 130 80 350
Total Load 105 100 140 110 130 80 665
Rated Capacity 110 110 110 110 110 110 660
(Over)/UnderCapacity
5 10 30 0 20 30 5
Figure 6.10 Work center load report.
6. Scheduling Bottlenecks
In intermittent manufacturing, it is almost impossible to balance the available capacities of the variousworkstations with the demand for their capacity. As a result, some workstations are overloaded andsome underloaded. The overloaded workstations are called bottlenecks and, by definition, are thoseworkstations where the required capacity is greater than the available capacity. In the ninth edition oftheir dictionary, APICS defines a bottleneck as “a facility, function, department, or resource whosecapacity is equal to or less than the demand placed upon it.”
Throughput. Throughput is the total volume of production passing through a facility. Bottleneckscontrol the throughput of all products processed by them. If work centers feeding bottlenecks producemore than the bottleneck can process, excess workinprocess inventory is built up. Therefore, workshould be scheduled through the bottleneck at the rate it can process the work. Work centers fed bybottlenecks have their throughput controlled by the bottleneck, and their schedules should bedetermined by that of the bottleneck.
a. Example Problem
Suppose a manufacturer makes wagons composed of a box body, a handle assembly,and two wheel assemblies. Demand for the wagons is 500 a week. The wheelassembly capacity is 1200 sets a week, the handle assembly capacity is 450 a week,and final assembly can produce 550 wagons a week.
a. What is the capacity of the factory?
b. What limits the throughput of the factory?
c. How many wheel assemblies should be made each week?
d. What is the utilization of the wheel assembly operation?

9/1/2015 Production Activity Control
http://www.mdcegypt.com/Pages/Purchasing/Material%20Management/Production%20Activity%20Control.asp 11/19
e. What happens if the wheel assembly utilization is increased to 100%?
Answer
a. 450 units a week.
b. Throughput is limited by the capacity of the handle assembly operation.
c. 900 wheel assemblies should be made each week. This matches thecapacity of the handle assembly operation.
d. Utilization of the wheel assembly operation is 900 ± 1200 75%.
e. Excess inventory builds up.
b. Example Problem
A work center is to process 150 units of gear shaft SG 123 on work order 333. Thesetup time is 1.5 hours, and the run time is 0.2 hours per piece. What is the standardtime needed to run the order?
Answer
Total standard time = setup time + run time = 1.5 + (150 x 0.2) = 31.5 standard hours
c. Some bottleneck principles.
Since bottlenecks control the throughput of a facility, some important principles shouldbe noted:
1. Utilization of a nonbottleneck resource is not determined by its potential, but byanother constraint in the system. In the previous example problem, theutilization of the wheel assembly operation was determined by the handleassembly operation.
2. Using a nonbottleneck 100% of the time does not produce 100% utilization. lfthe wheel assembly operation was utilized 100% of the time, it would produce1200 sets of wheels a week, 300 sets more than needed. Because of thebuildup of inventory, this operation would eventually have to stop.
3. The capacity of the system depends on the capacity of the bottleneck. If thehandle assembly operation breaks down, the throughput of the factory isreduced.
4. Time saved at a nonbottleneck saves the system nothing. Suppose, in a flashof brilliance, the industrial engineering department increased the capacity of thewheel assembly operation to 1500 units a week. This extra capacity could notbe utilized, and nothing would be gained.
5. Capacity and priority must be considered together. Suppose the wagonmanufacturer made wagons with two styles of handles. During setup, nothing isproduced, which reduces the capacity of the system. Since handle assembly isthe bottleneck, every setup in this operation reduces the throughput of thesystem. Ideally, the company would run one style of handle for six months, thenswitch over to the second style. However, customers wanting the second styleof handle might not be willing to wait six months. A compromise is neededwhereby runs are as long as possible but priority (demand) is satisfied.
6. Loads can, and should, be split. Suppose the handle assembly operation (thebottleneck) produces one style of handle for two weeks, then switches to thesecond style. The batch size is 900 handles. Rather than waiting until the 900are produced before moving them to the final assembly area, the manufacturercan move a day’s production (90) at a time. The process batch size and thetransfer batch size are different. Thus, delivery to the final assembly is matchedto usage, and workinprocess inventory is reduced.
7. Focus should be on balancing the flow through the shop. The key is throughputthat ends up in sales
d. Managing bottlenecks.
Since bottlenecks are so important to the throughput of a system, scheduling andcontrolling them is extremely important. The following must be done:
1. Establish a time buffer before each bottleneck. A time buffer is aninventory (queue) place before each bottleneck. Because it is of theutmost importance to keep the bottleneck working, it must never bestarved for material, and it can be starved only if the flow from feedingworkstations is disrupted. The time buffer should be only as long as thetime of any expected delay caused by feeding workstations. In this way,the time buffer ensures that the bottleneck will not be shut down for lackof work and this queue will be held at a predetermined minimum quantity.
2. Control the rate of material feeding the bottleneck. A bottleneck must be

9/1/2015 Production Activity Control
http://www.mdcegypt.com/Pages/Purchasing/Material%20Management/Production%20Activity%20Control.asp 12/19
fed at a rate equal to its capacity so the time buffer remains constant.The first operation in the sequence of operations is called a gateoperation. This operation controls the work feeding the bottleneck andmust operate at a rate equal to the output of the bottleneck so the timebuffer queue is maintained.
3. Do everything to provide the needed bottleneck capacity. Anything thatincreases the capacity of the bottleneck increases the capacity of thesystem. Better utilization, fewer setups, and improved methods to reducesetup and run time are some methods for increasing capacity.
4. Adjust loads. This is similar to item 3 but puts emphasis on reducing theload on a bottleneck by using such things as using alternate workcenters and subcontracting. These may be more costly than using thebottleneck, but utilization of nonbottlenecks and throughput of the totalsystem is increased, resulting in more company sales and increasedprofits.
5. 5. Change the schedule. Do this as a final resort, but it is better to behonest about delivery promises.
Once the bottleneck is scheduled according to its available capacity and the marketdemand it must satisfy, the nonbottleneck resources can be scheduled. When a workorder is completed at the bottleneck, it can be scheduled on subsequent operations.
Feeding operations have to protect the time buffer by scheduling backward in time fromthe bottleneck. If the time buffer is set at four days, the operation immediately preceding the bottleneck is scheduled to complete the required parts four days before theyare scheduled to run on the bottleneck. Each preceding operation can be hackscheduled in the same way so the parts are available as required for the nextoperation.
Any disturbances in the feeding operations are absorbed by the time buffer, andthroughput is not affected. Also, workinprocess inventory is reduced. Since the queueis limited to the time buffer, lead times are reduced.
7. Theory Of Constraints And DrumBufferRope
The previous section “Scheduling Bottlenecks” was developed by Eliyahu M. Goldratt in his Theory ofConstraints. It has allowed many people to rethink their approaches to improving and managing theirproduction processes. The fundamental concept behind the work is that every operation producing aproduct or service is a series of linked processes. Each process has a specific capacity to producethe given defined output for the operation, and that in virtually every case, there is one process thatlimits or constrains the throughput from the entire operation. Refer to Figure 6.11 for an example of anoperation producing product A.
The total operation is constrained by process 3 at 4 per hour. No matter how much efficiency there isin the other processes and how many process improvements are made in processes 1, 2, and 4, it willnever be possible to exceed the overall operational output of 4 per hour. Increased efficiency andutilization in processes 1 and 2 will only increase inventory—not sales.
a. Manage the Constraint
Several fundamental guidelines have been developed for understanding how to managea constraining process or bottleneck. Some of the more noteworthy include focusing onbalancing the flow through the shop, time lost at a bottleneck is time lost to the wholesystem but time lost at a nonconstraint is a mirage, and transfer batches do not haveto be the same size as process batches. All of these were discussed in the previoussection “Some Bottleneck Principles.”
b. Improve the Process
Once a constraint has been identified, there is a fivestep process that isrecommended to help improve the performance of the operation. The five steps aresummarized as follows:
1. Identify the constraint. This implies the need to examine the entire process todetermine which process limits the throughput. The concept does not limit thisprocess examination to merely the operational processes. For example, in
Figure 6.11, suppose the sales department was only selling the output at therate of 3 per hour. In that case, sales would be the constraint and not process3. It must be remembered that a constraint limits throughput, not inventory orproduction.
2. Exploit the constraint. Find methods to maximize the utilization of the constraint

9/1/2015 Production Activity Control
http://www.mdcegypt.com/Pages/Purchasing/Material%20Management/Production%20Activity%20Control.asp 13/19
toward productive throughput. For example, in many operations all processes are shutdown during lunchtime. If a process is a constraint, the operation should considerrotating lunch periods so that the constraint is never allowed to be idle.
3. Subordinate everything to the constraint. Effective utilization of the constraint is themost important issue. Everything else is secondary.
4. Elevate the constraint. This means to find ways to increase the available hours of theconstraint, including more of it.
5. Once the constraint is a constraint no longer find the new one and repeat the steps.As the effective utilization of the constraint increases, it may cease to be a constraintas another process becomes one. In that case the emphasis shifts to the newprocess constraint.
c. Scheduling with the Theory of Constraints
Even the scheduling system developed for the Theory of Constraints has its ownspecific approach. It is often described as DrumBufferRope:
Drum. The drum of the system refers to the “drumbeat” or pace ofproduction. It represents the master schedule for the operation, which isfocused around the pace of throughput as defined by the constraint.
Buffer. Since it is so important that the constraint never be “starved” forneeded inventory, a “time” buffer is often established in front of theconstraint. It is called a time buffer because it represents the amount oftime that the inventory in the buffer protects the constraint fromdisruptions.
Rope. The analogy is that the rope “puils” production to the constraint fornecessary processing. While this may imply a Kanbantype pull system,it can be done by a wellcoordinated release of material into the systemat the right time.
Even the scheduling system has its primary focus on effective management of theorganization’s constraint to throughput and sales.
b. Example Problem
Parent X requires one each of component Y and Z. Both Y and Z are processed onwork center 20 which has an available capacity of 40 hours. The setup time forcomponent Y is one hour and the run time 0.3 hours per piece. For component Z, setuptime is two hours and the run time is 0.20 hours per piece. Calculate the number of Ysand Zs that can be produced.
Answer Available capacity for Ys and Zs = 40 hours Letx = number of Ys and Zs to produce Time~ + Timex = 40 hours 1 + 0.3x+ 2+0.2x=40hours 0.5x = 37 hours X = 74
Therefore, work center 20 can produce 74 Ys and 74 Zs.
8. Implementation
Orders that have tooling, material, and capacity have a good chance of being completed on time andcan be released to the shop floor. Other orders that do not have all of the necessary elements shouldnot be released because they only cause excess workinprocess inventory and may interrupt work onorders that can be completed. The process for releasing an order is shown in Figure 6.12.
Implementation is arrived at by issuing a shop order to manufacturing authorizing them to proceed withmaking the item. A shop packet is usually compiled which contains the shop order and whatever otherinformation is needed by manufacturing. It may include any of the following:
Shop order showing the shop order number, the part number, name, description, and quantity.
Engineering drawings.
Bills of material.
Route sheets showing the operations to be performed, equipment and accessories needed,materials to use, and the setup and run times.
Material issue tickets that authorize manufacturing to get the required material from stores.These are also used for charging the material against the shop order.
Tool requisitions authorizing manufacturing to withdraw necessary tooling from the tool crib.
Job tickets for each operation to be performed. As well as authorizing the individual operations

9/1/2015 Production Activity Control
http://www.mdcegypt.com/Pages/Purchasing/Material%20Management/Production%20Activity%20Control.asp 14/19
to be performed, they also can function as part of a reporting system. The worker can log onand off the job using the job ticket, and it then becomes a record of that operation.
Move tickets that authorize and direct the movement of work between operations.
9. Control
Once work orders have been issued to manufacturing, their progress has to be controlled. To controlprogress, performance has to be measured and compared to what is planned. If what is actuallyhappening (what is measured) varies significantly from what was planned, either the plans have to bechanged or corrective action must be taken to bring performance back to plan.
The objectives of production activity control are to meet delivery dates and to make the best use ofcompany resources. To meet delivery dates, a company must control the progress of orders on theshop floor, which means controlling the lead time for orders. As discussed earlier in this chapter, thelargest component of lead time is queue. If queue can be controlled, delivery dates can be met.Chapter 1 discussed some characteristics of intermittent operations in which many different productsand order quantities have many different routings, each requiring different capacities. in thisenvironment, it is almost impossible to balance the load over all the workstations. Queue existsbecause of this erratic input and output.
To control queue and meet delivery commitments, production activity control must:
Control the work going into and coming out of a work center. This is generally calledinput/output control.
Set the correct priority of orders to run at each work center.
a. Input/Output Control
Production activity control must balance the flow of work to and from different workcenters. This is to ensure queue, workinprocess, and lead times are controlled. Theinput/output control system is a method of managing queues and workinprocess leadtimes by monitoring and controlling the input to, and output from, a facility. It isdesigned to balance the input rate in hours with the output rate so these will becontrolled.
The input rate is controlled by the release of orders to the shop floor. If the rate of inputis increased, queue, workinprocess, and lead times increase. The output rate iscontrolled by increasing or decreasing the capacity of a work center. Capacity changeis a problem for manufacturing, but it can be attained by overtime or undertime,shifting workers, and so forth. Figure 6.13 shows the idea graphically.
Input/output report.

9/1/2015 Production Activity Control
http://www.mdcegypt.com/Pages/Purchasing/Material%20Management/Production%20Activity%20Control.asp 15/19
To control input and output, a plan must be devised, along with amethod for comparing what actually occurs against what was planned.This information is shown on an input/output report. Figure 6.14 isan example of such a report. The values are in standard hours.
Work Center: 201
Capacity per Period: 40 standard hours
Period 1 2 3 4 5 Total
Planned Input 38 32 36 40 44 190
Actual Input 34 32 32 42 40 180
CumulativeVariance
4 4 8 6 10 10
Planned Input 40 40 40 40 40 200
Actual Input 32 36 44 44 36 192
CumulativeVariance
8 12 8 4 8 8
PlannedBacklog
32 30 22 18 18 22
Actual Backlog 32 34 30 18 16 20
Figure 6.14 Input/output report.
Cumulative variance
Cumulative variance is the difference between the total planned for agiven pe¬riod and the actual total for that period. It is calculated asfollows:
Cumulative variance = previous cumulative variance + actual— planned
Cumulative input variance week 2 = —4 + 32 — 32 = —4
Backlog is the same as queue and expresses the work to be done inhours. It is calculated as follows:
Planned backlog for period 1 = previous backlog + planned input — plannedoutput = 32 + 38 — 40 = 30 hours
The report shows the plan was to maintain a level output in eachperiod and to reduce the queue and lead time by ten hours, but inputand output were lower than expected.
Planned and actual inputs monitor the flow of work coming to the workcenter. Planned and actual outputs monitor the performance of thework center. Planned and actual backlogs monitor the queue and leadtime performance.
b. Example Problem
Complete the following input/output report for weeks 1 and 2.

9/1/2015 Production Activity Control
http://www.mdcegypt.com/Pages/Purchasing/Material%20Management/Production%20Activity%20Control.asp 16/19
Week 1 2
Planned Input 45 40
Actual Input 42 46
Cumulative Variance
Planned Output 40 40
Actual Output 42 44
Cumulative Variance
Planned Backlog 30
Actual Backlog 30
Answer
Cumulative input variance week 1 = 42 — 45 = —3Cumulative input variance week 2 = —3 + 46 — 40 = 3Cumulative output variance week 1 = 42 — 40 = 2Cumulative output variance week 2 = 2 + 44 — 40 6Planned backlog week 1 = 30 + 45 — 40 = 35Planned backlog week 2 = 35 + 40 — 40 = 35Actual backlog week 1 = 30 + 42 — 42 = 30Actual backlog week 2 = 30 + 46 — 44 = 32
c. Operation Sequencing
The ninth edition of the APICS Dictionary defines operation sequencing as a techniquefor shortterm planning of actual jobs to be run in each work center based on capacityand priorities. Priority, in this case, is the sequence in which jobs at a work centershould he worked on.
The material requirements plan establishes proper need dates and quantities. Overtime, these dates and quantities change for a variety of reasons. Customers mayrequire different delivery quantities or dates. Deliveries of component parts, either fromvendors or internally, may not be met. Scrap, shortages, and overages may occur, andso on. Control of priorities is exercised through dispatching.
Dispatching.
Dispatching is the function of selecting and sequencing available jobsto be run at individual work centers. The dispatch list is the instrumentof priority control. It is a listing by operation of all the jobs available tobe run at a work center with the job listed in priority sequence. Itnormally includes the following information and is updated andpublished at least daily:
Plant, department, and work center.
Part number, shop order number, operation number, andoperation description of jobs at the work center.
Standard hours.
Priority information.
Jobs coming to the work center.
Figure 6.15 is an example of a daily dispatch list.
Dispatching rules.
The ranking of jobs for the dispatch list is created through theapplication of priority rules. There are many rules, some attempting toreduce workinprocess inventory, others attempting to minimize thenumber of late orders or maximize
DISPATCH LIST
Work Center: 10
Rated Capacity: 16 standard hours per day
Shop Date: 250
Order Part Order Setup Run Total Quantity Load Operation Dates
Number Number Quantity Hours Hours Hours Completed Remaining Start Finish
123 6554 100 1.5 15 16.5 75 3.75 249 250
121 7345 50 0.5 30 30.5 10 24 249 251
142 2687 500 0.2 75 75.2 0 75 250 259
Total Available Load in Standard Hours 102.75

9/1/2015 Production Activity Control
http://www.mdcegypt.com/Pages/Purchasing/Material%20Management/Production%20Activity%20Control.asp 17/19
Jobs Coming
145 7745 200 0.7 20 20.7 0 20.7 251 253
135 2832 20 1.2 1.0 2.7 0 2.7 253 254
Total Future Load in Standard Hours 23.4
Figure 6.15 Dispatch list (based on 2 machines working one 8hour shift per day
the output of the work center. None is perfect or will satisfy allobjectives. Some commonly used rules are:
First come, first served (FCFS). Jobs are performed in thesequence in which they are received. This rule ignores duedates and processing time.
Earliest job due date (EDD). Jobs are performed according totheir due dates. Due dates are considered, but processing timeis not.
Earliest operation due date (ODD). Jobs are performedaccording to their operation due dates. Due dates andprocessing time are taken into account. As well, the operationdue date is easily understood on the shop floor.
Shortest process time (SPT). Jobs are sequenced according totheir process time. This rule ignores due dates, but itmaximizes the number of jobs processed. Orders with longprocess times tend to be delayed.
Figure 6.16 illustrates how these sequencing rules work. Notice thateach rule usually produces a different sequence.
One other rule that should be mentioned is called critical ratio (CR).This is an index of the relative priority of an order to other orders at awork center. It is based on the ratio of time remaining to workremaining and is usually expressed as:
Due date present date actual time remaining CR = . = . Lead time remaining lead time remaining
Lead time remaining includes all elements of manufacturing lead timeand expresses the amount of time the job normally takes tocompletion.If the actual time remaining is less than the lead time remaining, itimplies there is not sufficient time to complete the job and the job isbehind schedule. Similarly, if lead time remaining and actual timeremaining are the same, the job is on schedule. If the actual timeremaining is greater than the lead time remaining,
Job Process Arrival Due Operation Sequencing Rule
Time(days)
Date Date Due Date
FCFS EDD ODD SPT
A 4 223 245 233 2 4 1 3
B 1 224 242 239 3 2 2 1
C 5 231 240 240 4 1 3 4
D 2 219 243 242 1 3 4 2
Figure 6.16 Application of sequencing rules.
the job is ahead of schedule. If the actual time remaining is less thanone, the job is late already. The following table summarizes these factsand relates them to the critical ratio:
CR less than I (actual time less than lead time). Order is behindschedule.
CR equal to I (actual time equal to lead time). Order is onschedule.
CR greater than 1 (actual time greater than lead time). Order isahead of schedule.
CR zero or less (today’s date greater than due date). Order isalready late.
Thus, orders are listed in order of their critical ratio with the lowest onefirst. Critical ratio considers due dates and process time. However, it isnot easily understood.
d. Example Problem

9/1/2015 Production Activity Control
http://www.mdcegypt.com/Pages/Purchasing/Material%20Management/Production%20Activity%20Control.asp 18/19
Today’s date is 175. Orders A, B, and C have the following due dates and lead timeremaining. Calculate the actual time remaining and the critical ratio for each.
Lead Time Order Due Date Remaining (days)
A 185 20 B 195 20 C 205 20
Answer
Order A has a due date of 185, and today is day 175. There are 10 actual daysremaining. Since the lead time remaining is 20 days,
10 Critical ratio = =0.5 20
Similarly, the actual time remaining and the critical ratios are calculated for orders Band C. The following table gives the results:
Lead Time Actual Time
Order Due Date Remaining (days) Remaining (days) CR
A 185 20 10 0.5
B 195 20 20 1.0
C 205 20 30 1.5
Order A has less actual time remaining than lead time remaining, so the CR is lessthan 1. It is, therefore, behind schedule. Order B has a CR of 1 and is exactly onschedule. Order C has a CR of 1.5—greater than 1—and is ahead of schedule.
Dispatching rules should be simple to use and easy to understand. As shown in thepreceding example, each rule produces a different sequence and has its ownadvantages and disadvantages. Whichever rule is selected should be consistent withthe objectives of the planning system.
e. Production Reporting
Production reporting provides feedback of what is actually happening on the plantfloor. It allows PAC to maintain valid records of onhand and onorder balances, jobstatus, shortages, scrap, material shortages, and so on. Production activity controlneeds this information to establish proper priorities and to answer questions regardingdeliveries, shortages, and the status of orders. Manufacturing management needsthis information to make decisions about plant operation. Payroll needs thisinformation to calculate employees’ pay.
Data must be collected, sorted, and reported. The particular data collected dependupon the needs of the various departments. The methods of data collection vary.Sometimes the operator reports the start and completion of an operation, order,movement, and so on, using an online system directly reporting events as theyoccur via data terminals. In other cases, the operator, supervisor, or timekeeperreports this information on an operation reporting form included in the shop packet.Information about inventory withdrawals and receipts must be reported as well.
Once the data are collected, they must be sorted, and appropriate reportsproduced. Types of information needed for the various reports include:
Order status.
Weekly input/output by department or work center.
Exception reports on such things as scrap, rework, and late shop orders.
Inventory status.
Performance summaries on order status, work center and departmentefficiencies, and so on

9/1/2015 Production Activity Control
http://www.mdcegypt.com/Pages/Purchasing/Material%20Management/Production%20Activity%20Control.asp 19/19