production activity report - industrial · pdf file · 2013-07-11page | 2...
TRANSCRIPT

PRODUCTION ACTIVITY REPORT������������ �����������������������������������
2012
Industrial Commission

Ohio | Industrial Commission
PRODUCTION ACTIVITY REPORT SUMMARY AND STATISTICAL HIGHLIGHTS
JANUARY 1 - DECEMBER 31, 2012
I. MOTIONS/APPEALS/INVENTORY
A total of 214,597 issues were captured at the District Hearing Officer (DHO) and Staff Hearing Officer (SHO) levels for IC determination during calendar year (CY) 2012. The BWC recorded 139,349 new injury, occupational disease, and death claims for state funded and self-insuring employers during 2012. Of these filings, approximately 18,603 (13%) were contested and received in the IC for determination. DHO level issues captured (Allowance and C92) total 149,197, while SHO level issues (Appeals, PTD, Reconsideration, VSSR, and SHO Miscellaneous) total 65,400. Appeals and reconsiderations filed at the Commission hearing level total 24,812 and 749, respectively. First Level ICON filings, inclusive of .522/.52 filings and appeals to BWC orders, totaled 65,833 while Second Level and Above ICON filings, inclusive of appeals to DHO and SHO orders, totaled 65,572. Additionally, during CY 2012 there were approximately 25,469 issues captured that do not initially require formal adjudication via hearing (lump sum settlements, lump sum advancements, Hearing Administrator issues, PTD adjustments, etc.). This reflects a 16 percent increase over the volume of non-hearing issues captured in 2011 (21,973). These “administrative review” issues are not typically reflected in scheduled production reports. As of December 31, 2012, the IC ending inventory was 21,992 claims at all adjudicatory levels. This is inclusive of claims being processed in the IC medical sections, which totaled 558.
II. HEARING ACTIVITY
The IC heard a total of 151,428 claims during CY 2012 at all adjudicatory levels. The total DHO volume accounts for 70% of overall hearings at 105,593 claims heard. Total SHO claims heard are recorded at 45,339 claims. Deputy venue claims heard totaled 174 in CY 2012 while the Commission venue recorded 322 claims heard. DHO and SHO hearings were conducted on 246 days during CY 2012 at an average of 614 claims heard per day. District Hearing Officers averaged 429 claims heard per day while Staff Hearing Officers averaged 184 claims heard per day. Commission level hearings were scheduled on 86 days during CY 2012. During CY 2012, 26% of all claims heard were for self-insuring (SI) risks while 74% were for non-SI risks.
Ohio | Industrial Commission
III. MEDICAL ACTIVITY
The IC currently schedules medical exams in seven districts - Akron, Cincinnati, Cleveland, Columbus, Dayton, Toledo, and Youngstown. A total of 2,560 specialist exams and medical reviews were performed on behalf of the IC during CY 2012. The majority of these exams (99%) were related to PTD filings.
IV. PERFORMANCE
District Hearing Officers heard a total of 80,752 Allowance docket claims during CY 2012. The statewide median for the 45-day Filing to Hearing mandate is 36 days. The statewide median for the 38-day Receipt to Hearing benchmark is 33 days, while the statewide median for the seven-day Hearing to Mailing mandate is 3 days. Of the qualifying CY 2012 Allowance claims heard, 9,755 claims, or 14%, were beyond the 45-day Filing to Hearing mandate on industry performance. Of the qualifying 2012 Allowance claims heard, 5,999 claims, or nine percent, were beyond the 38-day Receipt Date to Hearing Date benchmark reflecting IC performance. This reflects a 10% increase in the volume of non-compliant claims with a regression of approximately one percentage point in the rate of non-compliance compared to 2011 performance. Staff Hearing Officers heard a total of 37,063 Appeal docket claims during CY 2012. The statewide median for the 45-day Filing to Hearing mandate is 34 days, while the statewide median for the seven-day Hearing to Mailing mandate is 3 days. A total of 1,918 PTD claims were heard during CY 2012. PTD applications were adjudicated within approximately 180 days. This reflects an eight-day regression from CY 2011. Statewide, final orders were published within 6 days of the hearing during CY 2012. Ohio Revised Code 4123.511 (E) requires the issuance of a refusal order within 14 days of the expiration of the period in which an appeal may be filed to an SHO order. Collectively, IC refusal orders were issued in an average of six days for the respective 14-day statutory period. For hearings conducted during CY 2012, the combined venue Commission and Deputy average for the period Filing of Appeal to Hearing Date is 44 days. This is a three-day improvement from the 2011 average of 47 days. The combined venue average for the seven-day Hearing to Mailing mandate is 44 days. This is a regression of one day from the CY 2011 average of 43 days. The combined venue average for the Filing of Appeal to Mailing of Order is 89 days, a two-day improvement from the CY 2011 rate.

TABLE OF CONTENTSSECTION I - INVENTORY
Motion/Appeal Filings BWC New Claims Filed _____________________________________________________ 1 IC New Motions Filed ______________________________________________________ 1
Summary of Inventory Hearing Inventory ________________________________________________________ 2 Medical Inventory ________________________________________________________ 3
SECTION II - HEARING ACTIVITY
Claims Heard By Region ______________________________________________________________ 4 By Hearing Level _________________________________________________________ 4 Commission/Deputy _______________________________________________________ 4 By Docket Type ___________________________________________________________ 5 By Risk Type ____________________________________________________________ 5 Hearings by Employer Group ________________________________________________ 5 Hearings Held with Interpreters ______________________________________________ 6 Emergency Hearings _______________________________________________________ 6
PTD Activity PTD Decisions by Region ___________________________________________________ 6
Continuance Experience Continuances: Prior to -vs.- at Hearing _________________________________________ 7 Continuances: Mutually Agreed -vs.- Not Mutually Agreed __________________________ 7
Hearing Administrator Decisions _________________________________________________ 8
SECTION III - MEDICAL ACTIVITY
Specialist Exams/Reviews Performed by District _____________________________________ 9
Exams/Reviews Scheduled by Specialist Type________________________________________ 10
Exam Cancellation Rates _______________________________________________________ 10
SECTION IV - PERFORMANCE
District Hearing Officer Time Frames ______________________________________________ 11 Non-Compliant Claims _____________________________________________________ 11
Staff Hearing Officer Time Frames ________________________________________________ 12
Permanent Total Disability Time Frames ____________________________________________ 12
Refusal Order Time Frames _____________________________________________________ 13
Commission Level Time Frames __________________________________________________ 13
Hearing Spike Analysis ________________________________________________________ 14
Statistical Overview __________________________________________________________ 15

��������� �������������������� �INVENTORY
Industrial Commission
Page | 1 Production Activity 2012
Industrial Commission (IC) workloads and performance are initiated by and heavily dependent upon the volume of new motion and appeal filings. IC inventory volume is subject to volatile daily swings dependent on appeal filing, claim flows from the Bureau of Workers’ Compensation (BWC), examiner production in relation to the number of issues involved in a claim, docketing loads, and continuances granted.
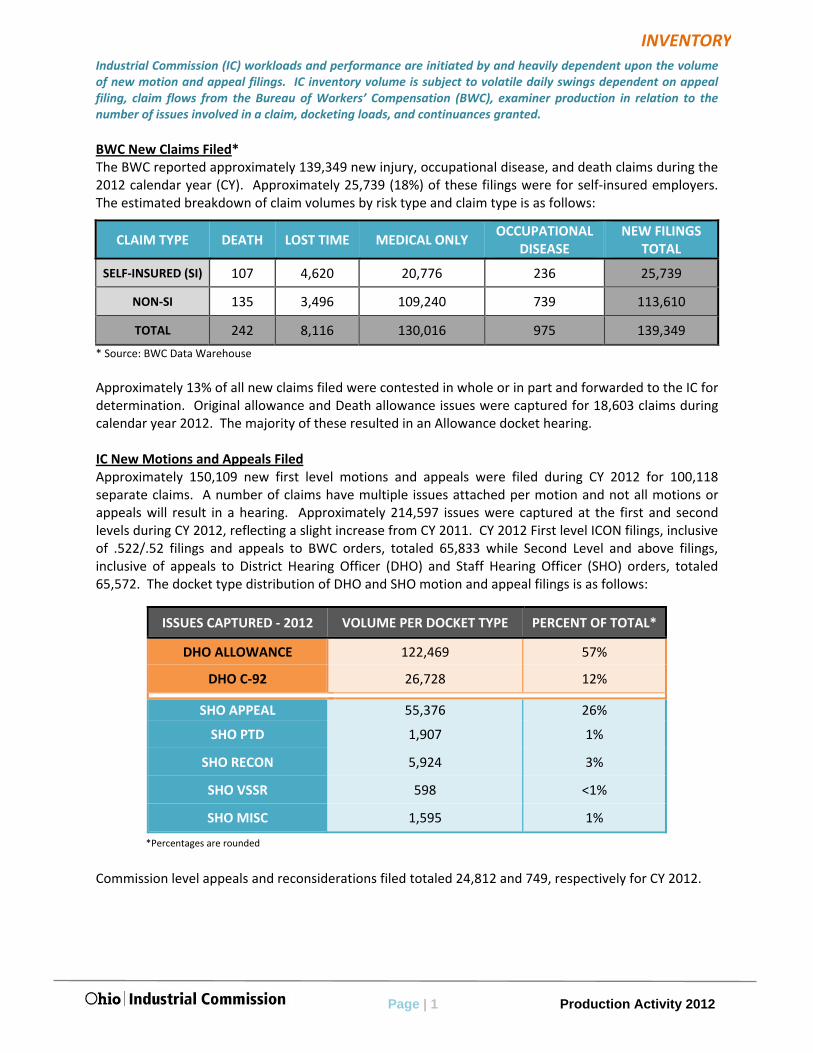
BWC New Claims Filed* The BWC reported approximately 139,349 new injury, occupational disease, and death claims during the 2012 calendar year (CY). Approximately 25,739 (18%) of these filings were for self‐insured employers. The estimated breakdown of claim volumes by risk type and claim type is as follows:
CLAIM TYPE DEATH LOST TIME MEDICAL ONLY OCCUPATIONAL
DISEASE NEW FILINGS
TOTAL
SELF‐INSURED (SI) 107 4,620 20,776 236 25,739
NON‐SI 135 3,496 109,240 739 113,610
TOTAL 242 8,116 130,016 975 139,349
* Source: BWC Data Warehouse
Approximately 13% of all new claims filed were contested in whole or in part and forwarded to the IC for determination. Original allowance and Death allowance issues were captured for 18,603 claims during calendar year 2012. The majority of these resulted in an Allowance docket hearing. IC New Motions and Appeals Filed Approximately 150,109 new first level motions and appeals were filed during CY 2012 for 100,118 separate claims. A number of claims have multiple issues attached per motion and not all motions or appeals will result in a hearing. Approximately 214,597 issues were captured at the first and second levels during CY 2012, reflecting a slight increase from CY 2011. CY 2012 First level ICON filings, inclusive of .522/.52 filings and appeals to BWC orders, totaled 65,833 while Second Level and above filings, inclusive of appeals to District Hearing Officer (DHO) and Staff Hearing Officer (SHO) orders, totaled 65,572. The docket type distribution of DHO and SHO motion and appeal filings is as follows:
Commission level appeals and reconsiderations filed totaled 24,812 and 749, respectively for CY 2012.
ISSUES CAPTURED ‐ 2012 VOLUME PER DOCKET TYPE PERCENT OF TOTAL*
DHO ALLOWANCE 122,469 57%
DHO C‐92 26,728 12%
SHO APPEAL 55,376 26%
SHO PTD 1,907 1%
SHO RECON 5,924 3%
SHO VSSR 598 <1%
SHO MISC 1,595 1%
*Percentages are rounded
INVENTORY

Page | 2 Production Activity 2012
Average Ending Inventory – 2012 Statewide average monthly DHO and SHO inventory was 22,943 claims for CY 2012. Regional breakdown of average inventories for CY 2012 is as follows: Columbus – 29%; Cleveland – 27%; Cincinnati – 20%; Akron – 15%; Toledo – 9%.
Hearing Inventory – 2012 As of December 2012, the IC maintained a pre‐hearing inventory of 14,975 claims at DHO and SHO levels accounting for 72 percent of total ending inventory. The remainder of the inventory constitutes post‐hearing claims awaiting an order or under appeal status. Additional claims on hand outside of normal hearing processes are not included in the ending and average inventory figures.
Regional DHO and SHO inventory levels presented above are exclusive of medical inventory.
2,5333,300
4,315
4,548
1,582
867
1,3421,907
2,025
523
0
2,500
5,000
7,500
AKR CIN CLE COL TOL
AVERAGE INVENTORY ‐ 2012
DHO SHO
2,168
3,012
4,228 4,179
1,388
3,013
4,245
5,705 5,962
1,935
0
3,000
6,000
9,000
AKR CIN CLE COL TOL
PRE‐HEARING ‐vs‐ ENDING INVENTORY : DECEMBER 2012
PRE‐HEARING ENDING
INVENTORY

Page | 3 Production Activity 2012
Medical Exam Inventory – 2012 The volume of claims within the IC medical section as of December 31, 2012, was 558, accounting for approximately three percent of total inventory.
The majority of these claims (99 percent) are processed for PTD related specialist claims. The remaining claims are referred for an exam or medical review of non‐PTD related issues. PTD medical exams are performed in all statewide regions with the initial scheduling process centralized in the Columbus office. As of December 31, 2012, statewide inventory totaled 21,418 claims at all adjudicatory levels (including medical claims). The volumes of claims being processed for Commission venue hearings (556), in the Court Unit (6,144), and for Attorney Fees (18), are not counted in DHO and SHO inventory figures.
53
86
135
229
55
0
75
150
225
300
AKR CIN CLE COL TOL
MEDICAL EXAM INVENTORY ‐ 2012
INVENTORY

��������� �������������������� �HEARING ACTIVITY
Industrial Commission
Page | 4 Production Activity 2012
99
223
173
1
0
75
150
225
300
APPEALS RECONSIDERATIONS
COMMISSION LEVEL CLAIMS HEARD
Commission Deputy
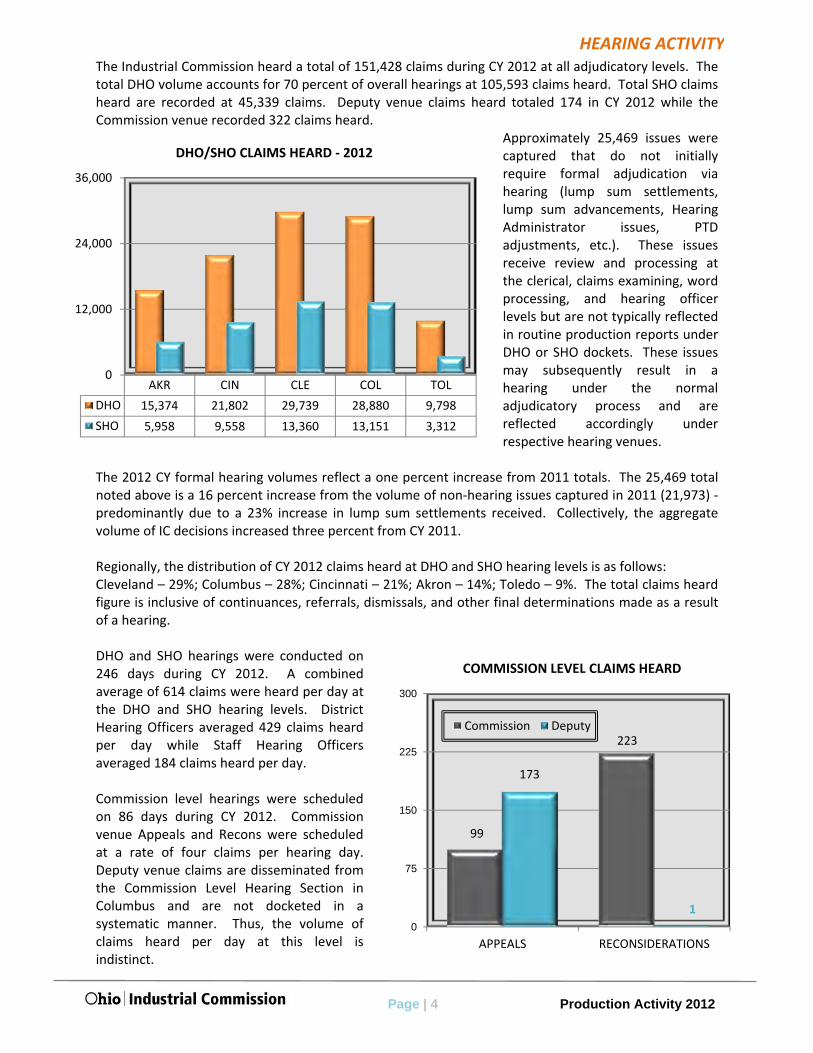
The Industrial Commission heard a total of 151,428 claims during CY 2012 at all adjudicatory levels. The total DHO volume accounts for 70 percent of overall hearings at 105,593 claims heard. Total SHO claims heard are recorded at 45,339 claims. Deputy venue claims heard totaled 174 in CY 2012 while the Commission venue recorded 322 claims heard.
Approximately 25,469 issues were captured that do not initially require formal adjudication via hearing (lump sum settlements, lump sum advancements, Hearing Administrator issues, PTD adjustments, etc.). These issues receive review and processing at the clerical, claims examining, word processing, and hearing officer levels but are not typically reflected in routine production reports under DHO or SHO dockets. These issues may subsequently result in a hearing under the normal adjudicatory process and are reflected accordingly under respective hearing venues.
The 2012 CY formal hearing volumes reflect a one percent increase from 2011 totals. The 25,469 total noted above is a 16 percent increase from the volume of non‐hearing issues captured in 2011 (21,973) ‐predominantly due to a 23% increase in lump sum settlements received. Collectively, the aggregate volume of IC decisions increased three percent from CY 2011. Regionally, the distribution of CY 2012 claims heard at DHO and SHO hearing levels is as follows: Cleveland – 29%; Columbus – 28%; Cincinnati – 21%; Akron – 14%; Toledo – 9%. The total claims heard figure is inclusive of continuances, referrals, dismissals, and other final determinations made as a result of a hearing. DHO and SHO hearings were conducted on 246 days during CY 2012. A combined average of 614 claims were heard per day at the DHO and SHO hearing levels. District Hearing Officers averaged 429 claims heard per day while Staff Hearing Officers averaged 184 claims heard per day. Commission level hearings were scheduled on 86 days during CY 2012. Commission venue Appeals and Recons were scheduled at a rate of four claims per hearing day. Deputy venue claims are disseminated from the Commission Level Hearing Section in Columbus and are not docketed in a systematic manner. Thus, the volume of claims heard per day at this level is indistinct.
AKR CIN CLE COL TOL
DHO 15,374 21,802 29,739 28,880 9,798
SHO 5,958 9,558 13,360 13,151 3,312
0
12,000
24,000
36,000
DHO/SHO CLAIMS HEARD ‐ 2012
HEARING ACTIVITY

Page | 5 Production Activity 2012
Claims Heard by Docket Type
AKRON CINCINNATI CLEVELAND COLUMBUS TOLEDO TOTAL
DHO Allowance 10,962 17,436 21,694 22,908 7,752 80,752 DHO C‐92 4,412 4,366 8,045 5,972 2,046 24,841
SHO Appeal 4,554 8,275 11,018 10,452 2,764 37,063 SHO Recon 1,045 794 1,727 1,649 282 5,497 SHO Misc. 127 105 210 212 74 728 SHO VSSR 21 22 47 34 9 133 SHO PTD* 211 362 358 804 183 1,918
Deputy 14 14 43 93 10 174 Commission ‐ ‐ ‐ 322 ‐ 322
Total 21,346 31,372 43,139 42,441 13,119 151,428*PTD includes Heard With claims
DHO Allowance claims heard account for 53 percent of the statewide total, while DHO C‐92 claims account for 16 percent. SHO dockets are accounted for as follows: Appeals – 24 percent; Reconsiderations – 4 percent; PTD – 1 percent; and Miscellaneous and VSSR both less than 1 percent. Deputy and Commission venue hearings account for less than 1 percent of the statewide total. Risk Type Analysis During CY 2012, 26 percent of all claims heard were for self‐insuring (SI) risks while 74 percent were for non‐SI risks. Statewide, quarterly ratios remained relatively steady throughout the year with slight variations by region.
Hearings Held By Employer Group
DOCKET TYPE State Fund Self‐Insured Pol. Sub (County) State Total
DHO Allowance 47,615 20,097 9,684 3,355 80,751 DHO C‐92 12,838 6,148 4,472 1,383 24,841
SHO Appeal 20,913 9,956 4,419 1,775 37,063 SHO Reconsideration 2,576 1,800 825 296 5,497 SHO Miscellaneous 421 213 67 27 728 SHO VSSR 110 18 3 2 133 SHO PTD 841 180 141 62 1,224
Deputy 78 84 9 3 174 Commission 143 127 29 12 311
Total 85,535 38,623 19,649 6,915 150,722
Hearings were conducted for approximately 26,827 different risks during CY 2012. Hearings for claims of private state funded employers accounted for 57 percent of all hearings while self‐insuring employers accounted for 26 percent; public county employers accounted for 13 percent; and public state employers’ claims accounted for 5 percent.
74% 74% 75% 74%
26% 26% 25% 26%
0%
50%
100%
1st Qtr 2nd Qtr 3rd Qtr 4th Qtr
PERCENTAGE ANALYSIS OF RISK TYPE
NON ‐ SI SI
HEARING ACTIVITY

Page | 6 Production Activity 2012
148
406
801 838
103
0
400
800
1,200
AKR CIN CLE COL TOL
HEARINGS HELD REQUIRING INTERPRETERS ‐ 2012
51 42 38
140
31
0
75
150
225
AKR CIN CLE COL TOL
EMERGENCY HEARINGS SCHEDULED ‐ 2012
A total of 2,296 hearing records were flagged as requiring interpreter services during CY 2012 marking a six percent increase from CY 2011. Note: An interpreter may not have been present at each hearing.
A total of 302 emergency hearings were scheduled during CY 2012. Emergency hearings are scheduled based on designated docket types per IC rule, circumstantial requests by the respective parties of a claim, or other justifiable reasons.
Permanent Total Disability Decisions Permanent Total Disability (PTD) filings for CY 2012, at 1,843, declined 10% compared to 2,042 filings in CY 2011. Of those PTD applications that were either granted or denied during CY 2012, 68% were rendered PTD grants versus 32% PTD denials. Regionally, grant/deny ratios were as follows: Akron: 65% ‐ 35%; Cincinnati: 72% ‐ 28%; Cleveland: 77% ‐ 23%; Columbus: 60% ‐ 40%; Toledo: 76% ‐ 24%. Given processing times for PTD applications, there is not always a direct correlation between motion filing and decisions rendered within the same calendar year. Additionally, some PTD applications are withdrawn, dismissed, or otherwise disposed. These totals are not reflected in this report.
896
420
1,843
0
800
1,600
2,400
Grant Deny Motions Filed
PTD DECISIONS AND FILINGS ‐ 2012
113 140
232
312
99
60 55 70
204
31
0
150
300
450
AKR CIN CLE COL TOL
PTD DECISIONS ‐ 2012
Grant Deny
HEARING ACTIVITY

Page | 7 Production Activity 2012
1,157
1,976 1,735 1,799
1,143
2,020
1,170
5,583
3,906
1,188
0
2,400
4,800
7,200
AKR CIN CLE COL TOL
CONTINUANCES GRANTEDMUTUALLY vs. NOT MUTUALLY AGREED
Mutual Not Mutual
Continuances Statewide, the average continuance rate prior to hearing (for all issues) decreased by one point to 14 percent while the average continuance rate at hearing (for all issues) remained at 5 percent, compared to CY 2011. Continuances granted prior to hearing for all issues totaled 21,683 during CY 2012 while continuances granted at hearing totaled 7,359. The Toledo region maintained the highest rate for continuances prior to hearing at 18 percent. The Cincinnati and Cleveland regions maintained the highest rate for continuances at hearing registering 6 percent each.
Continuances impact inventory backlogs, docketing, and time frames. Mutually agreed continuances prior to hearing are not eligible for time frame consideration. Continuances prior to hearing that are not mutually agreed may remain eligible if the time frames are not waived by the parties at some other point and the issue reaches a subsequent hearing.
3,177 3,146
7,324
5,705
2,331
738
1,851
2,581
1,678
511
0
2,500
5,000
7,500
10,000
AKR CIN CLE COL TOL
CONTINUANCES GRANTEDPRIOR TO vs. AT HEARING
Prior To At
HEARING ACTIVITY

Page | 8 Production Activity 2012
7,0236,890
11,664 11,383
4,647
0
4,000
8,000
12,000
16,000
AKR CIN CLE COL TOL
HEARING ADMINISTRATOR ACTIVITY
Hearing Administrator Decisions IC Hearing Administrators perform a variety of functions that facilitate the adjudication process. In addition to processing approximately 24,271 continuance requests during CY 2012, they also processed 12,257 requests to withdraw motions or appeals and cancel scheduled hearings. Additionally, Hearing Administrators made decisions and performed activities in the below categories during CY 2012:
Hearing Administrator Decisions AKRON CINCINNATI CLEVELAND COLUMBUS TOLEDO
PTD
ISSUE PTD LETTERS 192 195 260 489 145
PRE‐HEARING CONFERENCES 22 17 83 79 3
SUBPOENA REQUESTS
GRANT 120 110 255 71 49
DENY 30 23 20 41 19
INTERROGATORIES / DEPOSITIONS
GRANT 4 3 3 1 1
HEARING 1 1 3 10 0
SUSPENSION REQUESTS
GRANT 209 312 266 282 166
DENY 72 98 192 180 62
.522/.52 REQUESTS GRANT 42 52 24 118 13
SET FOR HEARING 85 59 165 89 44
Hearing Administrators also processed requests for extensions related to PTD filings and requests regarding other miscellaneous issues that are not presented above. Statewide, Hearing Administrators made decisions on, or referred to hearing, approximately 41,607 issues during CY 2012. Regional volumes of Hearing Administrator activity are presented in the graph below. Regionally, Akron and Cincinnati each accounted for 17 percent of all Hearing Administrator activity during CY 2012; Cleveland accounted for 28 percent; Columbus accounted for 27 percent; and Toledo accounted for 11 percent.
HEARING ACTIVITY

��������� �������������������� �MEDICAL ACTIVITY
Industrial Commission

Page | 9 Production Activity 2012
AKR CIN CLE COL DAY TOL YOU
OS 1 3 6 136 0 1 1
IH 0 9 69 120 57 29 53
OT 301 192 261 776 105 215 225
SPECIALIST EXAMS PERFORMED ‐ 2012
OT IH OS
Specialist Exams Performed A total of 2,560 specialist exams (including medical reviews) were performed on behalf of the Industrial Commission during CY 2012. The majority of these exams (99%) are related to PTD filings. Scheduling of exams for Injured Workers residing out‐of‐state (OS) is performed through the Columbus office. The Akron region does not conduct in‐house (IH) exams. Initiatives were implemented in CY 2009 to schedule more out‐of‐house (OT) exams and distribute the exams more equitably amongst IC certified physicians. The Columbus office performed 40% of total exams with 1,032 exams attributed to the region. The Cleveland office accounts for 13%; Akron accounts for 12%; Youngstown accounts for 11%; Toledo accounts for 10%; Cincinnati accounts for 8%; and Dayton accounts for 6%. Approximately 87 percent of all specialist exams and medical reviews were conducted outside of IC facilities during CY 2012.
13%
81%
6%
2012 EXAMS
IH OT OS
1,150
750
350
MEDICAL ACTIVITY

Page | 10 Production Activity 2012
PSYCH, 36%
OCCMD, 31%
PMR, 18%
ORTH, 10%
OTHER, 5%
SPECIALIST EXAMS ‐ 2012
For medical specialist exams scheduled during CY 2012, PSYCH specialists account for the largest portion at 36% (1,107 exams). This is followed by OCCMD specialists exams at 31%; PMR specialists exams at 18%; ORTH specialists exams at 10%; and OTHER specialist types at 5%. Cancellation Rates A total of 3,059 exams were scheduled during CY 2012 – 499 of these exams were rescheduled, canceled, or the injured worker did not show for the exam. The CY 2012 statewide exam cancellation rate (cancel, no show, reschedule) at 17%, increased by two percentage points from CY 2011.
IC INDEPENDENT MEDICAL EXAMINATIONS
District Performed Canceled Rescheduled No Shows Scheduled Cancelation Rate
AKR 302 12 31 11 356 15%
CIN 204 21 19 5 249 18%
CLE 336 27 20 13 396 15%
COL 1,032 64 90 39 1,225 16%
DAY 162 7 16 4 189 14%
TOL 245 12 31 16 304 19%
YOU 279 26 24 11 340 18%
Statewide 2,560 169 231 99 3,059 17%
MEDICAL ACTIVITY
��������� �����������������������PERFORMANCE
Industrial Commission

Page | 11 Production Activity 2012
41 3936
41 37
0
20
40
60
AKR CIN CLE COL TOL
DHO FILING TO MAILING*
* IC Benchmark = 38 days
* Benchmark = 52 days
* F‐R statute = 7 days* F‐H statute = 45 days * H‐M statute = 7 days
DAYS
District Hearing Officer Time Frames District hearing officers heard a total of 80,752 Allowance docket claims during CY 2012. Of those, 68,502 qualified for inclusion in time studies. On average, all IC offices performed within the statutory and benchmark limits set forth in HB107 and HB413. The IC benchmark is set at 38 days. This performance measure is based on the difference between the two statutory periods Filing to Hearing and Filing to Receipt (45 – 7).
Non‐Compliant Claims HB413 dictates that an appeal or motion to a DHO must be heard within a 45‐day period. This is inclusive of the statutory 7‐day period the BWC has to forward the claim data to the IC. Of the qualifying 2012 Allowance claims heard, 9,755 claims, or 14.2%, were beyond the statutory 45‐day Filing Date to Hearing Date time frame. This reflects a 10% increase in the volume of non‐compliant claims with a regression of approximately one percentage point in the rate of non‐compliance compared to 2011 performance. For CY 2012 there were 5,999 Allowance claims heard, or 8.8%, that were beyond the 38‐day Receipt Date to Hearing Date benchmark reflecting IC performance.
DHO ALLOWANCE MEDIAN DAYS
2012 F‐R* R‐H F‐H* H‐M* R‐M F‐M
1ST QTR 1 40 42 2 43 44
2ND QTR 1 36 39 3 39 42
3RD QTR 1 28 30 3 33 35
4TH QTR 1 28 31 4 33 35
AVG 1 33 36 3 37 39
68,502
9,755
0
30,000
60,000
90,000
QUALIFYING F‐H > 45 DAYS
DHO FILING TO HEARING ‐ 2012
PERFORMANCE
Page | 12 Production Activity 2012
* F‐H statute = 45 days* H‐M statute = 7 days
* Benchmark = 52 days
38 3936
4037
0
20
40
60
AKR CIN CLE COL TOL
SHO APPEAL FILING TO MAILING*DAYS
193
162
203 177 188
0
120
240
360
AKR CIN CLE COL TOL
PTD FILING TO MAILINGDAYS
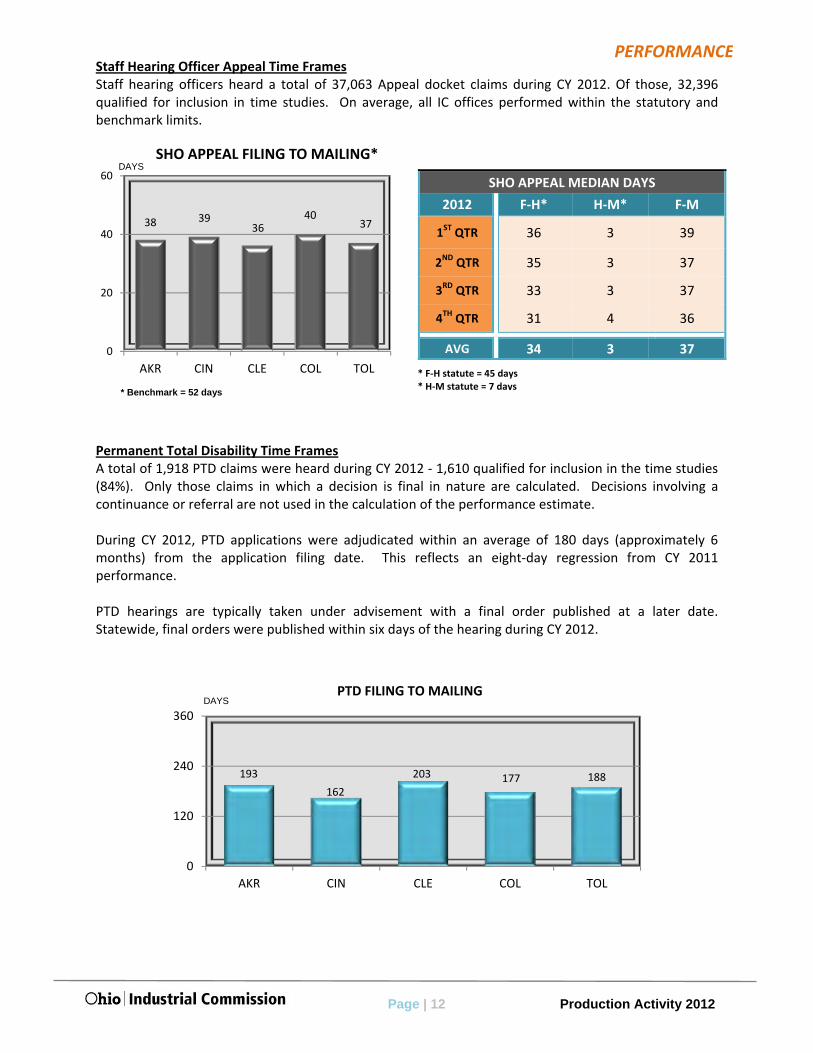
Staff Hearing Officer Appeal Time Frames Staff hearing officers heard a total of 37,063 Appeal docket claims during CY 2012. Of those, 32,396 qualified for inclusion in time studies. On average, all IC offices performed within the statutory and benchmark limits.
Permanent Total Disability Time Frames A total of 1,918 PTD claims were heard during CY 2012 ‐ 1,610 qualified for inclusion in the time studies (84%). Only those claims in which a decision is final in nature are calculated. Decisions involving a continuance or referral are not used in the calculation of the performance estimate. During CY 2012, PTD applications were adjudicated within an average of 180 days (approximately 6 months) from the application filing date. This reflects an eight‐day regression from CY 2011 performance. PTD hearings are typically taken under advisement with a final order published at a later date. Statewide, final orders were published within six days of the hearing during CY 2012.
SHO APPEAL MEDIAN DAYS
2012 F‐H* H‐M* F‐M
1ST QTR 36 3 39
2ND QTR 35 3 37
3RD QTR 33 3 37
4TH QTR 31 4 36
AVG 34 3 37
PERFORMANCE

Page | 13 Production Activity 2012
51
64
4135
0
40
80
120
F‐H H‐M
COMMISSION ACTIVITY
COMMISSION DEPUTY
DAYS
7
6 6 6
0
4
8
12
16
1st QTR 2nd QTR 3rd QTR 4th QTR
SHO APPEAL ORDER EXPIRATION TO REFUSAL ORDERDAYS
SHO Refusal Order Time Frames Appeals to SHO orders are discretionary in nature and processed centrally by the Commission Level
Hearing Section in Columbus. Per mandate, if an appeal is refused, it is to receive a refusal order within
14 days of the expiration date for which an appeal may be filed to an SHO order.
Commission Level Time Frames For hearings conducted during CY 2012, the combined venue average for the period Filing of Appeal to Hearing Date (F‐H) is compliant at 44 days. This is a three‐day improvement from the CY 2011 average of 47 days. The combined venue average for the period Hearing to Mailing Date (H‐M) is 44 days. This is a regression of one day from the CY 2011 average of 43 days. The combined venue average for the Filing of Appeal to Mailing of Order time frame is 89 days, a two‐day improvement from the CY 2011 rate.
PERFORMANCE

Page | 14 Production Activity 2012
1,346
2,265
(231)
(855)(1,400)
0
1,400
2,800
4,200
1st QTR 2nd QTR 3rd QTR 4th QTR
HEARING SPIKE QUARTERLY ANALYSIS ‐ 2012
Hearing Spike Analysis The Hearing Spike Analysis is compiled in conformance with HB413 and IC Resolution R12‐1‐03. Per this directive, a hearing spike occurs when the volume of claims ready for hearing at the end of any given month exceeds the maximum number of DHO and SHO claims heard by fifteen percent in any of the preceding twelve calendar months. A hearing spike occurred during the second quarter of CY 2012 under then effective IC Resolution R96‐1‐05. The spike condition was reconciled by month‐end June 2012. IC Resolution R12‐1‐03 was subsequently put into effect August 9, 2012. The diagram shown below presents three key elements: BASELINE MARKER
red line
This floor represents the
preceding twelve‐month
maximum heard total
(per the statute) at the
end of each respective
quarter
SPIKE MARKER
orange circles
Represents the volume of
claims above the
maximum heard total
that would trigger a
hearing spike at the end
of each quarter
INVENTORY MARKER
blue bars
Represents the actual volume of claims ready for hearing that were above or below the 12‐
month maximum heard total at the end of the respective quarter
The volume for Claims Ready for Hearing at the end of CY 2012 was 13,263 claims. This is 855 claims (6
percent) below the maximum heard total and 2,973 claims below the volume that would result in a
hearing spike.
IC Resolution R96-1-05 effective
IC Resolution R12-1-03 effective
PERFORMANCE
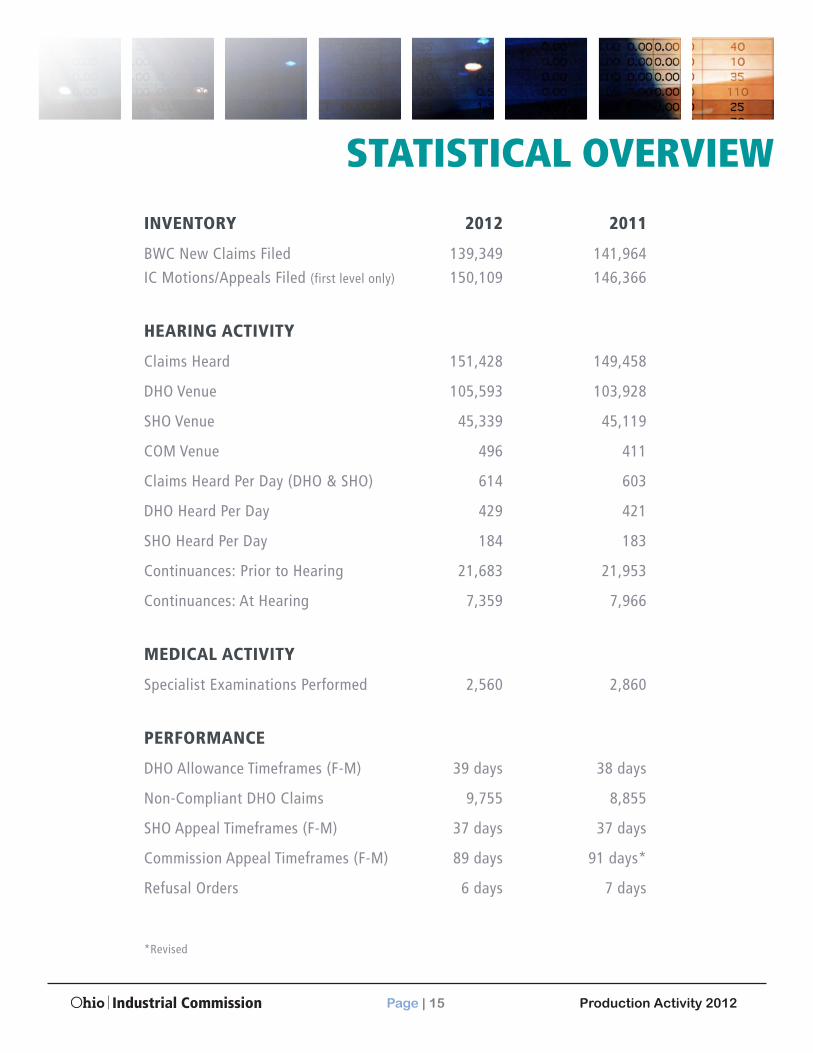
INVENTORY 2012 2011
BWC New Claims Filed 139,349 141,964
IC Motions/Appeals Filed (first level only) 150,109 146,366
HEARING ACTIVITY
Claims Heard 151,428 149,458
DHO Venue 105,593 103,928
SHO Venue 45,339 45,119
COM Venue 496 411
Claims Heard Per Day (DHO & SHO) 614 603
DHO Heard Per Day 429 421
SHO Heard Per Day 184 183
Continuances: Prior to Hearing 21,683 21,953
Continuances: At Hearing 7,359 7,966
MEDICAL ACTIVITY
Specialist Examinations Performed 2,560 2,860
PERFORMANCE
DHO Allowance Timeframes (F-M) 39 days 38 days
Non-Compliant DHO Claims 9,755 8,855
SHO Appeal Timeframes (F-M) 37 days 37 days
Commission Appeal Timeframes (F-M) 89 days 91 days*
Refusal Orders 6 days 7 days
*Revised
STATISTICAL OVERVIEW
Industrial Commission Production Activity 2012Page | 15

COMMISSION ADMINISTRATION
Jodie M. Taylor Chairperson, Industrial Commission
Gary M. DiCeglio Member, Industrial Commission
Karen L. Gillmor, Ph.D Member, Industrial Commission
Tom Connor Executive Director
Gerry Waterman Legal Counsel
Michael Tanner Director of Security Services
Kerry Mackin Hearing Officer Trainer
NON-ADJUDICATORY OPERATIONS
Jacob Bell Manager, Legislative Services
Brian Kelly Manager, Fiscal Management
Scott Greene Manager, Management Planning
Adam Gibbs Manager, Communications
Nilima Sinha Manager, Information Technology
John Tornes Manager, Human Resources
Wanda Mullins Manager, Medical Services
Mike Feeney Manager, Operations Support
Jim Goodrich Manager, Customer and Staff Resources
REGIONAL OFFICES
Debra Lynch Manager, Akron Region
Carma Callender Manager, Cincinnati Region
Gregory Gibbons Manager, Cleveland Region
Felicity Hillmer Manager, Columbus Region
Scott Hines Manager, Toledo Region
Landi Jackson-Forbes Manager, Commission Level Hearings
John Matthews Director of Claims Support
DISTRIBUTION LIST
John R. Kasich, >�"�!��!
Jodie M. Taylor �?�!��! ��
Gary M. DiCeglio,����@�!
Karen L. Gillmor, Ph.D., ���@�!
Industrial Commission