professional paper sj2001-pp3 projected 2020...
TRANSCRIPT

Professional Paper SJ2001-PP3
PROJECTED 2020 AQUIFER DRAWDOWNSAT THE CITY OF VERO BEACH AND
INDIAN RIVER COUNTY WELLFIELDS
by
David Toth, Ph.D., P.G.
Davi{pf. TothProfessional Geologist
License No. PG110•„ August 17,2001
St. Johns River Water Management DistrictPalatka, Florida
2001
Northwest FloridaWater Management
District SuwanneeRiver WaterManagement
DistrictSt. Johns
River Wateranagement
District ;
SouthwestloridaWater
ManagementDistrict
SouthFlorida WaterManagement
District
The St. Johns River Water Management District (SJRWMD) was created by the Florida Legislature in 1972to be one of five water management districts in Florida. It includes all or part of 19 counties in northeastFlorida. The mission of SJRWMD is to manage water resources to ensure their continued availability whilemaximizing environmental and economic benefits. SJRWMD accomplishes its mission through regulation;applied research; assistance to federal, state, and local governments; operation and maintenance of watercontrol works; and land acquisition and management.
This document is published to disseminate information collected by SJRWMD in pursuit of its mission.Copies of this document can be obtained from:
LibrarySt. Johns River Water Management District
P.O. Box 1429Palatka, FL 32178-1429
Phone: (386) 329-4132
Professional Paper SJ2001-PP3
Projected 2020 Aquifer Drawdownsat the City of Vero Beach and
Indian River County Wellf ields
by
David Toth, Ph.D., P.G.
St. Johns River Water Management District, Palatka, Florida
ABSTRACT
This paper supports a water supply assessment performed by the St. Johns River Water ManagementDistrict pursuant to the requirements of Subparagraph 373.036(2)(b)4, Florida Statutes. An analyticalmodel, MLTLAY, was used to simulate changes in the potentiometric surfaces of the surficial aquifersystem (SAS) and the Floridan aquifer system (FAS), based on 2010, 2015, and 2020 projected pumpagesat the city of Vero Beach and Indian River County wellfields. The MLTLAY model calculates drawdownsin a multilayered, leaky-artesian aquifer system. The model assumes homogeneous, isotropic, and steady-state conditions. Simulated drawdowns for 1995 pumpage at the wells ranged from 2.68 to 27.03 feet (ft)for SAS and from 4.81 to 10.55 ft for FAS. Simulated drawdowns for 2020 pumpage ranged from 10.71 to39.79 ft for SAS and from 19.08 to 28.95 ft for FAS. The simulated drawdowns for projected pumpages atthese wellfields have a pronounced effect on the elevation of the potentiometric surfaces of SAS and FAS.Maximum projected 2020 drawdown (39.79 ft) in SAS comprises 50-80% of the production zonethickness. Such a decrease in water levels in SAS will reduce the natural discharge of SAS to the ocean.The 2010, 2015, and 2020 drawdowns in FAS at the southern model boundary are in excess of 13,15, and20 ft, respectively. This suggests that Floridan aquifer wells will cease to flow at the Indian River/St Luciecounty border as early as 2015. There are no significant wetland concerns at the city of Vero Beach andIndian River County wellfields because most of the vegetation at land surface is not expected to beadversely impacted by projected water level declines in SAS. The area is highly urbanized. Thevegetation consists of sand-pine scrub on the ridge area that grades into pine flatwoods interspersed withwet prairie.
INTRODUCTION
The St. Johns River Water ManagementDistrict (SJRWMD) performs water supplyassessments pursuant to the requirementsof Subparagraph 373.036(2)(b)4, FloridaStatutes (FS). As part of this assessmentprocess, SJRWMD identifies priority waterresource caution areas, which are areaswhere existing and reasonably anticipatedsources of water and water conservationefforts are not adequate to supply water for
all existing legal uses and reasonablyanticipated future needs and to sustain thewater resources and related natural systemsduring a 20-year planning horizon.Regional numerical groundwater modelsand local analytical groundwater modelsare used as part of this overall assessment.
The purpose of this paper is twofold:(1) to use geohydrologic data collected sinceToth 1994 to better refine the groundwatermodel of the city of Vero Beach and Indian
River County wellfields and (2) to providean analysis' of the projected 2010,2015, and2020 pumping impacts to the surficialaquifer system and the Upper Floridanaquifer as a result of projected groundwaterwithdrawals from these wellfields.
Toth 1994 indicated a need to acquirebetter information on the transmissivity ofthe Upper Floridan aquifer in the area ofIndian River County's north reverseosmosis (RO) plant and on the leakance ofthe upper confining unit in that area.Because of this need, Missimer International(1996) conducted an aquifer performancetest in the area of Indian River County'snorth RO plant.
The South Florida Water ManagementDistrict (SFWMD) established a Floridanaquifer protection criterion for the upperEast Coast Planning Area, which bordersIndian River County to the south andincludes all of St. Lucie County. Thecriterion states "groundwater leveldrawdowns induced by water usewithdrawals should not cause water levelsin the Floridan aquifer to fall below landsurface any time during a 12-monthdrought condition that occurs as frequentlyas once every 10 years" (SFWMD 1998).SFWMD is concerned about verticalsaltwater intrusion, or upconing, and wantsto minimize it by restricting drawdowns toland surface elevation.
WATER USE
The city of Vero Beach withdraws waterfrom both the surficial aquifer system andthe Floridan aquifer system. Indian RiverCounty withdraws water only from theFloridan aquifer system. In 1995, the city ofVero Beach withdrew a total of 6.91 milliongallons per day (mgd) (Ten Eyck 1997a) and
'This analysis is based on water use projectionsmade in 1997 and 1998.
plans to withdraw 7.65 mgd in 2010,8.18 mgd in 2015, and 8.73 mgd in 2020 (TenEyck 1997b, 1997c). In 1995, Indian RiverCounty withdrew 3.73 mgd from wells atthe south RO plant and at the North Beachplant (Florence 1997). From its north ROplant, Indian River County plans towithdraw 5.75 mgd in 2010, 7.44 mgd in2015, and 8.88 mgd in 2020. At its south ROplant, Indian River County plans towithdraw 7.26 mgd in 2010, 8.76 mgd in2015, and 10.20 mgd in 2020 (McCain 1998).Indian River County closed and abandonedits North Beach plant in December 1997.
The water demand projections for 2010,2015, and 2020 for the city of Vero Beachand Indian River County are based onpopulation projections and average daywater demand projections, respectively.They are consistent with projections inVergara 1998.
City of Vero Beach and Indian RiverCounty Wellfields
In 1995, the city of Vero Beach withdrewwater from 25 surficial aquifer system wellsand six Upper Floridan aquifer wells at itswellfield (Figure 1). Pumpage for each wellwas based on metered water use reportedby the city (Ten Eyck 1997a). The totalmetered water use for 1995 was 6.91 mgd.
The number of wells in the city of VeroBeach wellfield is not expected to change bythe year 2020. The 2010,2015, and 2020individual well pumpages were obtainedfrom Ten Eyck (1997b, 1997c).
The 2010,2015, and 2020 individual wellpumpages from the surficial aquifer wereestimated to range from 100 to 600 gallonsper minute (gpm). The 2010, 2015, and 2020projected pumpages from the three UpperFloridan aquifer wells are estimated torange between 542 and 549 gpm. Projected2010,2015, and 2020 individual well

Approximate scale in miles
INDIAN RIVER COUNTY680000 690000
STATE PLANE COORDINATES
Figure 1. Model area for Vero Beach andIndian River County wellfields
Legend
. Well
Model domain
_. .. County boundaiy
Road
Water body
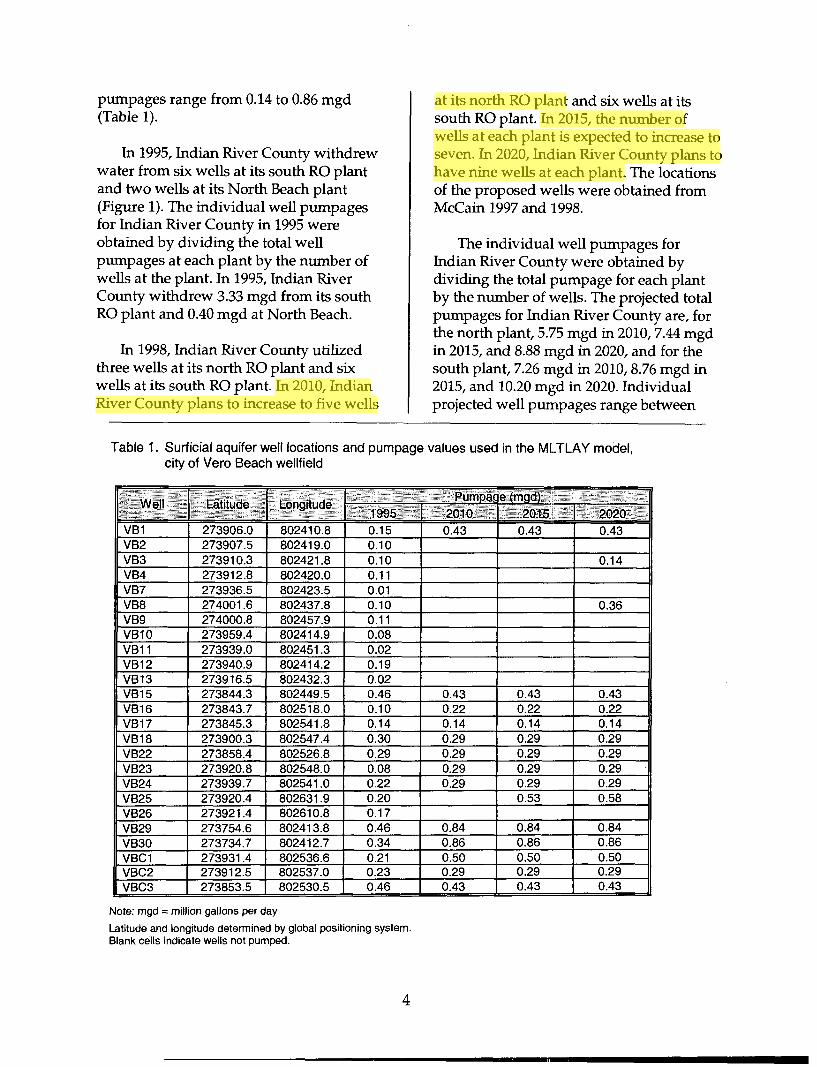
pumpages range from 0.14 to 0.86 mgd(Table 1).
In 1995, Indian River County withdrewwater from six wells at its south RO plantand two wells at its North Beach plant(Figure 1). The individual well pumpagesfor Indian River County in 1995 wereobtained by dividing the total wellpumpages at each plant by the number ofwells at the plant. In 1995, Indian RiverCounty withdrew 3.33 mgd from its southRO plant and 0.40 mgd at North Beach.
In 1998, Indian River County utilizedthree wells at its north RO plant and sixwells at its south RO plant. In 2010, IndianRiver County plans to increase to five wells
at its north RO plant and six wells at itssouth RO plant. In 2015, the number ofwells at each plant is expected to increase toseven. In 2020, Indian River County plans tohave nine wells at each plant. The locationsof the proposed wells were obtained fromMcCain 1997 and 1998.
The individual well pumpages forIndian River County were obtained bydividing the total pumpage for each plantby the number of wells. The projected totalpumpages for Indian River County are, forthe north plant, 5.75 mgd in 2010, 7.44 mgdin 2015, and 8.88 mgd in 2020, and for thesouth plant, 7.26 mgd in 2010,8.76 mgd in2015, and 10.20 mgd in 2020. Individualprojected well pumpages range between
Table 1. Surficial aquifer well locations and pumpage values used in the MLTLAY model,city of Vero Beach wellfield
Well
VB1VB2VB3VB4VB7VB8VB9VB10VB11VB12VB13VB15VB16VB17VB18VB22VB23VB24VB25VB26VB29VB30VBC1VBC2VBC3
Latitude
273906.0273907.5273910.3273912.8273936.5274001 .6274000.8273959.4273939.0273940.9273916.5273844.3273843.7273845.3273900.3273858.4273920.8273939.7273920.4273921 .4273754.6273734.7273931 .4273912.5273853.5
Longitude
802410.8802419.0802421.8802420.0802423.5802437.8802457.9802414.9802451 .3802414.2802432.3802449.5802518.0802541 .8802547.4802526.8802548.0802541 .0802631 .9802610.8802413.8802412.7802536.6802537.0802530.5
Pumpac
19950.150.100.100.110.010.100.110.080.020.190.020.460.100.140.300.290.080.220.200.170.460.340.210.230.46
20100.43
0.430.220.140.290.290.290.29
0.840.860.500.290.43
e (mgd)
2015:0.43
0.430.220.140.290.290.290.290.53
0.840.860.500.290.43
2020 :0.43
0.14
0.36
0.430.220.140.290.290.290.290.58
0.840.860.500.290.43
Note: mgd = million gallons per day
Latitude and longitude determined by global positioning system.Blank cells indicate wells not pumped.
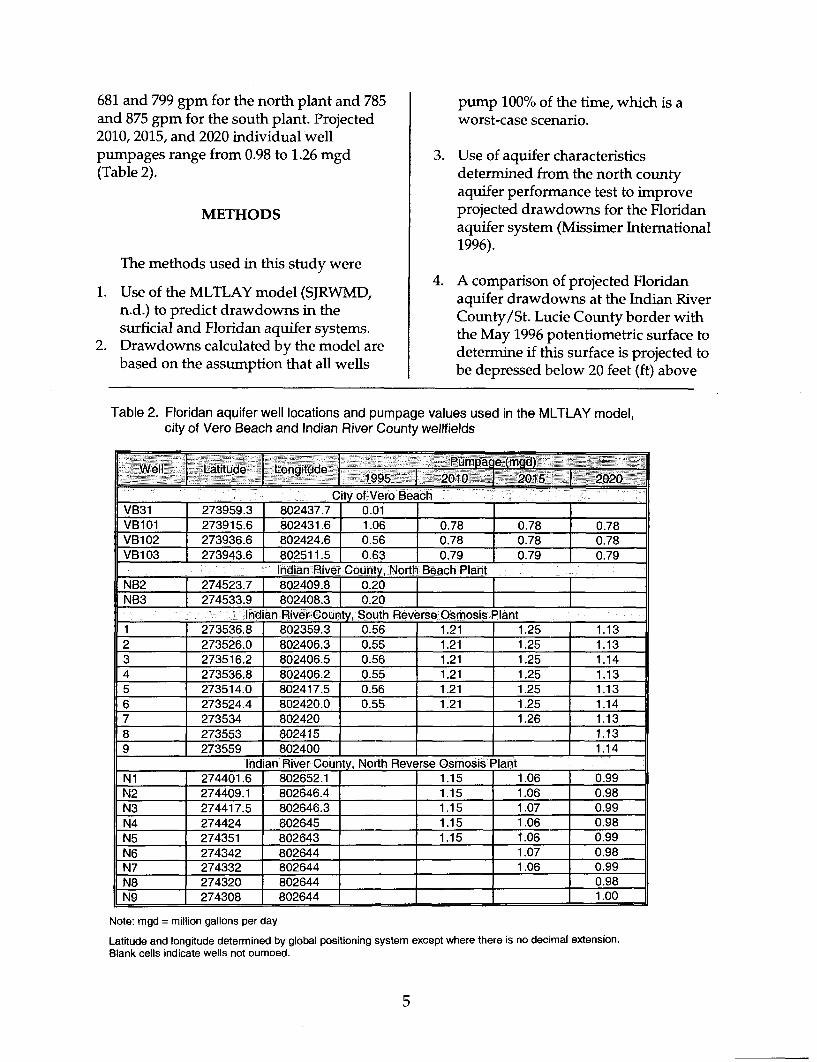
681 and 799 gpm for the north plant and 785and 875 gpm for the south plant. Projected2010, 2015, and 2020 individual wellpumpages range from 0.98 to 1.26 mgd(Table 2).
METHODS
The methods used in this study were
1. Use of the MLTLAY model (SJRWMD,n.d.) to predict drawdowns in thesurficial and Floridan aquifer systems.
2. Drawdowns calculated by the model arebased on the assumption that all wells
pump 100% of the time, which is aworst-case scenario.
3. Use of aquifer characteristicsdetermined from the north countyaquifer performance test to improveprojected drawdowns for the Floridanaquifer system (Missimer International1996).
4. A comparison of projected Floridanaquifer drawdowns at the Indian RiverCounty/St. Lucie County border withthe May 1996 potentiometric surface todetermine if this surface is projected tobe depressed below 20 feet (ft) above
Table 2. Floridan aquifer well locations and pumpage values used in the MLTLAY model,city of Vero Beach and Indian River County wellfields
Well Latitude LongitudePumpage (mgd) '
1995 2010 | 2015City of Vero Beach
VB31VB101VB102VB103
273959.3273915.6273936.6273943.6
802437.7802431 .6802424.680251 1 .5
0.011.060.560.63
0.780.780.79
0.780.780.79
2020
0.780.780.79
Indian River County, North Beach PlantNB2NB3
274523.7274533.9
802409.8802408.3
0.200.20
Indian River County, South Reverse Osmosis Plant123456789
273536.8273526.0273516.2273536.8273514.0273524.4273534273553273559
802359.3802406.3802406.5802406.2802417.5802420.0802420802415802400
0.560.550.560.550.560.55
1.211.211.211.211.211.21
1.251.251.251.251.251.251.26
1.131.131.141.131.131.141.131.131.14
Indian River County, North Reverse Osmosis PlantN1N2N3N4N5N6N7N8N9
274401 .6274409.1274417.5274424274351274342274332274320274308
802652.1802646.4802646.3802645802643802644802644802644802644
1.151.151.151.151.15
1.061.061.071.061.061.071.06
0.990.980.990.980.990.980.990.981.00
Note: mgd = million gallons per day
Latitude and longitude determined by global positioning system except where there is no decimal extension.Blank cells indicate wells not oumoed.

mean sea level (msl). A potentiometricsurface depressed below 20 ft msl willcause Floridan aquifer water levels tofall below land surface, resulting in thecessation of natural flow from Floridanaquifer wells.
HYDROGEOLOGY
The hydrogeology at the city of VeroBeach and Indian River County wellfieldsconsists of the following units indescending order: the surficial aquifer orwater table, the upper confining unit orHawthorn Group, and the Upper Floridanaquifer. A more thorough description of thehydrogeology can be found in Gee andJenson (1979) and Toth (1994).
Aquifer characteristics for the UpperFloridan aquifer were obtained from aquiferperformance tests (Geraghty & Miller 1981;Missimer International 1996). Aquifercharacteristics for the surficial aquifer werealso obtained from aquifer performancetests (Gee and Jenson 1980). The valuesused in the model for the surficial aquiferare in Toth 1994.
Floridan Aquifer System
Aquifer characteristics for the Floridanaquifer system were derived from aquiferperformance tests (Geraghty & Miller 1981;Missimer International 1996). Thetransmissivity for the Floridan aquifer at thenorth county RO site was 678,000 gallonsper day per foot (gpd/ft) (MissimerInternational 1996). The transmissivity atthe south RO site was 408,000 gpd/ft(Geraghty & Miller 1981). Because thetransmissivities are so different between thenorth and south RO sites, two modelsimulations were performed. Wells for thecity of Vero Beach, the North Beach plant,and the south county RO plant wereincluded in one simulation and wells for thenorth county RO plant were included in theother. The total drawdowns were obtained
by superimposing the drawdowns from thetwo simulations. The transmissivity at thenorth county RO site would produce lessdrawdown than that at the south countysite for the same pumpage. The sameleakance value was used for bothsimulations for the upper confining unit.The leakance value used was 0.0000097gallons per day per square foot per foot(gpd/ftVft) (Missimer International 1996).
The value used for the leakance for theupper confining unit is considerably smallerthan that obtained from the aquiferperformance tests—0.0056 gpd/ft2/ft inMissimer International 1996 and 0.0035gpd/ftVft in Geraghty & Miller 1981. Thereason for the difference is that MissimerInternational could not get a reasonablemodel-derived potentiometric surface forthe Upper Floridan aquifer using the largervalues (0.0056 gpd/ft2/ft) in its MODFLOWmodel for the north county RO plant. Thevalue used is similar to that used by Tibbals(1990) for the area. The value from Geraghty& Miller (1981) was used in Toth (1994). Thesmaller leakance would produce greaterdrawdowns in the Floridan aquifer becauseof less leakance from above and essentiallyno drawdown in the overlying surficialaquifer. The Floridan and surficial aquifersystems are separated by 200-300 ft ofconfining unit (Schiner et al. 1988).
Other aquifer characteristics used in themodels include the transmissivity of thesurficial aquifer system (30,000 gpd/ft) andthe leakance of the semiconfining unit forthe surficial aquifer system (0.0041gpd/ftVft) (Toth 1994). The leakance valuefor the semiconfining unit for the surficialaquifer system was obtained as a result oftrial-and-error during the calibrationprocess for the surficial aquifer drawdownsin Toth (1994). The difference betweenmeasured and calculated drawdowns inToth was less than 3 ft at most monitorwells.
Evapotranspiration Reduction Coefficient
The evapotranspiration (ET) reductioncoefficient (E) describes the rate at which ETis reduced per unit of water tabledrawdown. In other words, when waterlevels in the surficial aquifer decline, lesswater is made available to ET and morewater is captured by pumpage. The value(0.00055 ft/day/ft) used for E in the modelwas obtained from a graph in Tibbals (1990,p. E10) which relates estimated average ETto water table depth. The average measureddepth to water in the wellfield is 5 ft, whichcorresponds to this value of E. Increasing Ereduces the calculated water tabledrawdowns.
WELLFIELD MODEL
Impacts to the groundwater flow systemresulting from withdrawals at the city ofVero Beach and Indian River Countywellfields were evaluated using theMLTLAY model (SJRWMD, n.d.). TheMLTLAY model uses a linear analyticalsolution for a multilayered, leaky artesianaquifer system to calculate the amount ofdrawdown in the surficial aquifer systemand the Upper Floridan aquifer. Themethod assumes that homogeneous andisotropic conditions prevail in the surficialand Floridan aquifer systems. The modelsimulates steady-state conditions andconsiders the flow of water throughmultiple aquifers separated bysemipervious leaky layers. The model alsohas the capability of simulating thewithdrawal of water from either thesurficial aquifer system or the UpperFloridan aquifer, or from bothsimultaneously.
Because the transmissivity of theFloridan aquifer system differs between thenorth county RO site and the south countyRO site, the MLTLAY model was run twice.In the first run, drawdowns were calculated
for wells in the city of Vero Beach, at theNorth Beach plant, and at the south countyRO plant, hi the second run, drawdownswere calculated for wells at the northcounty RO plant. Total drawdown wasobtained by superimposing the drawdownsfrom the two runs.
The model domain was chosen to belarge enough to include the most significantdrawdown in the area around the wellfield.However, drawdowns actually occurbeyond the extent of the model domain.Unlike numerical models wheredrawdowns are constrained by theboundary, the model boundary does notaffect the drawdown calculation in ananalytical model because the domain isconsidered to be infinite. The dimensions ofthe model domain were 24,000 ft wide and77,000 ft long. A coordinate spacing of 100 ftwas used between grid nodes. The originfor the model domain was at 674,003 ft for xand 1,177,652 ft for y (Figure 1).
RESULTS
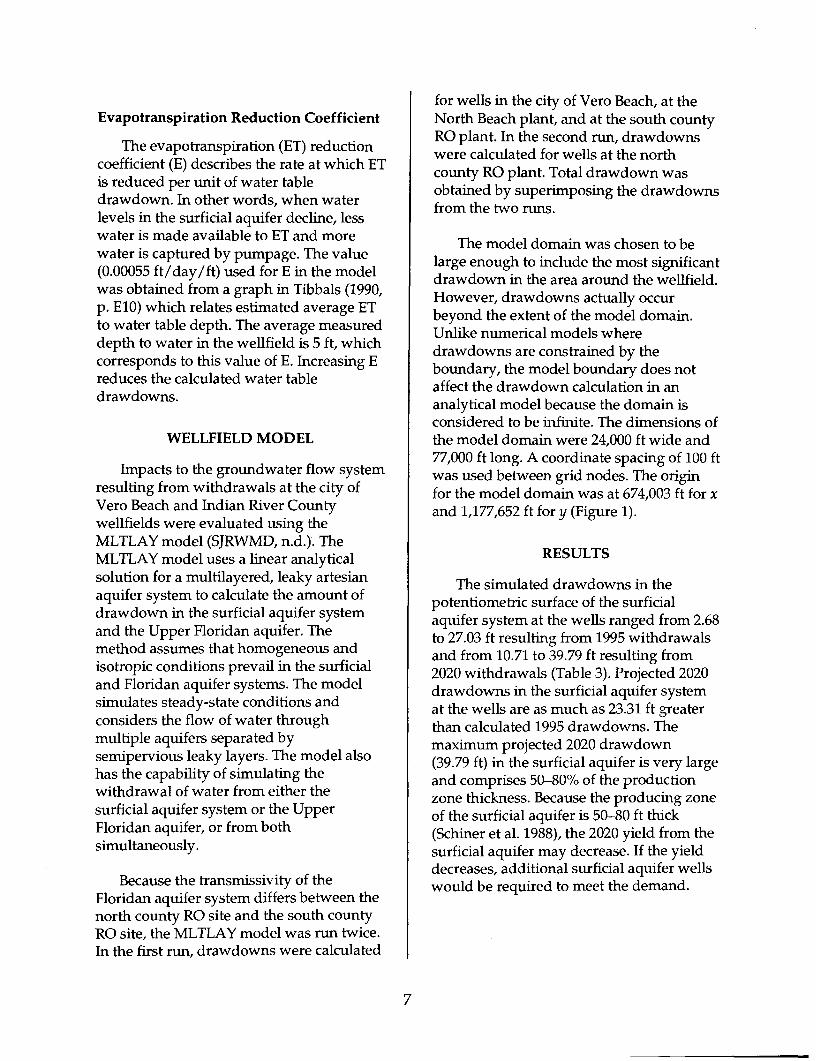
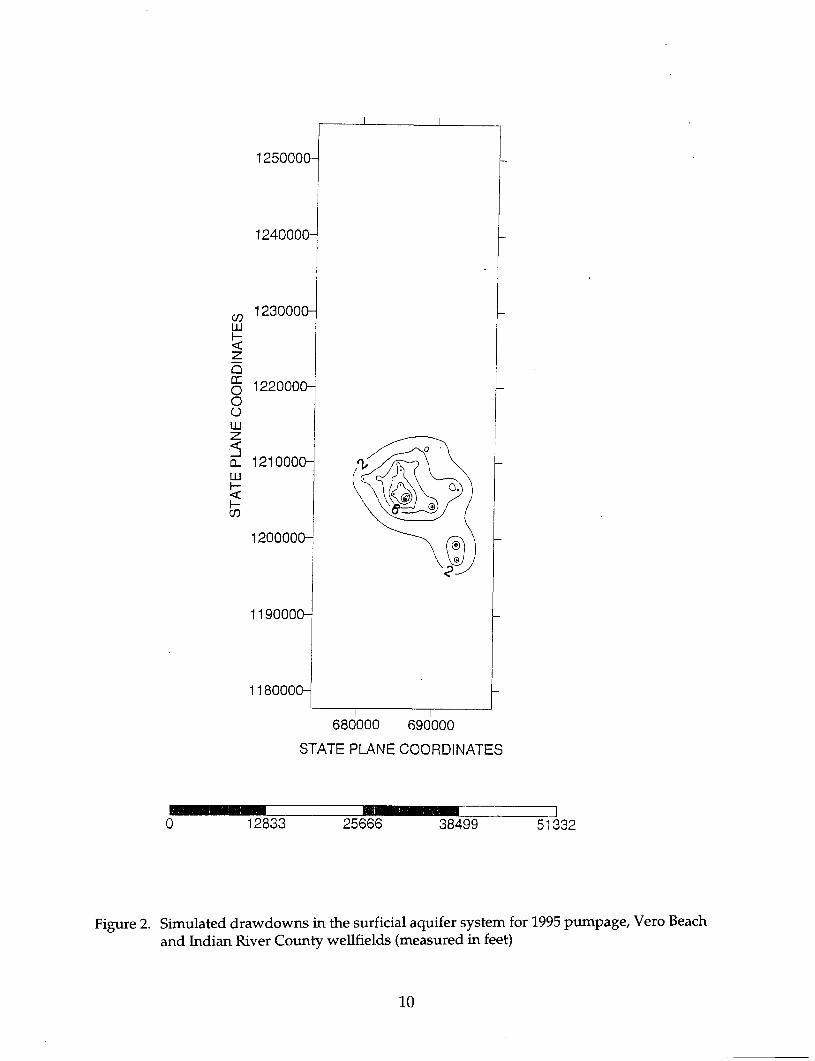
The simulated drawdowns in thepotentiometric surface of the surficialaquifer system at the wells ranged from 2.68to 27.03 ft resulting from 1995 withdrawalsand from 10.71 to 39.79 ft resulting from2020 withdrawals (Table 3). Projected 2020drawdowns in the surficial aquifer systemat the wells are as much as 23.31 ft greaterthan calculated 1995 drawdowns. Themaximum projected 2020 drawdown(39.79 ft) in the surficial aquifer is very largeand comprises 50-80% of the productionzone thickness. Because the producing zoneof the surficial aquifer is 50-80 ft thick(Schiner et al. 1988), the 2020 yield from thesurficial aquifer may decrease. If the yielddecreases, additional surficial aquifer wellswould be required to meet the demand.
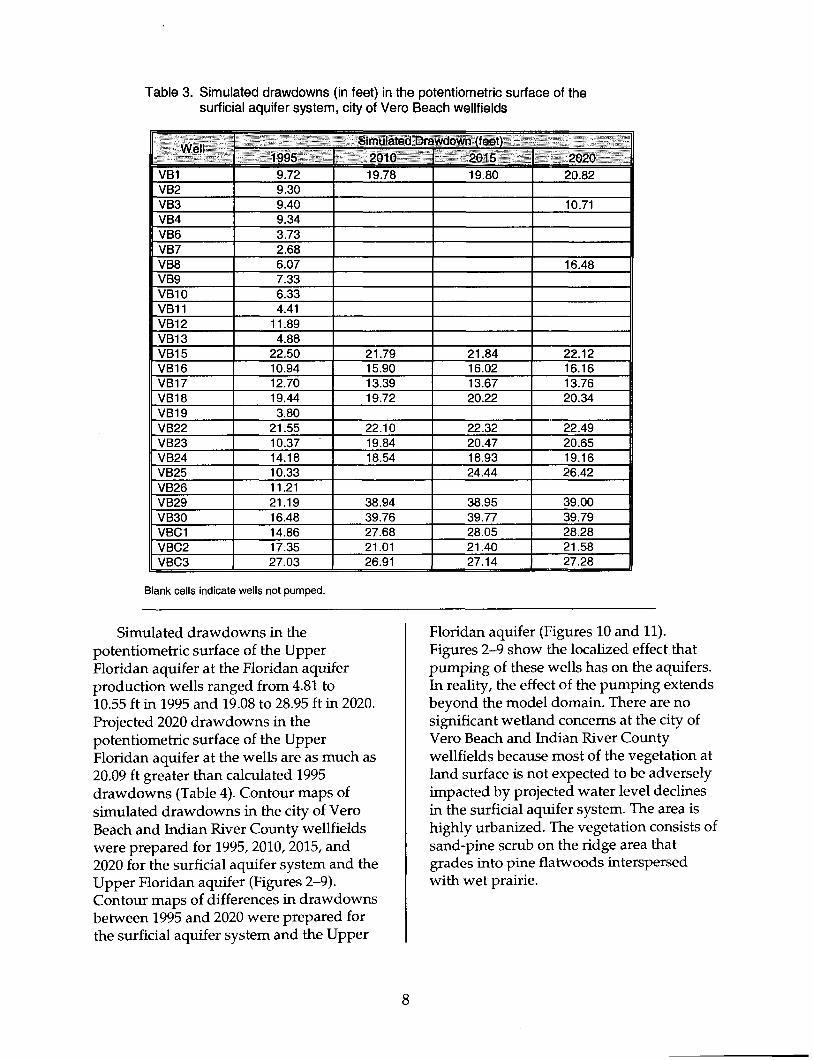
Table 3. Simulated drawdowns (in feet) in the potentiometric surface of thesurficial aquifer system, city of Vero Beach wellfields
Well -.
VB1VB2VB3VB4VB6VB7VB8VB9VB10VB11VB12VB13VB15VB16VB17VB18VB19VB22VB23VB24VB25VB26VB29VB30VBC1VBC2VBC3
Simulated Drawdown (feet)19959.729.309.409.343.732.686.077.336.334.41
11.894.88
22.5010.9412.7019.443.80
21.5510.3714.1810.3311.2121.1916.4814.8617.3527.03
201019.78
21.7915.9013.3919.72
22.1019.8418.54
38.9439.7627.6821.0126.91
201519.80
21.8416.0213.6720.22
22.3220.4718.9324.44
38.9539.7728.0521.4027.14
202020.82
10.71
16.48
22.1216.1613.7620.34
22.4920.6519.1626.42
39.0039.7928.2821.5827.28
Blank cells Indicate wells not pumped.
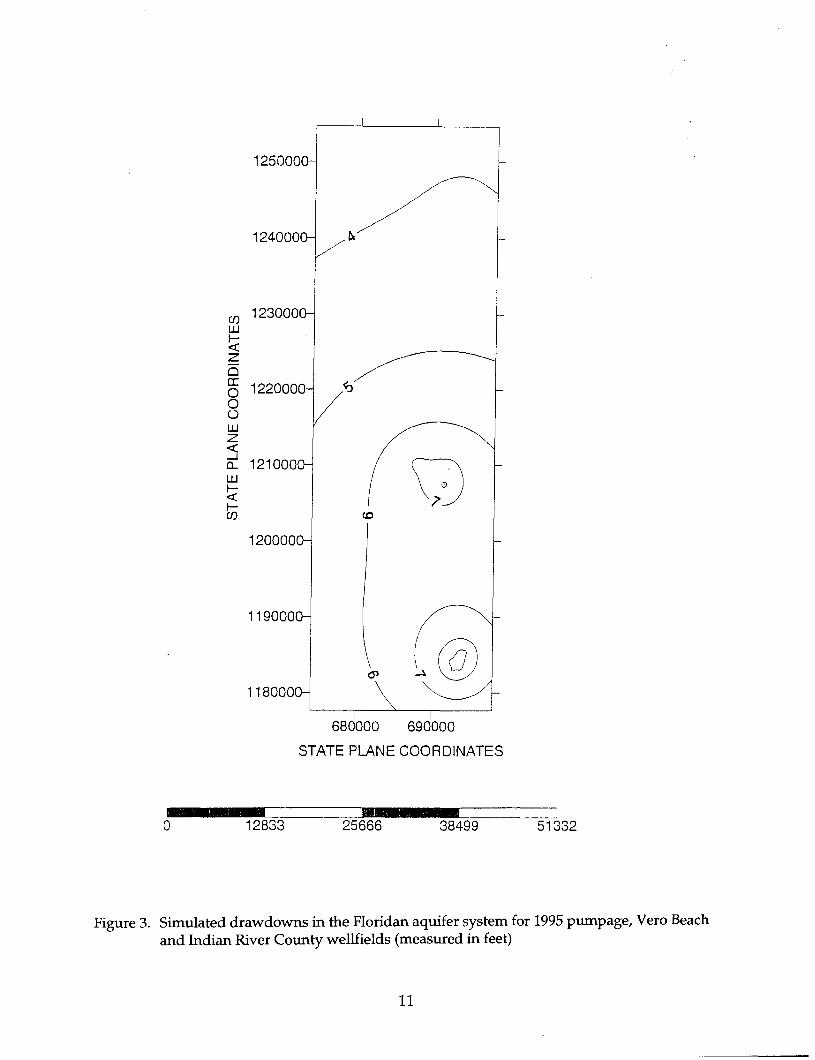
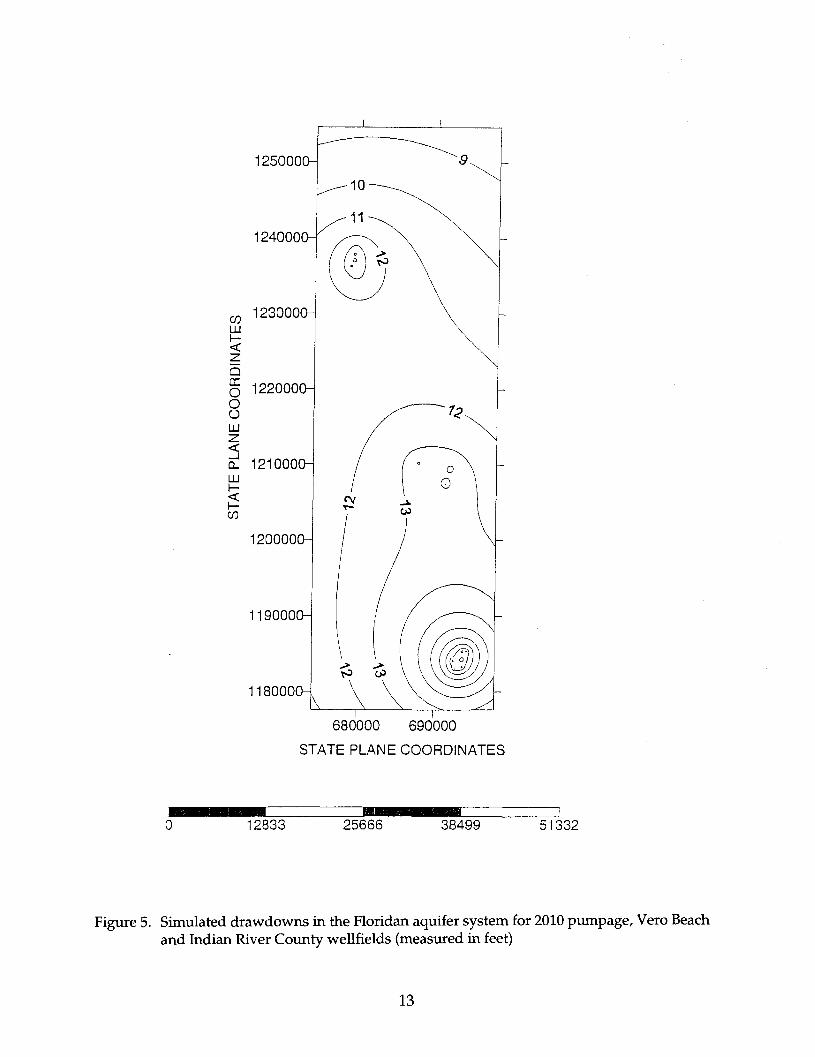
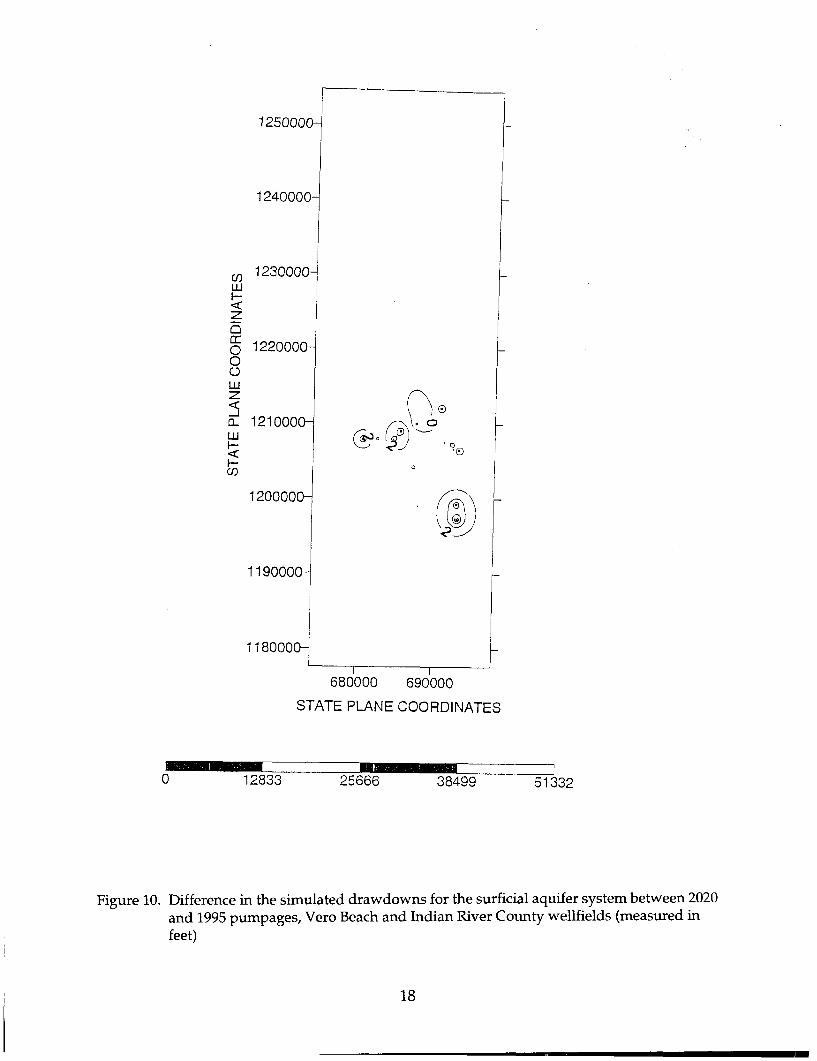
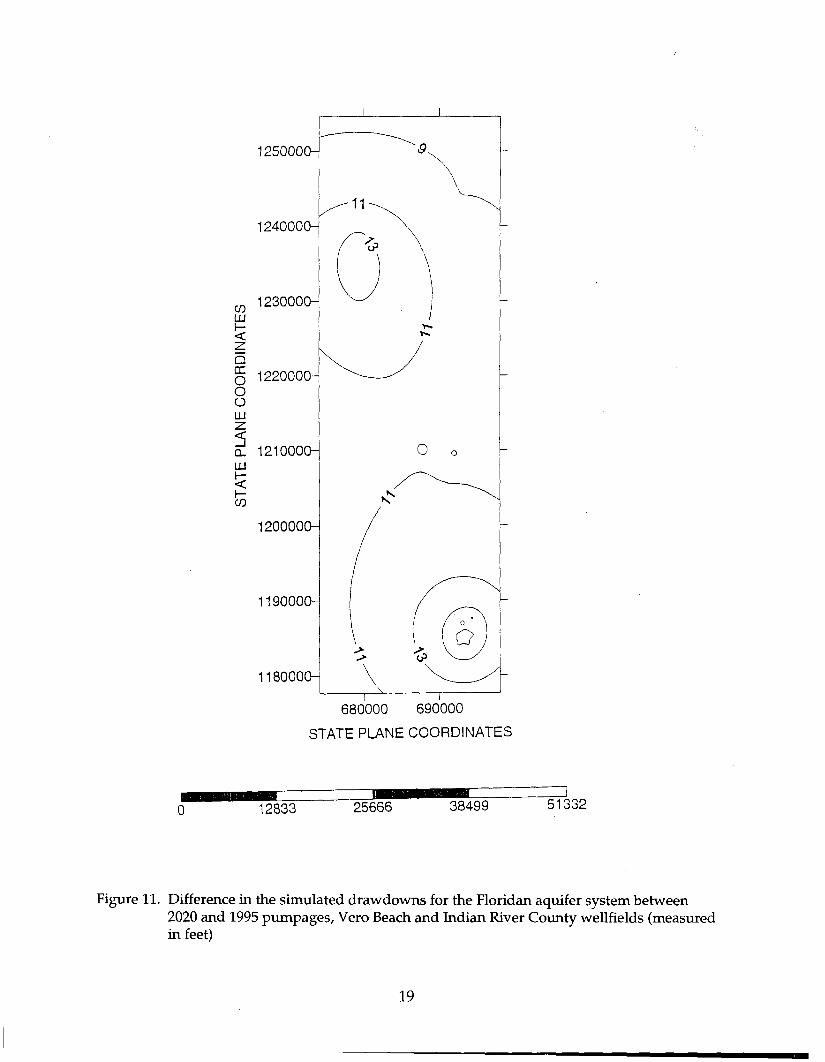
Simulated drawdowns in thepotentiometric surface of the UpperFloridan aquifer at the Floridan aquiferproduction wells ranged from 4.81 to10.55 ft in 1995 and 19.08 to 28.95 ft in 2020.Projected 2020 drawdowns in thepotentiometric surface of the UpperFloridan aquifer at the wells are as much as20.09 ft greater than calculated 1995drawdowns (Table 4). Contour maps ofsimulated drawdowns in the city of VeroBeach and Indian River County wellfieldswere prepared for 1995,2010, 2015, and2020 for the surficial aquifer system and theUpper Floridan aquifer (Figures 2-9).Contour maps of differences in drawdownsbetween 1995 and 2020 were prepared forthe surficial aquifer system and the Upper
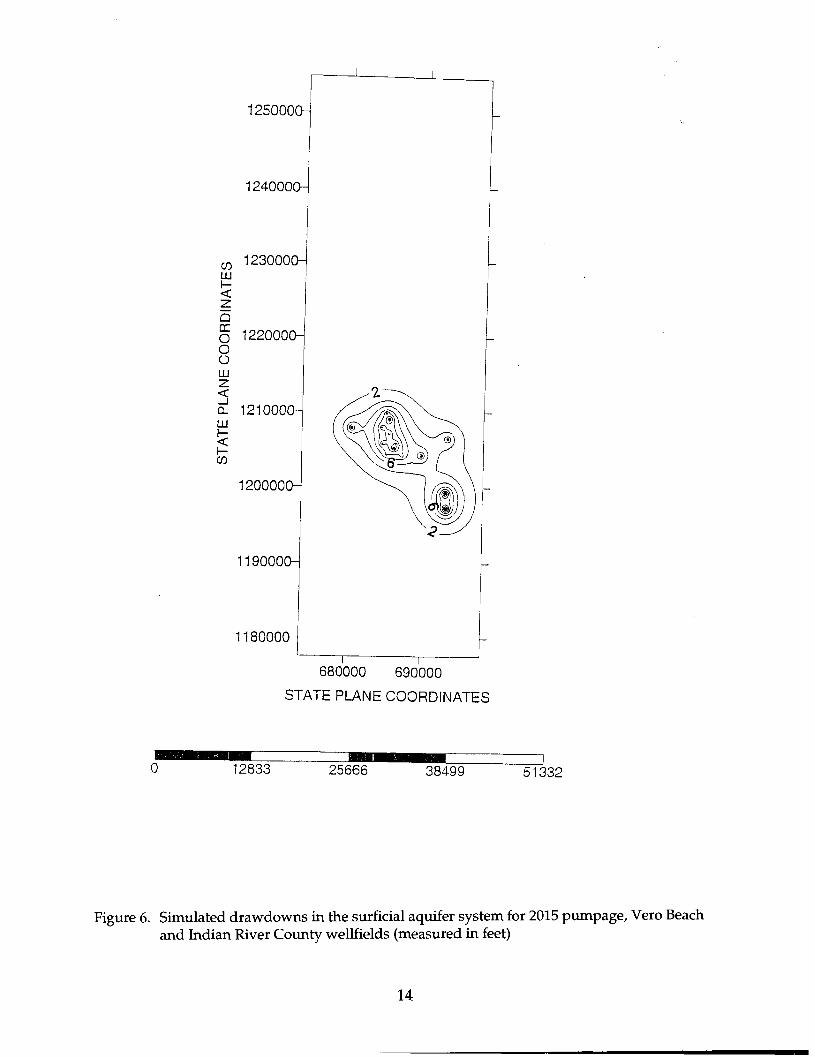
Floridan aquifer (Figures 10 and 11).Figures 2-9 show the localized effect thatpumping of these wells has on the aquifers.In reality, the effect of the pumping extendsbeyond the model domain. There are nosignificant wetland concerns at the city ofVero Beach and Indian River Countywellfields because most of the vegetation atland surface is not expected to be adverselyimpacted by projected water level declinesin the surficial aquifer system. The area ishighly urbanized. The vegetation consists ofsand-pine scrub on the ridge area thatgrades into pine flatwoods interspersedwith wet prairie.
Table 4. Simulated drawdowns (in feet) in the potentiometric surface of the.Floridanaquifer system, city of Vero Beach and Indian River County wellfields
WellSimulated drawdown (feet)
1995 2010 ;2015 2020City of Vero Beach
VB14VB21VB31VB101VB102VB103
7.367.116.76
10.378.798.68
15.9615.8115.56
18.2618.0917.85
20.5120.3020.06
Indian River County, North BeachNB2NB3
4.854.81
' Indian River County, South County Reverse Osmosis Plant123456789
10.2910.5510.3110.4110.1810.32
22.0022.5922.0922.2521.8022.08
25.6526.3825.6826.1225.4226.0825.80
28.4628.8227.9128.9527.6228.4628.5027.4326.78
Indian River County, North County Reverse Osmosis PlantN1N2N3N4N5N6N7N8N9
15.2615.4415.3314.9814.95
17.8317.8617.7217.2217.8817.7817.40
19.8419.8019.5019.0820.0520.0919.9819.7219.33
Blank cells indicate wells not pumped.
DISCUSSION
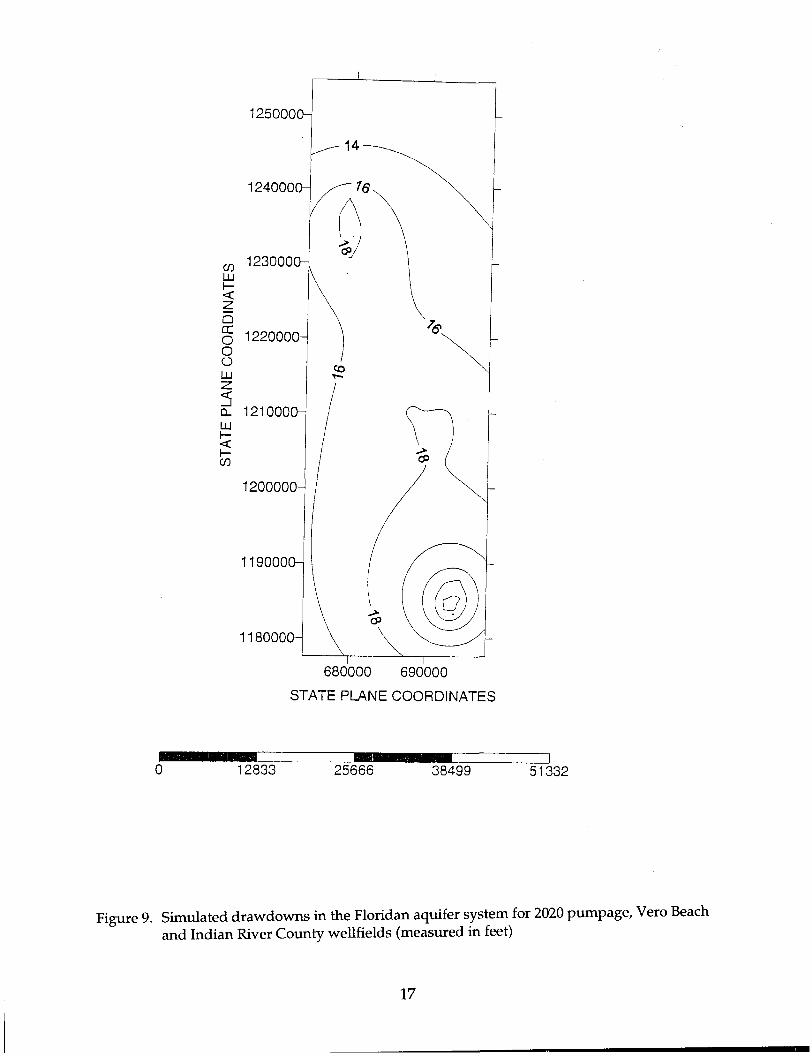
The 2020 Floridan aquifer drawdown atthe southern model boundary is in excess of18 ft (Figure 9). This boundary isapproximately 1 mile north of the IndianRiver/St. Lucie county border. Because theMay 1996 potentiometric surface of theFloridan aquifer is about 34 ft msl in thisarea (Phelps et al. 1996) and because theaverage topographic elevation is about 20 ftmsl, the projected drawdowns suggest thatFloridan aquifer wells will cease to flownaturally at the Indian River/St. Lucie
border in 2020. In fact, the projecteddrawdowns in the Floridan aquifer at thesouthern model boundary are in excess of13 ft in 2010 and 15 ft in 2015 (see Figures 5and 7). This suggests that Floridan aquiferwells will cease to flow at the IndianRiver/St. Lucie county border as early as2015.
One of the goals of the Upper East CoastWater Supply Plan of the South FloridaWater Management District is to preventthe Floridan aquifer potentiometric surfacefrom being lowered to the extent thatFloridan aquifer wells cease to flow
COLU
1250000-
1240000-
1230000-
Q
§ 122000CHO
LLJ
o_ 121000CHLLI
CO
1200000-
1190000-
1180000-
680000 690000
STATE PLANE COORDINATES
12833 25666 38499 51332
Figure 2. Simulated drawdowns in the surficial aquifer system for 1995 pumpage, Vero Beachand Indian River County wellfields (measured in feet)
10
COLU
1250000-
1240000-
1230000-
Q0 1220000-OOLU~Z.
o_ 121000CHin<CO
1200000-
1190000-
1180000-©
680000 690000
STATE PLANE COORDINATES
12833 25666 38499 51332
Figure 3. Simulated drawdowns in the Floridan aquifer system for 1995 pumpage, Vero Beachand Indian River County wellfields (measured in feet)
11

COLU
1250000-
1240000-
1230000-
Q
§ 1220000-OOLU
Q. 1210000-LU
CO
1200000-
1190000-
1180000-
680000 690000
STATE PLANE COORDINATES
12833 25666 38499 51332
Figure 4. Simulated drawdowns in the surficial aquifer system for 2010 pumpage, Vero Beachand Indian River County wellfields (measured in feet)
12
COLLJ
Q
OOOLLJ
1250000-
1240000-
1230000-
1220000-
a. 1210000HLLJ
CO
1200000-
1190000-
1180000-
680000 690000
STATE PLANE COORDINATES
12833 25666 38499 51332
Figure 5. Simulated drawdowns in the Floridan aquifer system for 2010 pumpage, Vero Beachand Indian River County wellfields (measured in feet)
13
125000'
LLJ
Q- 1210000HLU
1200000-
119000C
118000C
680000 690000
STATE PLANE COORDINATES
12833 25666 38499 51332
Figure 6. Simulated drawdowns in the surficial aquifer system for 2015 pumpage, Vero Beachand Indian River County wellfields (measured in feet)
14

COUJ
1250000
1240000
1230000H
Q
O 1220000-jOOUJ
Q. 121000CHLU
te120000CH
1190000H
1180000H
680000 690000
STATE PLANE COORDINATES
12833 25666 38499 51332
Figure 7. Simulated drawdowns in the Floridan aquifer system for 2015 pumpage, Vero Beachand Indian River County wellfields (measured in feet)
15

COLLJ
1250000-
1240000-
1230000-
Q
§ 1220000-OOLLJ
a. 1210000HLLJ
CO
1200000-
1190000-
1180000-
680000 690000
STATE PLANE COORDINATES
12833 25666 38499 51332
Figure 8. Simulated drawdowns in the surficial aquifer system for 2020 pumpage, Vero Beachand Indian River County wellfields (measured in feet)
16
COHI
1250000
1240000-
1230000-
Q
§ 1220000-OOLU
Q. 1210000-LU
CO
1200000-
1190000^
1180000-
co
680000 690000
STATE PLANE COORDINATES
12833 25666 38499 51332
Figure 9. Simulated drawdowns in the Floridan aquifer system for 2020 pumpage, Vero Beachand Indian River County wellfields (measured in feet)
17
COLU
Q
OOOLLJ
125000C
124000C
1230000-
122000C
Q. 1210000-LU
CO
1200000-
1190000-
118000C
(£.(/
©
'%
680000 690000
STATE PLANE COORDINATES
12833 25666 38499 51332
Figure 10. Difference in the simulated drawdowns for the surficial aquifer system between 2020and 1995 pumpages, Vero Beach and Indian River County wellfields (measured infeet)
18
COLLJ
1250000-
1240000-
1230000-
Q
§ 1220000-OOLLJ
2 121000CHill
1200000-
1190000-
1180000-
0
680000 690000
STATE PLANE COORDINATES
12833 25666 38499 51332
Figure 11. Difference in the simulated drawdowns for the Floridan aquifer system between2020 and 1995 pumpages, Vero Beach and Indian River County wellfields (measuredin feet)
19
naturally. The projected drawdownscomputed in this study suggest that thatgoal would probably not be met in 2015 and2020.
The projected drawdowns in bothsurficial and Floridan aquifer wells areconsiderable. A surficial aquifer drawdowncomprising 50-80% of its productive zonethickness will reduce the natural dischargeto the ocean. A drawdown of 29 ft atFloridan aquifer production wells willlower water levels to below land surface.This drawdown may lead to verticalsaltwater upconing in the Floridan aquifer.The potential for such upconing should beevaluated in more detail.
REFERENCES
Florence, B.L. 1997.1995 monthly public supplywater use in Indian River County. St. JohnsRiver Water Management District, Palatka,Fla.
Gee and Jenson. 1979. Test well completion reportfor water supply development program.Prepared for the city of Vero Beach. WestPalm Beach, Fla.
. 1980. Future water supply development forthe city of Vero Beach, Florida. Prepared forthe city of Vero Beach. West Palm Beach,Fla.
Geraghty & Miller, Inc. 1981. Installation andtesting of production and monitoring wells,south taxing district, Indian River County,Florida. Prepared for Indian River CountyUtilities. West Palm Beach, Fla.
McCain, W.F., capital projects engineer, IndianRiver County, Vero Beach, Fla.December 23,1997, letter.
. May 8,1998, letter.
the Upper Floridan aquifer at the Indian RiverCounty North Reverse Osmosis WaterTreatment Plant. Prepared for Indian RiverCounty Utilities. Fort Myers, Fla.
Phelps, G.G., L.A. Bradner, L. Knowles Jr., andA.M. O'Reilly. 1996. Potentiometric surface ofthe Upper Floridan aquifer in the St. Johns RiverWater Management District and vicinity,Florida, May 1996. Open-File Report 96-589.Tallahassee, Fla.: U.S. Geological Survey.
[SFWMD] South Florida Water ManagementDistrict. 1998. Upper East Coast WaterSupply Plan. West Palm Beach, Fla.
[SJRWMD] St. Johns River Water ManagementDistrict. N.d. MLTLAY computer program,modified. Palatka, Fla. Unpublished.
Schiner, G.R., C.P. Laughlin, and D.J. Toth. 1988.Geohydrology of Indian River County, Florida.Water-Resources Investigations Report88-4073. Tallahassee, Fla.: U.S. GeologicalSurvey.
Ten Eyck, J.R., manager, Environmental andPlant Operations, Water and SewerDepartment, Vero Beach, Fla. October 27,1997(a), letter.
. September 9,1997(b), letter.
-. September 17,1997(c), letter.
Missimer International, Inc. 1996. Hydrogeologicinvestigation for water supply development of
Tibbals, C.H. 1990. Hydrology of the Floridanaquifer system in east-central Florida.Professional Paper 1403-E. Washington,D.C.: U.S. Geological Survey.
Toth, D.J. 1994. Projected aquifer drawdowns, cityof Vero Beach and Indian River Countywellfields, Indian River County, Florida.Professional Paper SJ94-PP6. Palatka, Fla.:St. Johns River Water Management District.
Vergara, B.A., editor. 1998. Water SupplyAssessment: 1998. Technical PublicationSJ98-2. Palatka, Fla.: St. Johns River WaterManagement District.
20