profit or bust? - actuaries institute · profit or bust? the latest trends in ... for local...
TRANSCRIPT

Profit or bust? The latest trends in Public Liability
and Professional Indemnity
Samantha Fuller & Scott Duncan © Taylor Fry Consulting Actuaries
This presentation has been prepared for the Actuaries Institute 2012 General Insurance Seminar.
The Institute Council wishes it to be understood that opinions put forward herein are not necessarily those of the Institute and the Council is not responsible for those opinions.
1

Outline
Background
Public & Product Liability • Australia wide • State/Territory • Industry / Occupation groups
Professional Indemnity • Australia wide • State/Territory • Industry / Occupation groups
2

Background on NCPD Data for Australia and by State based on Dec
2011 - Level 1
Data for Industry groups based on Level 2 as at Dec 2010 – Level 2, heavily masked
Our analysis is restricted to Non-Facility business
APRA regulated entities only 3

Our Approach Use Australia wide experience
Project ultimate costs blending PPCI, PCE, PPCF (including operational time) projections
Analyse State experience relative to Australia
Analyse Industry experience relative to Australia
Use relativities to forecast future loss ratios
Excludes U/W and CHE expenses 4
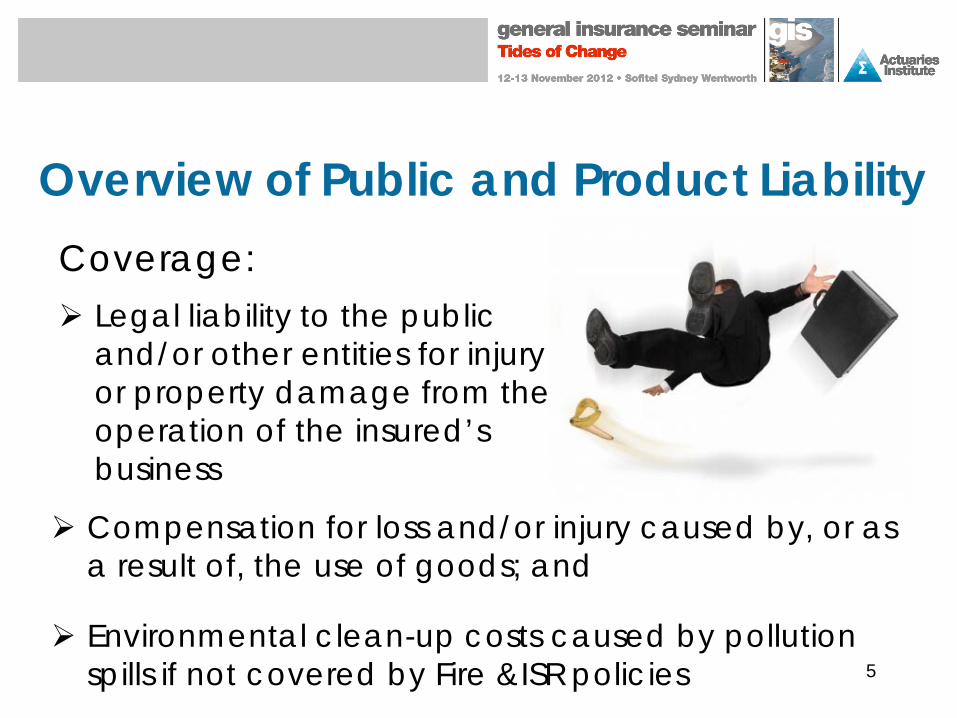
Overview of Public and Product Liability Coverage: Legal liability to the public
and/or other entities for injury or property damage from the operation of the insured’s business
Compensation for loss and/or injury caused by, or as a result of, the use of goods; and
Environmental clean-up costs caused by pollution spills if not covered by Fire &ISR policies
5

Overview of Public & Product Liability
6

Australia Wide Analysis Claim Frequency and Average Claim Size
7
• Average claim size: no significant trends by accident year. Increases by delay to finalisation.
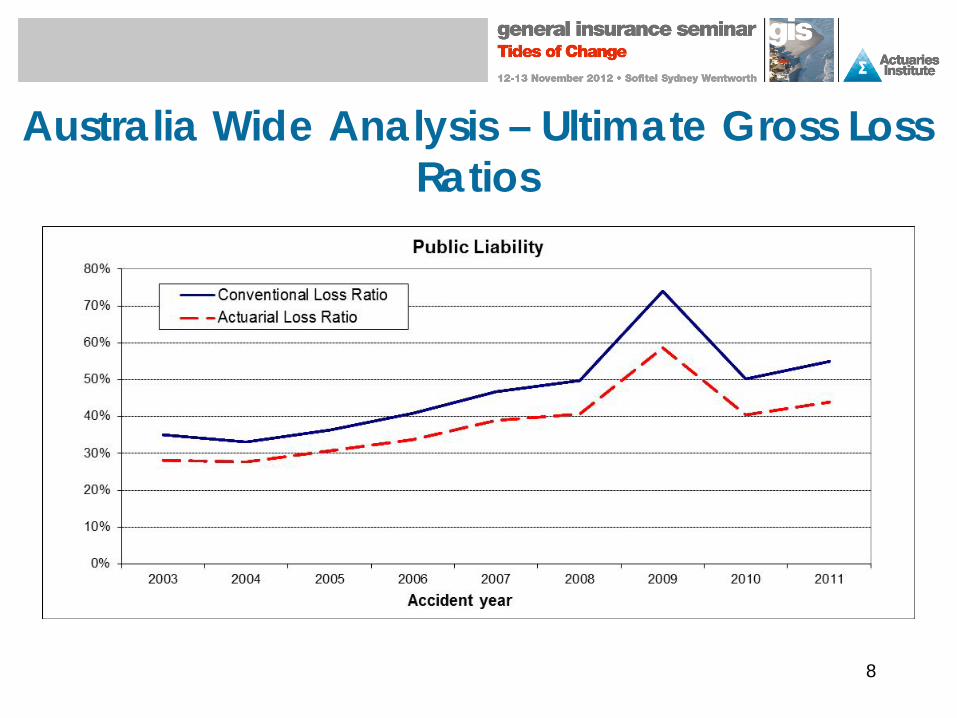
Australia Wide Analysis – Ultimate Gross Loss Ratios
8
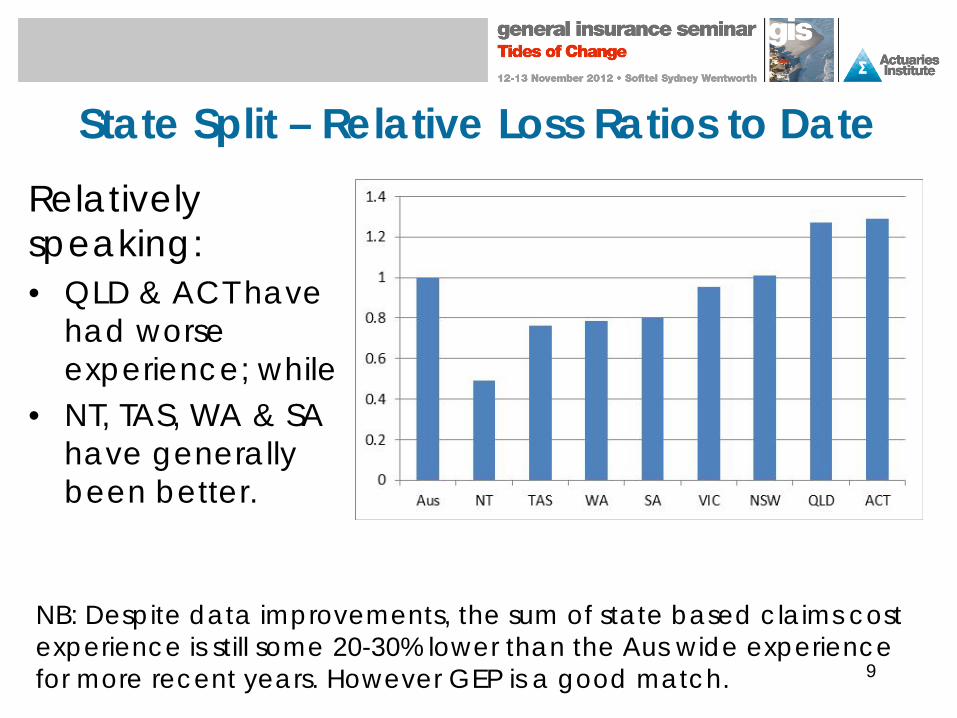
State Split – Relative Loss Ratios to Date Relatively speaking: • QLD & ACT have
had worse experience; while
• NT, TAS, WA & SA have generally been better.
NB: Despite data improvements, the sum of state based claims cost experience is still some 20-30% lower than the Aus wide experience for more recent years. However GEP is a good match. 9

Industry Groups
55 individual specifications –grouped into 15 categories:
10

Relative Claim Frequency by Industry Group
*Frequency based on number of risks written
Accident Year GEP $M
2006 2007 2008 2009 2010 2010
Agriculture 0.4 0.4 0.4 0.4 0.3 80
Mining 0.8 0.8 0.6 0.6 0.6 50
Manufacturing 1.5 1.5 1.6 1.4 1.4 246
Utilities 2.6 2.1 5.7 2.3 2.5 12
Construction 1.4 1.5 1.5 1.6 1.5 351
Wholesaling 1.3 1.4 1.4 1.4 1.4 75
Retail 1.5 1.5 1.4 1.4 1.4 237
Transport 0.6 0.7 0.7 0.7 0.6 53
Government 0.2 0.2 0.2 0.4 0.4 53
Services 1.0 1.0 1.2 1.2 1.4 126
Other 0.7 0.7 0.6 0.6 0.6 330
Unknown 5.1 6.3 6.2 5.9 8.2 2
11

Average Claims Cost Relativity by Industry Group
12
Accident Year Average GEP $M
2006 2007 2008 2009 2010 2004-2008 2010
Agriculture 1.0 0.8 0.7 0.5 1.1 0.8 80.2
Mining 3.8 1.8 4.7 1.0 1.6 2.9 24.8
Manufacturing 2.1 2.0 2.0 1.3 2.2 2.1 245.5
Utilities 4.6 2.4 0.0
Construction 1.1 1.0 1.0 1.6 1.0 1.0 350.7
Wholesaling 1.3 1.1 1.1 1.1 1.3 1.3 74.7
Retail 0.5 0.6 0.7 0.7 0.9 0.6 237.3
Transport 2.2 2.0 1.0 0.7 1.4 1.7 48.5
Government 1.3 2.2 2.1 0.6 0.9 1.7 47.8
Services 0.9 0.7 0.8 0.6 0.7 0.8 126.3
Other 0.8 0.8 0.8 0.6 0.7 0.7 309.7
Unknown 2.0 2.2 1.1 1.6 0.7 1.6 2.2
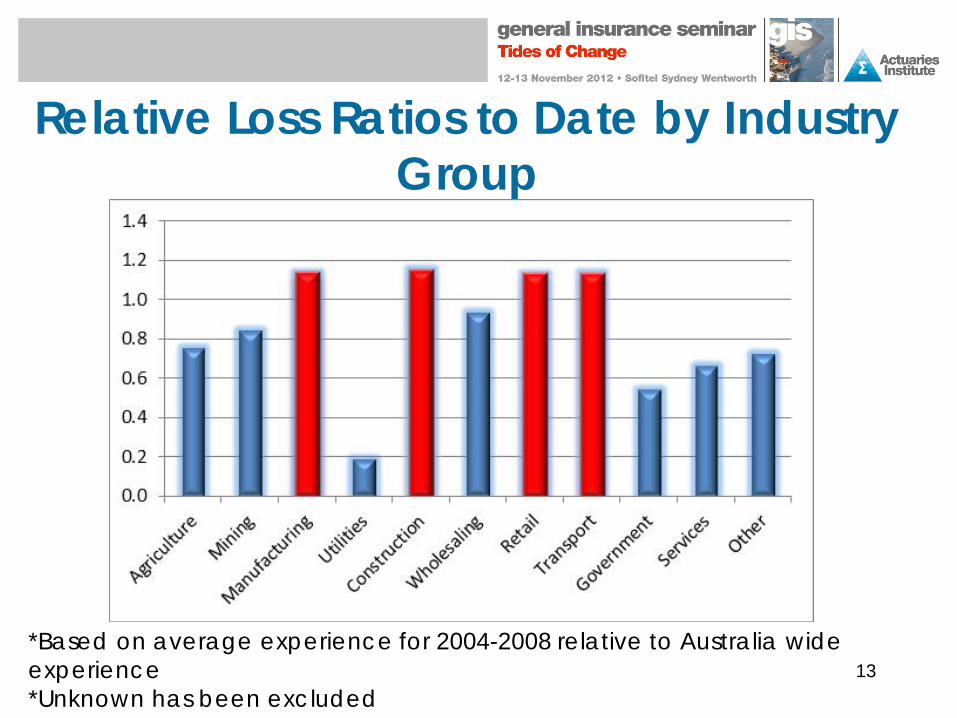
Relative Loss Ratios to Date by Industry Group
*Based on average experience for 2004-2008 relative to Australia wide experience *Unknown has been excluded
13

Show me the money…. • Loss ratios are generally rising
– estimate 2012 likely to reach around 60-65% (conventional loss ratio) or 50-55% (actuarial loss ratio), assuming no changes in pricing basis;
• Manufacturing, Construction, Retail & Transport are worse than the average – likely driven by competitive pricing for largest sectors – Construction & Retail suffered particularly in 2009
14

Show me the money…. Of the better performers……. Mining & Wholesaling appear to be attractive
propositions, with average premiums in the region of $1,500 to $2,000.
Agriculture, Services, Government & Other are generally the most attractive, although average premiums are lower at around
around $380 to $750 per risk. However, one might expect expenses to be a higher proportion of gross premiums for these sectors.
15

Overview of Professional Indemnity Coverage: Legal actions taken against a
person for advice or service supplied as part of their professional practice, incl. related legal expenses
Directors’ & Officers’ Liability Insurance & legal expense insurance; and Medical Indemnity Insurance. NB. Most PI policies written on a claims made basis- accident year triangles are more akin to report year.
16

Overview of Professional Indemnity
17

18
Australia Wide Analysis Claim Frequency and Average Claim Size
• Average claim size: no significant trends by accident year. Increases by delay to finalisation.
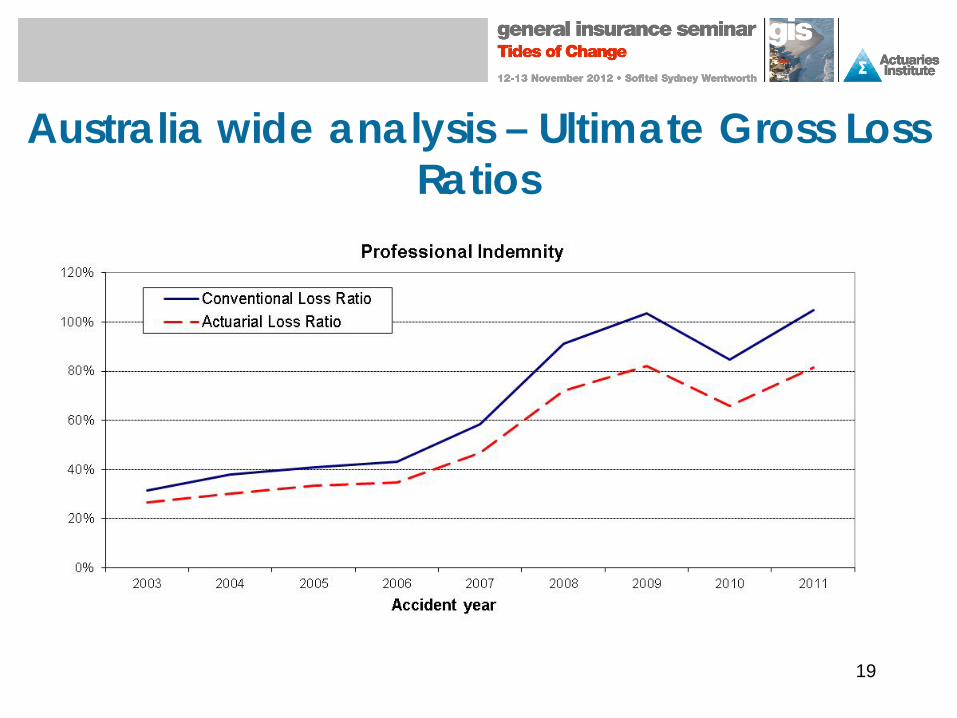
Australia wide analysis – Ultimate Gross Loss Ratios
19

State split – Relative loss ratios Relatively speaking: • QLD, TAS, ACT
and NSW have had worse experience; while
• NT, VIC, WA & SA have generally been better.
NB: Despite data improvements, the sum of state based claims cost experience is still some 15-25% lower than the Aus wide experience for more recent years. However GEP is a good match. 20

PI - Industry groups • 70 occupations
rolled up into 14 groups
• “Other” is made
up of a broad range of occupations. Those with a numeric prefix are included here. 21

Relative Frequency by Industry Group
*Frequency based on number of risks written
Accident Year GEP $M 2006 2007 2008 2009 2010 2010
Finance 2.7 1.1 1.3 1.7 1.6 165.5 General Consultants 0.7 0.9 0.8 0.8 0.9 70.8
Medical 0.7 0.8 0.7 0.7 0.8 388.1 Legal 2.5 2.9 2.9 2.9 2.9 111.2
Real Estate 1.5 1.5 1.7 1.4 1.3 25.2 Agriculture 0.8 0.9 1.0 0.9 1.2 10.8
Schools 0.3 0.8 1.0 0.5 0.5 16.2 Insurance 1.4 0.9 1.2 1.5 1.3 12.6
Local Government 1.0 1.5 1.3 2.1 1.9 1.0 Architects 1.2 1.1 1.2 1.1 1.1 14.9
Engineering 1.2 1.1 1.2 1.3 1.3 118.2 Surveying 2.1 2.0 1.8 2.6 3.5 13.8
Defamation 3.5 3.7 3.7 2.4 2.9 3.0 Multiple 1.3 0.1 0.1
Other 1.2 1.3 1.3 1.3 1.2 280.3 22

Average claims cost relativity by Industry Group
Accident Year Average GEP $M 2006 2007 2008 2009 2010 2004-2008 2010
Finance 1.1 1.9 3.3 2.0 1.6 2.0 165.5 General Consultants 0.8 0.4 0.4 0.6 1.4 0.5 70.8
Medical 0.6 0.5 0.3 0.4 0.6 0.5 388.1 Legal 1.7 1.6 1.2 1.5 0.0
Real Estate 0.4 0.7 0.4 0.5 1.2 0.5 25.2 Agriculture 0.4 0.2 1.1 0.8 0.4 10.8
Schools 0.3 0.3 0.8 0.2 16.2 Insurance 1.4 0.7 0.9 1.2 1.2 1.7 12.6
Local Government 0.8 0.4 0.0 Architects 0.6 0.7 0.7 0.8 2.0 0.7 14.9
Engineering 4.6 4.1 2.9 1.6 2.5 3.0 118.2 Surveying 1.5 1.2 0.9 1.3 1.5 1.1 13.8
Defamation 0.2 0.2 0.4 0.0 Multiple 0.0 0.0 0.0
Other 1.1 1.4 1.1 1.6 1.0 1.3 164.2

Relative loss ratios by Industry Group
*Based on average experience for 2004-2008 relative to Australia wide experience *Unknown has been excluded
24

Show me the money…. • Loss ratios have been increasing in recent years
– estimate 2012 likely to reach around 100-110% (conventional loss ratio) or 75-85% (actuarial loss ratio), assuming no changes in pricing basis;
• The “Other”, Finance, Engineering and Surveying occupation groups have performed the worst. – Finance was particularly poor during 2008. The loss ratio to date for this year is approx. 140%.

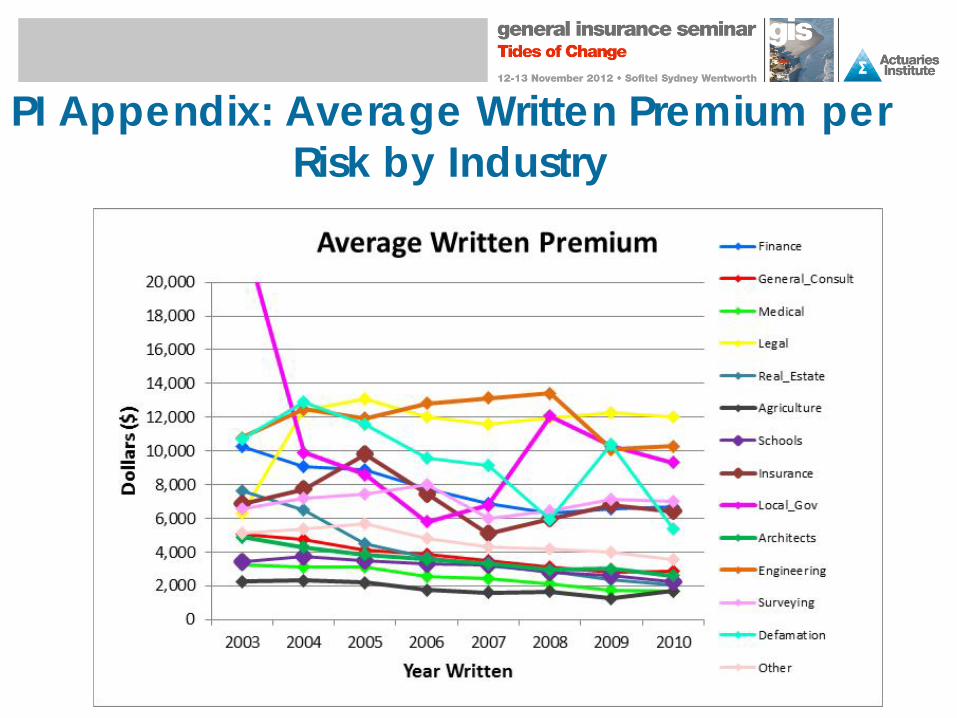
Show me the money…. Of the better performers……. Medical Indemnity (although there is evidence this
favourable experience is starting to unwind). Large premium pool and claims costs reduced
substantially following tort law reforms in early 2000s
General Consulting Schools and local government. Average premium per risk is
approx. $2,200 for schools and $9,300
for local governments, however, total pool is small.

• Level 2 unmasked coming soon • Either:
• Test Industry prediction capability or • Isolate particular industries and consider Op
time PPCFs • State based needs to consider op time
differences (substantial gap in Incurred cost c.t. Aus aggregate).
Further enhancements
27

Appendices
28

PL Appendix: State split • Similar breakdown by risks
written.
• In aggregate there was a 2% decrease in the number of risks written from 2010 to 2011.
• WA, NT and ACT have grown fastest over the last three years at 7%, 13% and 17% respectively over this period.
29

PL Appendix: State split - Frequency 2011 accident year ranking:
WA QLD
--------- (AUS) NSW SA TAS VIC
NT &ACT variable
Incr
easin
g fre
q
30

31
PL Appendix: Average Written Premium per Risk by Industry
Note: Utilities not displayed.

PL Appendix: Occupation Groups
32
Code Description GroupPL-01 01 - Agriculture AgriculturePL-02 02 - Services to Agriculture; Hunting and Trapping AgriculturePL-03 03 - Forestry and Logging AgriculturePL-04 04 - Commercial Fishing AgriculturePL-11 11 - Coal Mining MiningPL-12 12 - Oil and Gas Extraction MiningPL-13 13 - Metal Ore Mining MiningPL-14 14 - Other Mining MiningPL-15 15 - Other Non Metallic Minerals MiningPL-21 21 - Food, Beverage and Tobacco Manufacturing ManufacturingPL-22 22 - Textile, Clothing, Footwear and Leather Manufacturing ManufacturingPL-23 23 - Wood and Paper Product Manufacturing ManufacturingPL-24 24 - Printing, Publishing and Recorded Media ManufacturingPL-25 25 - Petroleum, Coal, Chemical and Associated Product Manufacturing ManufacturingPL-26 26 - Non Metallic Mineral Product Manufacturing ManufacturingPL-27 27 - Metal Product Manufacturing ManufacturingPL-28 28 - Machinery and Equipment Manufacturing ManufacturingPL-29 29 - Other Manufacturing ManufacturingPL-36 36 - Electricity and Gas Supply UtilitiesPL-37 37 - Water Supply, Sewerage and Drainage Services UtilitiesPL-41 41 - General Construction ConstructionPL-42 42 - Construction Trade Services ConstructionPL-45 45 - Basic Material Wholesaling WholesalingPL-46 46 - Machinery and Motor Vehicle Wholesaling WholesalingPL-47 47 - Personal and Household Good Wholesaling WholesalingPL-51 51 - Food Retailing Retail
PL-52 52 - Personal and Household Good Retailing RetailPL-53 53 - Motor Vehicle Retailing and Services RetailPL-57 57 - Accommodation, Cafes and Restaurants RetailPL-61 61 - Road Transport TransportPL-62 62 - Rail Transport TransportPL-63 63 - Water Transport TransportPL-64 64 - Air and Space Transport TransportPL-65 65 - Other Transport TransportPL-66 66 - Services to Transport TransportPL-67 67 - Storage OtherPL-71 71 - Communication OtherPL-73 73 - Finance OtherPL-74 74 - Insurance OtherPL-75 75 - Services to Finance and Insurance OtherPL-77 77 - Property Services OtherPL-78 78 - Business Services OtherPL-81 81 - Government Administration GovernmentPL-82 82 - Defence GovernmentPL-84 84 - Education GovernmentPL-86 86 - Health Services GovernmentPL-87 87 - Community Services GovernmentPL-91 91 - Motion Picture, Radio and Television Services ServicesPL-92 92 - Libraries, Museums and the Arts ServicesPL-93 93 - Sport and Recreation ServicesPL-95 95 - Personal Services ServicesPL-96 96 - Other Services ServicesPL-97 97 - Private Households Employing Staff ServicesPL-99 99 - Multiple OtherPL-UN UNK - Unknown Unknown

PI Appendix: State split • If we were to use risks
written as a measure of size QLD and SA would increase whilst NSW would decrease in significance.
• In aggregate there was a 5% increase in the number of risks written from 2010 to 2011.
• QLD and NT have exhibited significant growth in earned premium over the last three years (23% and 28% respectively) although most of this arose over 2008/09.
33

PI Appendix: State split - Frequency 2011 accident year ranking:
NSW WA
--------- (AUS) VIC SA
QLD TAS
NT range 1.5% to 3.2%
ACT range 2.5% to 3.5%
Incr
easin
g fre
q
35
PI Appendix: Average Written Premium per Risk by Industry

PI Appendix: Occupation Groups
36
Code Description GroupPI-01 01 - Agriculture OtherPI-02 02 - Services to Agriculture; Hunting and Trapping OtherPI-03 03 - Forestry and Logging OtherPI-04 04 - Commercial Fishing OtherPI-11 11 - Coal Mining OtherPI-12 12 - Oil and Gas Extraction OtherPI-13 13 - Metal Ore Mining OtherPI-14 14 - Other Mining OtherPI-15 15 - Other Non Metallic Minerals OtherPI-21 21 - Food, Beverage and Tobacco Manufacturing OtherPI-22 22 - Textile, Clothing, Footwear and Leather Manufacturing OtherPI-23 23 - Wood and Paper Product Manufacturing OtherPI-24 24 - Printing, Publishing and Recorded Media OtherPI-25 25 - Petroleum, Coal, Chemical and Associated Product Manufacturing OtherPI-26 26 - Non Metallic Mineral Product Manufacturing OtherPI-27 27 - Metal Product Manufacturing OtherPI-28 28 - Machinery and Equipment Manufacturing OtherPI-29 29 - Other Manufacturing OtherPI-36 36 - Electricity and Gas Supply OtherPI-37 37 - Water Supply, Sewerage and Drainage Services OtherPI-41 41 - General Construction OtherPI-42 42 - Construction Trade Services OtherPI-45 45 - Basic Material Wholesaling OtherPI-46 46 - Machinery and Motor Vehicle Wholesaling OtherPI-47 47 - Personal and Household Good Wholesaling OtherPI-51 51 - Food Retailing OtherPI-52 52 - Personal and Household Good Retailing OtherPI-53 53 - Motor Vehicle Retailing and Services OtherPI-57 57 - Accommodation, Cafes and Restaurants OtherPI-61 61 - Road Transport OtherPI-62 62 - Rail Transport OtherPI-63 63 - Water Transport OtherPI-64 64 - Air and Space Transport OtherPI-65 65 - Other Transport OtherPI-66 66 - Services to Transport Other
PI-67 67 - Storage OtherPI-71 71 - Communication OtherPI-73 73 - Finance OtherPI-74 74 - Insurance OtherPI-75 75 - Services to Finance and Insurance OtherPI-77 77 - Property Services OtherPI-78 78 - Business Services OtherPI-81 81 - Government Administration OtherPI-82 82 - Defence OtherPI-84 84 - Education OtherPI-86 86 - Health Services OtherPI-87 87 - Community Services OtherPI-91 91 - Motion Picture, Radio and Television Services OtherPI-92 92 - Libraries, Museums and the Arts OtherPI-93 93 - Sport and Recreation OtherPI-95 95 - Personal Services OtherPI-96 96 - Other Services OtherPI-97 97 - Private Households Employing Staff OtherPI-A A - Financial occupations FinancePI-B B - General Consultants General_ConsultPI-C C - Medical & Paramedical occupations MedicalPI-D D - Legal & Para Legal occupations LegalPI-E E - Real Estate occupations Real_EstatePI-F F - Agricultural, Horticultural occupations AgriculturePI-G G - Schools, Colleges occupations SchoolsPI-H H - Insurance occupations InsurancePI-I I - Local Government occupations Local_GovPI-J J - Miscellaneous occupations OtherPI-K K - Architects ArchitectsPI-L L - Engineering occupations EngineeringPI-M M - Surveying occupations SurveyingPI-N N - Defamation DefamationPI-O O - Multiple occupations MultiplePI-UN UNK - Unknown Other