profit prediction for baby products
TRANSCRIPT

0
PROFIT PREDICTION FOR BABY PRODUCTS
BASED ON CONSUMERS’ PURCHASING
BEHAVIOR
NURSYAZA BINTI HUSSIN
Bachelor of Computer Science (Software Development)
Faculty of Informatics and Computing
Universiti Sultan Zainal Abidin
2018

i
DECLARATION
This dissertation is submit as a partial fulfilment for the award of a Bachelor of
Computer Science (Software Development) with Honours at the University Sultan Zainal
Abidin (UniSZA), Terengganu, Malaysia. This work is a result of my investigation. All
section of the text and results, which have been obtaining from other sources are fully
referenced.
Signature : ………………………..
Name : Nursyaza Binti Hussin
Date : 23 December 2018

ii
CONFIRMATION
This project report titled Profit Prediction for Baby Products Based On Consumers’
Purchasing Behavior was prepared and submitted by Nursyaza Binti Hussin and has been
found satisfactory in terms of scope, quality and presentation as a part of fulfillment of the
requirement for the Bachelor of Computer Science (Software Development) with Honours
in University Sultan Zainal Abidin.
Signature : …………………………...
Supervisor : Mr. Mohd Isa Bin Awang
Date : 23 December 2018

iii
ACKNOWLEDGEMENT
I would like to express my deepest appreciation to all who provided me the possibility
complete this report. A special gratitude goes to my supervisor, Mr. Mohd Isa Bin Awang
for guiding me in the development of this project. My warmest gratitude for my Final Year
Project panels for aiding my system and giving the feedback and valuable guidance.
I take this opportunity to thank my parents and my family for giving moral support
and encouragement. Special thanks to all lectures under Faculty of Informatics and
Computing for their attentions, guidance and advice in developing this project. I, sincere
thanks to my fellow friends for their help in finishing this project.

iv
ABSTRACT
Anakku is the trusted baby brand in Malaysia that offers all categories of childcare.
The company find it difficult to calculate profit based on baby products sales because of
the different cost and sale by each product. It also hard to estimate future business
performance. Profit prediction for baby products based on consumers’ purchasing behavior
system is a business method for Anakku baby brand. The system aims to facilitate
customers to make reservations and facilitate management to manage baby product stocks
effectively. The technique to be adapted in the project is to use the least square method
which is a way to generate profit forecasts in the future. Forecasting sales and profits is
essential to planning for business success. This process estimating future business
performance based on the actual profits from prior periods, enables the baby shop owner to
modify the operation of the business on a timely basis. This allows the business to avoid
losses or major financial problems should some future results from operations not conform
with reasonable expectations.

v
ABSTRAK
Anakku adalah jenama bayi yang dipercayai di Malaysia yang menawarkan semua
kategori penjagaan anak. Syarikat ini sukar untuk mengira keuntungan berdasarkan
penjualan produk bayi kerana kos dan jualan yang berbeza oleh setiap produk. Ia juga sukar
untuk menganggarkan prestasi perniagaan masa hadapan. “Profit prediction based on
consumers’ purchasing behavior” adalah kaedah perniagaan untuk jenama bayi Anakku.
Sistem ini bertujuan untuk memudahkan pelanggan membuat tempahan dan memudahkan
pengurusan untuk menguruskan stok produk bayi dengan berkesan. Teknik yang akan
disesuaikan dalam projek ini adalah menggunakan “least square method” yang merupakan
cara untuk menjana ramalan keuntungan pada masa akan datang. Peramalan jualan dan
keuntungan adalah penting untuk merancang kejayaan perniagaan. Ini membolehkan
perniagaan untuk mengelakkan kerugian atau masalah kewangan utama sekiranya beberapa
keputusan masa depan dari operasi tidak sesuai dengan harapan yang munasabah.

vi
TABLE OF CONTENTS
DECLARATION ................................................................................................................. i
CONFIRMATION ............................................................................................................ ii
ACKNOWLEDGEMENT ............................................................................................... iii
ABSTRACT ....................................................................................................................... iv
ABSTRAK .......................................................................................................................... v
TABLE OF CONTENTS ................................................................................................. vi
LIST OF TABLES ......................................................................................................... viii
LIST OF FIGURES .......................................................................................................... ix
LIST OF ABBREVIATIONS / TERMS / SYMBOLS ................................................... x
CHAPTER 1 ....................................................................................................................... 1
1.1 Background .................................................................................................................... 1
1.2 Problem Statement ......................................................................................................... 3
1.3 Objective ........................................................................................................................ 4
1.4 Scope .............................................................................................................................. 5
1.5 Limitation of Works ....................................................................................................... 5
1.5 Expected Results ............................................................................................................ 6
1.6 Activities and Milestones ............................................................................................... 7
1.7 Summary ........................................................................................................................ 8
CHAPTER 2 ....................................................................................................................... 9
2.1 Introduction .................................................................................................................... 9
2.2 Related Research Techniques and Tools ..................................................................... 10
2.3 Least Square Method ................................................................................................... 12
2.4 Summary ...................................................................................................................... 14
CHAPTER 3 ..................................................................................................................... 15
3.1 Introduction .................................................................................................................. 15
3.2 Agile development ....................................................................................................... 16
3.2.1 Requirements Phase .............................................................................................. 17
3.2.2 Planning Phase ...................................................................................................... 17

vii
3.2.3 Design Phase ......................................................................................................... 17
3.2.4 Development Phase ............................................................................................... 18
3.2.5 Release Phase ........................................................................................................ 18
3.2.6 Track and Monitoring Phase ................................................................................. 18
3.3 Software and Hardware Requirement ......................................................................... 19
3.3.1 Software Requirement ........................................................................................... 19
3.3.2 Hardware Requirement ......................................................................................... 20
3.4 Framework ................................................................................................................... 21
3.5 Context Diagram .......................................................................................................... 22
3.5.1 System Flow .......................................................................................................... 23
3.6 Data Flow Diagram ...................................................................................................... 24
3.6.1 Data Flow Diagram Level 0 .................................................................................. 24
3.6.2 Data Flow Diagram Level 1 .................................................................................. 26
3.6.2.1 Data Flow Diagram Level 1 for Sign Up : ..................................................... 26
3.6.2.2 Data Flow Diagram Level 1 for Manage Product : ........................................ 27
3.7 Entity Relationship Diagram ........................................................................................ 28
3.8 Data Dictionary ............................................................................................................ 29
3.8.1 TABLE user .......................................................................................................... 30
3.8.2 TABLE product ..................................................................................................... 30
3.8.3 TABLE orderpro ................................................................................................... 30
3.8.4 TABLE payment ................................................................................................... 31
3.8.5 TABLE profit ........................................................................................................ 31
3.9 Algorithm and Technique ............................................................................................ 32
3.9.1 Gross Profit ........................................................................................................... 32
3.9.1.2 Example data and calculation ......................................................................... 33
3.9.2 Least Square Method ............................................................................................. 34
3.9.2.3 Example data and calculation ......................................................................... 35
3.10 Summary .................................................................................................................... 37
REFERENCES ................................................................................................................. 38

viii
LIST OF TABLES
TABLE
TITLE
PAGE
Table 1.1
Gantt chart 7
Table 3.1
Software Requirement 19
Table 3.2 Hardware Requirement
20
Table 3.3 Gross profit example data
33
Table 3.4
Least square method example data
35
Table 3.5
Least square method Y’ result 36

ix
LIST OF FIGURES
FIGURE
TITLE PAGE
Figure 3.1 Agile development
36
Figure 3.2
Framework 21
Figure 3.3
Context Diagram 22
Figure 3.4
Data Flow Diagram Level 0 24
Figure 3.5
Data Flow Diagram sign up Level 1 26
Figure 3.6
Data Flow Diagram manage product Level 1 27
Figure 3.7
Entity relationship diagram 28
Figure 3.8
Table user 30
Figure 3.9
Table product 30
Figure 3.10
Table orderpro 30
Figure 3.11
Table payment 31
Figure 3.12
Table profit 31

x
LIST OF ABBREVIATIONS / TERMS / SYMBOLS
CD
Context Diagram
DFD Data Flow Diagram
ERD Entity Relationship Diagram
SDLC System Development Life Cycle
COGS Cost of Goods Sold

1
CHAPTER 1
INTRODUCTION
1.1 Background
Anakku is the trusted baby brand in Malaysia that offers all categories of childcare.
The brand received recognition from the Malaysian Textile Manufacturer Association
(MTMA). Anakku started manufacturing and marketing a wide range of basic baby apparel.
Anakku has a wide variety of products that are competitively priced for a wide market
segment. Parents wanted more than just comfortable apparel that lasts. Then, Anakku went
the extra mile to further expand its range to include fashion wear for babies and toddlers,
feeding equipment, toiletries for both parents and babies, accessories, baby wipes, strollers,
playpens and more.
2
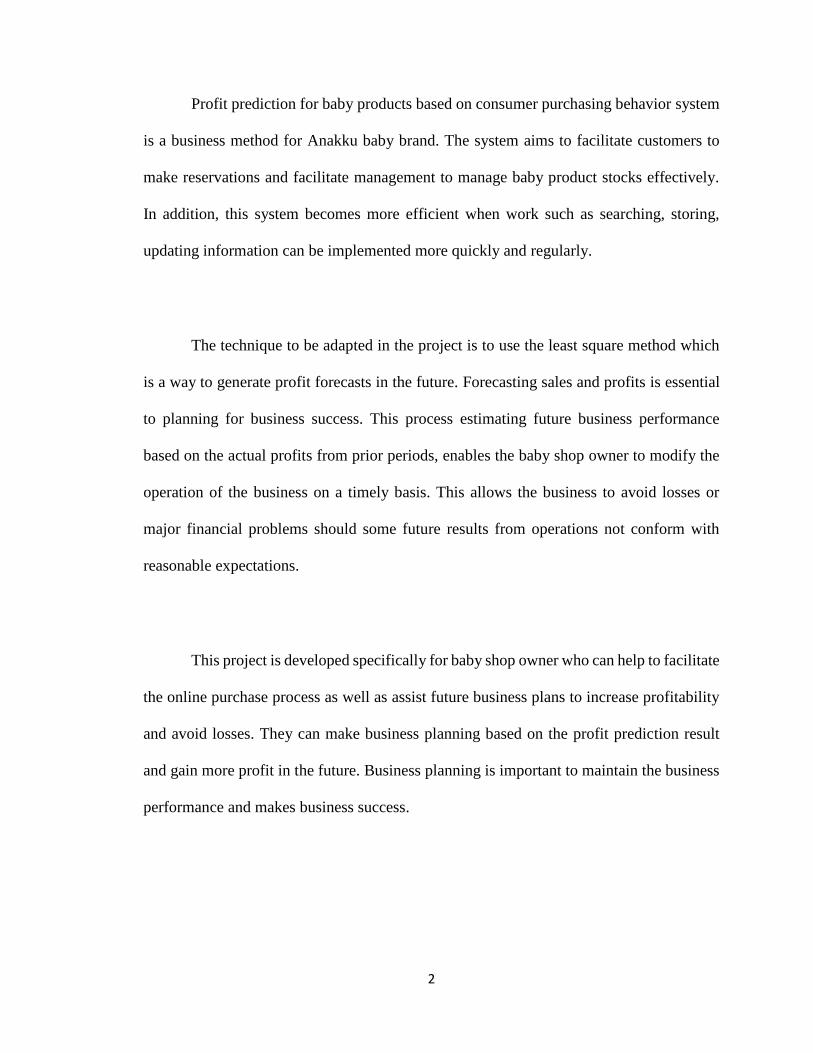
Profit prediction for baby products based on consumer purchasing behavior system
is a business method for Anakku baby brand. The system aims to facilitate customers to
make reservations and facilitate management to manage baby product stocks effectively.
In addition, this system becomes more efficient when work such as searching, storing,
updating information can be implemented more quickly and regularly.
The technique to be adapted in the project is to use the least square method which
is a way to generate profit forecasts in the future. Forecasting sales and profits is essential
to planning for business success. This process estimating future business performance
based on the actual profits from prior periods, enables the baby shop owner to modify the
operation of the business on a timely basis. This allows the business to avoid losses or
major financial problems should some future results from operations not conform with
reasonable expectations.
This project is developed specifically for baby shop owner who can help to facilitate
the online purchase process as well as assist future business plans to increase profitability
and avoid losses. They can make business planning based on the profit prediction result
and gain more profit in the future. Business planning is important to maintain the business
performance and makes business success.

3
1.2 Problem Statement
1) Difficulties to gauge profitability by baby products sales
The company find it difficult to calculate profit based on baby products sales
because of the different cost and sale by each product. Each product has their own
cost to be produced and the cost are including the cost of expenses and the cost of
goods sold. So, the calculation is different by each product and takes time to
calculate. Profit is income earned by the sales and it is very important part because
wrong calculation will affect the business future.
2) Arduous in estimates future business performance
Estimating future business performance based on the actual profits from
prior periods, enables the manager to modify the operation of the business on a
timely basis. Prediction for future profit can shows which product are profitable and
which product are making a loss. The business needs to avoid losses or major
financial problems should some future results from operations not conform with
reasonable expectations.

4
1.3 Objective
1) To design a system for ordering and manage baby products
This is an online shopping system for customer to make an order for baby
products and facilitate management to manage baby products stocks.
2) To implement least square method to forecast profit in selected period of times
The system using least square method to forecast profit by month. The
calculation is made by the actual past month profits sale and makes forecasting
profit.
3) To test the capabilities of the system and produce profit forecast based on sales
Customer can easily make an order for baby products and facilitate
management to manage baby products stocks effectively. The system can calculate
profit for baby products and profit forecasting for a next month.

5
1.4 Scope
The scope for this project is identified and divided by two which is Customer and Admin.
1) Customer
Customer can register to system before able to login the system using email
and password. Customer can view all the products and the details. Customer can
order the product and update the order before makes a confirmation. After makes a
confirmation, customer can make a payment based on their orders. Customer also
can check on their order status.
2) Admin
Admin can manage baby products stock with update the details and quantity
of availability baby products stock. Admin can view the customer’s order and
payment to manage the process of product delivery. Admin can view the profit by
the product categories and month. Admin can view the prediction of future profit
by product. Admin also can view the all system report.
1.5 Limitation of Works
The limitation of this system is the system can be used only for “Anakku” baby
store. In this system, admin able to view the profit by categories and profit prediction
only for next month.
6
1.5 Expected Results
The expected results of this system are :
• Able to view profitability based on baby products sales
• Forecasting profit for baby products based on the actual profits from prior
periods to estimates future business performance
7
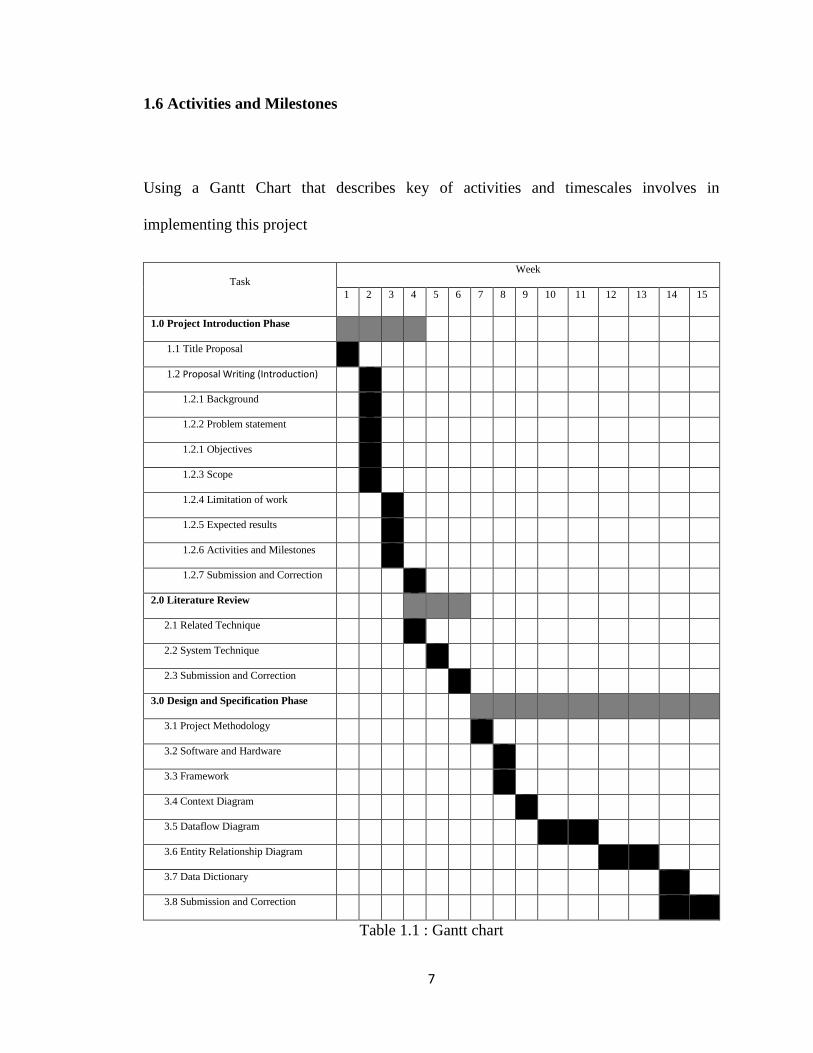
1.6 Activities and Milestones
Using a Gantt Chart that describes key of activities and timescales involves in
implementing this project
Task
Week
1 2 3 4 5 6 7 8 9 10 11 12 13 14 15
1.0 Project Introduction Phase
1.1 Title Proposal
1.2 Proposal Writing (Introduction)
1.2.1 Background
1.2.2 Problem statement
1.2.1 Objectives
1.2.3 Scope
1.2.4 Limitation of work
1.2.5 Expected results
1.2.6 Activities and Milestones
1.2.7 Submission and Correction
2.0 Literature Review
2.1 Related Technique
2.2 System Technique
2.3 Submission and Correction
3.0 Design and Specification Phase
3.1 Project Methodology
3.2 Software and Hardware
3.3 Framework
3.4 Context Diagram
3.5 Dataflow Diagram
3.6 Entity Relationship Diagram
3.7 Data Dictionary
3.8 Submission and Correction
Table 1.1 : Gantt chart

8
1.7 Summary
Overall in this chapter, it was briefly explained about the background, problem
statement, objectives, scope, limitation of work, expected outcome, activities and
milestones. Based on this chapter, we can see the aim and target that system should achieve
and overcome problem by the expected outcome.

9
CHAPTER 2
LITERATURE REVIEW
2.1 Introduction
In this chapter, the significant literatures is reviewed which described how this
project relates with existing research. The system related research is on forecasting
technique. Other forecasting methods are compared to for better understanding for method
used in this system. There are various technique and methods that had been used in order
to make an accurate forecasting. Each method is used for different approaches targeting for
different businesses.

10
2.2 Related Research Techniques and Tools
First article Is (CLAUDIMAR PEREIRA DA VEIGA, 2014) stated the present article aims
the comparison between two linear demand forecasting models which is The
Autoregressive Integrated Moving Average (ARIMA) model and the Holt-Winters (HW)
model. These techniques have exceptional adaptive capacity to deal with the linearity in
problem solving. The ARIMA forecasting model does not always have the desired accuracy
for a given range. In addition, ARIMA model has many assumptions that cannot be met.
One of the most important assumptions is that the historical pattern of the data will not
change during the forecast period. The Holt-Winters model is simple and can provide
accurate forecasting results as those obtained with more complex techniques. However, it
is recommended that the horizon of the predictions made with the Holt-Winters method
does not exceed the seasonal cycle of the series, because the predictions with a larger
horizon tend to have reduced accuracy.
Second article is Kumar (2013) applied various statistical time series models to
observe forecast errors in the demand of juice production are within the expected limit and
to select a forecasting technique which has a less relative error and showed that Least
Square Method is more accurate than the others. To forecast milk production in India using
statistical time series modeling- Double Exponential Smoothing and Auto- Regressive
Integrated Moving Average and concluded that ARIMA performed better than the others.

11
Third article is (Sonia Akhter**, September 2016) stated a forecast is an estimate
of an event which will happen in future. The event may be demand of a product, rainfall at
a particular place, population of a country, or growth of a technology. Forecasting provides
a basis for coordination of plans for activities in various part of a company. Application of
different method for demand forecasting is Simple Moving Average Method, Weighted
Moving Average Method, Simple Exponential Smoothing Method and Least Square
Method. Forecasting of Coca-Cola production has done by using statistical methods,
(Moving Average method, Simple Exponential Method and Least Square Method).
Statistical methods are chosen because of their rich historic data and ease of their use.
Finally, their performance was evaluated by comparing the MAPE, MAD and MSE
obtained from the different methods. The results show that Simple Exponential Smoothing
method is more accurate than the other methods.

12
2.3 Least Square Method
To predict the mean y-value for a given t-value, the line which passes through the
mean value of both t and y and which minimizes the sum of the distance between each of
the points and the predictive line. Such an approach should result in a line which we can
call a "best fit" to the sample data. The least squares method achieves this result by
calculating the minimum average squared deviations between the sample y points and the
estimated line. A procedure is sued for finding the values of a and b which reduces to the
solution of simultaneous linear equations. Shortcut formulas have been developed as an
alternative to the solution of simultaneous equations.
The estimation of trend analysis can be use least square method as one of the time
series models. Least square method is a method of constructing a straight line equation
through data points to obtain the best fitting line. This is the mathematical method of
obtaining the line of best fit between the dependent variable and an independent variable.
In this, the sum of the square of the deviations of the various points from the line of best fit
is most minimum or least. For straight line,
𝑌′=𝑎+𝑏𝑡
where 𝑌′ is estimated value of the variable 𝑌′ for a given value of 𝑡 and 𝑡 is the number of
time periods from 𝑡 = 0, 𝑎 is the value of y at 𝑡=0 (y – intercept) and b is slope of the line.
Parameters a and b can be calculated using the least-squares method.
Steps to forecast using linear line :

13
First, calculate use this formula to get 𝑏
Second, calculate use this formula to get 𝑎
Third, generate the linear trend line
𝒀′=𝒂+𝒃𝒕
Lastly, to make a forecast, use the linear trend line equation and replace the t to get Y’

14
2.4 Summary
Overall in this chapter, the research study is for better understanding in method and
technique use in the system. The selection of accurate techniques is very important to make
sure that the system at the right place before implement the method to system. The system
will successfully develop if the method is suitable for the objective of the system. Based on
the research study, we conclude that the least square method is the best suit for this system.

15
CHAPTER 3
METHODOLOGY
3.1 Introduction
The methodology is the set of the complete guideline that includes the models of
tools to carry out activities in the Software Development Life Cycle (SDLC). SDLC splits
the work into phases of activity for better planning and management of the system
development. In order to achieve the objective of the project, a good planning and
methodology must be done before the later stage of the process began.

16
3.2 Agile development
The methodology that will be used in Profit Prediction based on Consumers’
Purchasing Behavior is Agile development. Agile development is an approach to
project management that is used in software development. This methodology assists the
unpredictability of constructing software and works as an iterative work sequences
which is the activities are repeated until the whole sytem is built.
There are six phases involved in the agile development which is requirements phase,
planning phase, design phase, development phase, release phase, track and monitoring
phase.
Figure 3.1 : Agile development

17
3.2.1 Requirements Phase
At this phase, the process occurred is collecting the requirement and understand the
problems of the system. Find and analysis the existing system while determine their
technique and method involved. Brainstorming the project idea and proposed the title of
the project. Then, Profit Prediction based on Consumers’ Purchasing Behavior based on
consumers’ purchasing behavior was decided.
3.2.2 Planning Phase
During this phase, objectives of the system are identify and all the requirements are
gathered in order to develop the system. Research for the system are being allocated and
research for the system is made by reading articles and journals related to the system and
the method used. System scheduling is created using a gantt chart to ensure that the system
will develop systematically and to make sure the project can be done on time.
3.2.3 Design Phase
Design phase of the system was developed based on the requirement and output
produced during analysis phase. Design the Context Diagram (CD), Data Flow Diagram
(DFD), and Entity Relationship Diagram (ERD) is build to translate the process flow of the
Profit Prediction based on Consumers’ Purchasing Behavior. These diagrams refer as
guidelines while develop this system. Then, designing the interface design of system as a
prototype before develop the system.

18
3.2.4 Development Phase
In this phase, all activities that have been planned during phase before are executed.
The system is developed using XAMPP, MySQL and Notepad++. Database and interface
designed during design phase are started to be developed. The process of writing the coding
are being done and the progress of the system are reported from time to time.
3.2.5 Release Phase
During this phase, the system is released to be used by the user. The users use the
system and give their feedback whether it needs to be improved or there is anything that
needs to be modify.
3.2.6 Track and Monitoring Phase
Track the error and modifications are being made based on the feedback from the
user to make sure the system is completely fulfilling the requirements. Then, monitor the
system to prevent the problem in the future.

19
3.3 Software and Hardware Requirement
In developing a system, hardware and software are required to develop a
successful system.
3.3.1 Software Requirement
Software
Function
Web Browser (Google Chrome) As a platform to run the system
Server (PHPMyAdmin) As a system database
Microsoft Office Word 2010 Used for documentation of the report
Microsoft Powerpoint 2010 Used for slide presentation
Visio To design context diagram and data flow
diagram
Table 3.1 : Software Requirement

20
3.3.2 Hardware Requirement
Hardware
Type/
ASUS - Installed RAM : 8.00 GB
- Processor : Intel® Core ™ i7-
7700HQ @ 2.80- GHz
- System type : 64-bit Operating
System
- Windows edition : Windows 10
Home Single Language
Pendrive SanDisk 16 GB For backup and transfer data
Hard Disk Transcend 1 TB For backup system file
Printer HP Deskjet
For print out document
Table 3.2 : Hardware Requirement

21
3.4 Framework
WEB Server Database
Customer Website Admin
Sign up
Order
Order status
Manage order
Order details
Figure 3.2 : Framework

22
3.5 Context Diagram
Context diagram for Profit Prediction Based On Consumers’ Purchasing Behavior
is shown above. There are two entities are involves in the system which is ADMIN and
CUSTOMER.
Figure 3.3 : Context Diagram

23
3.5.1 System Flow
System flow for Customer :-
1) CUSTOMER register to the system
2) CUSTOMER log in to the system
3) CUSTOMER update the user information
4) CUSTOMER order the product
5) CUSTOMER make the payment of purchase product
6) CUSTOMER get the order stastus
7) CUSTOMER get the order receipt
System flow for ADMIN :-
1) ADMIN log in to the system
2) ADMIN key in and update the product information
3) ADMIN get product report
4) ADMIN get user report
5) ADMIN get order report
6) ADMIN get payment report
7) ADMIN get result of forecast profit

24
3.6 Data Flow Diagram
3.6.1 Data Flow Diagram Level 0
Figure 3.4 : Data Flow Diagram Level 0

25
There are six processes in data flow diagram that involves customer and admin
which is sign up, log in, manage order, payment, manage product, and generate report. First
user is customer. Customer need to sign up first, then login to the system as a first step to
get into the system. After login, Customer can make an order and payment. After that,
customer can check on order status. At the end on the process, customer can be logout from
the system.
Second user is admin. Admin need to login as the first step to get into the system.
Then process that involve admin are manage order, manage product and Generate Report
from the system. At the end on the process, admin can be logout from the system.

26
3.6.2 Data Flow Diagram Level 1
3.6.2.1 Data Flow Diagram Level 1 for Sign Up :
There are two processes in data flow diagram level 1 for sign up that involve
customer which is register and update. Customer need to register and after register,
customer can update customer information.
Figure 3.5 : Data Flow Diagram sign up Level 1

27
3.6.2.2 Data Flow Diagram Level 1 for Manage Product :
There are two processes in data flow diagram level 1 for manage product that
involve admin which is add and update. Admin can add new product and update the
product.
Figure 3.6 : Data Flow Diagram manage product Level 1

28
3.7 Entity Relationship Diagram
An entity relationship diagram (ERD) illustrates an information system’s entities
and the relationship between those entities. ERD composed of three things such as
identifying and defining the entities, determine entities interaction and the cardinality of
the relationship. Five tables that are involved in this system which is user, product,
orderpro, payment and profit.
Figure 3.7 : Entity relationship diagram

29
3.8 Data Dictionary
A data dictionary is a file or a set of files that contains a database's metadata. The
data dictionary contains records about other objects in the database, such as data ownership,
data relationships to other objects, and other data. The data dictionary is a crucial
component of any relational database. Ironically, because of its importance, it is invisible
to most database users. For most relational database management systems (RDBMS), the
database management system software needs the data dictionary to access the data within
a database.
1. TABLE user
2. TABLE product
3. TABLE orderpro
4. TABLE payment
5. TABLE profit

30
3.8.1 TABLE user
3.8.2 TABLE product
3.8.3 TABLE orderpro
Figure 3.8 : Table user
Figure 3.9 : Table product
Figure 3.10 : Table orderpro
31
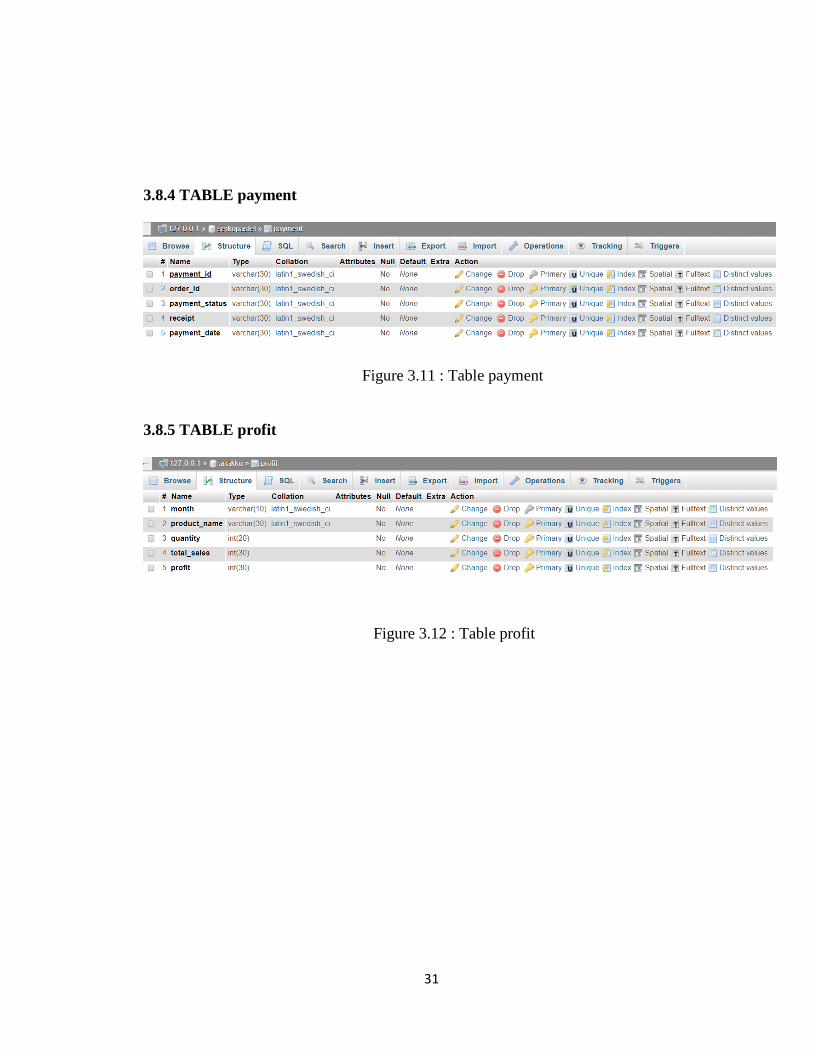
3.8.4 TABLE payment
3.8.5 TABLE profit
Figure 3.11 : Table payment
Figure 3.12 : Table profit

32
3.9 Algorithm and Technique
There are two calculation for this system which is use gross profit formula and least
square method.
3.9.1 Gross Profit
Gross profit is a calculation to calculate profit sales. Gross profit is not include on other
expenses. This is the formula for gross profit :
Revenue – COGS = Gross Profit
• Revenue is a cost used to produce the product
• COGS stand for cost of goods sold which means price to sell

33
3.9.1.2 Example data and calculation
Type Example Data (RM)
Unit cost 80
Price 100
Revenue 400
First, calculate use this formula to get margin,
(Unit cost / price) x 100 = Margin
(80 /100) x100 = 80%
Second, calculate use this formula and to get COGS,
Revenue x Margin = COGS
400 x 80% = 320
Then, calculate use this formula to get gross profit,
Revenue – COGS = Gross Profit
400 – 320 = 80
The gross profit is 80.
Table 3.3 : Gross profit example data

34
3.9.2 Least Square Method
This method is to predict the mean y-value for a given t-value, a line passes through
the mean value of both t and y and which minimizes the sum of the distance between each
of the points and the predictive line. The equation of straight line :
𝑌′=𝑎+𝑏𝑡
• 𝑌′ is the estimated value of the variable 𝑌′ for a given value of 𝑡
• 𝑎 is the intercept on Y-axis (estimated value of Y at 𝑡 = 0)
• 𝑏 is a slope of the line
• 𝑡 is any value of time that is selected
To estimate two unknown parameters (a and b) that give the straight line equation, two
equations need to be solved simultaneously.

35
3.9.2.3 Example data and calculation
This is an example of the data which is given month and profit. The t, tY and tt is
calculate based on the month and profit given.
Month Profit (RM Thousand) t tY tt
January 10 1 10 1
February 20 2 40 4
March 12 3 36 9
April 17 4 68 16
May 23 5 115 25
Σ 82 15 269 55
First, calculate use this formula to get b
Second, calculate use this formula to get a
So, the trend equation is therefore 𝑌′=11.6 + 1.6 𝑡
269 – (82) (15) / 5
55 – (15^2) / 5
= 1.6
(82 / 5) – 1.6 (15 / 5) = 11.6
Table 3.4 : Least square method example data

36
Then, use the trend equation and replace the t to get Y’.
Month Profit (RM Thousand) t Y’
January 10 1 11.6 + 1.6 (1) = 13.2
February 20 2 11.6 + 1.6 (2) = 14.8
March 12 3 11.6 + 1.6 (3) = 16.4
April 17 4 11.6 + 1.6 (4) = 18
May 23 5 11.6 + 1.6 (5) = 19.6
Y’ for January is 13.2, February is 14.8, March is 16.4, April is 18 and May is 19.6. So,
calculation Y’ for June is replace the t with 6.
11.6 + 1.6 (6) = 21.2
Forecast sales for June is 21.2.
Table 3.5 : Least square method Y’ result

37
3.10 Summary
Overall in this chapter, it was briefly explained about the methodology, framework,
Context Diagram (CD), Data Flow Diagram (DFD), Entity Relationship Diagram (ERD)
and show the data dictionary. The methodology is the set of the complete guideline that
includes the models of tools to carry out system activities. The selection of accurate
methodology is very important to make sure that the system is successful implemented and
achieved the objective. A framework is a set of functions within a system and how
communication should be standardized at some level of a network. A framework is
generally more comprehensive than a protocol and more prescriptive than a structure. Then,
Context Diagram, Data Flow Diagram (DFD) and Entity Relationship Diagram (ERD) are
diagram that show the flow of the system works. ERD composed of three things such as
identifying and defining the entities, determine entities interaction and the cardinality of
the relationship. Next, data dictionary is a file or a set of files that contains a database's
metadata. The data dictionary contains records about other objects in the database, such as
data ownership, data relationships to other objects, and other data. The data dictionary is a
crucial component of any relational database. Ironically, because of its importance, it is
invisible to most database users. For most relational database management systems
(RDBMS), the database management system software needs the data dictionary to access
the data within a database.

38
REFERENCES
[1] CLAUDIMAR PEREIRA DA VEIGA, C. R. (2014). Demand forecasting in food
retail: a comparison between the Holt-Winters and ARIMA models. WSEAS
TRANSACTIONS on BUSINESS and ECONOMICS.
[2] Kumar, R and Mahto, D 2013, ‘A case study: Application of Proper
Forecasting Technique in Juice Production’, Global Journal of Researches in
Engineering, vol. 13, no. 4, pp. 1-6.
[3] Sonia Akhter**, M. A. (September 2016). Selection of a Forecasting Technique for
Beverage Production: A Case Study. World Journal of Social Sciences, 148 – 159.
[4] Akhter, S., Rahman, M. A., Koushik, M. R. P., & Hossain, M. M. (2016). Selection of
a Forecasting Technique for Beverage Production: A Case Study. World, 6(3), 148-159.
[5] Barbosa, N de P, Christo, E da S and Costa, KA 2015, ‘Demand Forecasting for
Production Planning in a Food Company’, ARPN Journal of Engineering and Applied
Sciences, vol. 10, no. 16, pp. 7137-7141.
[6] Medhora, N. (n.d.). Kopywriting Kourse. Retrieved from Gross Profit Calculator:
https://kopywritingkourse.com/gross-profit-calculator/
[7] Bizmove Small Business Guides. (n.d.). Retrieved from Sales and Profit Forecasting
Methods: https://www.bizmove.com/finance/m3b4.htm
[8] smallbusiness.chron.com. (n.d.). Retrieved from How to Calculate Using the Gross
Profit Method: https://smallbusiness.chron.com/calculate-using-gross-profit-method-
10591.html