profitability of the property/casualty insurance industry
TRANSCRIPT

UNITED STATES GENERAL ACCOUNTING OFFICE
WASHINGTON, D-C. 20548
FOR RELEASE ON DELIVERY
Expected about 1l:OO a.m.
Thursday, March 13, 1986
STATENENT OF
WILLIAM 3. ANDERSONi DIRECTOR
GENERAL GOVERNMENT DIVISION
BEFORE THE
SUBCOMMITTEE ON OVERSIGHT
COMMITTEE ON WAYS AND NEANS ,
HOUSE OF REPRESENTATIVES
ON
PROFITABILITY bF @ iE PROPERTY/CASUALTY
INSUMNCE INDUSTRY
Ill II 129369

i . .
i
Mr. Chairman and Members of the Subcommittee:
We are pleased for the opportunity to assist the
Subcommittee in its deliberations on the subject of the
insurance industry. We have been actively involved in this area +
for the past 6 years. In 1981 we reported to the Congress on
taxation of life insurance companies,. and in 1985 we reported on'
taxation of the property/casualty insurance industry. We have
testified several times before House and Senate Committees and
have provided them with additional information on related
issues, including the financial status of the industry.1
It is this status that we will address in our remarks
today. In this regard, I will provide some background
information on property/casualty company pricing strategies, a
financial overview of the industry, and the financial impact of
certain liability insurance lines.
PROPERTY/CASUALTY COMPANY PRICING STRATEGIES
Basically, a property/casualty company derives its income
from two areas: underwriting gains (the excess of premiums over
claims and expenses) and investment gains. Because of
investment gains, a property/casualty company can have net
income even though its premium revenues alone are not large
enough to cover claims and expenses.
'See attachment I for list of GAO studies and testimony.

,
The ability to offset underwriting losses with investment
income plays an important role in a company's pricing
strategy--that is, the amount it charges for the insurance that
it offers. For a number of years, many companies have been
willing to accept lower premiums in order to compete for certain
insurance lines, even though claims and expenses exceeded the
premiums. As a result, claims and expenses in 1984 exceeded ,
premium revenues by more than 18 percent.
The companies, however, expect to make up the premium
shortfall through investment income. .Through the incremental
volume of premiums resulting from this pricing approach,
companies are able to generate a larger- amount of net cash flow
which they can then invest to earn additional investment
income. For instance, in 1983 the industry's claims and
expenses exceeded premiums by about 12 percent, which produced
an underwriting loss of about $11 billion. Even so, the
industry had a net gain of about $8 billion and generated a
total of about $12.1 billion in net cash flow, due to its
pricing strategy and investment income.
In past years, investment gains, in the aggregate, have
exceeded underwriting losses by a fairly wide margin. However,'
the gap has been narrowing in recent years and disappeared in
1984, when underwriting losses for the industry were S'I9.4
billion, while the investment gain was $17.9 billion. Some
companies have reacted to this situation by sharply raising
premiums.

.
‘.
FINANCIAL OVERVIEW OF THE
PROPERTY/CASUALTY INDUSTRY
We developed a financial overview of the property/casualty
insurance industry by studying financial data for the
lo-year period, 1975 through 1984. We obtained these data from
Bests' Aggregates and Averages. While Bests' reports omit
figures for many small or new companies, we believe that the ,
data are representative of the overall financial results of the
property/casualty industry.
In tables 1 and 2 we show sources of income, broken out by
underwriting gains, investment gains, and total gains. We also
show disposition of income, broken out by the increase in
surplus, dividends to stockholders, and the combined total.
Federal income taxes are also shown.
We show in table 1 that, while property/casualty companies
had about $46 billion in underwriting losses from 1975 through
1984, they also had about $121 billion in investment gains
during this period, resulting in a net gain of about $75 billion
for those years. From 1975 through 1984, federal income taxes
were a negative $125 million, a rate of minus 0.2 percent of the
net gain.

Table 1
Underwriting gains (loss)
($45.8)
Table 2
All Companies -- Consolidated Basis 1975 through 1984
(in billions of dollars)
Percentage of federal
Investment Net Federal income tax gains gains income tax to net gains '
$121.0 $75.2 ($0.125) (0.2)
shows that about $48 billion of property/casualty
companies' income from 1975 through 1984 was used to increase
surplus, and $18.5 billion was paid to stockholders in the form
of dividends.
Table 2
All Companies -- Consolidated Basis 1975 through 1984
(in billions of dollars
Increase Dividends to in surplus stockholders
$47.8 $18.5
Total
$66.3
Tables 1 and 2 show that from 1975 through 1984 the
industry as a whole, in spite of its underwriting losses, had
positive net gains, yet had a negative federal income tax rate
in relation to its net gains.
While firm figures for the industry's financial performance
in 1985 are not yet available, Best's Insurance Management
Reports, dated December 30, 1985, contains some estimates. For
a number of reasons, including the pricing strategies referred
to earlier, the underwriting losses in 1984 reached record highs
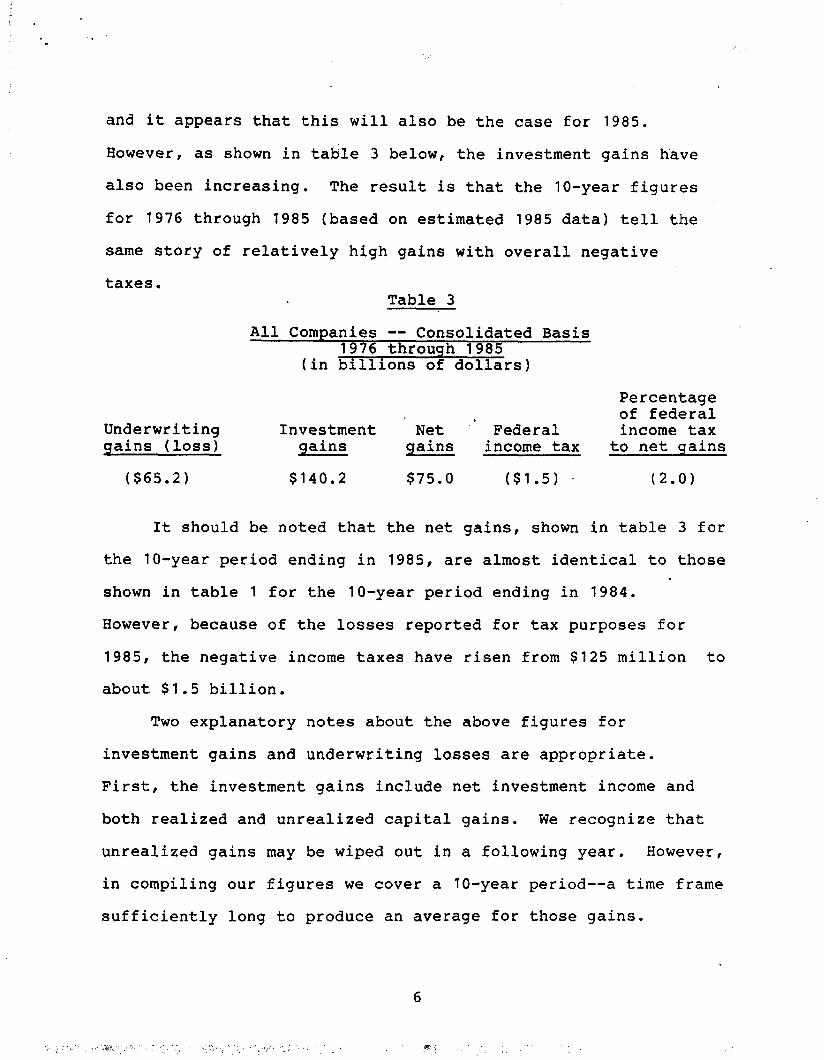
and it appears that this will also be the case for 1985.
However, as shown in table 3 below, the investment gains have
also been increasing. The result is that the lo-year figures
for 1976 through 1985 (based on estimated 1985 data) tell the
same story of relatively high gains with overall negative
taxes. Table 3
All Companies -- Consolidated Basis 1976 through 1985
(in billions of dollars)
Underwriting qains (loss)
($65.2)
Percentage of federal
Investment . Net " Federal income tax qains qains income tax to net qains
$140.2 $75.0 ($1.5) . (2.0)
It should be noted that the net gains, shown in table 3 for
the lo-year period ending in 1985, are almost identical to those
shown in table 1 for the lo-year period ending in 7984.
However, because of the losses reported for tax purposes for
1985, the negative income taxes have risen from $125 million to
about $1.5 billion.
Two explanatory notes about the above figures for
investment gains and underwriting losses are appropriate.
First, the investment gains include net investment income and
both realized and unrealized capital gains. We recognize that
unrealized gains may be wiped out in a following year. However,
in compiling our figures we cover a lo-year period--a time frame
sufficiently long to produce an average for those gains.

Second, the underwriting losses do not reflect policyholder
dividends. We consider these dividends to be voluntary
distributions by the companies.
The foregoing tables show that over the lo-year period,
from 1976 to 1985, the investment gains of the industry exceeded
the underwriting losses, giving the companies a net gain before
taxes of $75 billion. However, it should be.pointed out again
that in the most recent years there has been very little, if
any, excess of investment gains over underwriting losses.
Cyclical Nature of the Industry
While we believe it is important to look at the figures for
the most recent years, we also believe that the industry is
particularly subject to profit and loss cycles. For that reason
we believe that data covering longer periods gives a more
complete picture of the industry's profitability.
Unlike most other industries the property/casualty
insurance industry is flexible with respect to capacity. When
times are good, insurance companies can increase their capacity,
take varied and greater risks, and generally lower their premium
rates in order to achieve a greater market share. This results
in a change from favorable premium profit margins to unfavorable
margins, resulting in profit and loss cycles. Thus, the
industry pricing strategy can result in financial cyclicity.
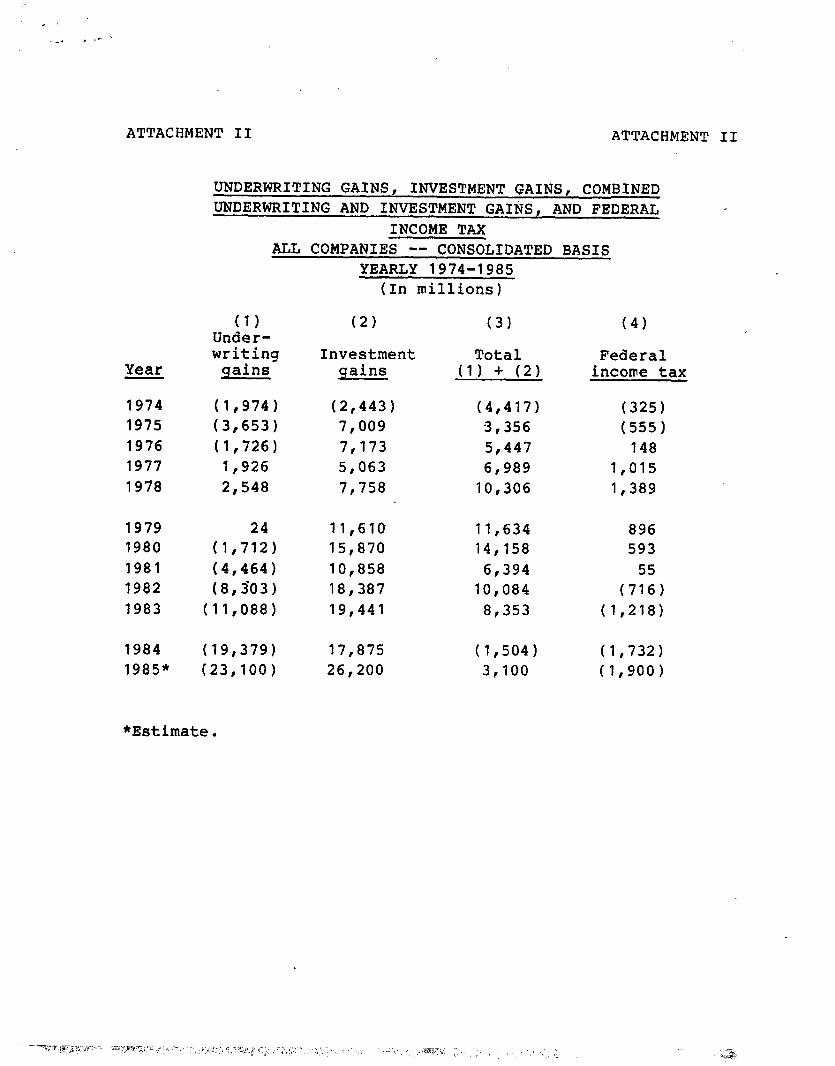
Attachment II shows the year-by-year figures for
underwriting gains and investment gains for the f2-year period
.,
from 1974 through 1985. Column 1 in that table, underwriting
gains, illustrates the cyclical nature of the industry. The
earlier cycle bottomed out in 1975 and peaked in 1978. Since
1980, underwriting losses have mounted again but are estimated
to have bottomed out in 1985.
Financial Outlook for the Industry Appears Favorable
From all indications it seems that the trend towards larger
and larger underwriting losses has peaked. Industry estimates
that have been made available to us show that over the next 5
years the industry expects substantial net gains. Our
calculations, made from industry estimates, indicate an expected
net gain before taxes of over $90 billion for the years
1986-1990.
Others also predict favorable prospects for the industry.
An August 1985 study by Salomon Brothers, Inc.,2 forecasts that
premiums written will grow at a 12 percent annual rate over the
1985-l 989 period. The same study forecasts a 10 percent growth
rate for incurred losses over the period and improved
underwriting results. The study forecasts further that industry
profits will rise annually at a rate of 25 percent for 1985-1989
corporations over the same period. More recently, the Best’s
2Salomon Brothers, Inc., Property/Casualty Insurance Organizations, Five-Year Review and Outlook, 1985 edition, August 1985;
8

Insurance Manaqement Reports, dated December 30, 1985, estimated
that net premiums written in 1985 would increase by 21 percent
over net premiums written in 1984.
IMPACT OF LIABILITY LINES
The lack of availability of property/casualty insurance
does not apply across the board to all lines. Rather it is
found principally in certain liability lines. These lines do
not represent a major portion of the total property/casualty
insurance business.
.- Two of the insurance lines often mentioned in the context
of high premiums and lack of availability are medical
malpractice and general liability. The following table shows,
for the years 1984 and 1985, the relationship that these two
lines have with respect to the total property/casualty
industry.
I
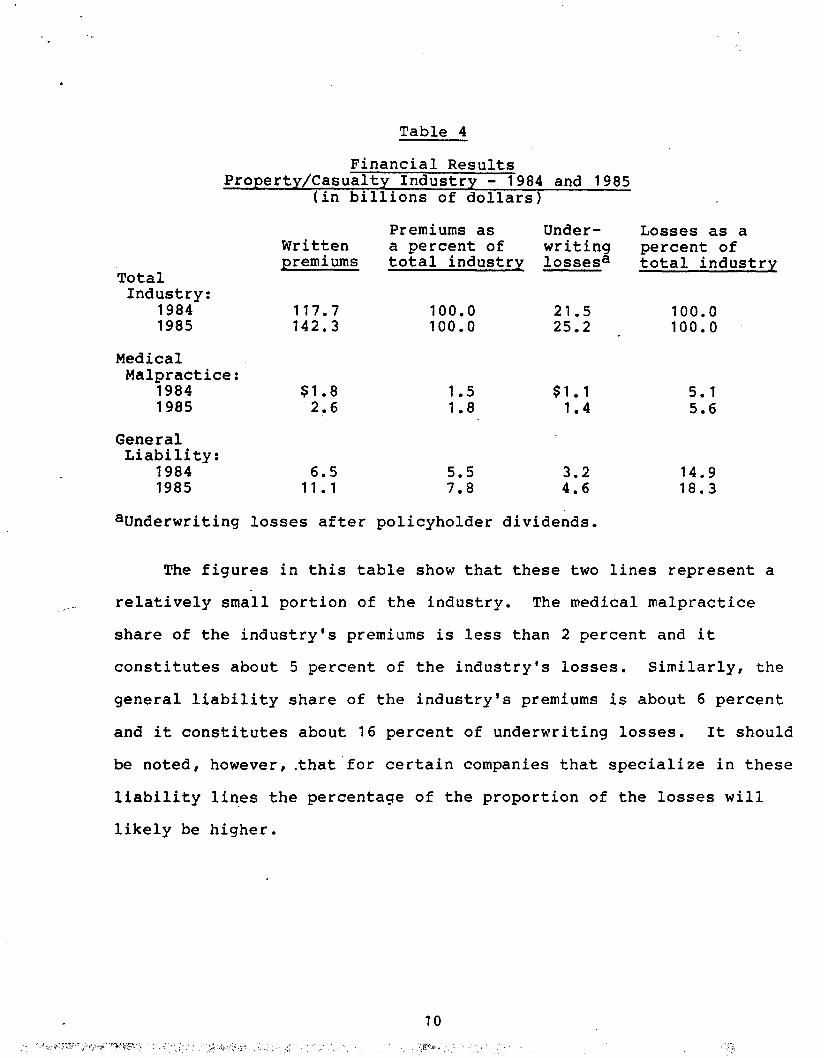
Table 4
Financial Results Property/Casualty Industry - 1984 and 1985
(in billions of dollars)
Total Industry:
1984 1985
Prem iums as Under- W ritten a percent of writing prem iums total industry lossesa
117.7 100.0 21.5 142.3 100.0 25.2
Losses as a
Medical Malpractice:
1984 1985
$1.8 1.5 $1.1 2.6 1.8 1.4
General Liability:
1984 1985
6.5 5.5 3.2 14.9 11.1 7.8 4.6 18.3
percent of total industry
100.0 100.0 '
5.1 5.6
aunderwriting losses after policyholder dividends.
The figures in this table show that these two lines represent a
_“_- relatively small portion of the industry. The medical malpractice
share of the industry's prem iums is less than 2 percent and it
constitutes about 5 percent of the industry's losses. Similarly, the
general liability share of the industry's prem iums is about 6 percent
and it constitutes about 16 percent of underwriting losses. It should
be noted, however , .that'for certain companies that specialize in these
liability lines the percentage of the proportion of the losses will
likely be higher.

It should also be noted that these two liability lines
represent proportionately more of the industry's investment
gains than of the industry's premiums. For example, medical
malpractice lines constitute about 6 percent and general liability
lines constitute about 14 percent of the industry's investment gains.
CONCLUSION.
In conclusion, Mr. Chairman, available financial
information for a recent lo-year period indicates that the
property/casualty industry is cyclicaL in nature. The data
further indicates that over this period the industry has been
profitable. The profitability has been lower in more recent
years; however, the industry projects increasing premium volumes
and more favorable prospects for the next few years. The data
also show that while medical malpractice and general liability
insurance have received considerable attention recently, they
represent a relatively small portion of the industry overall.
That concludes my statement Mr. Chairman. We would be
pleased to respond to questions.

,
.
A T T A C H M E N T I A T T A C H M E N T I
G A O S T U D IE S A N D T E S T IM O N IE S R E G A R D IN G T H E IN S U R A N C E IN D U S T R Y
S e p te m b e r 1 9 8 1 - D e c e m b e r 1 9 8 5
R e p o rts a n d F a c t S h e e ts
" B i l l i o n s o f D o l l a rs A re In v o l v e d In T a x a ti o n o f th e L i fe In s u ra n c e In d u s try --S o m e C o rre c ti o n s i n th e L a w A re N e e d e d " ( P A D - 8 1 -1 , S e p te m b e r 1 7 , 1 9 8 1 )
"M o d i fi e d C o i n s u ra n c e a n d Its U s e b y S o m e L i fe In s u ra n c e C o m p a n i e s to R e d u c e T a x e s " ( P A D - 8 2 -3 3 , A p ri l 1 4 , 1 9 8 2 )
"C o n g re s s S h o u l d C o n s i d e r C h a n g i n g F e d e ra l In c o m e T a x a ti o n o f th e P ro p e rty /C a s u a l ty In s u ra n c e In d u s try " (G A O /G G D -8 5 -1 0 , M a rc h 2 5 , 1 9 8 5 )
"In fo rm a ti o n o n H o w th e P ro p e rty /C a s u a l ty In s u ra n c e In d u s try i s T a x e d " (G A O /G G D -8 6 -1 6 F S , O c to b e r 1 6 ,1 9 8 5 )
"In fo rm a ti o n o n th e S to c k a n d M u tu a l S e g m e n ts o f th e L i fe In s u ra n c e In d u s try (G A O /G G D -8 6 -3 1 F S , D e c e m b e r 1 2 , 1 9 8 5 )
T e s ti m o n y
M a rc h 1 8 , 1 9 8 2 o n L i fe In s u ra n c e T a x a ti o n b e fo re th e S e n a te F i n a n c e C o m m i tte e
M a y 1 0 , 1 9 8 3 o n L i fe In s u ra n c e T a x a ti o n , b e fo re th e S u b c o m m i tte e o n S e l e c t R e v e n u e M e a s u re s , H o u s e W a y s a n d M e a n s C o m m i tte e
J u n e 1 3 , 1 9 8 3 o n P ro p e rty /C a s u a l ty In s u ra n c e T a x a ti o n b e fo re th e S e n a te F i n a n c e C o m m i tte e
M a y 1 7 , 1 9 8 5 o n P ro p e rty /C a s u a l ty T a x a ti o n , s ta te m e n t fo r th e re c o rd fo r th e S u b c o m m i tte e o n E c o n o m i c S ta b i l i z a ti o n , H o u s e B a n k i n g , F i n a n c e , a n d U rb a n A ffa i rs C o m m i tte e
J u l y 1 9 , 1 9 8 5 o n P ro p e rty /C a s u a l ty a n d L i fe In s u ra n c e T a x a ti o n b e fo re th e H o u s e W a y s a n d M e a n s C o m m i tte e
O c to b e r 1 , 1 9 8 5 o n P ro p e rty /C a s u a l ty a n d L i fe In s u ra n c e T a x a ti o n b e fo re th e S e n a te F i n a n c e C o m m i tte e
ATTACHMENT II ATTACHMENT II
UNDERWRITING GAINS, INVESTMENT GAINS, COMBINED UNDERWRITING AND INVESTMENT GA&, AND FEDERAL
INCOME TAX
Year
1974 1975 1976 1977 1978
1979 1980 1981 1982 1983
1984 1985"
(1) Under- writing
qains
(1,974) (3,653) (1,726)
1,926 2,548
24 (1,712) (4,464) (8,303)
(11,088)
(19,379) (23,100)
ALL COMPANIES -- CONSOLIDATED BASIS
*Estimate.
YEARLY 1974-1985 (In millions)
(2) (31
Investment Total gains (1) + (2)
(2,443) (4,417) 7,009 3,356 7,173 5,447 5,063 6,989 7,758 10,306
11,610 11,634 15,870 14,158 10,858 6,394 18,387 10,084 19,441 8,353
17,875 (1,504) 26,200 3,100
(4)
Federal income tax
(325) (555)
148 1,015 1,389
896 593
55 (716)
(1,218)
(1,732) (1,900)