proflex pcr system kit validation - thermo fisher...
TRANSCRIPT
USER BULLETIN
For Forensic or Paternity Use Only.
ProFlex™ PCR System Kit ValidationPub. No. 100031595 Rev. A
SUBJECT: PCR Amplification Kit validation on the ProFlex™ PCR System
■ Overview . . . . . . . . . . . . . . . . . . . . . . . . . . . . . . . . . . . . . . . . . . . . . . . . . . . . . . . . . . . . . 1
■ Validation Studies. . . . . . . . . . . . . . . . . . . . . . . . . . . . . . . . . . . . . . . . . . . . . . . . . . . . . . 2
■ Materials and methods . . . . . . . . . . . . . . . . . . . . . . . . . . . . . . . . . . . . . . . . . . . . . . . . . 3
■ Data analysis . . . . . . . . . . . . . . . . . . . . . . . . . . . . . . . . . . . . . . . . . . . . . . . . . . . . . . . . . . 5
■ Results . . . . . . . . . . . . . . . . . . . . . . . . . . . . . . . . . . . . . . . . . . . . . . . . . . . . . . . . . . . . . . . 6
■ Discussion . . . . . . . . . . . . . . . . . . . . . . . . . . . . . . . . . . . . . . . . . . . . . . . . . . . . . . . . . . . 27
■ Conclusions . . . . . . . . . . . . . . . . . . . . . . . . . . . . . . . . . . . . . . . . . . . . . . . . . . . . . . . . . . 28
■ References . . . . . . . . . . . . . . . . . . . . . . . . . . . . . . . . . . . . . . . . . . . . . . . . . . . . . . . . . . . 29
Purpose of this user bulletin
The purpose of this user bulletin is to document the performance of the ProFlex™ PCR System when used with Applied Biosystems® PCR Amplification Kits.
Overview
Purpose This user bulletin documents a validation study confirming the effectiveness of amplification using the ProFlex™ PCR System with three block formats (3 × 32-well block, 96-well block, and 2 × 96-well block) in conjunction with STR chemistry. The study compared data generated on the ProFlex™ PCR System with data generated on the GeneAmp® PCR System 9700 thermal cycler. The data verified reproducibility, sensitivity, direct amplification, and inhibition resistance of amplification on each thermal cycler with the following PCR amplification kits:
• AmpFlSTR® Identifiler® PCR Amplification Kit• AmpFlSTR® Identifiler® Plus PCR Amplification Kit• AmpFlSTR® Identifiler® Direct PCR Amplification Kit• AmpFlSTR® MiniFiler™ PCR Amplification Kit• AmpFlSTR® NGM SElect™ PCR Amplification Kit• AmpFlSTR® Yfiler® PCR Amplification Kit• Yfiler® Plus PCR Amplification Kit• GlobalFiler® PCR Amplification Kit• GlobalFiler® Express PCR Amplification Kit

2 ProFlex™ PCR System Kit Validation
Validation Studies
In the study, we evaluated genotype concordance, average peak heights, intracolor and intralocus balance, allele dropout rate with inhibitor, and dye artifacts for each thermal cycler/amplification kit combination. All the kits were tested with the ProFlex™ PCR System 1 x 96-well block format and, depending on the kit, were also tested with either the ProFlex™ PCR System 2 x 96-well block or 3 x 32-well block format. We performed statistical comparisons of the two thermal cyclers to ensure consistent results between the GeneAmp® thermal cyclers and the ProFlex™ PCR System with three block formats (3 × 32-well block, 96-well block, and 2 × 96-well block).
This validation study demonstrates that the STR chemistries tested produced high quality data when run on the ProFlex™ PCR System with any of the block formats tested. Furthermore, the overall results suggest that there is a reasonable expectation that other kits that were not part of this validation and that were developed using a 9600 emulation mode or GeneAmp® PCR System 9700 thermal cycler max mode will also produce high quality data when run on this system.
Validation Studies
Reproducibility All kits mentioned in “Overview” on page 1 were tested in the reproducibility study. Each kit was tested on two ProFlex™ PCR Systems and two 9700 thermal cyclers with 12 replicates of the kit positive control DNA, and 4 replicates of NTC. The PCR products were injected once on a 3500xL instrument for fragment analysis:
• 9947A DNA for the Identifiler®, Identifiler® Plus, Identifiler® Direct, MiniFiler™, and NGM SElect™ Kits
• 007 DNA for the Yfiler®, Yfiler® Plus, GlobalFiler®, and GlobalFiler® Express Kits
All kits were run with standard protocol and cycle number according to the kit user guide:
Table 1 Kit cycle numbers
Sensitivity The sensitivity study included all of the kits mentioned in “Overview” on page 1. Each kit was tested on two ProFlex™ PCR Systems and two 9700 thermal cyclers with 2 genomic DNA samples at 6 input amounts each (1 ng, 0.5 ng, 0.250 ng, 0.125 ng, 0.063 ng, and 0.031 ng), and 3 replicates for each input. All kits were run with standard protocol and cycle number according to the kit user guide (see Table 1). The PCR products were injected once on a 3500xL instrument for fragment analysis.
Kit Number of cycles
Identifiler® 28
Identifiler® Plus 28
Identifiler® Direct 27
MiniFiler™ 29
NGM SElect™ 29
Yfiler® 30
Yfiler® Plus 30
GlobalFiler® 29
GlobalFiler® Express 27

3ProFlex™ PCR System Kit Validation
Direct amplification kits
The direct amplification study with the Identifiler® Direct, Yfiler® Plus, and GlobalFiler® Express Kits was performed on two ProFlex™ PCR Systems and two 9700 thermal cyclers. Three male buccal swabs on FTA® cards and 3 male blood stains on FTA® cards were tested with 6 punches (replicates) per sample per thermal cycler. The PCR reactions for all of the kits were performed with the standard protocol according to the kit user guide. Two buccal swab samples were amplified with 26 cycles, and one with 27 cycles. Two blood samples were amplified with 25 cycles, and one with 26 cycles. The PCR products were injected once on a 3500xL instrument for fragment analysis.
Inhibition The inhibition study included all of the kits mentioned in “Overview” on page 1. Each kit was tested on two ProFlex™ PCR Systems and two 9700 thermal cyclers using 1 ng 007 DNA spiked with three concentrations of hematin targeted at 10, 20, and 30 µM final concentration in the PCR mix. Four replicates of each inhibited sample at each concentration of hematin were tested. All kits were run with standard protocol and cycle number according to the kit user guide. The PCR products were injected once on a 3500xL instrument for fragment analysis.
Materials and methods
Amplification kits and samples
One lot of each of the PCR Amplification Kits listed in Table 2 was utilized for each of the validation studies to minimize variability. In addition, identical dilutions of samples were used for testing on both of the thermal cycler platforms.
Table 2 PCR Amplification Kit catalog numbers and lot numbers
Kit Catalog number Lot number
Identifiler® 4322288 1403222
Identifiler® Plus 4427368 1408085
Identifiler® Direct 4467831 1404024
MiniFiler™ 4373872 1402053
NGM SElect™ 4457889 1401037
Yfiler® 4359513 1401109
Yfiler® Plus 4484678 1407001
GlobalFiler® 4476135 1409012
GlobalFiler® Express 4476609 1406011

4 ProFlex™ PCR System Kit Validation
Materials and methods
Table 3 DNA samples used in each test
Instruments Table 4 Instruments used in all studies
Capillary electrophoresis consumables
Table 5 Electrophoresis consumables used in all studies
Test Samples Sources
Reproducibility 0.1 ng/µL and 2 ng/µL 9947A Kit positive control
0.1 ng/µL and 2 ng/µL 007
Sensitivity 3 Male genomic DNA samples at 0.1 ng/µL, 0.05 ng/µL. 0.0125 ng/µL, 0.0063 ng/µL, and 0.0031 ng/µL
007 DNA and Male DNA isolated from whole blood cells obtained from AllCells®, Inc.
Direct Amplification
3 Male blood samples on FTA card IBB collection
3 Male buccal samples on FTA card Internal collection
Inhibition 1.0 ng/µL 007 + Hematin at 10, 20, and 30 µM (final PCR concentration)
Internal
Instruments†‡
† To ensure correct temperature ramping, 9600 emulation mode was used on both thermal cycler platforms for all kits except the GlobalFiler® and GlobalFiler® Express kits. For the GlobalFiler® and GlobalFiler® Express kits, “max” emulation mode was used with the 9700 thermal cycler and “GeneAmp® PCR System 9700” emulation mode was used with the ProFlex™ thermal cyclers.
‡ To minimize variability, one 3500xL Genetic Analyzer Genetic Analyzer was used for all testing.
Catalog number Serial number
ProFlex™ 96-Well PCR System 4484075 297801239
ProFlex™ 96-Well PCR System 4484075 297801299
ProFlex™ 2 × 96-Well Sample Block 4484071 297830090
ProFlex™ 2 × 96-Well Sample Block 4484071 297830131
ProFlex™ 3 × 32-Well Sample Block 4483638 297821586
ProFlex™ 3 × 32-Well Sample Block 4483638 297821339
Gold Plated 96-Well GeneAmp® PCR System 9700 4314878 805S8100303
Gold Plated 96-Well GeneAmp® PCR System 9700 4314878 805S9100817
3500xL Genetic Analyzer 4406016 21301-141
Consumables†
† CE setup was performed per instructions in the user guide of each individual kit.
Catalog number Lot number
DS-33 Matrix Standard Kit (Dye Set G5) 4345833 1304093L
DS-36 Matrix Standard Kit (Dye Set J6) 4425042 1407012
GeneScan™ 600 LIZ® Dye Size Standard v2.0 4408399 1404043
Hi-Di™ Formamide 4311320 1409331
POP-4™ Polymer for 3500/3500xL Genetic Analyzers 4393710 1406067
Anode Buffer Container (ABC) 3500 Series 4393927 1405174
Cathode Buffer Container (CBC) 3500 Series 4408256 1409225
3500xL Genetic Analyzer 24-Capillary Array, 36 cm 4404687 M313B2804

5ProFlex™ PCR System Kit Validation
Data analysis
Sizing and genotyping
The validation study used GeneMapper® ID-X v1.2, v1.3, and v1.4 software to analyze run files generated by the 3500xL Data Collection Software v3.0. The Data Collection Software v2.0 and v3.0 share identical peak height/detection algorithms and therefore no differences are expected between the two software outputs. All the data were analyzed with the Analysis Method settings described in the user guide for each kit, and using a peak amplitude threshold of 175 RFU. Allele calls, peak heights, and base pair sizes were determined using the appropriate PCR Amplification Kit panel, bin set, and stutter file.
Statistical analysis and calculations
Data generated by each instrument was compared using the parameters detailed below. The means were compared by ANOVA using Tukey-Kramer HSD method, using JMP® statistical analysis software v10 with 95% confidence interval.
Genotype concordance and allele dropout
Prior to the validation study, profiles of the DNA samples were determined using each STR kit. Profiles generated in the course of the studies were compared to the previously determined DNA profiles to determine whether all alleles were called identically. If an allele was not called identically in the control and sample profiles, further investigation was performed to determine whether the allele was not present or was called incorrectly. The percent of allele dropout was calculated using the number of alleles dropped out (<175 RFU) divided by the total number of expected alleles, then multiplying by 100%.
Average peak heights
Average peak heights were calculated by taking an average of the heterozygous peak heights in each marker, and dividing homozygous peak heights by 2. The average peak heights from each thermal cycler were compared.
The average peak height data is summarized in box plots. The box in each box plot represents 50% of the observations. The lines extending from the ends of the box to the outermost data points represent the lowest/highest data points still within 1.5 interquartile ranges of the lower/upper quartiles. Outlier data points are represented by stars above and below the lines of the box plot.
Intra-locus balance (heterozygote peak height ratio)
Within a heterozygous locus, the lower peak height of the two alleles was divided by the higher peak height, then multiplied by 100. The intra-locus balance data is summarized in box plots which are described in “Average peak heights”.
Intra-color balance
The average peak heights were used to calculate the intra-color balance. Among the loci in a color channel, the lowest average peak height was divided by the highest average peak height, then multiplied by 100. The intra-color balance data is summarized in box plots which are described in described in “Average peak heights”.

6 ProFlex™ PCR System Kit Validation
Results
Stutter ratio
Stutter ratio was calculated as the ratio of the stutter peak height divided by the parent allele peak height. The sample plot sizing table for each of the dyes in the kits was exported from GeneMapper® ID-X v1.2 or 1.4 and run through a Microsoft Excel® Macro program developed internally. Stutter ratios were compared for samples amplified by the two thermal cyclers.
Dye artifacts and negative control data
All samples tested were evaluated for the presence of artifacts and contamination. This evaluation included the identification of any anomalous and reproducibly amplified products (one or more peaks of the same base pair size in two or more samples) or dye artifacts. The evaluation included any peaks exceeding 175 relative fluorescent units (RFU) in the marker reading region of each kit.
Results
Reproducibility Genotype concordance
Both the ProFlex™ PCR Systems (tested with three block formats: 3 × 32-well block, 96-well block, and 2 × 96-well block) and the GeneAmp® PCR System 9700 thermal cycler produced correct genotypes for all amplified positive control samples when used to amplify samples with each of the PCR Amplification Kits tested. All results were 100% concordant with the previously established genotyping results.
Stutter ratio
The percent stutter ratio was examined for both the 9700 and ProFlex™ PCR Systems. The ProFlex™ PCR Systems generated stutter ratios similar to those generated by the 9700 platform.
Dye artifacts and negative control samples
The data generated on the ProFlex™ PCR System did not contain any new reproducible PCR artifacts that are not already published in the user guides for the PCR Amplification Kits tested.
The negative amplification controls generated similar baseline profiles on both ProFlex™ PCR System and 9700 thermal cyclers, and produced no amplification of DNA with any of the PCR Amplification Kits tested.

7ProFlex™ PCR System Kit Validation
Average peak heights
Figure 1 compares the average peak heights for the positive control DNA replicates run on both the ProFlex™ PCR System and GeneAmp® 9700 thermal cyclers. The results demonstrated that the mean peak heights were within 20% of each other and that there is no statistically significant difference between the two platforms.
The orange, purple, blue, and green boxes correspond to theProFlex™ (96-well block), ProFlex™ (2 × 96-well block), ProFlex™ (3 × 32-well block), and GeneAmp® 9700 thermal cyclers respectively. The black circle, generally located in the center of the box plots, represents the peak height mean. The black asterisks are the calculated outliers.
Figure 1 Box plot representation of the distribution of the data of kit positive control DNA on the thermal cycler instruments.
The average peak height values generated using the GlobalFiler®, GlobalFiler® Express, Identifiler®, Identifiler® Direct, Identifiler® Plus, MiniFiler™, NGM SElect™, Yfiler®, and Yfiler® Plus Kits demonstrated <20% difference between the thermal cyclers. This variation is consistent with the observed reaction-to-reaction variability of the GeneAmp® 9700 thermal cyclers. The injection-to-injection variation on the 3500xL Genetic Analyzer may also contribute to the observed differences. The performance of the two thermal cycler platforms was consistently similar with the kit positive control DNA.

8 ProFlex™ PCR System Kit Validation
Results
Intra-locus balance (heterozygote peak height ratio)
The intra-locus balance was determined across the positive control DNA profiles for each of the kits tested. Figure 2 compares the average intra-locus balance between the ProFlex™ PCR System and GeneAmp® 9700 thermal cyclers. The majority of the data points were >80% for all kits. The differences between the two platforms were less than 10% and were not statistically significant.
The orange, purple, blue, and green boxes correspond to theProFlex™ (96-well block), ProFlex™ (2 × 96-well block), ProFlex™ (3 × 32-well block), and GeneAmp® 9700 thermal cyclers respectively. The black circle, generally located in the center of the box plots, represents the peak height mean. The black asterisks are the calculated outliers.
Figure 2 Box plot of the intra-locus balance of kit positive control DNA on the thermal cycler instruments.

9ProFlex™ PCR System Kit Validation
Intra-color balance
The intra-color balance was determined across the positive control DNA profiles for each of the kits tested. Figure 3 compares the average intra-color balance between the ProFlex™ PCR System and GeneAmp® 9700 thermal cyclers. There was no statistically significant difference between the two platforms except for the Identifiler® Direct Kit, which had a maximum difference of 15%. The difference was well within the observed reaction-to-reaction variability of the GeneAmp® 9700 thermal cyclers.
The orange, purple, blue, and green boxes correspond to theProFlex™ (96-well block), ProFlex™ (2 × 96-well block), ProFlex™ (3 × 32-well block), and GeneAmp® 9700 thermal cyclers respectively. The black circle, generally located in the center of the box plots, represents the peak height mean. The black asterisks are the calculated outliers.
Figure 3 Box plot of the intra-color balance of kit positive control DNA on the thermal cycler instruments.
Sensitivity Genotype concordance and allele dropout
Both the ProFlex™ PCR System with three block formats (3 × 32-well block, 96-well block, and 2 × 96-well block) and the GeneAmp® PCR System 9700 thermal cycler produced correct genotypes for both male DNA samples with different concentrations when used with Identifiler®, Identifiler® Plus, MiniFiler™, NGM SElect™, Yfiler®, and GlobalFiler® Kits. All results were 100% concordant with the previously established genotyping results.
Allele dropouts were observed in the samples with low DNA input. Table 6 on page 10 compares the allele dropout rates and the overall average peak heights between the thermal cycler platforms for each kit and DNA input amount. There was no significant difference in the performances between the ProFlex™ PCR System and the 9700 instruments.

10 ProFlex™ PCR System Kit Validation
Results
Table 6 Allele dropout percentages and overall average peak heights by thermal cycler, PCR Amplification Kit, and DNA input amount
Kit DNA input (ng)
Allele dropout percentage Average peak height (RFU)
GeneAmp® 9700
ProFlex™ 1 × 96-well
block
ProFlex™ 3 × 32-well
block
GeneAmp® 9700
ProFlex™ 1 × 96-well
block
ProFlex™ 3 × 32-well
block
Identifiler® 0.031 76.84 81.84 † 53.16 39.67 †
0.063 37.92 43.58 † 176.61 158.08 †
0.125 3.15 3.70 † 504.17 447.74 †
0.250 0.00 0.00 † 1087.01 953.78 †
0.500 0.00 0.00 † 2401.16 2168.98 †
1.000 0.00 0.00 † 4176.14 4025.03 †
Identifiler® Plus
0.031 69.15 67.08 61.11 77.28 81.38 98.66
0.063 36.26 37.98 33.18 192.20 176.72 207.11
0.125 3.16 1.72 2.01 608.50 595.59 632.01
0.250 0.00 0.00 0.00 1062.06 911.72 1055.47
0.500 0.00 0.00 0.00 2403.66 2456.70 2605.37
1.000 0.00 0.00 0.00 4131.69 4044.95 4375.65
MiniFiler™ 0.031 22.52 29.74 36.96 367.04 282.02 221.51
0.063 8.66 17.46 11.68 597.84 387.08 442.95
0.125 0.49 5.17 0.98 1477.00 1057.36 1150.24
0.250 0.00 0.00 0.00 2352.61 1869.01 1956.79
0.500 0.00 0.00 0.00 5011.63 4239.02 4422.67
1.000 0.00 0.00 0.00 8027.34 6257.40 7642.84
NGM SElect™ 0.031 43.14 38.39 † 172.01 186.98 †
0.063 15.84 17.29 † 321.35 344.71 †
0.125 0.00 0.25 † 878.24 917.57 †
0.250 0.00 0.00 † 1387.80 1499.97 †
0.500 0.00 0.00 † 3350.69 3493.83 †
1.000 0.00 0.00 † 5191.83 5609.47 †
Yfiler® 0.031 26.47 26.96 † 170.06 161.19 †
0.063 5.88 6.37 † 326.02 310.75 †
0.125 0.00 0.00 † 910.79 781.19 †
0.250 0.00 0.00 † 1488.59 1416.44 †
0.500 0.00 0.00 † 3622.25 3321.27 †
1.000 0.00 0.00 † 5407.51 5357.63 †

11ProFlex™ PCR System Kit Validation
Average peak heights
The average peak heights were calculated for each kit tested and each DNA input amount. Generally, the ProFlex™ PCR System and GeneAmp® 9700 thermal cyclers generated comparable data for each DNA input amount with each amplification kit. The average peak height differences between the thermal cycler platforms across all input amounts were within 20% of each other. These differences were within normal run-to-run variability of 9700 thermal cycler and 3500xL Genetic Analyzer for all kits tested.
Figures 4–9 on pages 12–14 illustrate the average peak height data with Identifiler®, Identifiler® Plus, MiniFiler™, NGM SElect™, Yfiler®, and GlobalFiler® Kits at each DNA input amount. The orange, blue, and green boxes correspond to the ProFlex™ (96-well block), ProFlex™ (3 × 32-well block), and GeneAmp® 9700 thermal cyclers respectively. The black circle, generally located in the center of the box plots, represent the peak height mean. The black asterisks are the calculated outliers.
GlobalFiler® 0.031 71.52 58.32 73.96 67.46 102.85 59.12
0.063 39.00 42.13 41.26 167.55 172.36 164.80
0.125 2.12 0.96 2.69 497.26 637.80 514.49
0.250 0.19 0.38 0.19 811.60 1001.15 911.65
0.500 0.00 0.00 0.00 1870.45 2425.32 2172.84
1.000 0.00 0.00 0.00 3233.49 3433.63 3377.24
† Not tested.
Kit DNA input (ng)
Allele dropout percentage Average peak height (RFU)
GeneAmp® 9700
ProFlex™ 1 × 96-well
block
ProFlex™ 3 × 32-well
block
GeneAmp® 9700
ProFlex™ 1 × 96-well
block
ProFlex™ 3 × 32-well
block

12 ProFlex™ PCR System Kit Validation
Results
Figure 4 Box plot of the peak heights for the AmpFlSTR® Identifiler® PCR Amplification Kit.
Figure 5 Box plot of the peak heights for the AmpFlSTR® Identifiler® Plus PCR Amplification Kit.

13ProFlex™ PCR System Kit Validation
Figure 6 Box plot of the peak heights for the AmpFlSTR® MiniFiler™ PCR Amplification Kit.
Figure 7 Box plot of the peak heights for the AmpFlSTR® NGM SElect™ PCR Amplification Kit.

14 ProFlex™ PCR System Kit Validation
Results
Figure 8 Box plot of the peak heights for the AmpFlSTR® Yfiler® PCR Amplification Kit.
Figure 9 Box plot of the peak heights for the GlobalFiler® PCR Amplification Kit.

15ProFlex™ PCR System Kit Validation
Intra-Locus Balance (Heterozygote peak height ratio)
The intra-locus balance was determined across all male DNA samples for each of the kits tested. For all kits, the peak height ratios were >80% for the majority of data points. The differences between the two platforms were within 10% of each other and were not statistically significant.
Intra-color balance
The intra-color balance was determined across all male DNA samples for each of the kits tested. Table 7 compares the average intra-color balance between the ProFlex™ PCR System and GeneAmp® 9700 thermal cyclers for each dye color in each kit. Due to significant allele dropouts, the data for 0.031 ng and 0.063 ng DNA inputs were not calculated. For all kits, the intra-color balance ratios were >50%. The performance from the two platforms was comparable in most cases.
Table 7 Comparison of average intra-color balance between ProFlex™ PCR System and 9700 thermal cycler for male DNA samples with different input amounts
Kit Dye DNA input (ng)
% Intra-color balance
GeneAmp® 9700
ProFlex™ 1 × 96-well
block
ProFlex™ 3 × 32-well
block
Identifiler® B 0.125 0.51 0.46 †
0.250 0.63 0.57 †
0.500 0.66 0.58 †
1.000 0.65 0.63 †
G 0.125 0.47 0.40 †
0.250 0.60 0.58 †
0.500 0.55 0.57 †
1.000 0.59 0.61 †
Y 0.125 0.66 0.64 †
0.250 0.68 0.78 †
0.500 0.79 0.77 †
1.000 0.84 0.86 †
R 0.125 0.49 0.58 †
0.250 0.73 0.71 †
0.500 0.71 0.71 †
1.000 0.68 0.69 †

16 ProFlex™ PCR System Kit Validation
Results
Identifiler® Plus
B 0.125 0.48 0.56 0.53
0.250 0.61 0.61 0.63
0.500 0.63 0.64 0.64
1.000 0.67 0.62 0.63
G 0.125 0.50 0.52 0.57
0.250 0.61 0.62 0.59
0.500 0.68 0.65 0.65
1.000 0.64 0.62 0.64
Y 0.125 0.60 0.65 0.66
0.250 0.75 0.75 0.74
0.500 0.77 0.82 0.82
1.000 0.80 0.80 0.82
R 0.125 0.60 0.62 0.70
0.250 0.77 0.75 0.75
0.500 0.79 0.81 0.77
1.000 0.83 0.82 0.84
MiniFiler™ B 0.125 0.76 0.61 0.80
0.250 0.81 0.76 0.82
0.500 0.69 0.63 0.78
1.000 0.81 0.71 0.87
G 0.125 0.68 0.52 0.67
0.250 0.65 0.75 0.62
0.500 0.66 0.75 0.73
1.000 0.74 0.79 0.73
Y 0.125 0.72 0.70 0.75
0.250 0.83 0.87 0.79
0.500 0.84 0.87 0.86
1.000 0.84 0.92 0.93
R 0.125 0.65 0.51 0.72
0.250 0.80 0.72 0.80
0.500 0.78 0.66 0.73
1.000 0.81 0.68 0.78
Kit Dye DNA input (ng)
% Intra-color balance
GeneAmp® 9700
ProFlex™ 1 × 96-well
block
ProFlex™ 3 × 32-well
block

17ProFlex™ PCR System Kit Validation
NGM SElect™ B 0.125 0.48 0.61 †
0.250 0.64 0.64 †
0.500 0.65 0.69 †
1.000 0.71 0.72 †
G 0.125 0.62 0.63 †
0.250 0.76 0.73 †
0.500 0.75 0.70 †
1.000 0.78 0.77 †
Y 0.125 0.67 0.62 †
0.250 0.66 0.67 †
0.500 0.71 0.71 †
1.000 0.72 0.68 †
R 0.125 0.63 0.61 †
0.250 0.64 0.64 †
0.500 0.69 0.72 †
1.000 0.70 0.71 †
Yfiler® B 0.125 0.35 0.35 †
0.250 0.43 0.47 †
0.500 0.41 0.37 †
1.000 0.44 0.52 †
G 0.125 0.49 0.57 †
0.250 0.54 0.59 †
0.500 0.55 0.55 †
1.000 0.58 0.54 †
Y 0.125 0.41 0.51 †
0.250 0.47 0.47 †
0.500 0.49 0.48 †
1.000 0.54 0.57 †
R 0.125 0.41 0.54 †
0.250 0.60 0.65 †
0.500 0.59 0.75 †
1.000 0.70 0.76 †
Kit Dye DNA input (ng)
% Intra-color balance
GeneAmp® 9700
ProFlex™ 1 × 96-well
block
ProFlex™ 3 × 32-well
block

18 ProFlex™ PCR System Kit Validation
Results
GlobalFiler® B 0.125 0.36 0.43 0.35
0.250 0.46 0.45 0.42
0.500 0.48 0.46 0.46
1.000 0.49 0.43 0.49
G 0.125 0.32 0.21 0.22
0.250 0.34 0.29 0.31
0.500 0.31 0.33 0.27
1.000 0.30 0.32 0.28
Y 0.125 0.58 0.52 0.51
0.250 0.61 0.50 0.48
0.500 0.61 0.56 0.60
1.000 0.59 0.51 0.56
R 0.125 0.56 0.61 0.55
0.250 0.63 0.67 0.56
0.500 0.63 0.67 0.66
1.000 0.67 0.69 0.70
P 0.125 0.55 0.50 0.48
0.250 0.55 0.50 0.61
0.500 0.61 0.57 0.67
1.000 0.65 0.53 0.48
† Not tested.
Kit Dye DNA input (ng)
% Intra-color balance
GeneAmp® 9700
ProFlex™ 1 × 96-well
block
ProFlex™ 3 × 32-well
block

19ProFlex™ PCR System Kit Validation
Direct amplification Genotype concordance
Both the ProFlex™ PCR System with two block formats (96-well block and 2 × 96-well block) and the GeneAmp® PCR System 9700 thermal cycler produced correct genotypes for all blood and buccal samples when used with the Identifiler® Direct, Yfiler® Plus, and GlobalFiler® Express Kits. All results were 100% concordant with the previously established genotyping results.
Average peak heights
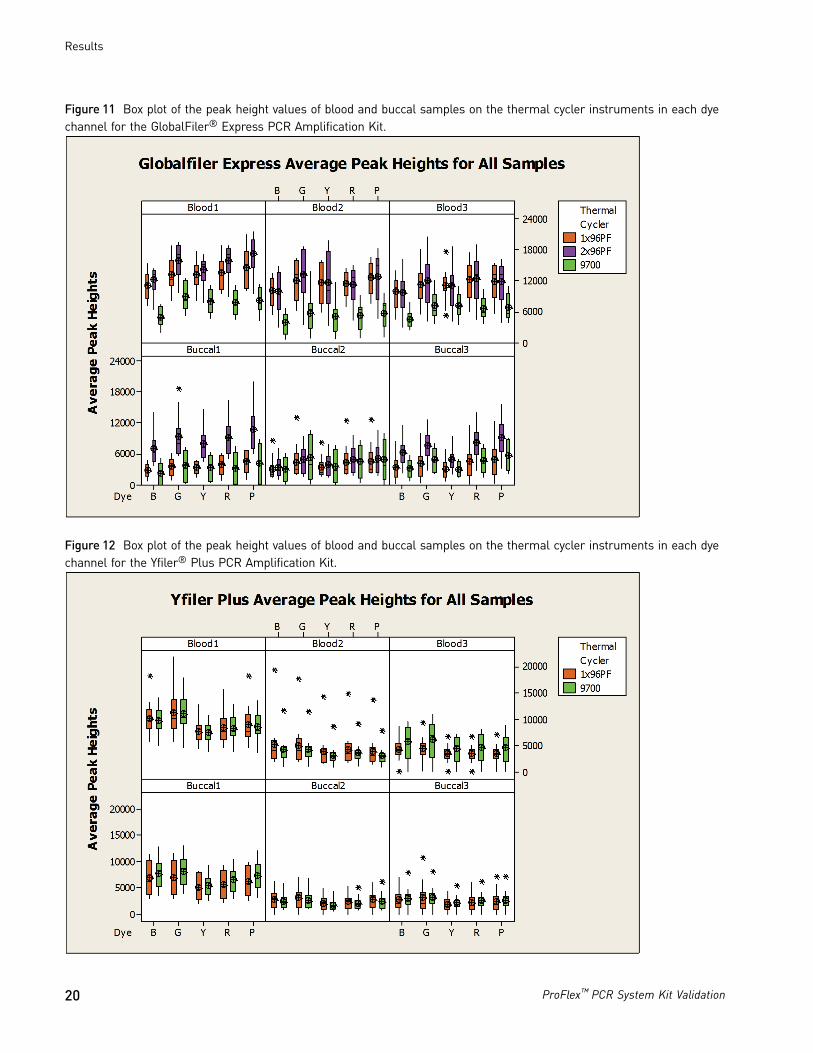
The average peak heights were calculated for blood and buccal samples with the Identifiler® Direct, Yfiler® Plus, and GlobalFiler® Express Kits. The results are illustrated in Figures 10–12 on pages 19–20. The orange, purple, and green boxes correspond to the two ProFlex™ 96-well block, ProFlex™ 2 × 96-well block, and GeneAmp® 9700 thermal cyclers respectively. The black circle located in the center of the box plots represent the peak height mean. The black asterisks are the calculated outliers.
Figure 10 Box plot of the peak height values of blood and buccal samples on the thermal cycler instruments in each dye channel for the AmpFlSTR® Identifiler® Direct PCR Amplification Kit.
20 ProFlex™ PCR System Kit Validation
Results
Figure 11 Box plot of the peak height values of blood and buccal samples on the thermal cycler instruments in each dye channel for the GlobalFiler® Express PCR Amplification Kit.
Figure 12 Box plot of the peak height values of blood and buccal samples on the thermal cycler instruments in each dye channel for the Yfiler® Plus PCR Amplification Kit.

21ProFlex™ PCR System Kit Validation
The ProFlex™ PCR System had similar performance compared to 9700 thermal cyclers for all of the kits tested, and showed no statistically significant differences in most cases, except for the GlobalFiler® Express kit, for which ProFlex™ thermal cyclers generated higher peak heights with one or both sample blocks tested. The differences observed between thermal cyclers were within 20% of each other for all kits except the GlobalFiler® Express Kit. With the GlobalFiler® Express Kit, the ProFlex™ thermal cyclers generated higher peak heights, with >20% difference compared to the 9700 thermal cyclers, with one or both sample blocks tested.
Intra-Locus Balance (Heterozygote peak height ratio)
The intra-locus balance was calculated for blood and buccal samples with the Identifiler® Direct Kit, Yfiler® Plus, and GlobalFiler® Express Kits. The results are illustrated in Figure 13 on page 21. The orange, purple, and green boxes correspond to the ProFlex™ 96-well block, ProFlex™ 2 × 96-well block, and GeneAmp® 9700 thermal cyclers respectively. The black circle, in the center of the box plots, represents the mean. The black asterisks are the calculated outliers.
Figure 13 Box plot of the intra-locus balance of blood and buccal samples on the thermal cycler instruments for the AmpFlSTR® Identifiler® Direct PCR Amplification Kit and GlobalFiler® Express Kit.
In most cases, the intra-locus balance for the 9700 thermal cyclers and ProFlex™ PCR Systems showed no statistically significant difference in mean value and amounts of variability. The differences between the 9700 thermal cyclers and ProFlex™ PCR System in average intra-locus balance were less than 10%.

22 ProFlex™ PCR System Kit Validation
Results
Intra-color balance
The intra-color balance was calculated for blood and buccal samples with the Identifiler® Direct Kit, Yfiler® Plus, and GlobalFiler® Express Kits. The results are illustrated in Figures 14 through 16 on pages 22–23. The orange, purple, and green boxes correspond to the ProFlex™ 96-well block, ProFlex™ 2 × 96-well block, and GeneAmp® 9700 thermal cyclers respectively. The black circle in the center of the box plots represent the mean. The black asterisks are the calculated outliers.
Figure 14 Box plot of the intra-color balance of blood and buccal samples on the thermal cycler instruments in each dye channel for the AmpFlSTR® Identifiler® Direct PCR Amplification Kit.

23ProFlex™ PCR System Kit Validation
Figure 15 Box plot of the intra-color balance of blood and buccal samples on the thermal cycler instruments in each dye channel for the GlobalFiler® Express PCR Amplification Kit.
Figure 16 Box plot of the intra-color balance of blood and buccal samples on the thermal cycler instruments in each dye channel for the Yfiler® Plus PCR Amplification Kit.

24 ProFlex™ PCR System Kit Validation
Results
In most cases, the ProFlex™ PCR Systems performed similarly in intra-color balance to the 9700 thermal cyclers in all dye channels, showing no statistically significant difference, and the variability was similar on both platforms. The differences were within 10% of each other and within normal run-to-run variability of the 9700 thermal cycler and 3500xL Genetic Analyzer. The only exception was with the GlobalFiler® Express Kit, where the ProFlex™ PCR System generated significantly higher intracolor balance (>10% difference) compared to the GeneAmp® 9700 thermal cycler.
Inhibition Allele dropout
No allele dropouts were observed in the 007 samples with high, medium, and low concentrations of hematin for all kits tested with both thermal cyclers.
Average peak heights
Figures 17 compares the average peak heights of the 007 DNA in the presence of hematin between the ProFlex™ and GeneAmp® 9700 thermal cyclers. Data from each kit were illustrated in different columns of the panel. In most cases, there was no significant difference between the two platforms.
Figure 17 Average peak heights of 007 DNA with each concentration level of hematin on the ProFlex™ and 9700 thermal cycler instruments for each kit tested.

25ProFlex™ PCR System Kit Validation
Intra-locus balance (Heterozygote peak height ratio)
The intra-locus balance was determined for 007 with different concentrations of hematin for each of the kits tested. Figure 18 compares the average intra-locus balance between the ProFlex™ and GeneAmp® 9700 thermal cyclers for each kit and each inhibitor concentration. In most cases, there was no significant difference between the two platforms.
Figure 18 Average intra-locus balance of 007 DNA with a different concentration of hematin on the ProFlex™ and 9700 thermal cycler instruments for each kit tested.

26 ProFlex™ PCR System Kit Validation
Results
Intra-color balance
The intra-color balance was determined for 007 with different concentrations of hematin for each of the kits tested. Figure 19 compares the average intra-color balance between the ProFlex™ and GeneAmp® 9700 thermal cyclers for each kit and each inhibitor concentration. In most cases, there was no significant difference between the two platforms.
Figure 19 Average intra-color balance of 007 DNA with a different concentration of hematin on the ProFlex™ and 9700 thermal cycler instruments for each kit tested.

27ProFlex™ PCR System Kit Validation
Discussion
Genotype concordance
The genotype profiles of the DNA samples used in the reproducibility, sensitivity, direct amplification, and inhibition tests were 100% concordant between ProFlex™ and 9700 thermal cyclers with all the kits tested.
Allele dropout As expected, allele dropouts were observed for both ProFlex™ and 9700 thermal cyclers in the 0.031 ng and 0.063 ng input DNA samples with all the kits tested. Occasional minor dropouts were observed in the 0.125 ng input within all kits tested except the Yfiler® Kit and dropouts were observed at 0.25 ng with the GlobalFiler® Kit.
No allele dropouts were observed in the hematin-inhibited samples, but changes in peak height were noted.
Average peak height
In most cases, the average peak heights generated with all the kits tested were comparable between the ProFlex™ and 9700 thermal cyclers. On average, the peak height difference between the two platforms was within 20% for the reproducibility, sensitivity, and the direct amplification samples.
When inhibitor was present in the samples, the average peak heights were comparable between the ProFlex™ PCR System and 9700 thermal cyclers for all levels of inhibitor tested with all kits. The difference between the two platforms was within 20%.
The observed peak height differences between the ProFlex™ PCR System and 9700 platforms were within the normal instrument-to-instrument and run-to-run variability of the 9700 thermal cycler and 3500xL Genetic Analyzer.
Intra-locus balance The intra-locus peak balances generated with all the kits tested were comparable between the ProFlex™ PCR System and 9700 thermal cyclers. These heterozygote peak height ratios were greater than 80% for the majority of data points for all kits with the reproducibility samples and sensitivity samples. The heterozygote peak height ratios were greater than 80% for the majority of data points for all kits for the direct amplification samples. The differences between the two platforms were within 10% for reproducibility samples, sensitivity samples, and direct amplification samples, and were not statistically significant.
When inhibitor was present in the samples, the intra-locus balance for both the thermal cyclers showed no significant difference in mean value or amounts of variability. The heterozygote peak height ratios were greater than 80% for the majority of data points for all the kits tested.
Intra-color balance The intra-color peak balances generated with all the kits tested were comparable between the ProFlex™ PCR System and 9700 thermal cyclers. In most cases, there was no statistically significant difference between the two platforms. In some cases the average differences were within 10% of each other. The GlobalFiler® Express results were an exception in that they showed a trend toward better intra-color balances with the ProFlex™ thermal cyclers especially with the kit control DNA. The GlobalFiler® Express Kit was developed on the Veriti® platform and is run using the max mode. The differences seen between the ProFlex™ PCR System and 9700 thermal cyclers with the GlobalFiler® Express Kit may be attributable to small differences in ramping time.

28 ProFlex™ PCR System Kit Validation
Conclusions
When inhibitor was present in the samples, the intra-color balance for the 9700 and ProFlex™ PCR Systems showed no significant difference in mean value or amount of variability.
Stutter ratio The ProFlex™ PCR Systems generated stutter ratios similar to those generated by the 9700 platform.
Dye artifact No reproducible artifacts other than those published in the kit user guides were produced by either the GeneAmp® 9700 or the ProFlex™ PCR System with the amplified control DNA and male samples. Peak heights for known artifacts generated by the two platforms were within the published ranges. The artifact peak heights from the ProFlex™ PCR Systems were similar to those produced by the GeneAmp® 9700 thermal cyclers.
Negative control baseline
No DNA contamination was observed in any negative control amplified throughout the validation studies. The ProFlex™ PCR Systems generated baseline profiles as clean as the 9700 instruments. There were no amplification artifacts detected that were not among the published artifacts.
Conclusions
The results of this validation study demonstrated that the ProFlex™ PCR System is comparable to the validated 9700 thermal cycler in assay performance of Identifiler®, Identifiler® Plus, Identifiler® Direct, MiniFiler™, NGM SElect™, Yfiler®, Yfiler® Plus, GlobalFiler®, and GlobalFiler® Express Kits. There was no significant difference in the peak height, intralocus balance, and intracolor balance between the two platforms except for a few cases where the ProFlex™ PCR System generated higher intracolor balance and peak heights such as with the GlobalFiler® Express Kit.
The genotype profiles were 100% concordant between the ProFlex™ PCR System and 9700 thermal cyclers in all of the tests. The stutter ratios were comparable between the two thermal cyclers. No new artifact peaks were observed.
Allele dropout was observed at 0.125 ng or lower DNA input for each kit across both the ProFlex™ PCR System and 9700 thermal cyclers. The ProFlex™ PCR System had equivalent or lower allele dropout rate compared to the 9700 thermal cyclers.
The ProFlex™ PCR System showed comparable performance to the 9700 thermal cycler in the hematin inhibition study, with allele recovery and signal loss observed.
The validation study results demonstrate that the ProFlex™ PCR System with three block formats (3 × 32-well block, 96-well block, and 2 × 96-well block) could generate data that is either statistically similar or relatively comparable to the data generated by the 9700 platform. Thus, the ProFlex™ PCR System with three block formats (3 × 32-well block, 96-well block, and 2 × 96-well block) exhibits reliable performance for human identification applications.

29ProFlex™ PCR System Kit Validation
References
AmpFlSTR® Identifiler® PCR Amplification Kit User Guide (Pub. no. 4323291)
AmpFlSTR® Identifiler® Plus PCR Amplification Kit User Guide (Pub. no. 4440211)
AmpFlSTR® Identifiler® Direct PCR Amplification Kit User Guide (Pub. no. 441525)
AmpFlSTR® NGM SElect™ PCR Amplification Kit User Guide (Pub. no. 4458841)
AmpFlSTR® MiniFiler™ PCR Amplification Kit User Guide (Pub. no. 4374618)
AmpFlSTR® Yfiler® PCR Amplification Kit User Guide (Pub. no. 4358101)
Yfiler® Plus PCR Amplification Kit User Guide (Pub. no. 4485610)
GlobalFiler® PCR Amplification Kit User Guide (Pub. no. 4477604)
GlobalFiler® Express PCR Amplification Kit User Guide (Pub. no. 4477672)

Headquarters5791 Van Allen Way | Carlsbad, CA 92008 USA | Phone +1 760 603 7200 | Toll Free in USA 800 955 6288For support visit lifetechnologies.com/support
lifetechnologies.com9 February 2015
The information in this guide is subject to change without notice.
DISCLAIMER: LIFE TECHNOLOGIES CORPORATION AND/OR ITS AFFILIATE(S) DISCLAIM ALL WARRANTIES WITH RESPECT TO THIS DOCUMENT, EXPRESSED OR IMPLIED, INCLUDING BUT NOT LIMITED TO THOSE OF MERCHANTABILITY, FITNESS FOR A PARTICULAR PURPOSE, OR NON-INFRINGEMENT. TO THE EXTENT ALLOWED BY LAW, IN NO EVENT SHALL LIFE TECHNOLOGIES AND/OR ITS AFFILIATE(S) BE LIABLE, WHETHER IN CONTRACT, TORT, WARRANTY, OR UNDER ANY STATUTE OR ON ANY OTHER BASIS FOR SPECIAL, INCIDENTAL, INDIRECT, PUNITIVE, MULTIPLE OR CONSEQUENTIAL DAMAGES IN CONNECTION WITH OR ARISING FROM THIS DOCUMENT, INCLUDING BUT NOT LIMITED TO THE USE THEREOF.
Important Licensing Information: These products may be covered by one or more Limited Use Label Licenses. By use of these products, you accept the terms and conditions of all applicable Limited Use Label Licenses.
© 2015 Thermo Fisher Scientific Inc. All rights reserved. The trademarks are the property of Thermo Fisher Scientific and its subsidiaries unless otherwise specified.
Microsoft, Windows, Excel, and Windows Vista are registered trademarks of Microsoft Corporation in the United States and other countries.