program on information program on information program...
TRANSCRIPT

Program on Information Program on Information Program on Information Program on Information Resources PolicyResources PolicyResources PolicyResources Policy
Center for Information Policy Research
Harvard University
The Program on Information Resources Policy is jointly sponsored by Harvard University and the Center for Information Policy Research. Chairman Managing Director Anthony G. Oettinger John C. B. LeGates
Julie J. C. H. Ryan is an assistant professor at The George Washington University in Washington, D.C., where she teaches and researches in the area of information security. Copyright © 2001 by Julie J. C. H. Ryan. Not to be reproduced in any form without written consent from Julie J. C. H. Ryan. Please write to Dr. Ryan, at the Program on Information Resources Policy, Harvard University, Maxwell Dworkin Bldg. 125, 33 Oxford St., Cambridge MA 02138. 617-495-4114 E-mail: [email protected] or [email protected] URL: http://www.pirp.harvard.edu ISBN 1-879716-75-5 I-01-2
INCIDENTAL PAPER
Information Security Practices and
Experiences in Small Businesses
Julie J. C H. Ryan May 2001

May 2001
PROGRAM ON INFORMATION RESOURCES POLICY
Harvard University Center for Information Policy Research
Affiliates
Anonymous Startup AT&T Corp. Australian Telecommunications Users Group BellSouth Corp. The Boeing Company Booz•Allen & Hamilton, Inc. Center for Excellence in Education CIRCIT at RMIT (Australia) Commission of the European Communities Critical Path CyberMedia Convergence Consulting CyraCom International DACOM (Korea) ETRI (Korea) eYak, Inc. Fujitsu Research Institute (Japan) Hanaro Telecom Corp. (Korea) Hearst Newspapers High Acre Systems, Inc. Hitachi Research Institute (Japan) IBM Corp. Korea Telecom Lee Enterprises, Inc. Lexis–Nexis Lucent Technologies John and Mary R. Markle Foundation Microsoft Corp. MITRE Corp. Motorola, Inc.
National Security Research, Inc. NEC Corp. (Japan) NEST–Boston Nippon Telegraph & Telephone Corp (Japan) NMC/Northwestern University PDS Consulting PetaData Holdings, Inc. Research Institute of Telecommunications and Economics (Japan) Samara Associates SK Telecom Co. Ltd. (Korea) Strategy Assistance Services United States Government: Department of Commerce National Telecommunications and Information Administration Department of Defense National Defense University Department of Health and Human Services National Library of Medicine Department of the Treasury Office of the Comptroller of the Currency Federal Communications Commission National Security Agency United States Postal Service Upoc Verizon

To Dan

Note
This publication was prepared as a dissertation and submitted to the Faculty of the School of Engineering and Applied Science of the George Washington University in 2000.

Acknowledgements
The work of any individual is a reflection of the support, influence, and instruction received from a multitude of others. Recognition is due to many people for their influences and encouragement; to attempt to name each would run the very real risk of excluding one or more.
My sincere appreciation is due to all those in my life who have provided encouragement and have steadily supported every endeavor with advice and assistance.
To my committee members, Mike Donnell, Dorothy Denning, Theresa Jefferson, Lile Murphree, and Mike Stankosky: thank you for your specific advice and counsel.
To current and past members of the staff of the Engineering Management and Systems Engineering Department, thank you for helping the process proceed smoothly and efficiently.
For the small business owners who took the time and effort to respond to the questionnaire, thank you for making this research possible.


Executive Summary
The purpose of this research was to characterize the practices, experiences, and concerns of small businesses regarding information security. As the global economy continues to embrace the marketplace of ideas, concern with how information security is practiced at every juncture is rising. Over the past decade, there have been many attempts to characterize the practices and experiences of businesses with regards to information security. Unfortunately, many of these surveys suffer from biases that make them unusable for generalizing the common state of practice or concern. In addition to flaws in methodology or weaknesses in design, the state of research has ignored the small business community, which is a critical sector in both the global economy and the economy of the United States.
The method used for this research was a descriptive study using a questionnaire as primary instrument of data collection. Questionnaires were distributed in the first quarter of the year 2000 to 741 businesses nationwide. Of those, 209 small businesses responded by July 2000. Based on those responses, this research describes small business use of information security related management tools and technology tools. It also describes the level of importance accorded different information classes by small business, reported experiences over the previous twelve months, and level of concern for potential problem areas related to information security. The results are compared to fourteen other survey results as well as described on their own.
The findings indicate that the current state of information security practice in small business is fairly spotty. Low percentages of respondents report using even common technologies, with the exception of anti-virus software and password protection on systems. Low percentages of respondents also report having experienced information security related problems. Anecdotal evidence combined with the low rates of technology usage implies that the lack of problems may be related to a lack of ability to notice problems in a highly technical area. Further research is required to identify and explain why small businesses adopt some management tools but not others, why they use some technologies but not others, and how their experience base affects how they operate.


Contents
Note ................................................................................................................................................. ii
Acknowledgements ....................................................................................................................... iii
Executive Summary....................................................................................................................... v
Chapter One Introduction ................................................................................................... 1 Statement of the Problem........................................................................................................ 1
Contribution to Academic Knowledge ................................................................................... 1
Organization of the Document................................................................................................ 2
Context.................................................................................................................................... 2
Background.................................................................................................................... 2
Purpose .......................................................................................................................... 4
Significance ................................................................................................................... 4
Scope and Limitations ................................................................................................... 4
Literature Research................................................................................................................. 5
National Information Infrastructure Security ................................................................ 5
Small Business and Information Technology ................................................................ 6
Small Business and Crime............................................................................................. 7
Small Business Distribution .......................................................................................... 8
State of Security Practice in Business ........................................................................... 9
Research Hypotheses............................................................................................................ 21
Research Goals ............................................................................................................ 21
Research Hypotheses................................................................................................... 21
Chapter Two Research Method......................................................................................... 25 Research Plan ....................................................................................................................... 25
Use of Surveys in Descriptive Research...................................................................... 25
Survey Form Design ............................................................................................................. 26
Survey Form Questions ........................................................................................................ 29
Sample Selection Procedures................................................................................................ 32
Analysis Procedures ............................................................................................................. 33
Chapter Three The Respondents ......................................................................................... 35

– viii –
Locations of Respondents..................................................................................................... 35
Business Size ........................................................................................................................ 35
Respondents’ Business Area ................................................................................................. 39
Information Infrastructure .................................................................................................... 42
Number of Computers ................................................................................................. 42
Connectivity ................................................................................................................ 45
Computers and Connectivity Maintenance.................................................................. 47
Chapter Four Importance of Information......................................................................... 49
Chapter Five Experiences and Concerns ......................................................................... 53 Information Security Experiences ........................................................................................ 53
Information Security Concerns............................................................................................. 55
Chapter Six Information Security Practice In Small Business..................................... 59 Access Practices ................................................................................................................... 59
Information Security Management Tools Usage .................................................................. 61
Information Security Technologies Usage............................................................................ 62
Chapter Seven Are Small Businesses Different? ................................................................ 69 Written Security Policies ...................................................................................................... 69
Likelihood of Security Breaches .......................................................................................... 69
Ability to Characterize Losses.............................................................................................. 70
Probability of Outsider Unauthorized Access....................................................................... 71
Probability of Insider Access Abuse ..................................................................................... 71
Concern for Virus-Related Problems.................................................................................... 72
Concern over Power Failure ................................................................................................. 73
Concern over Data Theft ...................................................................................................... 73
Summation of Differences.................................................................................................... 74
Chapter Eight The Internet Factor..................................................................................... 77 Concern for Security............................................................................................................. 77
Likelihood for Policies ......................................................................................................... 92
Likelihood of Security Breach.............................................................................................. 96
Likelihood of Financial Loss .............................................................................................. 101
Likelihood of Insider Access Abuse ................................................................................... 102

– ix –
Likelihood of Outsider Unauthorized Access..................................................................... 103
Likelihood of Having Business Continuity Plans............................................................... 103
Likelihood of Having Security Technology........................................................................ 104
The Overall Impact of the Internet ..................................................................................... 116
Chapter Nine Does Size Matter?...................................................................................... 117 Size and Access Practices ................................................................................................... 118
Size and Management Tools ............................................................................................... 119
Size and Technology Use.................................................................................................... 121
Size and Data Importance................................................................................................... 124
Size and Experiences .......................................................................................................... 126
Size and Level of Concern.................................................................................................. 128
Conclusion: Size Does Matter ............................................................................................ 129
Chapter Ten Are Services Businesses Different? .......................................................... 131 Services and Access Practices ............................................................................................ 131
Services and Management Tools ........................................................................................ 132
Services and Technology Use ............................................................................................. 134
Services and Data Importance ............................................................................................ 136
Services and Experiences ................................................................................................... 137
Services and Level of Concern ........................................................................................... 138
Conclusion: Services are a Little Different......................................................................... 140
Chapter Eleven Are Maryland Businesses Different? ....................................................... 141 Maryland and Access Practices .......................................................................................... 141
Maryland and Management Tools ...................................................................................... 142
Maryland and Technology Use ........................................................................................... 144
Maryland and Data Importance .......................................................................................... 145
Maryland and Experiences ................................................................................................. 146
Maryland and Level of Concern ......................................................................................... 148
Conclusion: Maryland is Normal........................................................................................ 149
Chapter Twelve Some Other Insights.................................................................................. 151 Experiences and Policies .................................................................................................... 151
Virus Concern and Use of Anti-Virus Software.................................................................. 155
Data Availability Concern and Practices ............................................................................ 155

– x –
Data Integrity Concern and Practices ................................................................................. 156
Transaction Integrity Concern and Practices ...................................................................... 156
Insider Access Abuse .......................................................................................................... 157
Chapter Thirteen Conclusions ................................................................................................ 159
Bibliography ............................................................................................................................... 165
Glossary ...................................................................................................................................... 171
Acronyms.................................................................................................................................... 173

Figures
Figure 1 Reported Percent with Security Policies.............................................................14 Figure 2 Percent Respondents with Security Breaches.....................................................15 Figure 3 Respondents Reporting Unauthorized Access by Outsiders...............................17 Figure 4 Percentage Respondents Reporting Insider Access Abuse.................................18 Figure 5 Respondents Reporting Security as Important....................................................19 Figure 6 Survey Instrument...............................................................................................27 Figure 7 Business Size (Number of Employees) ..............................................................37 Figure 8 Business Size (Annual Revenue)........................................................................38 Figure 9 Responses Reporting Connectivity Types ..........................................................45 Figure 10 Internet Connectivity Percentage by Year ..........................................................46 Figure 11 Data Importance..................................................................................................50 Figure 12 Financial Losses Quantified ...............................................................................55 Figure 13 Level of Concern Values ....................................................................................56 Figure 14 Histogram of Computed Concern.......................................................................79 Figure 15 Aggregate Concern, No Internet Access.............................................................81 Figure 16 Aggregate Concern, Internet Access ..................................................................81 Figure 17 Aggregate Concern, No Web Presence...............................................................83 Figure 18 Aggregate Concern, Web Presence ....................................................................83 Figure 19 Aggregate Concern, No E-Commerce ................................................................85 Figure 20 Aggregate Concern, E-Commerce......................................................................86 Figure 21 Comparisons of Aggregate Concerns .................................................................86 Figure 22 Scatter Plot, Aggregate Concern.........................................................................87 Figure 23 Web Presence, Concerns Chi Square P Values ..................................................91 Figure 24 E-Commerce, Concerns Chi Square P Values....................................................91 Figure 25 Internet Access and Policies, P Values...............................................................94 Figure 26 Web Presence and Policies, P Values.................................................................94 Figure 27 Web Presence, Experiences P Values.................................................................99 Figure 28 E-Commerce, Experiences P-Values................................................................100 Figure 29 Technology Use and Connectivity, P Values ...................................................104 Figure 30 Technologies and Internet Access, P Values ....................................................107 Figure 31 Histogram of Total Used Technologies ............................................................108 Figure 32 Technologies and Web Presence, P Values ......................................................110 Figure 33 Technologies and E-Commerce, P Values .......................................................113 Figure 34 Internet and E-Commerce, Technologies, P Values .........................................115

Tables
Table 1 Business Distribution Data .................................................................................10 Table 2 Survey Respondents Comparison .......................................................................11 Table 3 Survey Method Comparison ...............................................................................12 Table 4 Survey Comparisons: Policy Question ...............................................................13 Table 5 Survey Comparisons: Security Breaches............................................................14 Table 6 Survey Comparison: Financial Loss ...................................................................15 Table 7 Survey Comparisons: Unauthorized Access.......................................................16 Table 8 Survey Comparisons: Internet Concerns ............................................................18 Table 9 Survey Comparisons: Security Importance ........................................................19 Table 10 Survey Comparisons: Top Five Security Concerns............................................20 Table 11 Survey Comparisons: Business Continuity Plan ................................................20 Table 12 Hypotheses Framing Research Goal One ...........................................................22 Table 13 Hypotheses Framing Research Goal Two ..........................................................24 Table 14 Location and Method of Solicitation ..................................................................36 Table 15 Maryland Respondents vs. All Others ................................................................37 Table 16 Business Size (Number of Employees) ..............................................................37 Table 17 Business Size (Annual Revenue)........................................................................38 Table 18 Business Size—Revenue and Employees...........................................................39 Table 19 Frequency Distribution for Business Area..........................................................40 Table 20 Business Area and Number of Employees .........................................................41 Table 21 Business Area and Size (Revenue) .....................................................................41 Table 22 Number of Computers ........................................................................................42 Table 23 Business Area and Number of Computers (Count) ............................................43 Table 24 Business Area and Number of Computers (Percentage) ....................................43 Table 25 Connectivity........................................................................................................45 Table 26 Business Area and Types of Connectivity..........................................................46 Table 27 Maintenance of Computers and Connectivity ....................................................47 Table 28 Computer and Connectivity Maintenance ..........................................................48 Table 29 Data Importance..................................................................................................49 Table 30 Information Security Experiences ......................................................................53 Table 31 Data Loss and Data Recovery Procedures..........................................................54 Table 32 Level of Concern Responses ..............................................................................56 Table 33 Access Practices..................................................................................................59 Table 34 Access for Employees.........................................................................................60 Table 35 Access for Others................................................................................................60 Table 36 Use of Management Tools..................................................................................61 Table 37 Use of Technology Tools....................................................................................62 Table 38 Anti-Virus Update Cycles...................................................................................63

– xiii –
Table 39 Data Backup Systems .........................................................................................63 Table 40 System Access Controls .....................................................................................64 Table 41 Redundant Systems.............................................................................................64 Table 42 Data Segregation.................................................................................................65 Table 43 Firewalls .............................................................................................................65 Table 44 Intrusion Detection System Monitoring .............................................................66 Table 45 Encryption Usage................................................................................................66 Table 46 Facility Access Controls .....................................................................................66 Table 47 Security Evaluation Systems ..............................................................................67 Table 48 Comparison, Written Policies.............................................................................69 Table 49 Comparison, Experience Breach ........................................................................70 Table 50 Comparison, Ability to Characterize Losses ......................................................70 Table 51 Comparison, Outsider Access Abuse .................................................................71 Table 52 Comparison, Insider Problems............................................................................72 Table 53 Comparison Concern for Viruses .......................................................................72 Table 54 Comparison Concern for Power Failure .............................................................73 Table 55 Comparison Concern for Data Theft ..................................................................74 Table 56 Research Goal One Hypotheses Test Results .....................................................75 Table 57 Internet, Web, E-Commerce Access...................................................................77 Table 58 Aggregate Concern Descriptive Statistics ..........................................................78 Table 59 ANOVA Concern and Access ............................................................................79 Table 60 Aggregate Concern, Internet Access ..................................................................80 Table 61 Aggregate Concern, Web Presence ....................................................................82 Table 62 Aggregate Concern, E-Commerce......................................................................84 Table 63 Unpaired Means Comparison, Internet Access...................................................87 Table 64 Unpaired Means Comparison, Web Presence.....................................................88 Table 65 Unpaired Means Comparison, E-Commerce ......................................................88 Table 66 High or Extreme Concern Levels .......................................................................89 Table 67 Concern Component Chi-Square Testing...........................................................90 Table 68 Policy and Access Type......................................................................................93 Table 69 Chi-Square Tests Policy and Access ..................................................................93 Table 70 Information Security Experiences and Access Type ..........................................96 Table 71 Chi Square Test Any Experience and Access.....................................................97 Table 72 Experience Types and Access ............................................................................98 Table 73 Chi-Square Test Experiences Access .................................................................98 Table 74 Financial Loss and Access Type.......................................................................101 Table 75 Chi-Square Test Financial Loss Access Type ..................................................102 Table 76 Chi Square Technology and Access .................................................................104 Table 77 ANOVA Technologies, Access Types .............................................................105 Table 78 Chi Square Test Internet Access, Technologies ...............................................106

– xiv –
Table 79 Descriptive Statistics, Total Technologies, Internet Access.............................108 Table 80 Unpaired Means Technologies and Internet Access.........................................109 Table 81 Chi-Square Tests Technologies, Web Presence ...............................................109 Table 82 Descriptive Statistics Technologies and Web Presence ...................................111 Table 83 Unpaired Means Test Technologies, Web Presence.........................................111 Table 84 Chi-Square Tests Technologies, E-Commerce.................................................112 Table 85 Descriptive Statistics Technologies and E-Commerce.....................................113 Table 86 Unpaired Means Test Technologies, E-Commerce ..........................................114 Table 87 Chi Square Technologies, Internet, E-Commerce ............................................114 Table 88 Research Goal Two Hypotheses Testing Results .............................................116 Table 89 Number of Computers for Number of Employees............................................117 Table 90 Number of Computers For Size of Business (Annual Revenue) ......................117 Table 91 Access Practices and Size.................................................................................118 Table 92 Chi Square Access and Size .............................................................................119 Table 93 Size and Written Policies..................................................................................120 Table 94 Chi Square Size and Policies ............................................................................120 Table 95 Size and Plans, Procedures ...............................................................................121 Table 96 Chi Square Size and Plans, Procedures ............................................................121 Table 97 Size and Technology Use .................................................................................122 Table 98 Chi Square Size and Technologies ...................................................................123 Table 99 Size and Data Importance.................................................................................124 Table 100 Chi Square Size and Data Importance ..............................................................125 Table 101 Chi Square Size and Data Importance (All) .....................................................125 Table 102 Size and Data Importance.................................................................................125 Table 103 Size and Experiences ........................................................................................127 Table 104 Chi Square Size and Experiences .....................................................................127 Table 105 Size and Concern ..............................................................................................128 Table 106 Chi Square Size and Concern ...........................................................................129 Table 107 Services and Access..........................................................................................131 Table 108 Chi-Square Services and Access.......................................................................132 Table 109 Services and Policies ........................................................................................132 Table 110 Chi-Square Services and Policies .....................................................................133 Table 111 Services and Plans, Procedures.........................................................................133 Table 112 Chi-Square Services and Plans, Procedures .....................................................134 Table 113 Services and Technology Use...........................................................................134 Table 114 Chi Square Services and Technology Use........................................................135 Table 115 Services and Data Importance ..........................................................................136 Table 116 Chi Square Services and Data Importance .......................................................137 Table 117 Services and Experiences .................................................................................137 Table 118 Chi Square Services and Experiences...............................................................138

– xv –
Table 119 Services and Concerns......................................................................................139 Table 120 Chi Square Services and Concerns ...................................................................140 Table 121 Maryland and Access Practices ........................................................................141 Table 122 Chi-Square Maryland and Access ....................................................................142 Table 123 Maryland and Policy Use..................................................................................142 Table 124 Chi-Square Maryland and Policy Use ..............................................................143 Table 125 Maryland and Plans, Procedures.......................................................................143 Table 126 Chi-Square Maryland and Plans, Procedures ...................................................144 Table 127 Maryland and Technology Use.........................................................................144 Table 128 Chi-Square Maryland and Technology Use......................................................145 Table 129 Maryland and Data Importance ........................................................................146 Table 130 Chi-Square Maryland and Data Importance .....................................................146 Table 131 Maryland and Experiences ...............................................................................147 Table 132 Chi-Square Maryland and Experiences ............................................................147 Table 133 Maryland and Concern .....................................................................................148 Table 134 Chi-Square Maryland and Concern ..................................................................149 Table 135 Experiences and Policies ..................................................................................151 Table 136 Chi-Square Experience and Policy (1)..............................................................152 Table 137 Chi-Square Experience and Policy (2)..............................................................152 Table 138 Percentages Policies and Experiences ..............................................................154

Chapter One
Introduction
The world is becoming highly interconnected due in part to the proliferation of information technology. As a result, the security considerations associated with information have grown more complex. With every network connection, the reach of a hostile agent becomes broader. The extent of interconnectivity of systems is such that computer viruses can be seen sweeping the globe much like the influenza biological virus. As a result, poor security practices at one company can have worldwide impact. A recent and attention-getting example of this relationship was seen in the distributed denial of service attacks executed on several electronic commerce (e-commerce) and Web-based businesses in early 2000. (Kerstetter and Madden 2000)
Recognition of the implications of this pervasive interconnectivity has been reflected at the national level, such as in the study performed by the President’s Commission on Critical Infrastructure Protection (PCCIP 1997). Information security is a critical element of national security and national level policy makers are justifiably concerned about the state of information security in the nation.
The research described in this report contributes to the baseline understanding of how information security is practiced in the business community. Specifically, this study identifies information security practices and experiences in small business in the United States.
Statement of the Problem
As the world moves more firmly into the knowledge age, the nation needs to assure the security of its national information infrastructure. Programs advocating information security, policies governing information security activities, and regulations requiring specific types of information security activities in specific industries could possibly all contribute to the assurance of the security of the national information infrastructure. In order to create such policy frameworks or regulatory structures, policy makers and leaders need to understand the current state of information security practice. The problem that this research addresses is simply stated: there is no data that describes the state of information security practice in small businesses. Because small businesses represent a significant segment of the nation’s economy (SBA 1999), no comprehensive understanding of information security practices, problems, or trends can be developed without taking small businesses into account.
Contribution to Academic Knowledge
The data contained in this report contributes to the theoretical understanding of how information security must be pursued from both a scientific research endeavor as well as a

– 2 –
management science endeavor. Understanding how and why real people use information security tools, technologies, and procedures provides valuable insights into what research activities are needed and how to measure progress in achieving research goals.
In an economy fueled by ideas and by knowledge, the concepts that underlie protecting the new capital of information become crucial to the security of the economic basis. The data contained in this research study contributes a fundamental first step in developing a comprehensive understanding of the organizational behavior issues associated with running a successful company in a knowledge based environment. Using this data, further research can be performed to identify causal relationships with specific elements within an enterprise as well as to identify influencing factors, such as personal background and the impact of popular culture, on protecting information assets.
Organization of the Document
This document has thirteen sections. The first section, the Introduction, explains the problem and provides the background and motivation for conducting this research. It also provides a synopsis of the current state of descriptive data on information security practice in business. The hypotheses that frame the research are also described in this section. The second section describes the research method. The survey instrument is described, as are the subjects and samples. The procedures by which the research was conducted are described as well. The third through twelfth sections provides the results of the research, and the last section explores conclusions based on the research, with recommendations for future research efforts.
Context
The following sections describe the context of the research.
Background
The pursuit of information security is characterized by the use of technologies, policies, procedures, and operational practices to maintain a desired level of confidentiality, integrity, and availability of information systems and assets. Information security for the nation’s information infrastructure is complicated by the fact that there is no over-arching body to govern or regulate security practices for each element of the infrastructure. The national information infrastructure is comprised of every element of information technology within the nation. Most of those elements are owned by private sector entities, rather than by any element of the nation’s governance structure, thus diffusing the responsibility for protecting the security of the information assets across a very large base, and complicating the creation and enforcement of a regulatory structure.
With the publication of the final report of the President’s Commission on Critical Infrastructure Protection (PCCIP), a call to arms was sounded regarding the security of the

– 3 –
nation’s information infrastructure. The PCCIP report, Critical Foundations: Thinking Differently, capped a series of reports issued by government-related groups, including the Defense Science Board (DSB) and the Joint Security Commission (JSC), all of which pointed to lack of information security as a critical shortcoming in the nation’s defense (PCCIP 1997; DSB 1997; JSC 1994).
The challenge of information security in the modern context is significant. Interconnectivity of businesses with customers, vendors, subcontractors and even competitors is increasingly required in order to remain competitive and function in the global economy, and yet every connection adds to the vulnerability of the system to hackers, criminals, terrorists and even the security organs and military forces of foreign governments. Risks of successful theft, compromise, and misuse or destruction of valuable information assets by insiders is also increased as connectivity increases. Technical education in the specifics of how to secure computer systems and communications links is both rare and difficult. The computer systems and networks used by both industry and government agencies are commercial products that were not designed with security as a primary requirement and also exhibit numerous flaws and weaknesses. In this environment, prudence seems to require that information security practice be ubiquitous and effective.
How ubiquitous and effective is the current state of information security practice? The reports mentioned here have all recommended that more be done to increase security. Their recommendations mean little unless there is a baseline with which to compare their results and thereby lay the groundwork for determining whether or not “enough” is being done or “more” is needed.
There have been a number of surveys conducted over the last decade that have attempted to characterize the state of information security practice. These surveys have been largely based on questionnaires targeted at information technology professionals working in large corporations. In many cases, the survey respondents were information security professionals. In no case has an evaluation been performed on the level of technical understanding and attitudes of people who do not work in information technology in large firms. As a result, it is impossible to state any description at all on the state of information security practice and understanding in a significant part of the economy of the United States.
The research reported here sheds new light on the current state of information security practice in that portion of the American economy’s private sector that employs more than half (53 percent) of the workforce and produces more than half (51 percent) of the Gross Domestic Product: small businesses (SBA 1999). As a rule of thumb, a business with less than five hundred

– 4 –
employees is generally considered to be small1. By collecting data on how small businesses practice information security in their day-to-day operations, insight can be gained on the current state of security in general. The results of this study will provide data to assist the development of public policy, educational programs, and technology in support of information security goals.
Purpose
The purpose of this research is to describe the state of information security practice in small businesses in quantifiable and precise terms. The data represents a cross section of small businesses from across the United States. The compiled and analyzed data describes the use of management tools, such as policies and procedures; the use of technological tools, such as antiviral software and power surge protectors; and the experiences of the small businesses with regard to information security related problems.
Significance
The significance of this study lies principally in the significance of small businesses to the United States economy and infrastructure. Small businesses represent an important segment of both the national economy and the national information infrastructure. Small businesses represent over 99 percent of all employers in the United States, employ 38 percent of high technology workers in the private sector, and provide 51 percent of the private sector output. (SBA 1999) The data provided by this study provides policy makers and leaders with an understanding of how small businesses contribute to or detract from the security of the national information infrastructure. The data also provides technologists with insights into how widely used various technology solutions are in the small business community. Management theorists are provided with data on how management tools are used in small businesses to help manage the information security challenges. This first set of descriptive data can serve as a baseline for trend and change analysis in future studies.
Scope and Limitations
The focus of this research is on describing small business information security practices and experiences. The scope includes describing with respect to small businesses:
1. What percent have information security policies,
2. What percent have experienced information security breaches,
3. Financial losses experienced as a result of an information security breach,
4. What percent have experienced unauthorized access to their information systems,
1The laws governing the Small Business Administration (SBA) activities define very precisely what a small business is. The definition varies from industry to industry and even within industries. However, the definition of ‘less than 500 employees’ is used as a rule of thumb in SBA documents. (SBA 1999)

– 5 –
5. Level of concern regarding information security related issues,
5. What security elements are of highest concern, and
6. What percent have a business continuity plan.
Furthermore, this research is specifically considered in light of information technology proliferation and Internet connectivity.
The research data is based on a sample size of 209 responses out of a population of well over five million small businesses in the United States. Of these 209 responses, the vast majority, 168 were from the smallest of the small businesses—those with less than ten employees. Thus there are some limitations on the conclusions, which are addressed in the description of the research by pointing out the distinctions between the smallest of the small and all other respondents.
The home base from which this research was conducted is located in the state of Maryland. Because of this, 96 of the 209 responses were from businesses located in Maryland. The data is also examined in order to determine if the responses from Maryland businesses are significantly different from the rest of the responses.
The research describes small business information security practices without attempting to evaluate or describe contributing elements to those practices, such as the education or experience of the managing personnel. Personnel backgrounds may be a significant element, given that the education and training of managers and employees could exert influence on both the existence and enforcement of security practices. The financial state of the company may be an influence on security practices as well, with less profitable firms potentially electing to disregard security practices due to financial constraints. Both of these areas might provide fruitful areas for research in the future. Further specific areas for follow-up research are pointed out in the discussion of the results of this research.
Literature Research
Literature research was performed in three areas: national information infrastructure, small businesses, and existing descriptive data on the state of security practice in business.
National Information Infrastructure Security
The National Information Infrastructure (NII) is the term that has come to replace and encompass other terms like “information superhighway” and “infobahn.” The concept of a national information infrastructure is one that recognizes the pervasiveness of information technology within the nation’s cultural icons, its economy, and its political system. The concept of a national information infrastructure to propel the nation forward economically took shape during the decade of the 1980s, the decade that saw the advent of the personal computer and the

– 6 –
explosion of networks. The power of a national information infrastructure is likened to that of the railroad system or the highway system, with the resulting analogies in how those infrastructure investments propelled the national economy forward. And yet, the development of the information infrastructure is funded by and subsequently owned by private sector entities—corporations, individuals, universities, and conglomerates, rather than the government. (Benjamin 1995, Meyers 1995, PCCIP 1997)
The security considerations inherent in such an infrastructure have also been recognized along with the promise, and a series of studies were performed to examine the problem space and recommend courses of action. One study was the May 1995 report of the Information Infrastructure Task Force, “National Information Infrastructure Security: The Federal Role” which recommended a series of actions, from key escrowed encryption to government sponsored security technology developments (Anthes Safety Plan 1995). Yet another was the Defense Science Board’s Task Force on Information Warfare report, “Information Warfare—Defense,” which recommended increased spending on security efforts and a series of actions designed to raise awareness of the threat (Anthes DOD 1997, DSB 1996). These studies and reports all recognize that government action in raising security levels in the information infrastructure are limited to those elements of the infrastructure that the government can influence—a percentage estimated to be between five and twenty-five percent (DSB 1996, DISA 1995, JSC 1994).
Security concerns surrounding the information infrastructure have risen to such an extent that in 1992, the Federal Bureau of Investigation (FBI) established a National Computer Crime Squad (NCCS). The NCCS focuses on electronic crimes, including violations of the Federal Computer Fraud and Abuse Act of 1996 (DiDio 1998). And the National Counterintelligence Center, which provides an annual report to Congress on industrial espionage, stated in 1998 that information assets are a prime target for theft, specifically trade secret information and data on critical technologies (NACIC 1998).
Small Business and Information Technology
Small businesses, by their very nature, are able to adapt to change faster than large businesses. Small businesses are, in fact, “the fastest changing sector of business.” (SBA E-Commerce 1999) Small businesses are embracing the use of Internet technologies and e-commerce as a way to leverage their limited resources and reach an expanded customer base. In particular, ownership of personal computers with modems have made home-based businesses a much more attractive option than before, since small businesses can now literally operate out of a back bedroom or garage. According to the Small Business Administration’s Office of Advocacy, “home-based businesses represent about 18 percent of all homes with personal computers.” (SBA E-Commerce 1999)
The rate of Internet connectivity among small businesses rose from 21.5 percent in 1996 to 41.2 percent in 1998 to 61 percent in 1999. The percentage of small businesses with a World
– 7 –
Wide Web (WWW) presence was 35 percent in 1999. Of those small businesses with a Web site, 78 percent were motivated to develop one by a desire to reach new and potential customers. One third of small businesses currently perform business transactions using their Web site. Small businesses that use the WWW have higher annual revenues than those that do not, averaging about one million dollars per year more. (SBA Advocacy 1999) Clearly this is a powerful medium. As more small businesses show successful use of information technology, other small businesses will be motivated to adopt the technologies and practices associated with electronic commerce.
According to SBA research, the issues that arise in the move of small business to electronic commerce include the cost of establishing and maintaining an Internet presence and security issues associated with on-line transactions. Of the security-related concerns, the predominant one is that of fraud. The concern over fraud is expected to be amplified by security concerns related to digital cash, as that medium becomes common. (SBA E-Commerce 1999)
Small Business and Crime
Security for small businesses is a serious problem. On one hand, a small business typically does not have the business base across which to spread the cost of security personnel or technologies. It has been shown that businesses with more than 100 employees are better able to afford a security officer or manager on staff (Berger 1981). At the same time, it is also recognized that small businesses suffer more from crime than larger ones and bear a heavier proportion of loss as a result of crime than other businesses (Chelimsky 1981). The obvious conclusion is that those least able to protect themselves—the smallest of small businesses—are victimized more often, and with more serious results.
Of the various types of crime to which small businesses are exposed, by far the most devastating to business as a whole is internal theft. Insurance companies have been attributed approximately thirty percent of business failures to internal theft. (Chelimsky 1981). A twenty-year analysis of white-collar crime revealed that internal theft by employees consistently exceeded the combined effects of shoplifting, holdups, and burglary (Berger 1981).
As more processes are computerized, the potential vulnerability of small businesses to internal theft rises. This is particularly true with regards to theft of money, which is the most threatening crime to small business (Doney 1998). Most small businesses aren’t large enough to have experts in security on staff (Keogh 1981). And yet the potential result of computer based crime is catastrophic—business failure, financial liability, and potentially personal liability. “Studies indicate that the average loss is about ten times higher when a computer is used compared to when the crime is committed without it.” (Doney 1998)
The problems caused by exploitation of the vulnerabilities associated with computer-based crimes can be expected to get worse before it gets better. While both business educators and

– 8 –
business managers agree that top priorities include competencies in word processing and spreadsheet processing, they differ dramatically on the issue of computer security awareness. Business managers rate computer security awareness as an important part of a business curriculum, while those who actually design and implement the curriculum—the educators—view it as peripheral. (Solak 1998)
Small Business Distribution
A common definition of a small business is one that has less than 500 employees. (SBA Advocacy 1999) US legal code provides much more precise definitions of what constitutes a small business, specified at the Standard Industrial Classification (SIC) Code level. Agricultural firms, for example, are defined as small if they receive less than $500,000.00 in revenue per year, averaged over the previous three years. Travel agencies, on the other hand, are considered small if they receive less than $1,000,000.00 per year in revenue. Courier services are considered small if they receive less than $18,000,000.00 per year in revenue. (SBA Regulations 1999) Accordingly, using the rule of thumb that a small business is one with less than 500 employees proves to be useful when conducting broad ranging research.
The distribution of small businesses within the state of Maryland is, in a word, average. It represents the average distribution of small businesses across the nation, both in terms of absolute numbers and in terms of comparative ratios to employable population base and large businesses.
In 1996, there were 18,813 large businesses in the US, of which 3,197 had more than 2,500 employees. In that same year, there were 5,459,234 businesses with less than 500 employees in the US (SBA Advocacy 1999). In 1997, the state of Maryland had 125,755 businesses, 125,378 of which were small businesses (SBA Stats 1999).
In order to understand how Maryland compares to the rest of the states, comparative statistics derived from the 1996 SBA data are useful. For all the states (including the District of Columbia), the average (arithmetic mean) number of small businesses per state was 107,106. The standard deviation was 114,869 (large states like California have many more small businesses than smaller states). The median was 77,309 and the average deviation from the mean was 77,753. For large businesses, the average number per state was 2,044 with a standard deviation of 1,130. The median was 1,957 and the average deviation from the mean was 921. Maryland had 100,925 small businesses and 2,344 large businesses.
The state with the most small businesses in 1996 was California, with 620,810, followed in second place by New York, with 407,163. The states with the most large businesses were California, with 5,008, and Texas, with 4,502 (SBA Stats 1999).
These states are also large, both in population and size. Comparing the ratios of businesses to the number of people employed provides a different ranking. The average number of small

– 9 –
businesses per the employed population in 1996 for the US was 0.060 with a standard deviation of 0.013. The median was 0.055 and the average deviation from the mean was 0.010.
The states with the largest number of small businesses per employment base were Montana and Wyoming, with 0.099 and 0.095 small businesses per total employed population. The states with the fewest number of small businesses per employment base were the District of Columbia and Nevada, with 0.040 and 0.045 small businesses per total employed population. Maryland ranked 27th from the highest in that calculation, with 0.055 small businesses per total employed population.
The average number of large businesses per the employed population in 1996 for the US was 0.0015 with a standard deviation of 0.0006. The median was 0.0015 and the average deviation from the mean was zero.
The states with the largest number of large businesses per employment base were Delaware and Wyoming, with 0.0035 and 0.0032 large businesses per total employed population. The states with the fewest number of large businesses per employment base were California and New York, with 0.0004 and 0.0006 large businesses per total employed population. Maryland ranked 33rd from the highest in that calculation, with 0.0013 large businesses per total employed population.
The average number of small businesses per large businesses in the United States in 1996 was 44.67 with a standard deviation of 19.91. The median was 40.28 and the average deviation from the mean was 13.67. The two states with the highest ratio of small businesses to large businesses were California and New York, with 349.79 and 123.96 small businesses per large business respectively. The two states with the smallest ratio of small businesses to large businesses were Delaware and the District of Columbia, with 15.02 and 15.88 small businesses per large business respectively. Maryland ranked 19th from the highest with 43.06 small businesses per large business. This data is summarized in Table 1.
State of Security Practice in Business
To date, there has been no quantifiable data developed within academic circles on the state of information security practice in business. The data that exists has been developed by commercial organizations with business interests in information security consulting or services, such as Ernst & Young, and by organizations with charter responsibilities in the information security and technology arena, such as the Computer Security Institute. As such, no literature is available in standard academic publications or refereed journals describing the state of information security practice in business. In order to create some baseline of data from which to conduct this research effort, the available non-academic survey information was collected and investigated.

– 10 –
Table 1 Business Distribution Data
Number of Small
Businesses
Number of Large
Businesses
Ratio of Small Businesses
per Total Employment
Base
Ratio of Large Businesses
per Total Employment
Base
Ratio of Small Businesses to
Large Businesses
Median 77,309 1957 0.055 0.0015 40.28
Mean 107,106 2044 0.060 0.0015 44.67
Standard Deviation
114,869 1130 0.013 0.0006 19.91
An analysis of fourteen publicly available surveys on the state of information security reveals that the majority of these surveys target information technology professionals and information security professionals at large companies. Table 2 shows the number of respondents and the global reach of each of these surveys.
Half of the surveys were limited to the North American continent: four of the surveys covered only US firms and three covered firms in the US and Canada. Of the remaining seven, five were global in reach. The data represented by these surveys must be considered in light of how the data was collected. The surveys predominantly targeted individuals rather than corporations. Only two of the fourteen attempted to specify one response per company. Because the others did not so distinguish, the data can not be generalized to company experiences but only to individual experiences. For the majority of these surveys, it is possible and even probable that responses were received from individuals working for the same company. Therefore, any bit of data must be considered in light of an individual’s experiences rather than the experiences of a company. It can not, for example, be said based on this data that a certain percentage of corporations have security policies. It can only be said that a certain percentage of individuals are likely to have security policies in their companies.
Half of the surveys were limited to the North American continent: four of the surveys covered only US firms and three covered firms in the US and Canada. Of the remaining seven, five were global in reach. The data represented by these surveys must be considered in light of how the data was collected. The surveys predominantly targeted individuals rather than corporations. Only two of the fourteen attempted to specify one response per company. Because the others did not so distinguish, the data can not be generalized to company experiences but only to individual experiences. For the majority of these surveys, it is possible and even probable that responses were received from individuals working for the same company. Therefore, any bit of data must be considered in light of an individual’s experiences rather than the experiences of a company. It can not, for example, be said based on this data that a certain percentage of corporations have security policies. It can only be said that a certain percentage of individuals are likely to have security policies in their companies.

– 11 –
Table 2 Survey Respondents Comparison
Survey Identifier
Survey Name
Respondents
Number of Companies
Countries
BISS98 NCC Business Information Security Survey 1998 unknown unknown UK
CG97 Colin Germain/City University of London 1997 Security Survey
56 56 UK, Int'l
CSI97 Issues and Trends: 1997 CSI/FBI Computer Crime and Security Survey
520 unknown US
CSI98 Issues and Trends: 1998 CSI/FBI Computer Crime and Security Survey
520 unknown US
CSI99 Issues and Trends: 1999 CSI/FBI Computer Crime and Security Survey
521 unknown US
E&Y95 Third Annual E&Y Information Security Survey 1290 unknown US, Canada
E&Y96 Fourth Annual E&Y Information Security Survey 1320 unknown US, Canada
E&Y97 Fifth Annual E&Y Information Security Survey 3599 unknown 24 global
E&Y98 Second Annual E&Y Global Information Security Survey
4300 unknown 35 global
Ebiz99 Securing the E-Business 1999 Security Survey 1130 unknown US, UK, Asia
ISM99 ISM 1999 Security Survey 745 unknown US, Canada
KPMG96 KPMG National Computer Security Survey 1996 1452 1452 UK, Ireland
PWC98 1998 InformationWeek/PWC Global Information Security Survey
1600 unknown 50 global
WarRoom96 Information Systems Security Survey 205 205 US
NCC 1998, Germain 1997, CSI 1997—1998, Panettieri 1995, Status of Defense 1996, How We Got Number 1997, E&Y 1998, Securing E-Business 1999, ISM 1999, KPMG 1996, PWC 1998, WarRoom 1996.
Table 3 shows the types of respondents targeted by the surveys. Of the fourteen surveys listed, nine, or 64.2 percent, solicited responses from information technology or information security professionals. The other five targeted executive managers. Three of the fourteen were targeted solely at large companies. Three of the fourteen collected data from respondents over the Internet.
Performing a meta-analysis of the surveys would be difficult because the questions differ both in content and method from survey to survey and because the results were developed and reported in different ways. However, comparing the surveys’ common results reveals an interesting divergence of results. For example, seven of the surveys asked the respondents if their organizations had a security policy. The reported results range from 19 percent of the respondents as having a policy (PWC 1998) to the “vast majority” of respondents having a policy (Securing E-Business 1999).

– 12 –
Table 3 Survey Method Comparison
Survey Identifier
Survey Name Survey Method
Type of Respondent
BISS98 NCC Business Information Security Survey 1998
unknown Business managers
CG97 Colin Germain/City University of London 1997 Security Survey
mail; Internet survey
34 firms from a sample of 200 from London Times 1000 UK plus 22 firms that completed the Internet survey
CSI97 Issues and Trends: 1997 CSI/FBI Computer Crime and Security Survey
mail Security professionals
CSI98 Issues and Trends: 1998 CSI/FBI Computer Crime and Security Survey
mail Security professionals
CSI99 Issues and Trends: 1999 CSI/FBI Computer Crime and Security Survey
mail Security professionals
E&Y95 Third Annual E&Y Information Security Survey
mail Information systems managers, information security managers
E&Y96 Fourth Annual E&Y Information Security Survey
mail Information systems managers, information security managers
E&Y97 Fifth Annual E&Y Information Security Survey
mail Information systems managers, information security managers
E&Y98 Second Annual E&Y Global Information Security Survey
mail Information systems managers, information security managers
Ebiz99 Securing the E-Business 1999 Security Survey
Internet, telephone
Self selected, 46% from financial and government organizations; 62 telephone interviews conducted
ISM99 ISM 1999 Security Survey Internet Self selected security professionals
KPMG96 KPMG National Computer Security Survey 1996
mail UK and Ireland firms with over 10 million pounds annual turnover
PWC98 1998 InformationWeek/PWC Global Information Security Survey
fax Senior IT and security professionals; respondent list generated predominately from InformationWeek subscriber list
WarRoom96 Information Systems Security Survey mail Fortune 500 senior executives; 49.8% security managers
NCC 1998, Germain 1997, CSI 1997—1998, Panettieri 1995, Status of Defense 1996, How We Got Number 1997, E&Y 1998, Securing E-Business 1999, ISM 1999, KPMG 1996, PWC 1998, WarRoom 1996.
In chronological order, the survey results regarding the existence of a security policy are presented in Table 4. Even within specific years, the numbers range dramatically. Figure 1 shows the data graphically. The grouped data mean and standard deviation, 0.49 and 0.239 respectively, are plotted on the chart. Three of the surveys reported results that fall within one standard deviation of the grouped data mean.

– 13 –
Table 4 Survey Comparisons: Policy Question
Survey Percent With Security Policy
WarRoom 96 83.4 %
KPMG96 45 %
BISS98 39 %
PWC98 19 %
E&Y98 56 %
ISM99 76 %
Ebiz99 “vast majority”
WarRoom 1996, KPMG 1996, NCC 1998, PWC 1998, E&Y 1998, ISM 1999, Securing E-Business 1999.
Five of the surveys asked specifically if the respondents had experienced any security breaches in the previous year. The other surveys did not report the aggregate percentage of respondents reporting security breaches, preferring instead to report specific kinds of security incidents.
Of the five surveys that did report aggregate percentages of respondents affirming one or more security breaches, the numbers ranged from a low of 42 percent (CSI 1996) to a high of 73 percent (PWC 1998). Table 5 shows the specific survey data. Figure 2 shows the data graphically. The grouped data mean and standard deviation, 0.48 and 0.134 respectively, are plotted on the chart.
Examined chronologically, this data would seem to indicate a steady increase in security breaches being experienced. Three of the five survey results fall within one standard deviation of the grouped data mean. Two, CSI98 and PWC98, are well out of range on the high side, reporting 64 percent and 73 percent respectively of respondents indicating that they had experienced a security breach in the previous year.
Another frequently asked question, covered by nine of the surveys, related to monetary loss resulting from information security failures. Table 6 shows the surveyed results.
As can be seen by the reported data, the ability or the willingness of the respondents to quantify losses is limited at best. In many of the surveys, respondents were willing to admit that they had experienced loss but were unwilling or unable to quantify the losses. Most of the nine surveys approached this area of questioning from the point of view of how much damage had been done in aggregate.

– 14 –
0
0.1
0.2
0.3
0.4
0.5
0.6
0.7
0.8
0.9
1
WarRoom96 KPMG96 BISS98 PWC98 EY98 ISM990
0.1
0.2
0.3
0.4
0.5
0.6
0.7
0.8
0.9
1
MeanOne Standard
Deviation
Percent Respondents with Policy
Figure 1 Reported Percent with Security Policies
Table 5 Survey Comparisons: Security Breaches
Survey Security Breach Experienced
CSI96 42 percent had security breaches in the previous year
CSI97 48 percent had security breaches in the previous year
E&Y97 45 percent had security breaches in the previous year
CSI98 64 percent reported security breaches in the previous year
PWC98 73 percent had security breaches in the previous year
CSI 1996, CSI 1997, How We Got Number 1997, CSI 1998, PWC 1998.

– 15 –
0
0.1
0.2
0.3
0.4
0.5
0.6
0.7
0.8
0.9
1
CSI96 CSI97 E&Y97 CSI98 PWC98
Percent Respondents Reporting Security Breaches
Mean
Figure 2 Percent Respondents with Security Breaches
Table 6 Survey Comparison: Financial Loss
Survey Amount of Loss Reported
E&Y95 20 percent of respondents had losses greater than $1 Mil
WarRoom96 Insider Outsider Unknown 12.7 percent 21.0 percent < $10K 6.9 percent 4.4 percent $10K—200K 33.6 percent 22.9 percent $200K—1 M 31.2 percent 34.1 percent > $ 1 M 15.6 percent 17.6 percent
CSI97 Total losses for the 48 percent able to quantify: $100,115,555
CSI98 Total losses for the 46 percent able to quantify: $136,822,000
BISS98 Average cost for a security breach (all sites): £ 7,146 Average cost per breach, sites over 200 employees: £ 20,199
PWC98 Of the 82 percent reporting losses, 33 percent able to quantify losses: -- 84 percent lost between $1,000 and $100,000 -- 16 percent lost more than $100,000
ISM99 Total losses reported were $23,323,000 Average loss reported was $256,000
CSI99 Total losses for the 31 percent able to quantify: $123,779,000 Total losses for the 4.4 percent reporting theft of proprietary data: $42,496,000 Total losses for the 5 percent reporting financial fraud: $39,703,000
Ebiz99 Average cost for a power related incident: $2,000 Average cost for a virus related incident: $800 Average cost for an email related incident: $500
Panettieri 1995, WarRoom 1996, CSI 1997, CSI 1998, NCC 1998, PWC 1998, ISM 1999, CSI 1999, Securing E-Business 1999.

– 16 –
As a result, the losses reported include an average loss cited of $800 for a virus related security incident (Securing E-Business 1999), average costs for a security breach of any kind cited at £ 7,146 (approximately $10,000) (NCC 1998) and $256,000 (ISM 1999), as well as total losses for the year ranging from $23, 323,000 (ISM 1999) to $123,779,000 (CSI 1999).
Eight of the surveys asked respondents about unauthorized access to their systems. Some of the surveys differentiated between outsider access and insider abuse, with some even specifying the kind of insider (employee, contract worker, or business partner). The reported rates show an astonishing range of values, with two surveys showing only 4 percent (E&Y 1998) and 8 percent (Securing E-Business 1999) of respondents reporting external attacks while other surveys showed as high as 58 percent (WarRoom 1996) of respondents reporting outsiders as having attempted to gain access. Of the respondents reporting insider problems, the numbers were much closer together, but still ranging from a low of 44 percent (CSI 1998) to a high of 62.9 percent (WarRoom 1996). Table 7 presents the comparative data for the eight surveys.
Table 7 Survey Comparisons: Unauthorized Access
Survey Unauthorized Access
E&Y95 20 percent reported actual or attempted network intrusions
WarRoom96 62.9 percent caught insiders misusing systems 58 percent had outsiders attempt to gain access
CSI98 44 percent reported unauthorized access by employees 24 percent reported system penetration from outside
PWC98 58 percent said that insiders have abused access privileges 24 percent have seen outsiders break in
E&Y98 4 percent said that they had been broken into 77 percent said they had not experienced any break-ins
CSI99 55 percent reported unauthorized access by insiders 30 percent reported intrusions by outsiders
ISM99 52 percent reported employee access abuse 23 reported unauthorized access by outsiders
Ebiz99 8 percent reported experiencing attacks from the Web
Panettieri 1995, WarRoom 1996, CSI 1998, PWC 1998, E&Y 1998, CSI 1999, ISM 1999, Securing E-Business 1999.
Figure 3 shows the reported data regarding unauthorized access by outsiders graphically. The grouped data mean and standard deviation, 0.128 and 0.179 respectively, are plotted on the chart. Two of the surveys reported data that falls within one standard deviation of the grouped data mean. Of the six other surveys, five reported data that falls well within two standard deviations while one, the WarRoom 1996 Survey, reported data that lies in the fifth standard deviation (the value for five standard deviations above the mean is 0.576, while the WarRoom 1996 Survey reported 58 percent of respondents had experienced outsiders attempting to gain access).

– 17 –
The data reported for insiders abusing access is shown graphically in Figure 4. The grouped data mean and standard deviation, 0.545 and 0.07 respectively, are plotted on the chart. Three of the surveys reported data that falls within one standard deviation of the grouped data mean. The data reported by the other two surveys is in the third standard deviation from the grouped data mean.
0
0.1
0.2
0.3
0.4
0.5
0.6
0.7
0.8
0.9
1
E&Y95 WarRoom96 CSI98 PWC98 EY98 CSI99 ISM99 Ebiz99
MeanOne Standard Deviation
Percent Respondents Reporting Unauthorized Access by Outsiders
Figure 3 Respondents Reporting Unauthorized Access by Outsiders
Seven of the surveys specifically asked about Internet connectivity and security considerations. Again the surveys approached the question from a variety of perspectives, thereby making direct comparisons difficult or impossible. One asked whether the respondents believed it was possible to have secure transactions over the Internet (Germain 1997). Two others asked about general concern about Internet security (Panettieri 1995, Securing E-Business 1999). The others asked if the respondent’s Internet connection was a frequent point of attack (CSI 1997—1999). The reported results are listed in Table 8.
Six of the surveys asked respondents about how important security was in their organization. On each of the six surveys, the majority of respondents said that security was important. Table 9 presents the data from the six surveys.
Figure 5 shows the data on security importance graphically. The grouped data mean and standard deviation, 0.669 and 0.103 respectively, are plotted on the chart. Of the six surveys, three reported data falling within one standard deviation of the grouped data mean. Two of the surveys reported data falling into the second standard deviation from the grouped data mean and

– 18 –
the third, Ernst & Young 1997 Survey, was in the third standard deviation from the grouped data mean.
0
0.1
0.2
0.3
0.4
0.5
0.6
0.7
0.8
0.9
1
WarRoom96 CSI98 PWC98 CSI99 ISM99
Percent Respondents Reporting Insider Access Abuse
Mean
Figure 4 Percentage Respondents Reporting Insider Access Abuse
Table 8 Survey Comparisons: Internet Concerns
Survey Internet Concerns E&Y95 40 percent were not satisfied with Internet security
28 percent were satisfied with Internet security 32 percent were not sure
CSI96 37 percent said that their Internet connection was a frequent point of attack
CSI97 47 percent said that their Internet connection was a frequent point of attack
CG97 52 percent said that it was possible to have secure transactions over the Internet
CSI98 54 percent said that their Internet connection was a frequent point of attack
CSI99 57 percent said that their Internet connection was a frequent point of attack
Ebiz99 35 percent said that they are concerned about attacks from the Web 8 percent said that they have experienced such attacks
Panettieri 1995, CSI 1997, Germain 1997, CSI 1998, CSI 1999, Securing E-Business 1999.

– 19 –
Table 9 Survey Comparisons: Security Importance
Survey Importance of Security E&Y95 63 percent said security as important
E&Y97 84 percent said security was important
E&Y98 58 percent said security was important
BISS98 72 percent rated security as very important
PWC98 56 percent said security was a high priority
ISM99 65 percent said security had high visibility 83 percent said management supports security needs
Panettieri 1995, How We Got Number 1997, E&Y 1998, NCC 1998, PWC 1998, ISM 1999.
0
0.1
0.2
0.3
0.4
0.5
0.6
0.7
0.8
0.9
1
E&Y95 E&Y97 E&Y98 BISS98 PWC98 ISM99
Mean
Percent Respondents Reporting Security as Important in their Organization
Figure 5 Respondents Reporting Security as Important
Eight of the surveys asked respondents what their most important security concerns were. These concerns were solicited in a variety of manners, including asking what the single most pressing concern was (ISM 1999) and asking what the top five security breaches were (NCC 1998). Additionally, the surveys tended to give a set of security breach possibilities for the respondents to choose from, thereby framing the answer space. As can be seen in Table 10, viruses, some variety of theft (ranging from data to monetary assets), and system component failure appear in almost all the top five rankings.

– 20 –
Only two of the surveys asked if the respondents’ organizations had a business continuity plan or incident response team. The questions were somewhat different, one asking how effective the business continuity plan was in recovering from a breach while the other asked if a business continuity plan had been developed in the previous twelve months, so again the results are not comparable. Coincidentally, both surveys asking this question were both administered in 1998. The specific data is shown in Table 11.
Table 10 Survey Comparisons: Top Five Security Concerns
Survey Top Five Security Concerns
E&Y95 Network failure Software error Viruses Hardware failure Stolen data
E&Y98 Unauthorized users access violation
Authorized user access violation
Contract worker access violation
Former employee access violation
Competitors access violation
BISS98 Power failure User error LAN failure Viruses Theft
CSI98 Denial of Service attack
System penetration from outside
Theft of proprietary data
Financial fraud Sabotage
PWC98 Viruses Loss of information
Loss of integrity Denial of Service Software manipulation
CSI99 Insider abuse Viruses Laptop theft Denial of service attacks
Sabotage
Ebiz99 Viruses E-mail incidents Spam Power failure Hoaxes, jokes, pranks
ISM99 Viruses Employee access abuse
Unauthorized outsider
Theft or destruction of computer resources
Loss of proprietary data
Panettieri 1995, E&Y 1998, NCC 1998, CSI 1998, PWC 1998, CSI 1999, Securing E-Business 1999, ISM 1999.
Table 11 Survey Comparisons: Business Continuity Plan
Survey Business Continuity Plan
BISS98 56 percent had a business continuity plan -- 90 percent of those said it reduced the impact of a security breach
E&Y98 23 percent had incident response teams in place 10 percent had put a business continuity plan in place the previous year
NCC 1998, E&Y 1998.

– 21 –
Research Hypotheses
Does the existing data represent the experiences of small businesses in the United States? In order to be able to answer this question, data from small businesses must be compared to the data presented in the existing surveys.
The hypotheses that this research tests fall into two general categories. The first category of hypotheses relates to differences between the practice and experience of information security in small US businesses and the results published from the surveys described in the literature review. This set of hypotheses is constructed to answer the following two questions. First, are the experiences and practices of small businesses in the US similar to what is purported to be the generalized experiences and practices reported in the published survey data? If they are not, how do they differ?
But a third question presents itself as well: could the level of perceived exposure to information security risks via connectivity to the Internet influence the behavior of small businesses in terms of use of information security management and technology tools?
This question results in a second set of hypotheses, related to potential differences in information security practices and experiences between small businesses that are connected to the Internet and those that are not connected to the Internet. These two sets of hypotheses frame the basis for the research effort.
Research Goals
There are two specific goals of this research. Research Goal One is to determine the correlation between the published information security survey results and the state of information security in small businesses. Research Goal Two is to describe the experiences and opinions in small businesses regarding information security, distinguishing between two groups: those connected to the Internet and those without Internet connectivity.
Research Hypotheses
Research Goal One is framed by the following eight hypotheses, each of which examines an element of the published information security survey results and compares that result with the responses provided by participants in this research effort.
H1a: Small businesses are less likely to have a written security policy than the results reported in the surveys.
H1b: Small businesses are less likely to have experienced breaches in security than the results reported in the surveys.
H1c: Small businesses are equally unable to characterize financial losses from security breaches as compared to the results reported in the surveys.

– 22 –
H1d: Small businesses are less likely to have experienced unauthorized access by outsiders than the results reported in the surveys.
H1e: Small businesses are equally likely to have experienced unauthorized use of systems by insiders as the results reported in the surveys.
H1f: Small businesses are equally likely to view virus-related problems as one of their top five security concerns as the results reported in the surveys.
H1g: Small businesses are equally likely to view power failure as one of their top five security concerns as the results reported in the surveys.
H1h: Small businesses are less likely to view data theft as one of their top five security concerns as the results reported in the surveys.
These hypotheses and the correlation to the survey instrument elements are summarized in Table 12.
Table 12 Hypotheses Framing Research Goal One
Small Businesses
Survey Grouped
Data
Survey Form Questions
H1a: written security policy Less than 49 percent have
Mean = 0.49 5
H1b: experienced breaches in security
Less than 48 percent have
Mean = 0.48 7
H1c: financial losses from security breaches
37 percent able to characterize loss
Mean = 0.37 7
H1d: unauthorized access by outsiders
Less than 12.8 percent Mean = 0.128 7
H1e: unauthorized use of systems by insiders
Equally likely at 54.5 percent
Mean = 0.545 7
H1f: virus-related problems as one of top five security concerns
75 percent 75 percent 8
H1g: power failure as one of top five security concerns
25 percent 25 percent 8
H1h: data theft as one of top five security concerns
Less than 50 percent 50 percent 8
Research Goal Two is framed by the following eight hypotheses, each of which postulates a position regarding connectivity and information security concerns, practices, or experiences:
H2a: Small businesses that are connected to the Internet are more concerned about information security than small businesses that are not connected to the Internet.

– 23 –
H2b: Small businesses that are connected to the Internet are more likely to have written information security policies than small businesses that are not connected to the Internet.
H2c: Small businesses that are connected to the Internet are more likely to have experienced a breach of information security than small businesses that are not connected to the Internet.
H2d: Small businesses that are connected to the Internet are more likely to have suffered a financial loss due to an information security breach than small businesses that are not connected to the Internet.
H2e: Small businesses that are connected to the Internet are more likely to have had insiders abuse information system access privileges than small businesses that are not connected to the Internet.
H2f: Small businesses that are connected to the Internet are more likely to have had outsiders attempt to gain unauthorized access to their information assets than small businesses that are not connected to the Internet.
H2g: Small businesses that are connected to the Internet are more likely to have business continuity plans than small businesses that are not connected to the Internet.
H2h: Small businesses that are connected to the Internet have more information security technologies incorporated into the workplace than small businesses that are not connected to the Internet.
These hypotheses and the correlation to the survey instrument elements are summarized in Table 13.

– 24 –
Table 13 Hypotheses Framing Research Goal Two
With Internet
Without Internet
Survey Form Questions
H2a: Concern about security More Less 3, 7, 8
H2b: Written policies More likely to have Less likely to have 3, 5
H2c: Security breach experienced in last 12 months
More likely Less likely 3, 7
H2d: Financial loss due to information security breach
More likely Less likely 3, 7
H2e: Access abuse by insiders More likely Less likely 3, 7
H2f: Unauthorized access by outsiders attempted or achieved
More likely Less likely 3, 7
H2g: Business continuity plans More likely to have Less likely to have 3, 5
H2h: Information security technologies or tools
More likely to have Less likely to have 3, 6

Chapter Two
Research Method
The method followed for conducting this research was the collection and analysis of data in support of a descriptive research study. The data was collected in the first half of the year 2000 via a survey questionnaire, which was administered both personally and through the mail. The subjects were chosen randomly from small businesses nationwide.
Research Plan
Research was conducted through the use of a survey instrument that provided a means for collecting the data required without undue hardship on the respondents. A questionnaire was developed that provided a structured and repetitive method for collecting comparable data from each respondent. The instrument was administered to a random sample of the small business population in the United States. Once the data was in hand, the hypotheses were tested against the data. Finally, post hoc analysis was performed once hypothesis testing was completed.
The following sections describe the survey form design and validation, the sample selection procedures, the data collection procedures, and the analysis procedures.
Use of Surveys in Descriptive Research
Surveys, whether in the form of interviews or questionnaires, provide a structured methodology for collecting precisely the same data from every respondent participating in a descriptive research study. There are, however, design issues that must be taken into account when developing a survey instrument for research. (Gay and Diehl 1991, Creative Research Systems, 2000) The goals of the research must be clearly described and well contained. (Creative Research Systems 2000) The questions should each cover one specific issue or concept and be worded clearly. Questions that could offend or be leading should be avoided. Questions based on assumptions, particularly unwarranted assumptions, should be strictly avoided. Finally, the aggregation of data from a survey form should not allow a specific individual respondent to be identified. (Gay and Diehl 1991)
The use of questionnaires to collect data for descriptive research has both advantages and disadvantages. Disadvantages include not being able to engage the respondent in an empathetic conversation, which can encourage respondents to give honest answers. Additionally, it is impossible for the researcher to see if the respondent is having difficulty interpreting or answering a question, which an interviewer may be able to do. On the other hand, using questionnaires is typically more efficient in terms of the researcher’s time required, can be less expensive, and enables a wider geographic reach for the data collection than using the interview

– 26 –
process. (Gay and Diehl 1991) Decisions on both the survey methodology and the desired sample size must take into account how much time is available, how much money is available, and how much precision is desired for the research. (Creative Research Systems 2000)
The general steps in designing a survey instrument for conducting descriptive research are as follows:
1. Identify the research goals, as specifically as possible;
2. Determine the sample size of the target population;
3. Develop the questions and design the layout of the questionnaire;
4. Validate the instrument; and
5. Test the questionnaire on a subset of the sample population. (Gay and Diehl 1991, Creative Research Systems 2000)
The development of the questions and the design of the questionnaire is as important to the ultimate success of the research effort as any other step. The layout of the questionnaire should attract rather than repel—it should be neat, easy on the eyes, and brief. Structured questions with a set of specific answers, rather than open ended questions allowing free form answers, are preferable. (Gay and Diehl 1991) The number of questions should be limited to only the information required for the research goals. Brevity is a plus. Question order must be carefully considered as well, so those questions don’t imply answers to latter questions or lead the respondent to a desired response. Questions should be grouped by similarity of topic to make the questionnaire easier to answer. (Creative Research Systems 2000)
Survey Form Design
In order to reach a nationwide sample of the target population of small businesses in the United States, the questionnaire format was selected as the basis for the instrument for the survey. The survey instrument developed in support of this research is included as Figure 6 to this report. The questionnaire was designed to fulfill the following design goals:
1. The instrument should gather data that supports the research goals;
2. The instrument should be easy to understand;
3. The instrument should be easy to complete;
4. The instrument should take less than five minutes to complete; and
5. The instrument should be valid.
The questionnaire was redesigned five times in order to meet these design goals.
The research goals of describing the experiences and opinions in small businesses regarding information security and determining the correlation between the published information security survey results and the state of information security in small businesses led to the development of

– 27 –
Small Business Security Survey
Business Information2. Number employees
1 - 10 101-20011 - 20
21 - 50 201 - 50051-100
3. Annual Revenue0 to $500,000$500,001 to $1 million
$1 to $5 million
1. Business areaAgricultureManufacturingTransportation
MiningRetail
Other:
Some Employees, job related
4. Number computers
Information Security Practices
8. Technologies: Does your organization use any of the following?Anti-virus software
Firewall(s)
Intrusion Detection System(s)
For FilesEncryption
Dial-back modem
Media degaussers
System Access Control
Security Evaluation System(s)
PasswordsBiometric-based
Communications
Computers
Power surge protectors
Data backup system(s)
Digital signatures
System activity monitor
7. Policies and Procedures: Does your organization have any of the following?Information Security PolicyComputer Use & Misuse PolicyProprietary Data Use & Misuse PolicyCommunications Use & Misuse Policy
Business Continuity PlanInformation Security Procedures
Check the appropriate boxes�
Check the appropriate boxes�
Check the appropriate boxes�Information Security Experiences10. In the past 12 months, has your organization: 11. Indicate level of concern for the listed items
Not concerned Moderate Extremely Insider access abuse
Viruses
Power failure
Software problems
Data integrity
Outsider access abuse
Data secrecy
Data availability
Data theft
… experienced an information security incident?
… had an insider abuse information access privileges?
… had an outsider break in to the information systems?
… had proprietary data stolen?
… lost money due to an information security problem?
… had problems with viruses or other malicious software?
… had secret information divulged?
… had data get corrupted or partially lost?
… had problems with the reliability of information systems?
Can the amount be quantified? Yes NoHow much was lost?
More than $5 million
Computer Emergency Response Plan
Data Recovery Procedures
Data sabotage
User errors
… had computer equipment stolen?
Updated weeklyUpdated monthly
Updated annuallyUpdated occasionally
Not updated For Communications
Smart cards, tokens
Redundant systems
Power supplies
City, State:
6. Who can use the computers &/or network?1 - 56 - 1011 - 20
21 - 5051 - 100more
5. ConnectivityInternal LANIntranetExtranet
Internet accessWeb presenceE-commerce
ConstructionWholesale
Part-time EmployeesTemporary Employees
Contractors
CustomersFamily members, friends
Computer Emergency Response Team
All Full-time Employees E-commerce partners
(more access than simply accessing a web site; trusted access)
More than 500
Maintained internallyMaintenance outsourced
Maintained internallyMaintenance outsourced
Risk assessmentVulnerability checker
Data storage
Transaction integrity
Monitored locallyMonitored remotely
At external perimeterWithin the enterprise
Facility Access ControlBadgesBiometric-basedElectronic locks
AutomaticManual
Off-site Storage
Data Destruction ProceduresMedia Destruction Procedures
Information Sensitivity Levels or Coding
Data SegregationCompartmentalizationSensitive data controls
Shredders
Disk drive locks
Natural Disaster
Fraud
… been the victim of a natural disaster?
… been the victim of fraud?
9. Data Importance: How important is the following information to your enterprise?
Gas/Electric Communications
Finance/InsuranceReal Estate
ServicesSanitary
Not important Moderate Extremely Proprietary Information
Trade SecretsPrivacy Data
Not important Moderate Extremely Customer Data
Competitive DataMarket Data
… had employees abuse internet access privileges?
Figure 6 Survey Instrument

– 28 –
the specific survey questions. These questions were then formatted to minimize the amount of space on a single sheet of paper while still retaining readability and clarity. Because the number of questions was so large, a simple check box format was selected so that the respondent could simply and easily check off the appropriate response without having to consider too many alternatives. The trade-off for this design decision was a lack of precision for negative answers.
Testing and validation of the survey form was performed in the following steps. First, the questions were examined to see if they supported collecting data that would be testable against the hypotheses. The hypotheses were carefully examined against the instrument by a team of reviewers whose comments were incorporated into the first and second redesigns of the survey form.
Next, the questions were examined for ease of understanding and simplicity. Four individuals with limited familiarity with information security concepts assisted in proofreading the questions to insure that no misinterpretation was likely on the part of the respondent. This review step also assisted in estimating time to complete; in practice runs, the reviewers took an average of two and one half minutes to complete the survey form. Then, the instrument was tested for validity with two small businesses whose security practices are known to the researcher. The instrument did reflect the security practices and experiences correctly. Filling out the form for these two small businesses took the respondents approximately three minutes, which also validated the time design goal. Finally, the instrument was tested on a small subset of the target population in the Annapolis area. The data returned was useful and useable and follow-up interviews with the test case respondents indicated that there had been no difficulties in completing the questionnaire.
The survey form consists of eleven questions in three groups.
The first group of questions solicits information about the business and general information technology usage: the business area the company is in (based on Standard Industrial Code); the number of employees in the company; the annual revenue of the company; the number of computers used by the company; what kinds of networking connectivity the company has; how computers and networking are maintained; and who is allowed access to the computers and networks. The data collected through these questions provides the analytical framework for understanding the relationship of size (both in terms of number of employees and revenue) and connectivity to information security practices. The data collected is sufficiently sparse to protect the identity of the company providing the data. No response can be traced to a specific respondent.
The second group of questions covers the information security practices of the business, in terms of management tools and use of technologies. The management tools covered in the questionnaire include policies, procedures, and planning efforts. The choice of technologies listed in question eight was derived from the reviewed surveys covered in the Literature Research

– 29 –
section. These questions directly support testing the hypotheses of Research Goal One. The last question in the second section supports data collection on importance of different types of information to each respondent. This data supports identification of possible correlation between perceived importance of information to information security practices.
The third and final group of questions covers the information security experiences and concerns of the businesses responding to the survey. These questions support both Research Goals One and Two.
Survey Form Questions
The specific questions on the instrument were carefully designed for clarity and to elicit specific information useful to the research.
Question One asks the respondent to identify the business area in which the company does business. There are fourteen choices offered to the respondent, with the instruction to check the appropriate box. The choices are based on the Standard Industrial Classification (SIC) Codes that categorize areas of business. These are the definitions that are used by the United States Departments of Labor and Treasury, as well as the SBA, to track business sector performance. The decision to use these business categories, as opposed to others that might be more descriptive (such as Medical or Internet Service Provider), was due to the desire to make the data as useful as possible to the widest range of researchers.
Question Two asks the respondent to identify the number of employees that work for the business. This question might have been difficult, if respondents got confused over whether to count temporary or part time employees or not, but surprisingly, the only area of confusion were from individuals who annotated the form with a note that there was only one person in the firm, themselves. The categories for this question were selected from viewing the distinctions that the SBA makes in their analyses of small businesses. The SBA uses ten categories, including the category of “zero employees” and “1–4” employees. In order to make the questionnaire more readable, these categories were combined with the “less than 10” category into a single category of “1 to 10” employees. The SBA does not distinguish in its statistical presentations between size of firm from twenty employees to 99 (SBA Advocacy 1999); the survey form does distinguish at the level of fifty in an attempt to see if there are distinguishable differences might be reflected in security policies, procedures, or technologies. The choices offered on the questionnaire are from one to ten, eleven to twenty, twenty one to fifty, fifty one to one hundred, one hundred one to two hundred, two hundred to five hundred, and more than five hundred. The final choice was given in order to distinguish a respondent that fell out of the range of interest for this research effort.
Question Three asks the respondent to identify annual revenue. The purpose for including this question was to see if there was a correlation between the amount of revenue and the use of information security technology. The revenue figures are given as choices in several broad

– 30 –
categories: less than $500,000, from $500,000 to $1,000,000, from $1 million to $5 five million, and more than $5 million. The choice of these demarcations was influenced by the SBA’s distinguishing of small businesses based on revenue amounts, demarcated at the same levels. (SBA Advocacy 1999)
Question Four asks the respondent to identify the number of computers used by the business and to annotate whether the computers are maintained internally or whether the maintenance is outsourced. The choices for number of computers is given in the following groups: from one to five, from six to ten, from eleven to twenty, from twenty one to fifty, from fifty one to one hundred, and more than one hundred.
Question Five asks the respondent to characterize the kinds of connectivity the business uses and how the elements of the connectivity are maintained. The choices for this question, which are not exclusive, are internal local area network, intranet, extranet, Internet access, Web presence, and e-commerce. The maintenance choices are the same as for question four.
Question Six asks the respondent to identify what kinds of people are given trusted access to computers and networks in the business environment. The choices, which are not exclusive, are some employees dependent on job function, all full time employees, part time employees, temporary employees, contractors, e-commerce partners, customers, and family members and friends.
Question Seven asks the respondent to identify what kinds of information security related management tools the respondent uses. The choices are non-exclusive and include policies, procedures, and planning elements. The policy choices are information security policy, computer use and misuse policy, proprietary data use and misuse policy, and communications use and misuse policy. The procedure choices are information security procedures, data destruction procedures, media destruction procedures, data recovery procedures, and information sensitivity levels or coding. The planning elements are business continuity plan, computer emergency response plan, and computer emergency response team.
Question Eight asks the respondent to identity the information security related technologies in use by the business. The choices are non-exclusive and include technologies used for protecting information and systems, detecting problems or attacks on information and systems, and reacting to problems or attacks. The choices include anti-virus software, data segregation technology, firewalls, intrusion detection systems, encryption technology, system access control technologies, facility access control technologies, dial back modems, use of redundant systems, system activity monitors, media degaussers, power surge protectors, security evaluation systems, shredders, and data back-up systems. For the anti-virus software element, choices are additionally given to indicate how often the software is updated: weekly, monthly, annually, occasionally, and never. For data segregation technology, choices are additionally given to indicate if it is implemented by segregation or by sensitive data controls. For firewalls, choices are given to

– 31 –
indicate use of firewalls within the enterprise and at the external system perimeter. For intrusion detection systems, choices are given to indicate if the system is monitored remotely or locally. For encryption technology, choices are given to indicate use of encryption for files, communi-cations, and for digital signatures. For system access controls, choices are given to indicate use of passwords, biometrics, smart cards or tokens, and disk drive locks. For facility access control, choices are given to indicate use of badges, biometrics, and electronic locks. For redundant systems, choices are given to indicate redundancy of computers, data storage, power supplies, and communications. For security evaluation systems, choices are given to indicate risk assessment systems and vulnerability checking systems. For data backup systems, choices are given to indicate if the backup process is performed manually or automatically and if there is off-site storage associated with the backed up data.
Question Nine asks the respondent to identify the level of importance associated with six categories of information: proprietary data, trade secrets, privacy data, customer data, competitive data, and market data. The choices are presented on a five element scale ranging from not important at the low end to moderate in the middle to extremely on the high end. The intermediate levels are purposefully not named in order to keep the form from appearing over crowded.
Question Ten asks the respondent to identify what kind of experiences the business had experienced in the previous twelve months. The time element of twelve months was chosen for two reasons: first, many of the surveys covered in the literature research section specified a twelve month window; and second, the rapid rate of change of many variables in the information technology environment (including networking expansion, computer technology advances, number of users on the Internet, and evolution of information security related risks) would obviate inclusion of experiences longer than twelve months prior. The experience choices presented include those covered in the surveys covered in the literature research section. The non-exclusive experience choices include information security incident, natural disaster, fraud, insider abuse of access privileges, outsider break in to information systems, theft of proprietary data, viruses, exposure of secrets, corruption of data, reliability problems, theft of computer systems, employee abuse of Internet access, and financial loss due to information security problem. For the financial loss choice, two further questions are asked: if the amount can be quantified, and how much was lost.
Question Eleven asks the respondent to indicate the level of concern regarding the potential for experiencing information security related problems. The level of concern choices match with the choices given in question nine, ranging from not concerned to extremely concerned. There are fourteen items listed in this question, which are insider access abuse, viruses, power failure, software problems, data integrity, transaction integrity, outsider access abuse, data secrecy, data availability, data theft, data sabotage, user errors, natural disasters, and fraud.
In total, there are one hundred and ten variables on the questionnaire.

– 32 –
Sample Selection Procedures
The target population for this research was the small business community of the United States. A sample size of greater than two hundred responses was desired in order to be able to generalize from the sample to the target population at a 95 percent level of confidence.
A further sample selection criteria was that only one response should be received from any one business. This required that the targeted sample be approached specifically by identification of person and company to prevent overlaps. Procedures used to ensure that the individual respondent could not be matched to a single response included that the response envelopes supplied were pre-addressed and stamped with no other identifying marks. The survey forms themselves were also free of identifying marks.
In order to achieve these goals, the SBA online business card exchange server was used as a source of information. This introduces a bias to the survey, as only small businesses that had taken the time to register with the SBA were available through this source. This bias was ameliorated to some extent by also using friends, relatives, and business colleagues nationwide as points of distribution for questionnaires.
Five hundred and fifty three businesses were selected randomly from the SBA data source and questionnaires mailed to those businesses. A cover letter personalized to the solicited individual and business preceded the questionnaire. Included with the questionnaire were explanations of the research effort and a pre-addressed stamped envelope for the respondent to return the survey within. The return envelope was not marked in anyway that would allow identification of the respondent, thereby assuring the anonymity of the respondent.
One hundred and eighty eight businesses were solicited directly for participation in this research effort. Survey packages provided to these businesses included a generalized cover letter, the research explanatory sheet, and a pre-addressed stamped envelope. These return envelopes were also not marked in anyway that would allow identification of the respondent, again assuring the anonymity of the respondent.
In order to ensure that there would be no overlap between the businesses solicited by mail and directly, the selection of businesses from the SBA data source excluded any in the towns that were covered by direct solicitation.
The combined number of businesses solicited for participation in this research was 741. Of those, 212 responded to the questionnaire.

– 33 –
Analysis Procedures
The completed questionnaires were received by mail in the pre-addressed stamped envelopes provided. As each survey form was received, it was marked with a one-up unique identification number.
The data was then manually entered into a StatView dataset hosted on a Macintosh2 computer. The unique identification number was also entered along with the data, creating a one-to-one correspondence between the physical questionnaire and a row of data. This made it possible to double check the information contained in the original questionnaire against the data in the computer in case anomalies were noted during the analysis process.
StatView is a statistical analysis software package manufactured by the SAS Institute Inc. The version used was 5.0.1. StatView was used for the complex analysis functions.
Additionally, Microsoft Excel 98 was used for some simple descriptive analysis efforts and for creating combined views of complex sets of data.
The data was maintained in a single source to reduce chances for overlap or integrity errors. Backups of the data were kept in two geographically separate locations to assure availability.
Hypothesis testing was performed to see if the null hypotheses could reasonably be rejected at a 95 percent confidence level. Because the majority of the data is nominal in form, the chi-square test was used predominately for the testing purposes. Where the expected frequencies were very small or there was only a two by two relationship, Fisher’s Exact Test was used. For the computed aggregate for the questions related to concern, which were judged on a five-point scale, unpaired means comparison testing was performed using the t-test. The computed aggregates were calculated by assigning a value to each category response, with one being the lowest value and five being the highest value. Then an average score was calculated for each item of concern and added together to get a calculated aggregate concern score for each individual respondent. This compilation effectively created a continuous variable that is distributed fairly normally. Testing for each separate item of concern were performed using non-parametric tests.
Additional analyses were performed after hypothesis testing was completed. The results are presented in the following sections.
2Macintosh is a registered trademark of Apple Computers, Inc.


Chapter Three
The Respondents
The following sections describe the respondents in terms of location, business area, size, and infrastructure.
Locations of Respondents
Questionnaires were distributed to small businesses in all but five states of the United States. The five states omitted from the questionnaire distribution process were Delaware, Nevada, North Dakota, South Dakota, and Wyoming. Businesses from several states did not respond to the questionnaire, including those from Alaska, Arizona, Colorado, Iowa, Idaho, Indiana, Montana, Missouri, Mississippi, South Carolina, and Utah. Thirty-three states are represented in the responses, as well as the District of Columbia. Table 14 shows the break out of the data by state as well as by type of solicitation (mailed or direct). The response rate for directly solicited responses was 10.8 percentage points higher than for the mailed solicitations. The response rate for directly solicited responses was 36.7 percent while the response rate for mailed questionnaires was 25.9 percent.
Because of the location of the research activity and the ready availability of information regarding business activity and addresses, businesses within the state of Maryland received many more solicitations than businesses in any of the other individual states. Table 15 presents the data showing the distinction between the number of solicitations and responses for the state of Maryland versus all others. Businesses within Maryland accounted for 40 percent of all solicited businesses (298 out of 741) and 45.3 percent of all responses (96 out of 212).
Because Maryland is statistically average when compared to other states, the bias introduced by higher-than-average returns from businesses from Maryland can be discounted. To substantiate this, the section of this report entitled “Are Maryland Businesses Different?” presents the entire set of data compared between the responses received from Maryland businesses and all others.
Business Size
The vast majority of respondents, 168 or 79.2 percent, fall into the category of smallest of small businesses. Table 16 displays the distribution of data regarding number of employees for each responding business. Two respondents declined to answer this question. Three respondents are revealed to have more than five hundred employees and are therefore out of the range of this study. Figure 7 shows graphically the distribution of respondents in the various categories of size, as reflected by number of employees. The numbers in each category trail off as the size increases,

– 36 –
Table 14 Location and Method of Solicitation
Direct Mailed Total Total Response Direct MailedSolicitation Returned Solicitation Returned Solicited Responded Rate Response Response
Total 188 69 553 143 741 212 28.6% 36.7% 25.9%State
Alabama 10 6 6 16 6 37.5% 60.0% 0.0%Alaska 3 3 0 0.0% 0.0%Arizona 14 14 0 0.0% 0.0%Arkansas 4 1 4 1 25.0% 25.0%California 30 4 61 3 91 7 7.7% 13.3% 4.9%Colorado 9 9 0 0.0% 0.0%Connecticut 10 1 10 1 10.0% 10.0%Delaware 0 0 0District of Columbia 5 3 4 1 9 4 44.4% 60.0% 25.0%Florida 10 1 13 2 23 3 13.0% 10.0% 15.4%Georgia 5 1 5 1 20.0% 20.0%Hawaii 10 9 5 2 15 11 73.3% 90.0% 40.0%Idaho 1 1 0 0.0% 0.0%Illinois 1 1 12 3 13 4 30.8% 100.0% 25.0%Indiana 1 1 0 0.0% 0.0%Iowa 1 1 0 0.0% 0.0%Kansas 1 1 1 1 100.0% 100.0%Kentucky 4 1 4 1 25.0% 25.0%Louisiana 1 1 1 1 100.0% 100.0%Maine 4 1 4 1 25.0% 25.0%Maryland 35 14 263 82 298 96 32.2% 40.0% 31.2%Massachusetts 8 4 8 4 50.0% 50.0%Michigan 10 2 8 2 18 4 22.2% 20.0% 25.0%Minnesota 1 1 0 0.0% 0.0%Mississippi 2 2 0 0.0% 0.0%Missouri 6 6 0 0.0% 0.0%Montana 1 1 0 0.0% 0.0%Nebraska 1 1 1 1 100.0% 100.0%Nevada 0 0 0New Hampshire 1 1 2 0 3 1 33.3% 100.0% 0.0%New Jersey 5 16 6 21 6 28.6% 0.0% 37.5%New Mexico 10 3 2 12 3 25.0% 30.0% 0.0%New York 10 1 14 2 24 3 12.5% 10.0% 14.3%North Carolina 1 1 11 7 12 8 66.7% 100.0% 63.6%North Dakota 0 0 0Ohio 6 2 6 2 33.3% 33.3%Oklahoma 1 1 1 1 100.0% 100.0%Oregon 2 1 2 1 50.0% 50.0%Pennsylvania 2 2 15 4 17 6 35.3% 100.0% 26.7%Rhode Island 4 1 4 1 25.0% 25.0%South Carolina 1 1 0 0.0% 0.0%South Dakota 0 0 0Tennessee 10 6 2 16 2 12.5% 0.0% 33.3%Texas 10 4 9 3 19 7 36.8% 40.0% 33.3%Utah 2 2 0 0.0% 0.0%Vermont 1 1 0 0 1 1 100.0% 100.0%Virginia 25 14 3 1 28 15 53.6% 56.0% 33.3%Washington 1 1 2 1 3 2 66.7% 100.0% 50.0%West Virginia 4 3 4 3 75.0% 75.0%Wisconsin 4 2 4 2 50.0% 50.0%Wyoming 0 0 0UAE 1 1 0 1 1 100.0% 100.0%

– 37 –
Table 15 Maryland Respondents vs. All Others
Direct Mailed Total Total Response Direct MailedSolicitation Returned Solicitation Returned Solicited Responded Rate Response Response
Total 188 69 553 143 741 212 28.6% 36.7% 25.9%State
Maryland 35 14 263 82 298 96 32.2% 40.0% 31.2%All Others 153 55 290 61 443 116 26.2% 35.9% 21.0%
Table 16 Business Size (Number of Employees)
1681810
62332
212
CountLess Than 10From 11 to 20From 21 to 50From 51 to 100From 101 to 200From 201 to 500More than 500UnknownTotal
Frequency Distribution for Number Employees
0
50
100
150
200
1 to 10 11 to 20 21 to 50 51 to 100 101 to 200 201 to 500 501 plus
Figure 7 Business Size (Number of Employees)

– 38 –
going from eighteen in the category of from eleven to twenty employees, to ten in the category of from twenty-one to fifty employees, to six in the category of from fifty-one to one hundred employees, to only two in the category of between one and two hundred employees.
Table 17 shows the distribution of respondents in the various categories of size, as reflected by annual revenue. Figure 8 displays the data graphically. Thirty-five of the respondents declined to answer the annual revenue question. The displayed data includes those three respondents that have more than 500 employees. Of the respondents that did answer this question, 130 reported annual revenues of less than $500,000. Sixteen reported annual revenues between $500,000 and one million dollars while thirty-one reported revenues greater than one million dollars.
Table 17 Business Size (Annual Revenue)
13016201135
212
CountLess Than 500KFrom 500K to 1MFrom 1 to 5 MMore than 5MUnknownTotal
Frequency Distribution for Annual Revenue
0
50
100
150
200
0 to $500K $500K to $1M $1M to $5M More than $5M Not Answered
Figure 8 Business Size (Annual Revenue)

– 39 –
The combined data is presented in Table 18. From this data, it can be seen that the two respondents that declined to answer the question about number of employees report annual revenue between one and five million dollars. Of the thirty-five respondents that declined to answer the question about annual revenue, 26 reported having less than ten employees, three reported having between eleven and twenty employees, two reported having between fifty-one and one hundred employees, and one each reported having employees in the ranges of twenty-one to fifty, one hundred one to two hundred, two hundred one to five hundred, and more than five hundred. No respondent declined to answer both size-related questions.
Of the respondents who answered both questions, 127, or 59.9 percent, had both fewer than ten employees and less than $500,000 in annual revenue. Fifteen respondents reported having less than ten employees and having more than $500,000 in annual revenue. Of these fifteen, eleven reported revenues between $500,000 and one million dollars and four reported revenue between one and five million dollars.
Table 18 Business Size—Revenue and Employees
168 127 11 4 0 2618 1 4 9 1 310 1 1 4 3 1
6 0 0 1 3 22 0 0 0 1 13 1 0 0 1 13 0 0 0 2 12 0 0 2 0 0
212 130 16 20 11 35
Total … Less Than 500K … From 500K to 1M … From 1 to 5 M … More than 5M … Unknown …Less Than 10From 11 to 20From 21 to 50From 51 to 100From 101 to 200From 201 to 500More than 500UnknownTotal
Frequency Distribution for Number Employees Split By: Annual Revenue
Respondents’ Business Area
Respondents were asked to identify what field of business they were in as well as the size of the business. The options offered as answers to the business area question were based on the SIC Codes. This methodology was chosen in order to keep the information general enough so that individual respondents would not be identifiable from completed questionnaires. Additionally, the standard nature of the SIC assured a common understanding in meaning and supports further research efforts. Table 19 presents the counts and percentages of respondents for each business area. The total number of responses for the business areas other than Services is 92.

– 40 –
Of the business areas, responses were gathered for every business area except Mining and Gas and Electric. Only one response was in the business area of Sanitary. The great majority of responses, 120 or 56.6 percent, were in the area of Services.
Table 20 presents the number of respondents in terms of both business area and number of employees. Ninety-eight respondents were both in the Services business area as well as in the smallest of the small size range. The two most next populous business areas were Other and Retail, with 17 and 16 total respondents each. Three respondents were from companies with more than five hundred employees, which eliminates those responses from consideration during hypotheses testing. Of the 210 responses to the question on the number of employees, 168 fall into the smallest category. The total number for all other categories is 42.
Table 19 Frequency Distribution for Business Area
4 1.8879 4.2457 3.302
10 4.7176 2.830
16 7.5471 .472
10 4.7173 1.4159 4.245
120 56.60417 8.019
212 100.000
Count PercentAgricultureManufacturingTransportationFinance, InsuranceReal EstateRetailSanitaryConstructionWholesaleCommsServicesOtherTotal
Frequency Distribution for Business Area

– 41 –
Table 20 Business Area and Number of Employees
Business Size (Employees)Business Area 1 to 10 11 to 20 21 to 50 51 to 100 101 to 200 201 to 500 501 plus Total
Agriculture 3 1 4 1.9%Manufacturing 7 1 1 9 4.3%Transportation 4 1 1 1 7 3.3%Finance/Insurance 5 2 2 1 10 4.8%Real Estate 3 1 1 1 6 2.9%Mining 0 0.0%Retail 15 1 16 7.6%Gas/Electric 0 0.0%Sanitary 1 1 0.5%Construction 9 1 10 4.8%Wholesale 2 1 3 1.4%Communications 9 9 4.3%Services 98 10 5 2 1 1 1 118 56.2%Other 13 2 1 1 17 8.1%Total 168 18 10 6 2 3 3 210Percentage 80.0% 8.6% 4.8% 2.9% 1.0% 1.4% 1.4%
(Two respondents did not answer the question about number of employees)
Table 21 displays the data in terms of business area and annual revenue. Eighty-one of the 177 that answered this question fall into the combined category of the smallest annual revenue and the Services business area. The total number of respondents falling into the smallest annual revenue category is 131. The total from all other annual revenue categories is 46.
Table 21 Business Area and Size (Revenue)
Business Size (Revenue) NotBusiness Area 0 to $500K $500K to $1M $1M to $5M More than $5M Answered Total
Agriculture 1 1 2 4 1.9%Manufacturing 6 1 2 9 4.2%Transportation 4 3 7 3.3%Finance/Insurance 4 1 3 2 10 4.7%Real Estate 2 1 1 2 6 2.8%Mining 0 0.0%Retail 10 1 1 4 16 7.5%Gas/Electric 0 0.0%Sanitary 1 1 0.5%Construction 6 1 1 2 10 4.7%Wholesale 1 2 3 1.4%Communications 9 9 4.2%Services 81 12 12 6 9 120 56.6%Other 7 1 9 17 8.0%
Total 131 16 18 12 35 212Percentage 61.8% 7.5% 8.5% 5.7% 16.5%

– 42 –
Information Infrastructure
The following sections describe the information infrastructure elements of the small businesses that responded to this questionnaire. The elements covered include number of computers, how the computers are maintained, types of networking connectivity, and how that connectivity is maintained.
Number of Computers
Table 22 displays the frequency counts for responses to the question about number of computers. This data excludes the three respondents with more than five hundred employees.
Table 22 Number of Computers
2 1.0152 72.7
21 10.014 6.710 4.8
7 3.33 1.4
209 100.0
Count PercentNoneLess than 5From 6 to 10From 11 to 20From 21 to 50From 51 to 100More than 100Total
Frequency Distribution for Number Computers Inclusion criteria: SmallOnly from Returned Survey Data
The majority of respondents, 152 or 72.7 percent, had from one to five computers for the business. Two respondents reported not having any computers. While the question did not allow for this answer, which indicates an unwarranted assumption in the development of the questionnaire, the two respondents both annotated the response form to indicate that each did not have any computers. All other respondents indicated one of the given categories. The total number of respondents with less than ten computers for their businesses is 175 or 83.7 percent. The total number of respondents with more than ten computers is 34, or 16.3 percent. Ten reported having between twenty-one and fifty computers, seven reported between fifty-one and one hundred computers, and three reported having more than one hundred computers.
Table 23 presents the number of computers for respondents by each business area. Every business area showed use of computers. Respondents from the Services business area reported the widest range of numbers of computers, with respondents in every category. Table 24 shows the same data calculated as percentages of the total number of respondents for each business area.

– 43 –
For the business area of Agriculture, a total of four respondents responded to the questionnaire. Of these four, two (50 percent) reported having less than five computers for their businesses, one (25 percent) reported having from six to ten computers, and one (25 percent) reported having between fifty-one and one hundred computers.
For the business area of Manufacturing, a total of nine respondents completed the questionnaire. Of these nine, eight (88.9 percent) reported having less than five computers for their businesses and one (11.1 percent) reported having between fifty-one and one hundred computers.
Table 23 Business Area and Number of Computers (Count)
2000000000020
15228454
141827
8512
211010010201
141
14000011001092
10000200000161
7111210000010
3000000000021
20949696
161
1039
11917
Total CountAgriculture CountManufacturing CountTransportation CountFinance, Insurance CountReal Estate CountRetail CountSanitary CountConstruction CountWholesale CountComms CountServices CountOther Count
None Less than 5 From 6 to 10 From 11 to 20 From 21 to 50 From 51 to 100 More than 100 Total
Frequency Distribution for Number Computers Split By: Business Area Inclusion criteria: SmallOnly from Returned Survey Data
Table 24 Business Area and Number of Computers (Percentage)
1.00.00.00.00.00.00.00.00.00.00.01.70.0
72.750.088.966.755.666.787.5
100.080.066.777.871.470.6
10.025.0
0.016.7
0.00.06.20.0
20.00.0
11.111.8
5.9
6.70.00.00.00.0
16.76.20.00.0
33.30.07.6
11.8
4.80.00.00.0
22.20.00.00.00.00.0
11.15.05.9
3.325.011.116.722.216.7
0.00.00.00.00.0
.80.0
1.40.00.00.00.00.00.00.00.00.00.01.75.9
100.0100.0100.0100.0100.0100.0100.0100.0100.0100.0100.0100.0100.0
Total PercentAgriculture PercentManufacturing PercentTransportation PercentFinance, Insurance PercentReal Estate PercentRetail PercentSanitary PercentConstruction PercentWholesale PercentComms PercentServices PercentOther Percent
None Less than 5 From 6 to 10 From 11 to 20 From 21 to 50 From 51 to 100 More than 100 Total
Frequency Distribution for Number Computers Split By: Business Area Inclusion criteria: SmallOnly from Returned Survey Data
– 44 –
For the business area of Transportation, six respondents completed the questionnaire. Of these six, four (66.7 percent) reported having less than five computers for their businesses, one (16.7 percent) reported having between six and ten, and one (16.7 percent) reported having from fifty-one to one hundred computers.
For the business area of Finance and Insurance, nine respondents completed the questionnaire. Of these nine, five (55.6 percent) reported having less than five computers for their businesses, two (22.2 percent) reported having between twenty-one and fifty, and two (22.2 percent) reported having from fifty-one to one hundred computers.
For the business area of Real Estate, six respondents completed the questionnaire. Of these six, four (66.7 percent) reported having less than five computers for their businesses, one (16.7 percent) reported having between eleven and twenty, and one (16.7 percent) reported having from fifty-one to one hundred computers.
For the business area of Retail, sixteen respondents completed the questionnaire. Of these sixteen, fourteen (87.5 percent) reported having less than five computers for their businesses, one (6.2 percent) reported having between six and ten, and one (6.2 percent) reported having from eleven to twenty computers.
For the Sanitary business area, one respondent completed the questionnaire and reported having less than five computers for the business.
For the business area of Construction, ten respondents completed the questionnaire. Of these ten, eight (80 percent) reported having less than five computers for their businesses and two (20 percent) reported having between six and ten computers.
For the business area of Wholesale, three respondents completed the questionnaire. Of these three, two (66.7 percent) reported having less than five computers for their businesses and one (33.3 percent) reported having from eleven to twenty computers.
For the business area of Communications, nine respondents completed the questionnaire. Of these nine, seven (77.8 percent) reported having less than five computers for their businesses, one (11.1 percent) reported having between six and ten, and one (11.1 percent) reported having from twenty-one to fifty computers.
For the business area of Services, 119 respondents completed the questionnaire. Of these 119, two (1.7 percent) reported having no computers, 85 (71.4 percent) reported having less than five computers for their businesses, fourteen (11.8 percent) reported having between six and ten, nine (7.6 percent) reported having between eleven and twenty, six (5.0 percent) reported having between twenty-one and fifty, one (0.8 percent) reported having from fifty-one to one hundred computers, and two (1.7 percent) reported having more than one hundred computers.
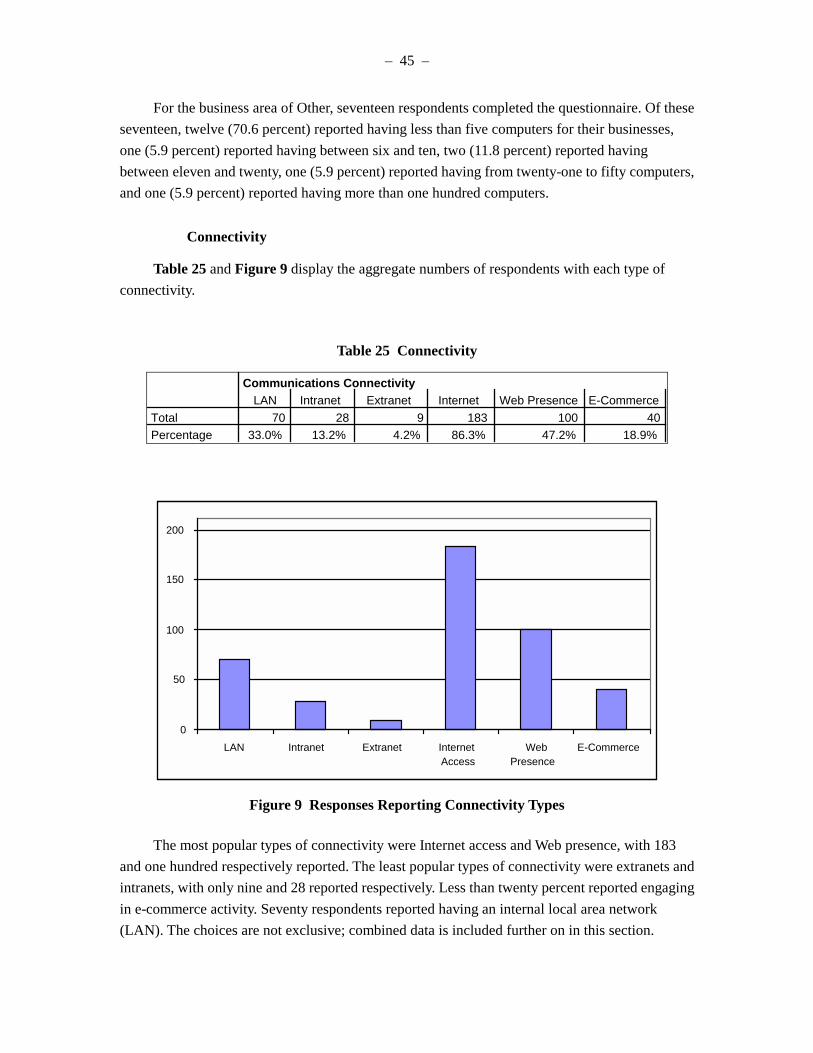
– 45 –
For the business area of Other, seventeen respondents completed the questionnaire. Of these seventeen, twelve (70.6 percent) reported having less than five computers for their businesses, one (5.9 percent) reported having between six and ten, two (11.8 percent) reported having between eleven and twenty, one (5.9 percent) reported having from twenty-one to fifty computers, and one (5.9 percent) reported having more than one hundred computers.
Connectivity
Table 25 and Figure 9 display the aggregate numbers of respondents with each type of connectivity.
Table 25 Connectivity
Communications ConnectivityLAN Intranet Extranet Internet Web Presence E-Commerce
Total 70 28 9 183 100 40Percentage 33.0% 13.2% 4.2% 86.3% 47.2% 18.9%
0
50
100
150
200
LAN Intranet Extranet InternetAccess
WebPresence
E-Commerce
Figure 9 Responses Reporting Connectivity Types
The most popular types of connectivity were Internet access and Web presence, with 183 and one hundred respectively reported. The least popular types of connectivity were extranets and intranets, with only nine and 28 reported respectively. Less than twenty percent reported engaging in e-commerce activity. Seventy respondents reported having an internal local area network (LAN). The choices are not exclusive; combined data is included further on in this section.

– 46 –
Internet access was reported by 86.3 percent of the respondents. This number is higher than the rate reported by the SBA in 1999, which was 61 percent, but not outside the bounds of predicted increase. Figure 10 displays an extrapolation of previous years’ data (dashed line) combined with the reported percentage of Internet connectivity from this research (86.3 percent).
0
10
20
30
40
50
60
70
80
90
100
1997 1998 1999 2000
SBA Data
Figure 10 Internet Connectivity Percentage by Year
Table 26 Business Area and Types of Connectivity
Communications ConnectivityBusiness Area LAN Intranet Extranet Internet Access Web Presence E-Commerce
Agriculture 2 50.0% 1 25.0% 0.0% 4 100.0% 2 50.0% 1 25.0%Manufacturing 3 33.3% 1 11.1% 0.0% 8 88.9% 5 55.6% 2 22.2%Transportation 4 57.1% 1 14.3% 0.0% 7 100.0% 4 57.1% 2 28.6%Finance/Insurance 5 50.0% 2 20.0% 0.0% 8 80.0% 4 40.0% 2 20.0%Real Estate 2 33.3% 1 16.7% 0.0% 5 83.3% 3 50.0% 0.0%MiningRetail 4 25.0% 1 6.3% 0.0% 12 75.0% 6 37.5% 6 37.5%Gas/ElectricSanitary 1 100.0% 0.0% 0.0% 0.0% 0.0% 0.0%Construction 2 20.0% 1 10.0% 0.0% 8 80.0% 2 20.0% 1 10.0%Wholesale 0.0% 0.0% 0.0% 3 100.0% 1 33.3% 0.0%Communications 0.0% 1 11.1% 0.0% 8 88.9% 4 44.4% 0.0%Services 44 36.7% 16 13.3% 7 5.8% 105 87.5% 61 50.8% 22 18.3%Other 3 17.6% 3 17.6% 2 11.8% 15 88.2% 8 47.1% 4 23.5%Total 70 28 9 183 100 40Percentage 33.0% 13.2% 4.2% 86.3% 47.2% 18.9%
The SBA reported the rate of Internet connectivity among small businesses rose from 21.5 percent in 1996 to approximately 45 percent in 1998 to 61 percent in 1999). (SBA Advocacy

– 47 –
1999, 2000) The percentage reported in this research is in line with a linear extrapolation of the previous years’ data, as shown in Figure 10.
Table 26 shows the numbers of types of connectivity for respondents in each business area.
Only nine respondents in the two business areas of Services (seven respondents) and Other (two respondents) reported using extranets. Forty respondents in eight different business areas reported engaging in e-commerce activities. Only one business area did not include respondents reporting either Internet access or a Web presence, but this is not significant data since that business area, Sanitary, only had one respondent. Respondents in every other business area reported having Internet access. Forty respondents spread across ten business areas reported having intranets. Seventy respondents spread across ten business areas reported having local area networks.
Computers and Connectivity Maintenance
Table 27 displays the response counts for maintenance of computers and connectivity. A great many respondents did not answer this question for either computers or connectivity, which may indicate that they do not have any maintenance plan or have not had to consider maintenance as of the time that they filled out the questionnaires. This issue of how small businesses maintain their information systems and networking resources could indicate a rich area for follow-up research activities.
Table 27 Maintenance of Computers and Connectivity
MaintenanceComputers Connectivity
Maintained Internally 45 97Maintenance Outsourced 10 29Both Internal & Outsourced 10 9Not answered 144 74
Of the respondents that did check off one or more maintenance choices, most indicated that they maintain their resources internally. Forty-five respondents indicated that they maintained computers internally, while 97 indicated that they maintained their connectivity internally. Ten respondents outsource computer maintenance and 29 outsource connectivity maintenance. Ten respondents used both options for computers and nine used both options for connectivity.
Table 28 shows how the respondents’ answers correlate between computer maintenance and connectivity maintenance.

– 48 –
Table 28 Computer and Connectivity Maintenance
Connnectivity MaintenanceInternal Outsourced Both Not Answered Total
Internal 34 4 1 6 45Computer Outsourced 2 7 0 1 10Maintenance Both 3 1 6 0 10
Not answered 58 17 2 67 144
Total 97 29 9 74 209
Of the 45 respondents indicating internal maintenance of computer systems, 34 also indicated maintaining connectivity internally. Of the 65 respondents who indicated a maintenance choice for computer systems, seven did not answer the question regarding maintenance of connectivity. Of the 135 indicating a maintenance choice for connectivity, 77 did not indicate a choice for computer maintenance. Of the 97 indicating internal maintenance of connectivity, 58 did not indicate a choice for computer maintenance.
A variety of explanations present themselves for this data. On one hand, some respondents may have assumed that maintenance of connectivity implied maintenance of computers. Or some respondents may have assumed that answering one was the same as answering the other. Other explanations may be valid as well. The unfortunate fact remains, however, that this data is not useful without further explanations. These conflicting responses indicate that the questions were not appropriately worded to elicit useful data. Without further information, it is not possible to use this data on maintenance options for inferential research in this study.

Chapter Four
Importance of Information
This section presents the level of importance associated with six different categories of data, each of which could be considered data with high inherent security requirements. The six categories are proprietary information, trade secrets, privacy data, customer data, competitive data, and market data.
Thirteen respondents did not answer this question. Of those 13, there are no immediately obvious distinguishing characteristics that can be derived from the data.
Table 29 presents the returned data for each of the six categories of information, sorted by consensus importance rating.
Table 29 Data Importance
Data ImportanceNot Important Low Moderate High Extremely
Customer Data 17 7 31 28 113Privacy Data 37 17 30 30 82Proprietary Data 50 15 36 31 64Market Data 44 15 57 23 57Competitive Data 45 20 45 30 56Trade Secrets 82 23 33 13 45
Figure 11 presents the same data graphically, with an overlay of the combined average rating. In order to calculate this score, the categories were translated into numbers using one as the lowest score and five as the highest score.
The category of data that was judged to be of highest importance was customer data. Out of 196 respondents, 113, or 57.6 percent, rated customer data to be extremely important. An additional 59 judged it to be of either high or moderate importance. Only seven judged it to be of low importance and only 17 judged it to be of no importance.
Privacy data was second in importance to the respondents. Over 65 percent, 112 of the 196 respondents, rated privacy data to be either extremely or highly important. Of those, 82 indicated that it is extremely important. Thirty respondents indicated that privacy data is of moderate importance, while 47 indicated that it is either of low importance or not important.
Proprietary data, market data, competitive data, and trade secrets were all judged lower in importance and with a wider range of opinion. Trade secrets were judged to be of the lowest

– 50 –
overall importance by the respondents. This could well reflect the demographics of the survey sample, since most of them are very small businesses in the Services business area.
0
20
40
60
80
100
120
140
160
180
200
CustomerData
PrivacyData
ProprietaryData
Market Data CompetitiveData
TradeSecrets
1
2
3
4
5
Extremely High ModerateLow Not Important Average Score
Figure 11 Data Importance
Sixty-four respondents, or 32.7 percent, judge proprietary data to be extremely important. Fifty, or 25.5 percent, rate proprietary data as not important. Combining data together, 65 respondents, one more than the number judging proprietary data to be extremely important, rated proprietary data as either not important or of low importance. Sixty-seven indicated that proprietary data is of either moderate or high importance. The frequency counts for this data is displayed in Table 44.
The respondents were fairly evenly distributed in their opinions about competitive data. Forty-five respondents indicated that competitive data is not important, 45 indicated that it is of moderate importance, and 56 indicated that it is of high or extreme importance.
The respondents were also fairly evenly distributed in their opinions about market data importance. Fifty-seven rated it as extremely important; an additional 57 rated it as being of moderate importance. Forty-four rated it as being of no importance.

– 51 –
The number of respondents indicating that trade secrets have some level of importance to them is displayed in Table 44. Most of the respondents indicated that trade secrets are of no importance or of low importance to them. Eighty-two indicated that trade secrets are not important, while 23 indicated that trade secrets are of low importance. Forty-five respondents indicated that trade secrets are extremely important. Another thirteen indicated that trade secrets are of high importance. Thirty-three indicated that trade secrets are of moderate importance.


Chapter Five
Experiences and Concerns
This section describes the respondents’ information security experiences from the twelve months prior to filling out the questionnaire and the level of concern felt for potential information security related problem areas.
Information Security Experiences
Table 30, which is sorted from highest number of responses to lowest, displays the indicated experiences of the respondents.
Table 30 Information Security Experiences
In the past 12 months, has your organization:Yes Percentage
had data get corrupted or partially lost 60 28.7%had problems with viruses or other malicious software 43 20.6%had problems with the reliability of information systems 38 18.2%lost money due to an information security problem 19 9.1%experienced an information security incident 18 8.6%had employees abuse internet access privileges 14 6.7%been the victim of fraud 8 3.8%been the victim of a natural disaster 7 3.3%had an insider abuse information access privileges 7 3.3%had computer equipment stolen 6 2.9%had an outsider break in to the information systems 4 1.9%had secret information divulged 4 1.9%had proprietary data stolen 2 1.0%
The experience reported by the most respondents, 60 or 28.7 percent, was losing data. Interestingly enough, there appears to be no demonstrable correlation between having experienced the loss of data and having data recovery procedures. The observed and expected frequencies are displayed in Table 31. The chi-square value is computed at 0.134 with an associated p-value of 0.7141. The p-value associated with Fisher’s Exact Test is 0.7558. These values indicate that the null hypothesis, that these two variables are independent, can not be rejected.

– 54 –
Table 31 Data Loss and Data Recovery Procedures
91 58 14935 25 60
126 83 209
No Yes TotalsNoYesTotals
89.828 59.172 149.000
36.172 23.828 60.000
126 83.000 209.000
No Yes Totals
No
Yes
Totals
Observed Values Expected Values
The second and third most reported experiences also had to do with data integrity and availability issues. Having had problems with viruses or other malicious code was reported by 43 of the respondents. Thirty-eight of the respondents reported having experienced problems with the reliability of information systems.
There does not, again, appear to be a demonstrable relationship between having experienced problems with viruses and having anti-virus software. Comparing the two results in a chi-square value computed at 3.289 with an associated p-value of 0.0697. The p-value associated with Fisher’s Exact Test is 0.0776. For an alpha value of 0.05, these values do not allow the rejection of the null hypothesis that these two variables are independent. This is close; more data may allow the null hypothesis to be rejected.
Of the 19 respondents who reported having lost money due to an information security problem, fourteen indicated that they could quantify the amount lost. Of those fourteen, ten respondents actually did so. Figure 12 displays the data graphically. The amounts that these ten reported as having been lost ranged from $120,000 as a high value to a low value of $250. The average amount reported lost was $19,620. The trimmed mean is $9,493.75 and the median value is $2,750.

– 55 –
120000
3200025000
100003500 2000 1500 1500 450 250
0
20000
40000
60000
80000
100000
120000
1 2 3 4 5 6 7 8 9 10
Figure 12 Financial Losses Quantified
The experiences of the ten respondents able to quantify financial losses overwhelmingly also indicated having had data become corrupted or partially lost. Nine of the ten indicated that they had experienced that. The next most frequently indicated experience for these ten respondents was experiencing an information security incident—five of the ten indicated that experience. Three of the ten indicated experiencing reliability problems with information systems, having had computer equipment stolen, and having had employees abuse Internet access privileges. Two each indicated having experienced fraud, insider access abuse, theft of proprietary data, problems with viruses, and having had secret information divulged. One each indicated having experienced an outsider breaking into information systems and a natural disaster. Between them, the ten respondents indicated having experienced all of the given choices.
Information Security Concerns
Respondents were asked to indicate level of concern for potential problems. Four respondents did not indicate any level of concern for any of the choices.
The responses are tabulated in Table 32, sorted by level of concern. The highest levels of concern are expressed for viruses, data availability, and integrity. The lowest levels of concern are expressed for insider access abuse, fraud, and natural disasters. The aggregate scoring is presented in Figure 13, with a composite score overlaid on the graph. The score was calculated by assigning the value one to the lowest category and the value five to the highest category.
Viruses were rated as being of extreme concern to 66, or 32.1 percent, of respondents. Forty-three more rated them as being of high concern; a total of 109 rated viruses as being either of high or extreme concern. Only 36 total respondents indicated that viruses were of low or no concern.

– 56 –
Table 32 Level of Concern Responses
Level of ConcernNot Concerned Low Moderate High Extremely
Viruses 16 20 60 43 66Data Availability 41 13 48 44 59Data Integrity 36 22 49 40 58Transaction Integrity 44 19 44 42 56Software Problems 22 29 72 45 37Power Failure 37 31 63 34 40Data Secrecy 57 14 53 38 43User Errors 54 37 55 32 27Data Theft 69 33 37 24 42Data Sabotage 77 26 35 22 45Outsider Access Abuse 73 25 38 35 34Natural Disaster 64 38 58 23 22Fraud 80 30 45 15 35Insider Access Abuse 122 27 30 7 19
0
50
100
150
200
1
2
3
4
5
Extremely High ModerateLow Not Concerned Average Score
Figure 13 Level of Concern Values

– 57 –
Data availability was rated in aggregate to be of the next highest level of concern. Fifty-nine respondents rated it as being of extreme concern, 44 rated it as being of high concern, and 48 rated it as being of moderate concern. Thirteen said that it was of low concern while 41 indicated that it was of no concern.
Data integrity was rated somewhat similarly to data availability in terms of level of concern. Fifty-eight respondents indicated that data availability was of extreme concern and 40 indicated that it was of high concern. It was of moderate concern to 49 respondents. To 22 respondents, it was of low concern and of no concern at all to 36 respondents.
Transaction integrity was also rated similarly to both data integrity and data availability. Fifty-six rated it as an extreme concern, 42 as a high concern, and 44 as a moderate concern. Nineteen consider transaction integrity to be a low concern and 44 consider it to be of no concern.
Software problems garnered approximately the same aggregate level of concern as transaction integrity, but the individual responses were more tightly grouped towards the middle ranges. Seventy-two respondents indicated that software problems were of moderate concern, while a total of 82 considered them to be of high or extremely concern. Fifty-one, or 24.9 percent, considered them to be of low concern or of no concern.
Power failure and data secrecy were both ranked similarly. Forty respondents indicated that power failure of extreme concern and 43 indicated that data secrecy was of extreme concern. Similarly, 38 respondents thought that data secrecy was of high concern while 34 thought that power failure was of high concern. Sixty three respondents graded power failure a moderate concern while 53 graded data secrecy a moderate concern. Fifty-seven respondents said that data secrecy was of no concern and fourteen said it was of low concern. Power failure was rated a low concern by 31 respondents and of no concern by 37 respondents.
User errors, data theft, data sabotage, and outsider access abuse were all rated as being generally of slightly less than moderate concern. Of the four choices, user errors was indicated as an extreme concern the fewest—only 27 respondents indicated that choice. For these four categories, 91, 102, 103, and 98 respondents respectively indicated that they were of no or low concern.
Natural disasters, fraud, insider access abuse were judged to be the lowest concerns overall. Few respondents considered insider access abuse to be much higher than a moderate concern at most, with only 26 rating it as either high or extreme concern. Slightly more, 45 and 50 respectively, awarded the same levels to natural disaster and fraud.


Chapter Six
Information Security Practice In Small Business
To whom do small businesses grant access to their computers and networks? What kind of information security related management and technology tools do small businesses use? The following sections describe the data collected through the questionnaire regarding these areas.
Access Practices
Table 33 presents the data regarding who is allowed to use the computers and networks of the respondents. Three of the 209 respondents did not indicate any of the available choices. Of these three respondents, all have less than ten employees and less than $500,000 annual revenue; one has no computer and two have less than five computers; and one each is in the business areas of Construction, Services, and Other. It is possible that each is a single person operation with no access issues other than the business owner.
Of the 206 respondents who did indicate access practices, 120 or 57.4 percent, grant access to all full time employees. Sixty-six grant access to some employees according to job requirements and 36 grant access to part time employees. Few respondents grant access to temporary employees (14), contractors (14), e-commerce partners (4), or customers (13). Almost a quarter of the respondents, 51 or 24.4 percent, report granting access to family or friends.
Table 33 Access Practices
Access Practices Percent PercentYes No Yes No
Some Employees, Job Related 66 143 31.6% 68.4%All Full-Time Emplooyees 120 89 57.4% 42.6%Part-Time Employees 36 173 17.2% 82.8%Temporary Employees 14 195 6.7% 93.3%Contractors 14 195 6.7% 93.3%E-Commerce Partners 4 205 1.9% 98.1%Customers 13 196 6.2% 93.8%Family, Friends 51 158 24.4% 75.6%
Table 34 displays the data for employee access separated by employment status. Of the 120 respondents who grant access to all full time employees, one also grants access some employees based on job requirements but not to part time or temporary employees.
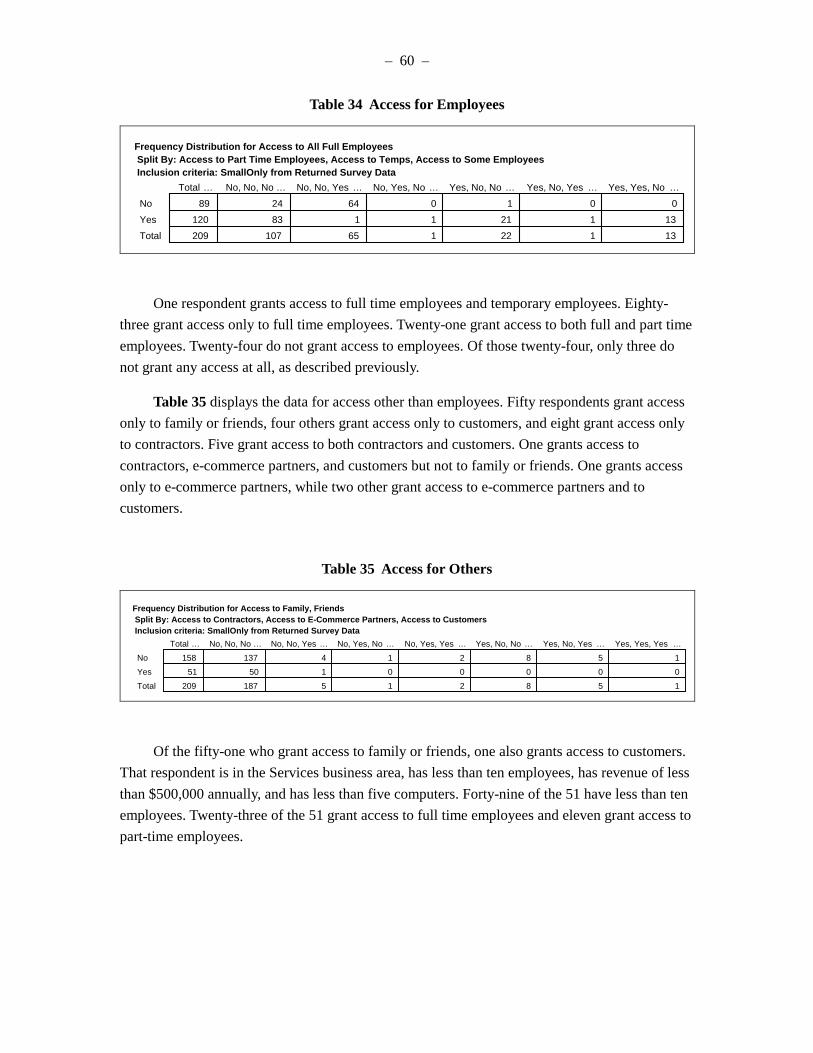
– 60 –
Table 34 Access for Employees
89 24 64 0 1 0 0120 83 1 1 21 1 13209 107 65 1 22 1 13
Total … No, No, No … No, No, Yes … No, Yes, No … Yes, No, No … Yes, No, Yes … Yes, Yes, No …NoYesTotal
Frequency Distribution for Access to All Full Employees Split By: Access to Part Time Employees, Access to Temps, Access to Some Employees Inclusion criteria: SmallOnly from Returned Survey Data
One respondent grants access to full time employees and temporary employees. Eighty-three grant access only to full time employees. Twenty-one grant access to both full and part time employees. Twenty-four do not grant access to employees. Of those twenty-four, only three do not grant any access at all, as described previously.
Table 35 displays the data for access other than employees. Fifty respondents grant access only to family or friends, four others grant access only to customers, and eight grant access only to contractors. Five grant access to both contractors and customers. One grants access to contractors, e-commerce partners, and customers but not to family or friends. One grants access only to e-commerce partners, while two other grant access to e-commerce partners and to customers.
Table 35 Access for Others
158 137 4 1 2 8 5 151 50 1 0 0 0 0 0
209 187 5 1 2 8 5 1
Total … No, No, No … No, No, Yes … No, Yes, No … No, Yes, Yes … Yes, No, No … Yes, No, Yes … Yes, Yes, Yes …NoYesTotal
Frequency Distribution for Access to Family, Friends Split By: Access to Contractors, Access to E-Commerce Partners, Access to Customers Inclusion criteria: SmallOnly from Returned Survey Data
Of the fifty-one who grant access to family or friends, one also grants access to customers. That respondent is in the Services business area, has less than ten employees, has revenue of less than $500,000 annually, and has less than five computers. Forty-nine of the 51 have less than ten employees. Twenty-three of the 51 grant access to full time employees and eleven grant access to part-time employees.

– 61 –
Information Security Management Tools Usage
The next question set dealt with the use of information security management tools. Table 36 displays the data regarding the use of management tools, including policies, procedures, and plans, by the respondents.
Table 36 Use of Management Tools
Management Tools Counts PercentagesYes No Yes No
Data Recovery Procedures 83 126 39.7% 60.3%Information Security Policy 64 145 30.6% 69.4%Computer Use & Misuse Policy 52 157 24.9% 75.1%Information Security Procedures 48 161 23.0% 77.0%Business Continuity Plan 45 164 21.5% 78.5%Proprietary Data Use & Misuse Policy 38 171 18.2% 81.8%Communications Use & Misuse Policy 29 180 13.9% 86.1%Information Sensitivity Levels or Coding 28 181 13.4% 86.6%Computer Emergency Response Plan 28 181 13.4% 86.6%Data Destruction Procedures 27 182 12.9% 87.1%Computer Emergency Response Team 15 194 7.2% 92.8%Media Destruction Procedures 14 195 6.7% 93.3%
The most commonly indicated response, by 83 or 39.7 percent of respondents, was having data recovery procedures. Interestingly, the most common experience reported by the respondents in the previous twelve months was having data get corrupted or lost; 60 or 28.7 percent indicated this experience. The next most indicated response was having an information security policy—64 or 30.6 percent indicated having such a policy. Eighty-eight of the 209 respondents indicated having at least one policy (information security, computer use and misuse, proprietary data, or communications use and misuse). Forty respondents have both one or more policies and data recovery procedures.
While data recovery procedures was the most commonly selected management tool, both data and media destruction procedures were rarely indicated. Only 27, or 12.9 percent, indicated having data destruction procedures and only fourteen, or 6.7 percent, indicated having media destruction procedures. Of the 27 with data destruction procedures, eleven have data recovery procedures. Of the fourteen with media destruction procedures, nine have data recovery procedures. Eight reported having all three.

– 62 –
Of the 28 respondents who indicated having a computer emergency response plan and the fifteen who indicated having a computer emergency response team, only nine had both. Six had a team but no plan while nineteen had a plan but not team.
Fifty-four of the 83 respondents indicating having data recovery procedures have neither a computer emergency response plan or team. Of the 29 with data recovery procedures and a computer emergency response plan or team, sixteen have a plan but no team, four have a team but no plan, and nine have both a team and a plan.
Information Security Technologies Usage
Table 37 displays the reported use of technology tools by the respondents.
Table 37 Use of Technology Tools
Technology Tools PercentagesYes No Yes No
Anti-Virus Software 182 27 87.1% 12.9%Data Backup System 157 52 75.1% 24.9%System Access Control 152 57 72.7% 27.3%Power Surge Protectors 147 62 70.3% 29.7%Redundant Systems 95 114 45.5% 54.5%Shredders 93 116 44.5% 55.5%Data Segregation 60 149 28.7% 71.3%Firewalls 54 155 25.8% 74.2%Encryption 53 156 25.4% 74.6%Intrusion Detection Systems 47 162 22.5% 77.5%System Activity Monitor 33 176 15.8% 84.2%Facility Access Control 30 179 14.4% 85.6%Security Evaluation System 24 185 11.5% 88.5%Dial Back Modem 21 188 10.0% 90.0%Media Degaussers 7 202 3.3% 96.7%
The four most frequently indicated technologies used were anti-virus software, data back-up systems, system access controls, and power surge protectors. Each of these technologies were indicated by greater than seventy percent of the respondents. Ninety-seven respondents, or 46.4 percent, reported using all four.
Two technology groups, redundant systems and shredders, were indicated by slightly less than half the respondents (45.5 and 44.5 percent respectively). Of the remaining technologies, none were indicated by more than thirty percent of the respondents.

– 63 –
The least indicated responses include media degaussers (used by seven respondents), dial back modems (used by 21 respondents), security evaluation systems (used by 24 respondents), facility access control mechanisms (used by thirty respondents), and system activity monitors (used by 33 respondents).
While a great majority of the respondents indicated using anti-virus software, the effectiveness of that software is in doubt. Fewer than half, 90 or 49.4 percent, of those with anti-virus software report updating it regularly on either monthly or weekly intervals. Table 38 displays the number of respondents indicating each choice.
Table 38 Anti-Virus Update Cycles
Anti-Virus Update CyclesWeekly 44 24.2%Monthly 46 25.3%Annually 16 8.8%Occassionally 64 35.2%Not updated 12 6.6%
Total 182
Twelve of the respondents reported not updating their anti-virus software. Sixty-four indicated that they perform updates occasionally. Sixteen indicated that they perform updates on an annual basis. Given the number of new viruses and other malicious code being generated on a daily basis, this data indicates that more public awareness is needed on the importance of updating anti-virus software, at least at the small business level.
Table 39 displays the numbers of respondents indicating use of data backup systems. Of the 157 respondents indicating the use of a data backup system, 121 indicated that it was a manual system while fifty indicated use of an automatic system. Ten use both manual and automatic data backup systems. Thirty-four of the respondents indicated that they use off-site storage for data backups. Two respondents indicated use of a data back-up system but did not indicate whether it was manual or automatic nor whether they use off-site storage for their data backups.
Table 39 Data Backup Systems
Data Backup System Combined With OnlyTotal Only Use Manual Automatic Off-site Storage Both Others
Manual 121 91 ----- 10 12 8Automatic 50 20 10 ----- 12 8
Off-site storage 34 2 12 12 ----- 8None 2
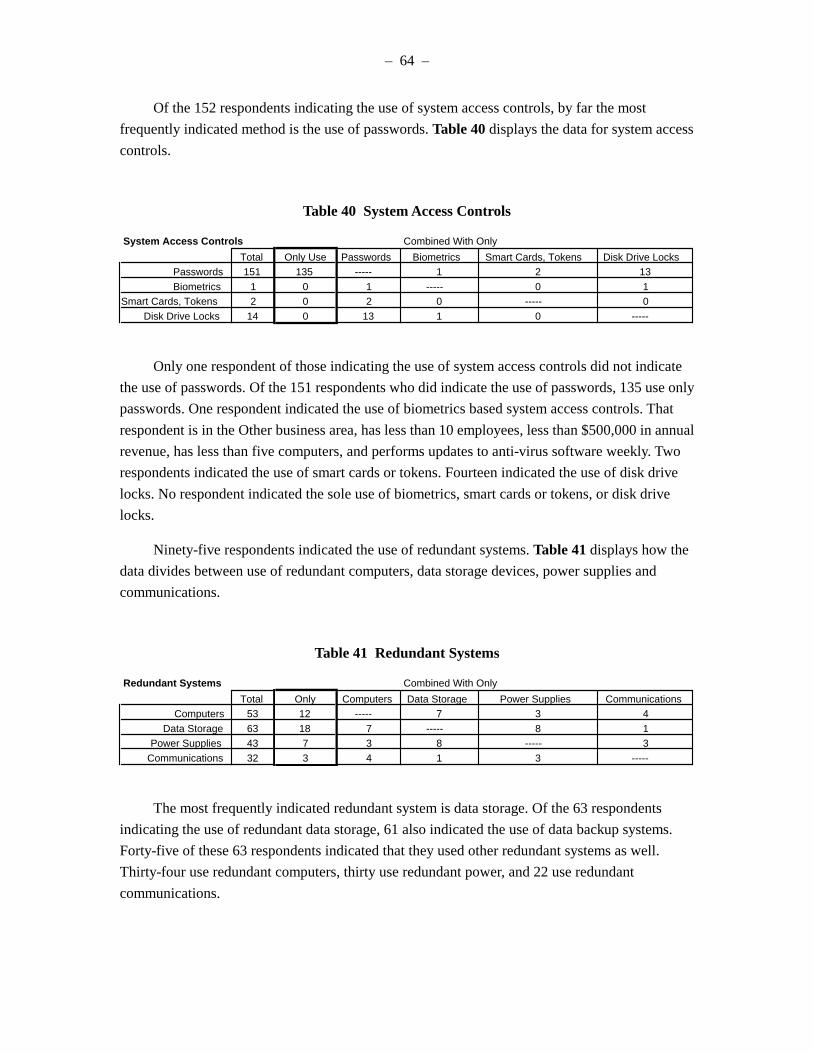
– 64 –
Of the 152 respondents indicating the use of system access controls, by far the most frequently indicated method is the use of passwords. Table 40 displays the data for system access controls.
Table 40 System Access Controls
System Access Controls Combined With OnlyTotal Only Use Passwords Biometrics Smart Cards, Tokens Disk Drive Locks
Passwords 151 135 ----- 1 2 13Biometrics 1 0 1 ----- 0 1
Smart Cards, Tokens 2 0 2 0 ----- 0Disk Drive Locks 14 0 13 1 0 -----
Only one respondent of those indicating the use of system access controls did not indicate the use of passwords. Of the 151 respondents who did indicate the use of passwords, 135 use only passwords. One respondent indicated the use of biometrics based system access controls. That respondent is in the Other business area, has less than 10 employees, less than $500,000 in annual revenue, has less than five computers, and performs updates to anti-virus software weekly. Two respondents indicated the use of smart cards or tokens. Fourteen indicated the use of disk drive locks. No respondent indicated the sole use of biometrics, smart cards or tokens, or disk drive locks.
Ninety-five respondents indicated the use of redundant systems. Table 41 displays how the data divides between use of redundant computers, data storage devices, power supplies and communications.
Table 41 Redundant Systems
Redundant Systems Combined With OnlyTotal Only Computers Data Storage Power Supplies Communications
Computers 53 12 ----- 7 3 4Data Storage 63 18 7 ----- 8 1
Power Supplies 43 7 3 8 ----- 3Communications 32 3 4 1 3 -----
The most frequently indicated redundant system is data storage. Of the 63 respondents indicating the use of redundant data storage, 61 also indicated the use of data backup systems. Forty-five of these 63 respondents indicated that they used other redundant systems as well. Thirty-four use redundant computers, thirty use redundant power, and 22 use redundant communications.

– 65 –
The next most frequently indicated redundant system is computers, with 53 respondents indicating use of redundant computers. The third most frequently indicated redundant system is power supplies. Of the 43 respondents indicating use of redundant power supplies, 36 also indicated the use of power surge protectors. Forty of those 43 respondents indicated the use of data backup systems. The least indicated redundant system is communications, with only 32 respondents indicating the use of redundant communications.
Sixty respondents, or 28.7 percent, indicated the use of data segregation. Table 42 displays the frequency of responses subdivision. Of the sixty respondents indicating use of data segregation, 35 indicated that the method in use is compartmentalization of data and 18 indicated use of sensitive data controls. Six respondents indicated the use of both.
Table 42 Data Segregation
Data SegregationCompartmentalization 35 58.3%Sensitive Data Controls 18 30.0%Both 6 10.0%Neither 1 1.7%
Total 60
Of the sixty respondents indicating the use of data segregation, 42 also indicated that they have one or more written policies. Seven of those sixty have neither policies nor procedures. Of the 24 respondents indicating the use of sensitive data controls, nine also indicated the use of information sensitivity levels or coding in the question regarding policies and practices. Of the 41 respondents indicating the use of compartmentalization, 18 indicated the use of a firewall, six within the enterprise.
The frequency of firewall usage is displayed in Table 43. A total of 54 respondents indicated the use of firewalls, with 28 specifying the use at the external perimeter and 22 indicating use within the enterprise. Two respondents indicated having firewalls both at the external perimeter and within the enterprise.
Table 43 Firewalls
FirewallsExternal Perimeter 28 51.9%Within Enterprise 22 40.7%Both 2 3.7%Neither 2 3.7%
Total 54

– 66 –
Table 44 displays the data regarding intrusion detection system monitoring. Of the 47 respondents indicating the use of intrusion detection systems, eleven indicated that the system is monitored locally while 32 indicated that the system is monitored remotely. Three indicated that both local and remote monitoring is used, while one did not specify.
Table 44 Intrusion Detection System Monitoring
Intrusion Detection SystemsMonitored Locally 11 23.4%Monitored Remotely 32 68.1%Both 3 6.4%Neither 1 2.1%
Total 47
Table 45 displays the subdivision of the use of encryption for files, communications, and digital signatures.
Table 45 Encryption Usage
Encryption Combined WithTotal Only Use For Files For Comms Digital Signatures Both Others
For Files 31 9 ----- 7 1 14For Communications 32 9 7 ----- 2 14
Digital Signatures 27 10 1 2 ----- 14
A total of 53 respondents indicated the use of cryptography; 31 of these encrypt files, 32 encrypt communications, and 27 use digital signatures. Fourteen indicated that they encrypt files and communications and also use digital signatures.
Thirty respondents indicated the use of facility access controls. Of those, 18 further specified the use of badges, 12 the use of electronic locks, and one the use of biometrics based facility access control. The respondent indicating the use of biometrics based facility access control is the same respondent indicating the use of biometrics based system access control. Table 46 displays the data regarding facility access controls.
Table 46 Facility Access Controls
Facility Access Controls Combined With OnlyTotal Only Use Badges Biometrics Electronic Locks Both Others
Badges 18 13 ----- 0 4 1Biometrics 1 0 0 ----- 0 1
Electronic Locks 12 7 4 0 ----- 1None 5

– 67 –
Table 47 displays the data regarding the use of security evaluation systems. Few respondents, 24 or 11.5 percent, indicated the use of security evaluation systems. Of these, ten use both vulnerability checkers and risk assessment systems. Five use only vulnerability checkers and eight use only risk assessment systems. One respondent indicated the use of a security evaluation system but did not further specify.
Table 47 Security Evaluation Systems
Security Evaluation SystemRisk Assessment 8 33.3%Vulnerability Check 5 20.8%Both 10 41.7%Neither 1 4.2%
Total 24


Chapter Seven
Are Small Businesses Different?
The first set of hypotheses considers whether the experiences and concerns of small businesses as reflected in the collected data differs significantly from that data collected from the surveys documented in the Literature Research section. Eight questions with comparable format and data were derived from that compilation of information. The following section presents the results from comparing that data with the results of this research effort.
Written Security Policies
The first minor hypothesis supporting Research Goal One postulates that small businesses are less likely to have a written security policy than the results reported in the surveys. The grouped data mean for this question from the other surveys is 0.49. The number of respondents to this research questionnaire having one or more written policies is 88, or 42.1 percent. Table 48 presents the result of testing to see if these means are significantly different.
Table 48 Comparison, Written Policies
.421 208 -2.014 .0453 .354 .489Mean DF t-Value P-Value 95% Lower 95% Upper
AnyPolicy
One Sample Analysis Hypothesized Mean = .49 Inclusion criteria: SmallOnly from Returned Survey Data
Based on a one-sample analysis against a hypothesized mean of 0.49, the resultant p-value is calculated at 0.0453, which is sufficient to allow the rejection of the null hypothesis that the means are the same. The conclusion, therefore, is that small businesses are less likely to have a written security policy than the results presented in the other surveys.
Likelihood of Security Breaches
The second minor hypothesis postulates that small businesses are less likely to have experienced breaches in security than the results reported in the surveys. The grouped data mean from the other surveys is 0.48. The percentage of respondents to this survey questionnaire that indicated experiencing one or more information security experiences is 48.3 percent. Table 49 presents the results of one-sample testing against the hypothesized mean of 0.48 to see if the null hypothesis that the two means are the same can be rejected. The resultant p-value of 0.9253 does

– 70 –
not allow the rejection of the null hypothesis that the two means are in fact the same. The conclusion is that small businesses are equally likely to have experienced an information security breach as the results reported in the other surveys.
Table 49 Comparison, Experience Breach
.483 208 .094 .9253 .415 .552Mean DF t-Value P-Value 95% Lower 95% Upper
AnyExp
One Sample Analysis Hypothesized Mean = .48 Inclusion criteria: SmallOnly from Returned Survey Data
Ability to Characterize Losses
The third minor hypothesis postulates that small businesses are equally unable to characterize financial losses from security breaches as compared to the results reported in the surveys. Of the respondents reporting financial losses due to information security problems or attacks in the other surveys, only 37 percent were able to characterize the losses experienced. For this survey, of the nineteen respondents reporting losses, fourteen, or 73.7 percent, were able to quantify the losses. Table 50 presents the results of testing to see if these two means can be considered statistically equivalent.
Table 50 Comparison, Ability to Characterize Losses
.737 18 3.534 .0024 .519 .955Mean DF t-Value P-Value 95% Lower 95% Upper
Able to Quant Loss
One Sample Analysis Hypothesized Mean = .37 Inclusion criteria: SmallOnly from Returned Survey Data
This test considers that the null hypothesis is that the two means are equal and tests for rejection of that null. The resultant p-value of 0.0024 indicates that the null hypothesis, that these two means can be considered equal, can be rejected. The conclusion reached is that small businesses are much more likely to be able to characterize losses from information security failures or problems.

– 71 –
Probability of Outsider Unauthorized Access
The fourth minor hypothesis supporting Research Goal One postulates that small businesses are less likely to have experienced unauthorized access by outsiders than the results reported in the surveys. In the other surveys, 12.8 percent of the respondents reported having experienced unauthorized access by outsiders into their information systems. For this survey, 1.9 percent of respondents reported having experienced outsiders breaking into their information systems. Table 51 presents the results of testing to see if these two figures can be considered equivalent. The calculated p-value of <0.0001 allows the rejection of the null hypothesis that these two means are equal.
Table 51 Comparison, Outsider Access Abuse
.019 208 -11.459 <.0001 4.099E-4 .038Mean DF t-Value P-Value 95% Lower 95% Upper
Outsider Unauth Access
One Sample Analysis Hypothesized Mean = .128 Inclusion criteria: SmallOnly from Returned Survey Data
The conclusion drawn here is that small businesses are less likely to report having outsiders attempt to break into their information systems. This conclusion is caveated by the fact that it is not possible to determine from this data whether the respondents to this survey had the equivalent training, equipment, and capabilities as the respondents to the other surveys to detect such activity. Therefore, the data must only be viewed in light of reported incidents. Further research is required to determine if small businesses possess the same capabilities for detection that other businesses possess.
Probability of Insider Access Abuse
The fifth minor hypothesis supporting Research Goal One postulates that small businesses are equally likely to have experienced unauthorized use of systems by insiders as the results reported in the surveys. The grouped data mean of respondents reporting having experienced insider problems from the other surveys is 54.5 percent. The percentage of respondents to this survey reporting having experienced insiders abusing information system access privileges is 3.3 percent. Table 52 presents the results of testing to see if these two means can be considered equivalent. The resulting p-value of <0.0001 allows the rejection of the hypothesis that these two means are equal.

– 72 –
Table 52 Comparison, Insider Problems
.033 208 -41.002 <.0001 .009 .058Mean DF t-Value P-Value 95% Lower 95% Upper
Insider Problems
One Sample Analysis Hypothesized Mean = .545 Inclusion criteria: SmallOnly from Returned Survey Data
The conclusion to this hypothesis test is that small businesses are much less likely to have experienced insiders abusing information system access privileges. Further research is required to determine if there are cultural or other differences in small businesses that contribute to this decreased likelihood.
Concern for Virus-Related Problems
The sixth minor hypothesis supporting Research Goal One postulates that small businesses are equally likely to view virus-related problems as one of their top five security concerns as the results reported in the surveys. The format of the questionnaire did not ask respondents to identify top five security concerns, but did ask respondents to identify level of concern for different areas. As such, there is only a rough ability to consider this hypothesis. For the respondents to this questionnaire, 32.2 percent said that they were extremely concerned about viruses while 21.0 percent rated viruses a high concern. A total of 53.2 percent rated it in the top two concern levels. For the other surveys, viruses were identified as being a top-five security concern in 75 percent of the surveys. Table 53 presents the results of testing to see if these figures are statistically equivalent. The resultant p-value of <0.0001 allows the rejection of the hypothesis that these two are equivalent.
Table 53 Comparison Concern for Viruses
.532 204 -6.248 <.0001 .463 .601Mean DF t-Value P-Value 95% Lower 95% Upper
Concern Virus
One Sample Analysis Hypothesized Mean = .75 Inclusion criteria: SmallOnly from Returned Survey Data
The conclusion reached is that small businesses are less likely to be highly concerned about viruses as the results presented in the other surveys. This conclusion is caveated by the lack of hard data as to what level of concern other businesses may have for viruses when asked the

– 73 –
question in a different manner. It may be that the aggregate concern for viruses is, in fact, no different.
Concern over Power Failure
The seventh minor hypothesis supporting Research Goal One postulates that small businesses are equally likely to view power failure as one of their top five security concerns as the results reported in the surveys. The same problem arises for this hypothesis as for the previous one: the data is not directly comparable, so only approximations may be considered. Power failure was listed as a top five level concern for 25 percent of the surveys that asked this question. For this survey, 36.1 percent indicated that concern for power failure was either an extreme or high concern. Table 54 presents the results of testing these numbers for equivalency. The resultant p-value of 0.0011 indicates that the hypothesis of equivalency can be rejected.
Table 54 Comparison Concern for Power Failure
.361 204 3.300 .0011 .295 .427Mean DF t-Value P-Value 95% Lower 95% Upper
Concern Power
One Sample Analysis Hypothesized Mean = .25 Inclusion criteria: SmallOnly from Returned Survey Data
A tentative conclusion is that small businesses are more likely to view power failure as a serious concern. However, this conclusion is caveated by the lack of hard data on how other businesses view potential power failure. Additionally, there may be infrastructural issues underlying the data that should be considered but which are not reflected in either group of data. Further research is required to determine actual levels of concern and any contributing factors.
Concern over Data Theft
The eighth minor hypothesis supporting Research Goal One postulates that small businesses are less likely to view data theft as one of their top five security concerns as the results reported in the surveys. For 50 percent of the other surveys, data theft was identified as one of the top five concerns. For this survey, 32.2 percent of respondents identified data theft as either an extreme or high concern. Table 55 presents the results of testing these for equivalency. The resultant p-value of <0.0001 allows the rejection of the hypothesis of equivalency of the numbers.

– 74 –
Table 55 Comparison Concern for Data Theft
.322 204 -5.443 <.0001 .257 .386Mean DF t-Value P-Value 95% Lower 95% Upper
Concern Info Theft
One Sample Analysis Hypothesized Mean = .5 Inclusion criteria: SmallOnly from Returned Survey Data
The conclusion that small businesses are less likely to view data theft as a top five concern is subject to the same considerations as the previous two hypotheses. There is not a sufficiently specified level of data for a true comparison of concern levels. Additionally, there may be elements associated with small business activities that contribute to level of concern about data theft. Further research is required to determine the nature of the levels of concern for data theft and business situations.
Summation of Differences
Table 56 presents the results of hypotheses testing for the component elements supporting Research Goal One. A smaller percentage of small businesses have written security policies than the results indicated in the other surveys, but an equivalent percentage of small businesses have experienced breaches in security. A higher percentage of small businesses are able to characterize financial losses from information security breaches. Much lower percentages of small businesses have experienced either insiders abusing information system access or outsiders attempting to break in to information systems. A lower percentage of small businesses consider viruses or data theft to be top level concerns, but a higher percentage of small businesses consider power failure to be a top level concern.

– 75 –
Table 56 Research Goal One Hypotheses Test Results
Small Business
Hypothesized
Actual
Survey
Grouped Data
Results
H1a: written security policy < 49 % 42.1 % 49 % Less than
H1b: experienced breaches in security
< 48 % 48.3 % 48 % Equal
H1c: financial losses from security breaches
= 37 % 73.7 % 37 % Greater
H1d: unauthorized access by outsiders
< 12.8 % 1.9 % 12.% Less than
H1e: unauthorized use of systems by insiders
= 54.5 % 3.3 % 54.5 % Less than
H1f: virus-related problems as one of top five security concerns
= 75 % 53.2 % 75 % Less than
H1g: power failure as one of top five security concerns
= 25 % 36.1 % 25 % Greater
H1h: data theft as one of top five security concerns
< 50 % 32.2 % 50 % Less than


Chapter Eight
The Internet Factor
The second major hypothesis considers the possibility of differences in information security experiences between small businesses with Internet access and those without Internet access. Table 57 displays the data for Internet access, Web presence, and e-commerce activity. Twenty-five respondents reported having none of those.
Table 57 Internet, Web, E-Commerce Access
Internet Access
Web Presence
E-commerce
All Three
Total
Internet Access
81
64
5
30
180
Web Presence
64
2
1
30
97
E-commerce 5 1 1 30 37
A significant number of respondents, 180 or 86.1 percent, reported having Internet access. A smaller number, 97 or 46.4 percent, reported having an Internet presence in the form of a Web site and even fewer, 37 or 17.7 percent, reported engaging in e-commerce activities. Sixty-four respondents reported having both Internet access and a Web site. Five respondents reported having Internet access and engaging in e-commerce but not having a Web presence. Two respondents reported having a Web site but not having Internet access. One respondent reported engaging in e-commerce but not having either Internet access or a Web site. Another respondent reported having a Web site and engaging in e-commerce but not having Internet access. Thirty respondents reported having Internet access, a Web site, and engaging in e-commerce. The component minor hypotheses will be considered for three of these sets of responses: those with Internet access (180 out of 209 respondents); those with a Web presence (97 out of 209 respondents); and those engaging in e-commerce activities (37 out of 209 respondents).
Concern for Security
The first minor hypothesis postulates that small businesses with Internet access are more concerned about information security than small businesses without Internet access.
A measure of the level of concern can be derived from the questionnaire by calculating the total for responses to the questionnaire section of indicated level of concern (question 11). Table

– 78 –
58 shows the descriptive statistics for the values associated with the aggregated computed level of concern.
There were fourteen elements combined to create this composite value, each with a range of from one to five. The lowest possible minimum would be fourteen and the highest possible maximum would be seventy. The center of that range is twenty-eight. For the observed data, the mean is 40.351 with a standard deviation of 13.804. The median is 41.000 and the mode is 44.000. The observed minimum is fourteen and the observed maximum is seventy.
Table 58 Aggregate Concern Descriptive Statistics
40.35113.804
.964205
14.00070.000
.023-.723
41.00044.000
MeanStd. Dev.Std. ErrorCountMinimumMaximumSkewnessKurtosisMedianMode
ConcernComputed
Descriptive Statistics Inclusion criteria: SmallOnly from Returned Survey Data
Figure 14 shows the histogram of the aggregate level of concern for all respondents.

– 79 –
40.35113.804
.964205
14.00070.000
.023-.723
41.00044.000
MeanStd. Dev.Std. ErrorCountMinimumMaximumSkewnessKurtosisMedianMode
ConcernComputed
Descriptive Statistics Inclusion criteria: SmallOnly from Returned Survey Data
Figure 14 Histogram of Computed Concern
The general distribution of the data corresponds somewhat to the overlaid normal curve, which represents the expected distribution for a sample with the same mean and standard deviation for the variable as the considered sample. The computed level of skewness (a measure of how removed from symmetry the distribution is) for this data is 0.023 and the kurtosis (a measure of how much data is on the edges of the distribution) is—0.723.
An analysis of variance (ANOVA) performed on the computed concern as the dependent continuous variable and Internet access, Web presence, and e-commerce as the independent nominal variables results in the table of values displayed in Table 59.
Table 59 ANOVA Concern and Access
1 52.178 52.178 .281 .5969 .281 .0811 98.901 98.901 .532 .4667 .532 .1081 26.139 26.139 .141 .7081 .141 .0661 98.901 98.901 .532 .4667 .532 .1081 85.100 85.100 .458 .4995 .458 .1001 37.274 37.274 .200 .6548 .200 .0721 245.348 245.348 1.320 .2521 1.320 .196
197 36628.768 185.933
DF Sum of Squares Mean Square F-Value P-Value Lambda PowerInternet AccessWeb PresenceE-CommerceInternet Access * Web PresenceInternet Access * E-CommerceWeb Presence * E-CommerceInternet Access * Web Presence * E-Comm …Residual
ANOVA Table for ConcernComputed Inclusion criteria: SmallOnly from Returned Survey Data
The values computed for the p-value are quite large for each considered combination. The smallest p-value calculated is given for the combination of Internet access, Web presence, and e-

– 80 –
commerce activity, which is 0.2521. This value does not allow the rejection of the null hypothesis of independence.
Table 60 shows the descriptive statistics for the values associated with the aggregated computed level of concern split between those reporting having Internet access and those who reported not having Internet access. For the 176 respondents with Internet access, the mean is 40.767 with a standard deviation of 13.894. The median is 41.000 and the mode is 44.000. The observed minimum is fourteen and the observed maximum is seventy. For the 29 respondents without Internet access, the mean is 37.828 with a standard deviation of 13.197. The median is 39.000 and the mode is 37.000. The observed minimum is fourteen and the observed maximum is 59.000.
Table 60 Aggregate Concern, Internet Access
40.35113.804
.964205
14.00070.000
.023-.723
41.00044.000
37.82813.197
2.45129
14.00059.000
-.387-.878
39.00037.000
40.76713.894
1.047176
14.00070.000
.068-.761
41.00044.000
MeanStd. Dev.Std. ErrorCountMinimumMaximumSkewnessKurtosisMedianMode
ConcernComputed, Total ConcernComputed, No ConcernComputed, Yes
Descriptive Statistics Split By: Internet Access Inclusion criteria: SmallOnly from Returned Survey Data
Figure 15 shows a histogram of the aggregate level of concern for only respondents who reported not having Internet access. Figure 16 shows a histogram of the aggregate level of concern for the 176 respondents who reported having Internet access.
There are only 29 data points in the subset without Internet access and the general distribution of the data corresponds less well to the overlaid normal curve. The computed level of skewness for this data is -0.387 and the kurtosis is –0.878. The general distribution of the data for those with Internet access corresponds slightly better to the overlaid normal curve. The computed level of skewness for this data is 0.068 and the kurtosis is –0.761.
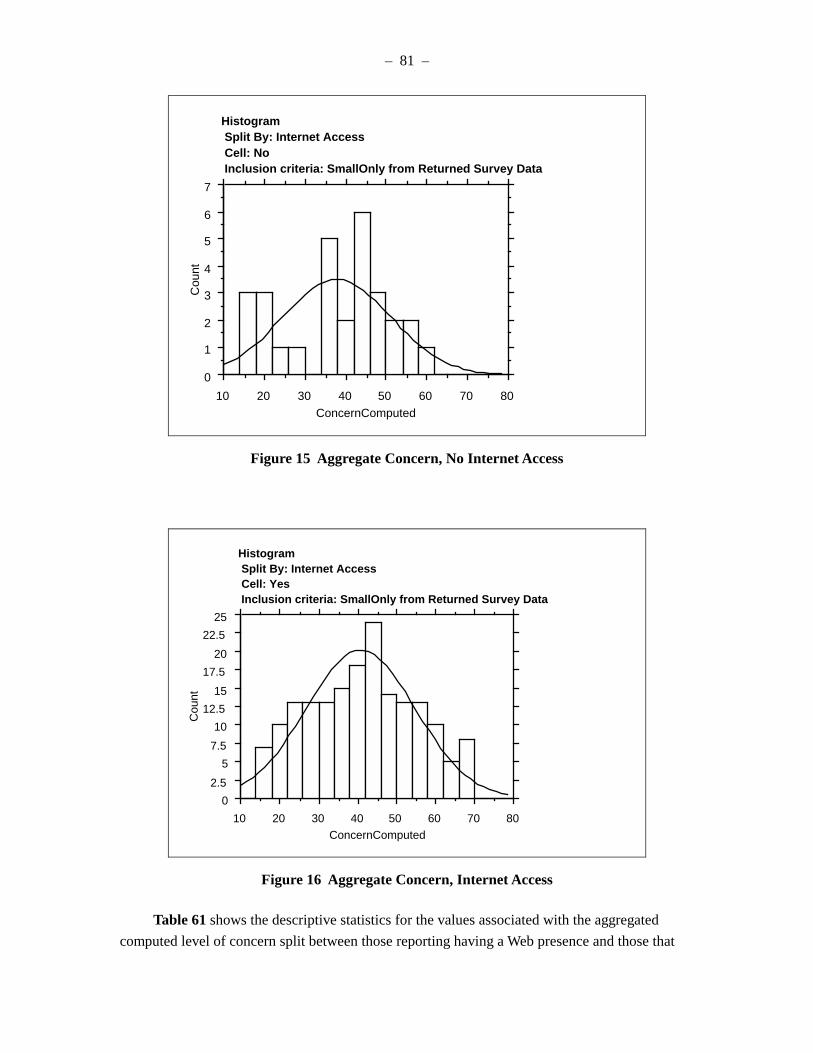
– 81 –
0
1
2
3
4
5
6
7C
ount
10 20 30 40 50 60 70 80ConcernComputed
Histogram Split By: Internet Access Cell: No Inclusion criteria: SmallOnly from Returned Survey Data
Figure 15 Aggregate Concern, No Internet Access
02.5
57.510
12.515
17.520
22.525
Cou
nt
10 20 30 40 50 60 70 80ConcernComputed
Histogram Split By: Internet Access Cell: Yes Inclusion criteria: SmallOnly from Returned Survey Data
Figure 16 Aggregate Concern, Internet Access
Table 61 shows the descriptive statistics for the values associated with the aggregated computed level of concern split between those reporting having a Web presence and those that
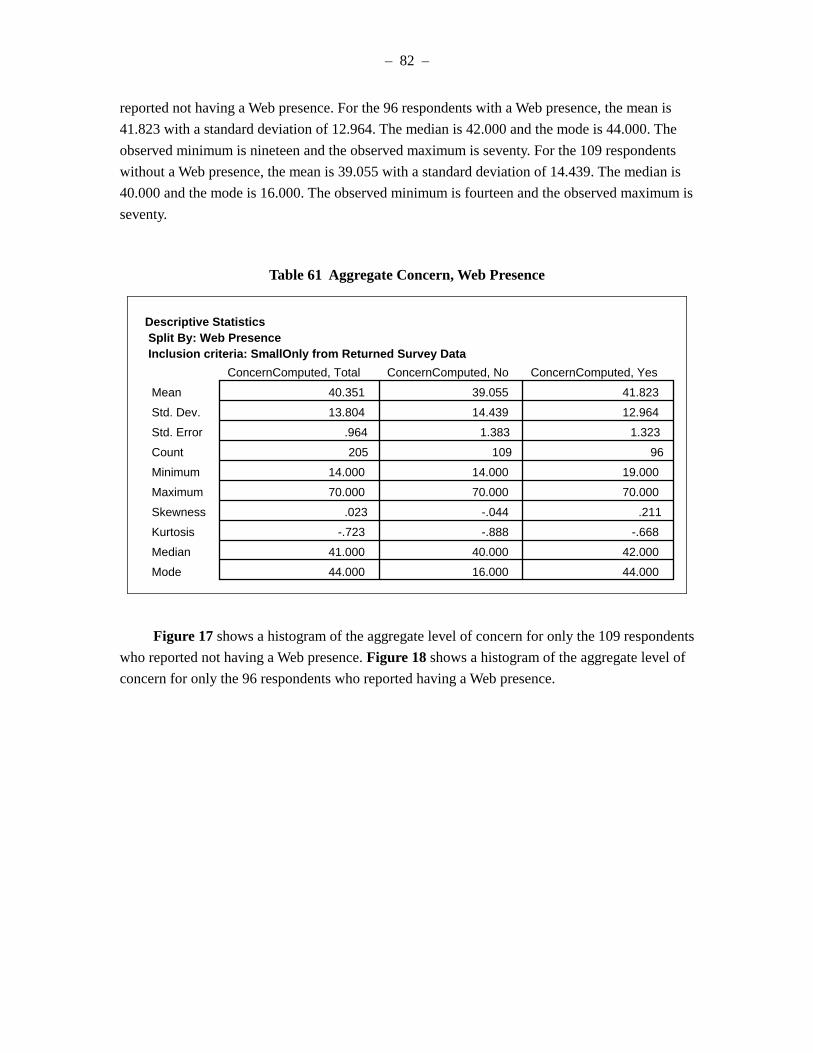
– 82 –
reported not having a Web presence. For the 96 respondents with a Web presence, the mean is 41.823 with a standard deviation of 12.964. The median is 42.000 and the mode is 44.000. The observed minimum is nineteen and the observed maximum is seventy. For the 109 respondents without a Web presence, the mean is 39.055 with a standard deviation of 14.439. The median is 40.000 and the mode is 16.000. The observed minimum is fourteen and the observed maximum is seventy.
Table 61 Aggregate Concern, Web Presence
40.35113.804
.964205
14.00070.000
.023-.723
41.00044.000
39.05514.439
1.383109
14.00070.000
-.044-.888
40.00016.000
41.82312.964
1.32396
19.00070.000
.211-.668
42.00044.000
MeanStd. Dev.Std. ErrorCountMinimumMaximumSkewnessKurtosisMedianMode
ConcernComputed, Total ConcernComputed, No ConcernComputed, Yes
Descriptive Statistics Split By: Web Presence Inclusion criteria: SmallOnly from Returned Survey Data
Figure 17 shows a histogram of the aggregate level of concern for only the 109 respondents who reported not having a Web presence. Figure 18 shows a histogram of the aggregate level of concern for only the 96 respondents who reported having a Web presence.

– 83 –
0
2
4
6
8
10
12
14
16C
ount
10 20 30 40 50 60 70 80ConcernComputed
Histogram Split By: Web Presence Cell: No Inclusion criteria: SmallOnly from Returned Survey Data
Figure 17 Aggregate Concern, No Web Presence
0
2
4
6
8
10
12
14
16
18
Cou
nt
10 20 30 40 50 60 70 80ConcernComputed
Histogram Split By: Web Presence Cell: Yes Inclusion criteria: SmallOnly from Returned Survey Data
Figure 18 Aggregate Concern, Web Presence
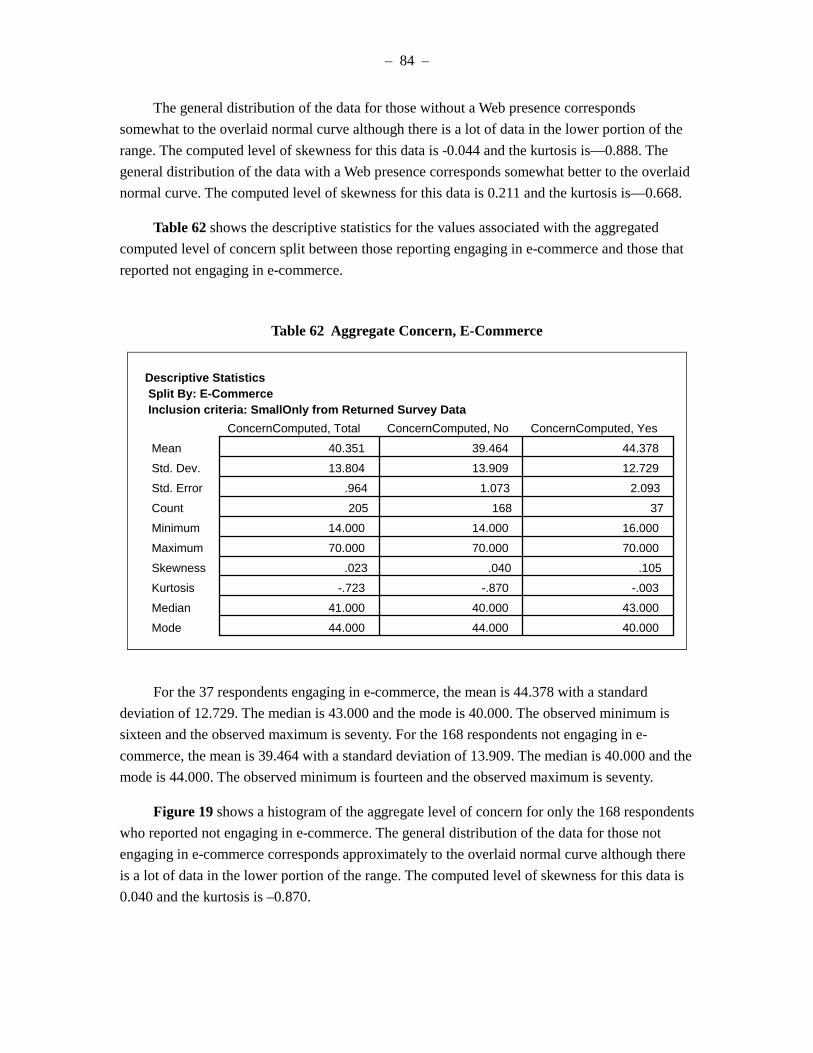
– 84 –
The general distribution of the data for those without a Web presence corresponds somewhat to the overlaid normal curve although there is a lot of data in the lower portion of the range. The computed level of skewness for this data is -0.044 and the kurtosis is—0.888. The general distribution of the data with a Web presence corresponds somewhat better to the overlaid normal curve. The computed level of skewness for this data is 0.211 and the kurtosis is—0.668.
Table 62 shows the descriptive statistics for the values associated with the aggregated computed level of concern split between those reporting engaging in e-commerce and those that reported not engaging in e-commerce.
Table 62 Aggregate Concern, E-Commerce
40.35113.804
.964205
14.00070.000
.023-.723
41.00044.000
39.46413.909
1.073168
14.00070.000
.040-.870
40.00044.000
44.37812.729
2.09337
16.00070.000
.105-.003
43.00040.000
MeanStd. Dev.Std. ErrorCountMinimumMaximumSkewnessKurtosisMedianMode
ConcernComputed, Total ConcernComputed, No ConcernComputed, Yes
Descriptive Statistics Split By: E-Commerce Inclusion criteria: SmallOnly from Returned Survey Data
For the 37 respondents engaging in e-commerce, the mean is 44.378 with a standard deviation of 12.729. The median is 43.000 and the mode is 40.000. The observed minimum is sixteen and the observed maximum is seventy. For the 168 respondents not engaging in e-commerce, the mean is 39.464 with a standard deviation of 13.909. The median is 40.000 and the mode is 44.000. The observed minimum is fourteen and the observed maximum is seventy.
Figure 19 shows a histogram of the aggregate level of concern for only the 168 respondents who reported not engaging in e-commerce. The general distribution of the data for those not engaging in e-commerce corresponds approximately to the overlaid normal curve although there is a lot of data in the lower portion of the range. The computed level of skewness for this data is 0.040 and the kurtosis is –0.870.
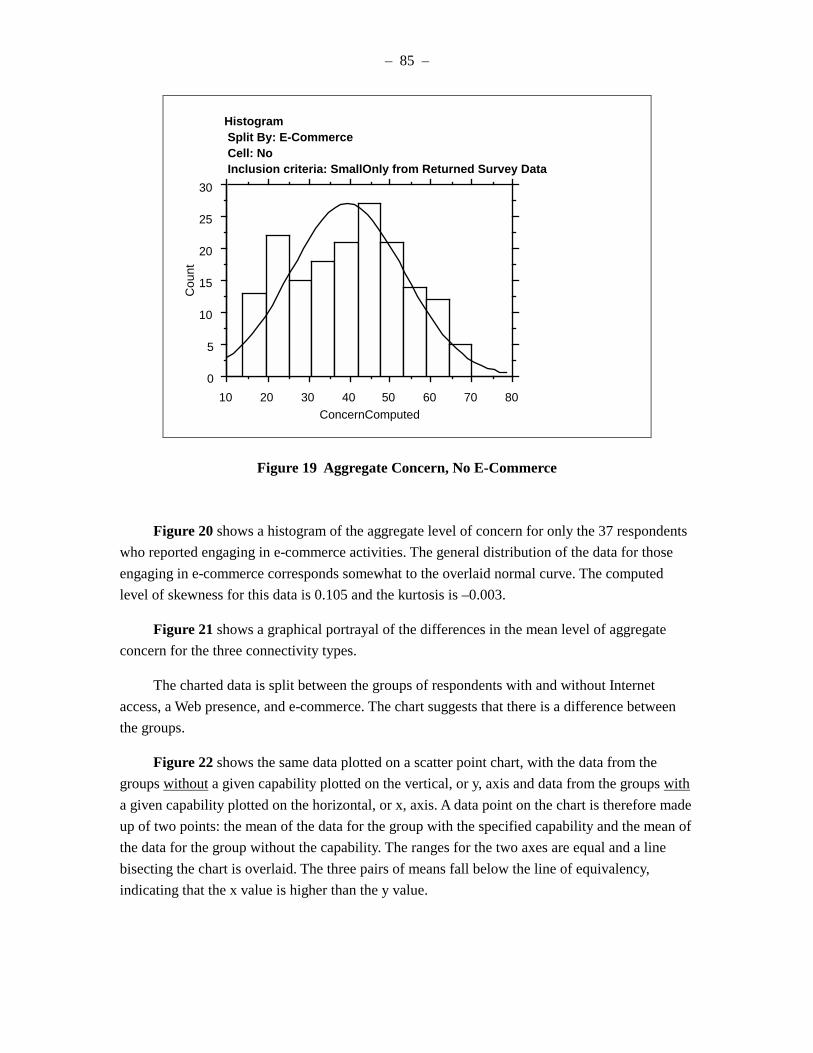
– 85 –
0
5
10
15
20
25
30C
ount
10 20 30 40 50 60 70 80ConcernComputed
Histogram Split By: E-Commerce Cell: No Inclusion criteria: SmallOnly from Returned Survey Data
Figure 19 Aggregate Concern, No E-Commerce
Figure 20 shows a histogram of the aggregate level of concern for only the 37 respondents who reported engaging in e-commerce activities. The general distribution of the data for those engaging in e-commerce corresponds somewhat to the overlaid normal curve. The computed level of skewness for this data is 0.105 and the kurtosis is –0.003.
Figure 21 shows a graphical portrayal of the differences in the mean level of aggregate concern for the three connectivity types.
The charted data is split between the groups of respondents with and without Internet access, a Web presence, and e-commerce. The chart suggests that there is a difference between the groups.
Figure 22 shows the same data plotted on a scatter point chart, with the data from the groups without a given capability plotted on the vertical, or y, axis and data from the groups with a given capability plotted on the horizontal, or x, axis. A data point on the chart is therefore made up of two points: the mean of the data for the group with the specified capability and the mean of the data for the group without the capability. The ranges for the two axes are equal and a line bisecting the chart is overlaid. The three pairs of means fall below the line of equivalency, indicating that the x value is higher than the y value.

– 86 –
0
2
4
6
8
10
12C
ount
10 20 30 40 50 60 70 80ConcernComputed
Histogram Split By: E-Commerce Cell: Yes Inclusion criteria: SmallOnly from Returned Survey Data
Figure 20 Aggregate Concern, E-Commerce
34
36
38
40
42
44
46
Internet Web E-Commerce
Yes No
Figure 21 Comparisons of Aggregate Concerns

– 87 –
E-CommerceWeb
Internet
36
38
40
42
44
46
36 38 40 42 44 46
Mean -- With the Capability
Aggregate Concern
Figure 22 Scatter Plot, Aggregate Concern
Examining the mean difference through the use of unpaired means comparison statistical testing results in the data displayed in the following tables. Table 63 displays the result of unpaired means comparison for the computed aggregate level of concern between the two groups of those respondents with Internet access and those without Internet access.
Table 63 Unpaired Means Comparison, Internet Access
-2.939 203 -1.063 .2891 -8.393 2.514Mean Diff. DF t-Value P-Value 95% Lower 95% Upper
No, Yes
Unpaired Means Comparison for ConcernComputed Grouping Variable: Internet Access Hypothesized Difference = 0 Inclusion criteria: SmallOnly from Returned Survey Data
The p value, which is the probability that the difference occurred by chance, resulting from this test is 0.2891. This data indicates that there is a 28.9 percent probability that the observed difference happened by chance and that the null hypothesis of independence can not be rejected. Additionally, the 95 percent confidence intervals for this test, which are given at—8.393 for the lower and 2.514 for the upper, include zero within their range, which indicates that the two means

– 88 –
are not significantly different. Based on the results of the t-test, the null hypotheses cannot be rejected.
Table 64 displays the result of unpaired means comparison for the computed aggregate level of concern between the two groups of those respondents with a Web presence and those without a Web presence. The p value, which is the probability that the difference occurred by chance, resulting from this test is lower than the previous test at .1525. This data indicates that there is a 15.25 percent probability that the observed difference happened by chance. The 95 percent confidence intervals for this test, -6.568 for the lower and 1.032 for the upper, include zero within their range, which indicates that the two means are not significantly different. Based the results of the t-test, the null hypothesis cannot be rejected.
Table 64 Unpaired Means Comparison, Web Presence
-2.768 203 -1.436 .1525 -6.568 1.032Mean Diff. DF t-Value P-Value 95% Lower 95% Upper
No, Yes
Unpaired Means Comparison for ConcernComputed Grouping Variable: Web Presence Hypothesized Difference = 0 Inclusion criteria: SmallOnly from Returned Survey Data
Table 65 displays the result of unpaired means comparison for the computed aggregate level of concern between the two groups of those respondents reporting e-commerce activity and those not engaging in e-commerce activity.
Table 65 Unpaired Means Comparison, E-Commerce
-4.914 203 -1.974 .0497 -9.822 -.006Mean Diff. DF t-Value P-Value 95% Lower 95% Upper
No, Yes
Unpaired Means Comparison for ConcernComputed Grouping Variable: E-Commerce Hypothesized Difference = 0 Inclusion criteria: SmallOnly from Returned Survey Data
The p value, which is the probability that the difference occurred by chance, resulting from this test is small at 0.0497. This data indicates that there is a very small probability that the observed difference happened by chance. Additionally, the fact that the 95 percent confidence intervals, at –9.822 and –0.006 for the lower and upper bounds, do not include zero indicate that

– 89 –
the difference between the means in the two groups might possibly be significant. Based on the results of the t-test, the null hypothesis can be rejected and the distinction that those with e-commerce activity have a higher level of concern than those not engaging in e-commerce activity can be viewed as a meaningful distinction.
In order to determine what the influencing factors are in that higher aggregate level of concern, the percentages of the respondents with high or extreme concerns provides an indicator into what specific elements of concern might be pushing the aggregate higher. Looking at the percentages of high and extreme levels of concern, a comparison of the means between the total number of respondents with high or extreme concern for each of the indicated areas and the split with the different types of access allows an analysis of significant differences. Table 66 presents the comparative percentages of respondents indicating high or extreme levels of concern for each of the indicated areas.
Table 66 High or Extreme Concern Levels
Concern Means Total % Internet Access Web Presence E-Commerce(High, Extreme) H, Ex % H,Ex t-test p % H,Ex t-test p % H,Ex t-test pInsider Access Abuse 12.7% 13.6% 0.3146 13.5% 0.7303 18.9% 0.2099Viruses 53.2% 54.0% 0.5708 60.4% 0.0514 67.6% 0.0529Power Failure 36.1% 36.4% 0.8460 34.4% 0.6319 37.8% 0.8088Software Problems 40.0% 41.5% 0.2898 41.7% 0.6495 43.2% 0.6583Data Integrity 47.8% 48.9% 0.4571 53.1% 0.1539 56.8% 0.2306Transaction Integrity 47.8% 48.3% 0.7306 54.2% 0.0878 67.6% 0.0077 *Outsider Access Abuse 33.7% 35.8% 0.1118 41.7% 0.0227 * 43.2% 0.1746Data Secrecy 39.5% 40.3% 0.5522 43.8% 0.2462 51.4% 0.1047Data Availability 50.2% 50.6% 0.8201 59.4% 0.0140 * 67.6% 0.0198 *Data Theft 32.2% 32.4% 0.8859 34.4% 0.5330 37.8% 0.4196Data Sabotage 32.7% 32.4% 0.8246 33.3% 0.8531 35.1% 0.7269User Errors 28.8% 27.8% 0.4666 25.0% 0.2640 37.8% 0.1806Natural Disaster 22.0% 22.2% 0.8602 20.8% 0.7183 21.6% 0.9576Fraud 24.4% 26.1% 0.1530 25.0% 0.8496 32.4% 0.2102
Only two areas are revealed as significantly different based on Web presence: that of concern over outsider access abuse and data availability. Two others are revealed as significantly different based on e-commerce activity: that of concern for transaction integrity and data availability. These elements do not provide the desired insight into why the aggregate level of concern should be significantly different for e-commerce participants.
Examining the data at the component level allows an analysis of independence between two elements. Table 67 presents the chi-square value and the chi-square p-value resulting from chi-square testing of the individual concern elements against types of access (Internet access, Web presence, and e-commerce).

– 90 –
Of the 42 combinations, eight resulted in values that allow the rejection of the null hypothesis of independence. A relationship between levels of concern and having a Web presence showed up most frequently. Figures 23 and 24 display the computed p-values for relationships between concerns and the connectivity types of Web presence and participation in e-commerce activities.
Table 67 Concern Component Chi-Square Testing
Internet Access Web Presence E-Commercechi sq chi sq p chi sq chi sq p chi sq chi sq p
Insider Access Abuse 1.713 0.7884 11.107 0.0254 * 6.704 0.1524Viruses 15.695 0.0035 * 9.656 0.0466 * 6.427 0.1694Power Failure 1.704 0.7899 6.862 0.1434 0.823 0.9354Software Problems 3.770 0.4380 8.802 0.0662 2.565 0.6331Data Integrity 3.101 0.5410 6.254 0.1810 2.274 0.6856Transaction Integrity 1.676 0.7952 10.849 0.0283 * 8.210 0.0842Outsider Access Abuse 3.453 0.4851 6.827 0.1453 3.403 0.4928Data Secrecy 3.043 0.5507 2.599 0.6270 3.785 0.4359Data Availability 1.754 0.7808 7.647 0.1054 6.927 0.1398Data Theft 1.194 0.8790 11.630 0.0203 * 12.458 0.0143 *Data Sabotage 1.658 0.7984 13.483 0.0091 * 16.457 0.0025 *User Errors 1.075 0.8982 4.459 0.3475 2.021 0.7319Natural Disaster 4.023 0.4028 4.251 0.3732 3.725 0.4445Fraud 4.476 0.3454 5.534 0.2367 6.060 0.1947
The figures show the progression of p-values from the levels that allow the rejection of the null hypothesis through the levels that do not allow rejection of the null hypothesis, sorted in ascending order. The calculated p-value for each relationship is displayed at the end of each bar plotting the value. This method of viewing the data makes it easier to see how each kind of concern relates, or not, to the type of connectivity, including making obvious the near misses.
Testing the relationship between concern for insider access abuse and Web presence resulted in a chi-square of 11.107 with an associated p-value of 0.0254, which is significant enough to reject the null hypothesis at a 95 percent confidence level. The p-values associated with chi-square testing of a relationship between this concern and Internet access and e-commerce are 0.7884 and 0.1524, neither value which will allow the rejection of the null hypothesis.
Testing the relationship between concern for viruses and Internet access relationship testing resulted in a chi-square of 15.695 with an associated p-value of 0.0035. Concern for viruses and Web presence resulted in a chi-square of 9.656 with an associated p-value of 0.0466. Both of these results allows the rejection of the null hypothesis of independence.

– 91 –
0.0091
0.0203
0.0254
0.0283
0.0466
0.0662
0.1054
0.1434
0.1453
0.1810
0.2367
0.3475
0.3732
0.6270
0.0 0.2 0.4 0.6 0.8 1.0
Data Sabotage
Data Theft
Insider Access Abuse
Transaction Integrity
Viruses
Software Problems
Data Availability
Power Failure
Outsider Access Abuse
Data Integrity
Fraud
User Errors
Natural Disaster
Data Secrecy
Figure 23 Web Presence, Concerns Chi Square P Values
0.0025
0.0143
0.0842
0.1398
0.1524
0.1694
0.1947
0.4359
0.4445
0.4928
0.6331
0.6856
0.7319
0.9354
0.0 0.2 0.4 0.6 0.8 1.0
Data Sabotage
Data Theft
Transaction Integrity
Data Availability
Insider Access Abuse
Viruses
Fraud
Data Secrecy
Natural Disaster
Outsider Access Abuse
Software Problems
Data Integrity
User Errors
Power Failure
Figure 24 E-Commerce, Concerns Chi Square P Values
– 92 –
Testing the relationship between concern for transaction integrity and Web presence resulted in a chi-square of 10.849 with an associated p-value of 0.0283, which is significant enough to reject the null hypothesis at a 95 percent confidence level. The p-values associated with chi-square testing of a relationship between this concern and Internet access and e-commerce are 0.7952 and 0.0842, neither value which will allow the rejection of the null hypothesis.
Testing the relationship between concern for data theft and Web presence resulted in a chi-square of 11.630 with an associated p-value of 0.0203, which is significant enough to reject the null hypothesis at a 95 percent confidence level. Testing the relationship between this concern and e-commerce activity resulted in a chi-square of 12.458 with an associated p-value of 0.0143, which also is significant enough to reject the null hypothesis at a 95 percent confidence level. The p-value associated with chi-square testing of a relationship between this concern and Internet access is 0.8790, which does not allow the rejection of the null hypothesis.
Testing the relationship between concern for data sabotage and Web presence resulted in a chi-square of 13.483 with an associated p-value of 0.0091, which is significant enough to reject the null hypothesis of independence. Testing the relationship between this concern and e-commerce activity resulted in a chi-square of 16.457 with an associated p-value of 0.0025, which also is significant enough to reject the null hypothesis. The p-value associated with chi-square testing of a relationship between this concern and Internet access is 0.7984, which does not allow the rejection of the null hypothesis.
The results of these tests indicate that the hypothesis that small businesses which are connected to the Internet have an overall higher level of concern about security is not a valid conclusion. For both Internet access and Web presence, the aggregate level of concern is not significantly different from those without Internet access or a Web presence. For those with e-commerce activity, however, the aggregate level of concern is in fact higher.
Likelihood for Policies
The second minor hypothesis postulates that small businesses that are connected to the Internet are more likely to have written information security policies than small business that are not connected to the Internet.
Because it is possible to have information security policies that are not explicitly named “Information Security Policy,” the survey questionnaire asked about not only an information security policy but also whether the respondent had a computer use and misuse policy, a proprietary data use and misuse policy, or a communications use and misuse policy. Table 68 displays the numbers of respondents indicating having one of those policies.

– 93 –
Table 68 Policy and Access Type
Internet Access Web Presence E-Commerce Any of 3Yes No Yes No Yes No Yes No
Information Security Yes 53 11 33 31 20 44 56 8Policy No 127 18 64 81 17 128 128 17Computer Use & Yes 49 3 31 21 16 36 49 3Misuse Policy No 131 26 66 91 21 136 135 22Proprietary Data Use & Yes 35 3 24 14 13 25 36 2Misuse Policy No 145 26 73 98 24 147 148 23Communications Use & Yes 28 1 19 10 11 18 28 1Misuse Policy No 152 28 78 102 26 154 156 24Any of Above Yes 75 13 47 41 26 62 78 10Written Policy No 105 16 50 71 11 110 106 15
The data is split by connectivity type. From looking at the data, it is clear that in general much fewer respondents with the type of connectivity indicated have the type of security policy indicated. Conversely, more respondents with a given policy tend to have one or more of the given connectivity types, with the exception of e-commerce. In order to test to see if the relationships are meaningful or not, the chi-square test was used.
Table 69 displays the results of the hypothesis tests. The chi-square tests and the Fisher’s Exact tests results do not allow the rejection of the null hypothesis of independence for relationships between any of the policies and Internet access. Figure 25 displays the data graphically, for both the chi square p-values and the Fisher’s Exact p-values.
Table 69 Chi-Square Tests Policy and Access
Internet Access Web Presence E-Commercechi sq chi sq p Fisher's P chi sq chi sq p Fisher's P chi sq chi sq p Fisher's P
Info Security 0.847 0.3575 0.3883 0.984 0.3212 0.3675 11.619 0.0007 0.0014 *Computer Use 3.806 0.0511 0.0633 4.852 0.0276 0.0366 * 8.111 0.0044 0.0065 *Proprietary Data 1.390 0.2384 0.3063 5.237 0.0221 0.0303 * 8.686 0.0032 0.0081 *Comms Use 3.064 0.0801 0.0889 4.942 0.0262 0.0289 * 9.456 0.0021 0.0065 *Any Policy 0.102 0.7490 0.8400 2.993 0.0836 0.0931 14.631 0.0001 0.0002 *

– 94 –
0.0511
0.0801
0.2384
0.3575
0.7490
0.0633
0.0889
0.3063
0.3883
0.8400
0 0.2 0.4 0.6 0.8 1
Computer Use &Misuse
Comms Use &Misuse
Proprietary DataUse
Info SecurityPolicy
Any Policy
Fisher's PChi Sq P
Figure 25 Internet Access and Policies, P Values
However, the test results do allow the rejection of the null hypothesis for three of the four policy types and Web presence. Figure 26 displays that data graphically.
0.0221
0.0262
0.0276
0.0836
0.3212
0.0303
0.0289
0.0366
0.0931
0.3675
0 0.2 0.4 0.6 0.8 1
Proprietary DataUse
Comms Use &Misuse
Computer Use &Misuse
Any Policy
Info SecurityPolicy
Fisher's Pchi sq p
Figure 26 Web Presence and Policies, P Values
The chi-square test for relationship between computer use and misuse policy and Web presence resulted in a chi-square value of 4.852 with an associated p-value of 0.0276. The p-value associated with Fisher’s Exact test is 0.0366. For those respondents with a Web presence, 32.0 percent had a computer use and misuse policy. Comparatively, only 18.8 percent of those respondents without a Web presence had a computer use and misuse policy.

– 95 –
The chi-square test for relationship between proprietary data use and misuse policy and Web presence resulted in a chi-square value of 5.237 with an associated p-value of 0.0221. The p-value associated with Fisher’s Exact test is 0.0303. For those respondents with a Web presence, 24.7 percent had a proprietary data use and misuse policy, while only 12.5 percent of those without a Web presence had such a policy.
The chi-square test for relationship between communications use and misuse policy and Web presence resulted in a chi-square value of 4.942 with an associated p-value of 0.0262. The p-value associated with Fisher’s Exact test is 0.0289. For those respondents with a Web presence, 19.6 percent had a communications use and misuse policy, while only 8.9 percent of those without a Web presence had such a policy.
The test results also allow the rejection of the null hypothesis of independence for all four policy types and e-commerce activity.
The chi-square test for relationship between information security policy and e-commerce activity resulted in a chi-square value of 11.619 with an associated p-value of 0.0007. The p-value associated with Fisher’s Exact test is 0.0014. For those respondents engaging in e-commerce activity, 54.1 percent had a information security policy, while only 25.6 percent of those not engaging in e-commerce had such a policy.
The chi-square test for relationship between computer use and misuse policy and e-commerce activity resulted in a chi-square value of 8.111 with an associated p-value of 0.0044. The p-value associated with Fisher’s Exact test is 0.0065. For those respondents engaging in e-commerce activity, 43.2 percent had a computer use and misuse policy, while only 20.9 percent of those not engaging in e-commerce had such a policy.
The chi-square test for relationship between proprietary data use and misuse policy and e-commerce activity resulted in a chi-square value of 8.686 with an associated p-value of 0.0032. The p-value associated with Fisher’s Exact test is 0.0081. For those respondents engaging in e-commerce activity, 35.1 percent had a proprietary data use and misuse policy, while only 14.5 percent of those not engaging in e-commerce had such a policy.
The chi-square test for relationship between communications use and misuse policy and e-commerce activity resulted in a chi-square value of 9.456 with an associated p-value of 0.0021. The p-value associated with Fisher’s Exact test is 0.0065. For those respondents engaging in e-commerce activity, 29.7 percent had a communications use and misuse policy, while only 10.5 percent of those not engaging in e-commerce had such a policy.
The results of this testing also indicate that while Internet access per se does not indicate a more aggressive or formal approach to security, there seems to be a link between having a Web presence or engaging in e-commerce and having management tools associated with information security. This relationship may be caused by external factors, such as e-commerce partners

– 96 –
providing or requiring such management tools. Further research is necessary to determine the nature of the relationship.
Likelihood of Security Breach
The third minor hypothesis supporting Research Goal Two postulates that small businesses that are connected to the Internet are more likely to have experienced a breach of information security than small businesses that are not connected to the Internet. In order to determine if a respondent has had an information security related experience, question ten on the survey questionnaire asked respondents to indicate if they had experienced any of thirteen experiences. Table 70 summarizes the results by presenting the numbers of respondents that indicated they had experienced one or more of these given choices. The data is split by access type.
The data at first glance appears to indicate no relationship between having any particular type of access and whether or not an information security related experience had occurred in the previous twelve months with the exception of those respondents having a Web presence.
Table 70 Information Security Experiences and Access Type
Internet Access Web Presence E-Commerce Any of 3Yes No Yes No Yes No Yes No
Information Security Yes 88 13 60 41 18 83 91 10Experiences (Any) No 92 16 37 71 19 89 93 15
For those with Internet access, 88 reported having experienced one or more of the given choices while 92 did not having experienced any. For those engaging in e-commerce activity, 18 reported having experienced one or more of the given choices while 19 did not having experienced any. But for those with a Web presence, 60 (61.6 percent) reported having experienced one or more of the given choices while only 37 (38.1 percent) did not having experienced any. Conversely, for those without a Web presence, 41 (36.6 percent) reported having experienced one or more of the given choices while 71 (63.4 percent) did not indicate having experienced any.
Table 71 presents the results of chi-square and Fisher’s Exact tests on the relationship between having experienced one or more information security experiences in the previous twelve months and the type of access.
As suspected from the data, the null hypothesis of independence cannot be rejected for any of the candidate relationships with either Internet access or e-commerce, but can only be rejected for those respondents with a Web presence. For that relationship, the chi-square value is 13.27 with an associated p-value of 0.0003 and the Fisher’s Exact p-value is also 0.0003. For the relationship between Internet access and any experience, the chi-square value is 0.165 with an

– 97 –
associated p-value of 0.6846 and the Fisher’s Exact p-value is 0.6951. For the relationship between e-commerce activity and any experience, the chi-square value is 0.002 with an associated p-value of 0.9654 and the Fisher’s Exact p-value is >0.9999.
Table 71 Chi Square Test Any Experience and Access
Any Experience and …I'net Ac. Web E-Com Any Ac.
Num. Missing 0 0 0 0DF 1 1 1 1Chi Square 0.165 13.27 0.002 0.788Chi Square P-Value 0.6846 0.0003 0.9654 0.3747G-Squared 0.165 13.406 0.002 0.794G-Squared P-Value 0.6843 0.0003 0.9654 0.3729Contingency Coef. 0.028 0.244 0.003 0.061Phi 0.028 0.252 0.003 0.061Cty. Cor. Chi Square 0.043 12.283 0.000 0.456Cty. Cor. P-Value 0.8361 0.0005 >.9999 0.4993Fisher's Exact P-Value 0.6951 0.0003 >.9999 0.4018
Table 72 presents the individual response frequencies for each of the thirteen experience choices divided by type of access and Table 73 presents the data resulting from testing the null hypotheses that each of these relationships are independent. Both the chi-square test and Fisher’s Exact test were used, although since the expected frequencies in some of the cells are less than five, the chi-square test is not accurate in those cases.
Figures 27 and 28 display the calculated p-values for both the chi square and Fisher’s Exact tests between the types of connectivity of Web presence and e-commerce and the reported experiences in the previous twelve months. The data is sorted in ascending order, showing the two calculated values for each relationship from least to most.

– 98 –
Table 72 Experience Types and Access
By Access Type Internet Access Web Presence E-commerce
Past 12 month experiences All Yes No Yes No Yes NoInformation security incident Yes 18 15 3 12 6 6 12
No 191 165 26 85 106 31 160Natural disaster Yes 7 7 0 6 1 5 2
No 202 173 29 91 111 32 170Fraud Yes 8 7 1 4 4 1 7
No 201 173 28 93 108 36 165Insider access abuse Yes 7 6 1 4 3 2 5
No 202 174 28 93 109 35 167Outsider access abuse Yes 4 4 0 3 1 2 2
No 205 176 29 94 111 35 170Theft proprietary data Yes 2 1 1 1 1 1 1
No 207 179 28 96 111 36 171Viruses Yes 43 37 6 27 16 7 36
No 166 143 23 70 96 30 136Secret data divulged Yes 4 4 0 4 0 3 1
No 205 176 29 93 112 34 171Data corruption, lost Yes 60 54 6 34 26 11 49
No 149 126 23 63 86 26 123Reliability problems Yes 38 30 8 20 18 4 34
No 171 150 21 77 94 33 138Theft computers Yes 6 5 1 3 3 3 3
No 203 175 28 94 109 34 169Employees abuse internet Yes 14 12 2 7 7 3 11
No 195 168 27 90 105 34 161Financial loss Yes 19 17 2 10 9 6 13
No 190 163 27 87 103 31 159Any of above Yes 101 88 13 60 41 18 83
No 108 92 16 37 71 19 89
Table 73 Chi-Square Test Experiences Access
Internet Access Web Presence E-CommercePast 12 month: chi sq chi sq p Fisher's P chi sq chi sq p Fisher's P chi sq chi sq p Fisher's PInfo security incident 0.128 0.7201 0.7214 3.249 0.0715 0.0859 3.303 0.0692 0.0993Natural disaster 1.167 0.2800 0.5967 4.498 0.0339 0.0512 14.349 0.0002 0.0022 *Fraud 0.013 0.9086 >.9999 0.043 0.8356 >.9999 0.155 0.6942 >.9999Insider access abuse 0.001 0.9745 >.9999 0.335 0.5625 0.7067 0.587 0.4435 0.6098Outsider access abuse 0.657 0.4176 >.9999 1.340 0.2470 0.3391 2.920 0.0875 0.1450Theft proprietary data 2.205 0.1376 0.2588 0.010 0.9186 >.9999 1.446 0.2292 0.3234Viruses 2.75E-04 0.9868 >.9999 5.840 0.0157 0.0171 * 0.075 0.7837 >.9999Secret data divulged 0.657 0.4176 >.9999 4.709 0.0300 0.0449 * 9.189 0.0024 0.0182 *Data corruption, lost 1.058 0.3037 0.3798 3.559 0.0592 0.0669 0.023 0.8796 0.8443Reliability problems 2.002 0.1571 0.1926 0.722 0.3953 0.4727 1.642 0.2000 0.2458Theft computers 0.040 0.8410 0.5967 0.032 0.8581 >.9999 4.423 0.0355 0.0699Employees abuse I'net 0.002 0.9633 >.9999 0.078 0.7805 0.7893 0.143 0.7054 0.7177Financial loss 0.196 0.6578 >.9999 0.325 0.5685 0.6338 2.762 0.0965 0.1144

– 99 –
0.0171
0.0449
0.0512
0.0669
0.0859
0.3391
0.4727
0.7067
0.6338
0.7893
0.9999
0.9999
0.9999
0.0157
0.0300
0.0339
0.0592
0.0715
0.2470
0.3953
0.5625
0.5685
0.7805
0.8356
0.8581
0.9186
0 0.2 0.4 0.6 0.8 1
Viruses
Secret data divulged
Natural disaster
Data corruption, lost
Info security incident
Outsider access abuse
Reliability problems
Insider access abuse
Financial loss
Employees abuse I'net
Fraud
Theft computers
Theft proprietary data
Fisher's P chi sq p
Figure 27 Web Presence, Experiences P Values
Four of the 39 relationships resulted in p-values that allow the rejection of the null hypothesis. Two others, that of natural disaster and Web presence and that of theft of computers and e-commerce activity, were indicated by the chi-square test as being not independent, but not by Fisher’s Exact test. The expected frequencies for these two relationships include values under five, which makes the chi-square test unreliable. For these two cases, the Fisher’s Exact test results are preferred and the null hypothesis is not rejected. The four relationships that did reach the level of significance allowing the rejection of the null hypothesis included two relationships with Web presence (problems with viruses and having had secret information divulged) and two with e-commerce (victim of a natural disaster and having had secret information divulged).
Testing the relationship between having experienced problems with viruses or other malicious software and having a Web presence resulted in a chi-square value of 5.840 with an associated p-value of 0.0160 and a Fisher’s Exact test p-value of 0.0171. For those with a Web presence, 27.8 percent had problems with viruses in the previous twelve months. For those without a Web presence, only 14.3 percent experienced such problems.

– 100 –
0.0022
0.0182
0.0699
0.0993
0.1450
0.1144
0.2458
0.3234
0.6098
0.9999
0.7177
0.9999
0.8443
0.0002
0.0024
0.0355
0.0692
0.0875
0.0965
0.2000
0.2292
0.4435
0.6942
0.7054
0.7837
0.8796
0 0.2 0.4 0.6 0.8 1
Natural disaster
Secret data divulged
Theft computers
Info security incident
Outsider access abuse
Financial loss
Reliability problems
Theft proprietary data
Insider access abuse
Fraud
Employees abuse I'net
Viruses
Data corruption, lost
Fisher's P chi sq p
Figure 28 E-Commerce, Experiences P-Values
Testing the relationship between having had secret information divulged and having a Web presence resulted in a chi-square value of 4.709 with an associated p-value of 0.0300 and a Fisher’s Exact test p-value of 0.0449. For those with a Web presence, 4.1 percent had secret information divulged in the previous twelve months. For those without a Web presence, none experienced such problems.
Testing the relationship between having been the victim of a natural disaster and engaging in e-commerce resulted in a chi-square value of 14.35 with an associated p-value of 0.0002 and a Fisher’s Exact test p-value of 0.0022. For those with e-commerce, 13.5 percent reported being the victim of a natural disaster in the previous twelve months. For those without e-commerce, only 1.2 percent reported being the victim of a natural disaster in the previous twelve months.
Testing the relationship between having had secret information divulged and engaging in e-commerce resulted in a chi-square value of 9.189 with an associated p-value of 0.0020 and a Fisher’s Exact test p-value of 0.0182. For those with e-commerce, 8.1 percent had secret information divulged in the previous twelve months. For those without e-commerce, only 0.6 percent experienced such problems.
It is curious that there is a relationship between having had a virus experience in the previous twelve months and having a Web presence, but not with solely having Internet access

– 101 –
nor with engaging in e-commerce. There may be activities or behavior patterns that lead both to a higher likelihood of having a Web presence and being exposed to viruses or other malicious software. Further research is required to investigate the nature of this relationship.
That the experience of having had secret information divulged and both having a Web presence and engaging in e-commerce but not simply having Internet access may reflect on the nature of the business being conducted. It may be that the individual respondents who only had Internet access were less likely to have secret information that they would care about being divulged.
These results match the results from testing the first minor hypothesis regarding concern, where both Web presence and e-commerce were identified as having a relationship with concern about data theft.
Interestingly, however, neither types of access were identified as having a relationship with data secrecy. This may indicate that there may be a distinction in the respondents’ thoughts regarding the two issues of secrecy and theft. Further research would be required to determine what that distinction might be.
Likelihood of Financial Loss
The fourth minor hypothesis postulates that small businesses that are connected to the Internet are more likely to have suffered a financial loss due to an information security breach than small businesses that are not connected to the Internet. One of the information security experience choices on the survey questionnaire asked respondents to indicate if they had lost money due to an information security incident.
Nineteen respondents indicated that they had lost money due to an information security failure. Of those nineteen, fourteen indicated that the amount lost could be quantified. Of those fourteen who said that the amount could be quantified, ten actually quantified the amount lost. The breakout of these respondents and what kinds of access they also indicated is presented in Table 74.
Table 74 Financial Loss and Access Type
Access TypeInternet Internet & Internet, Web
Total None Only Web Presence E-CommerceExp Loss? 19 2 7 4 6Quantify? 14 2 6 3 3Estimate 10 1 5 1 3
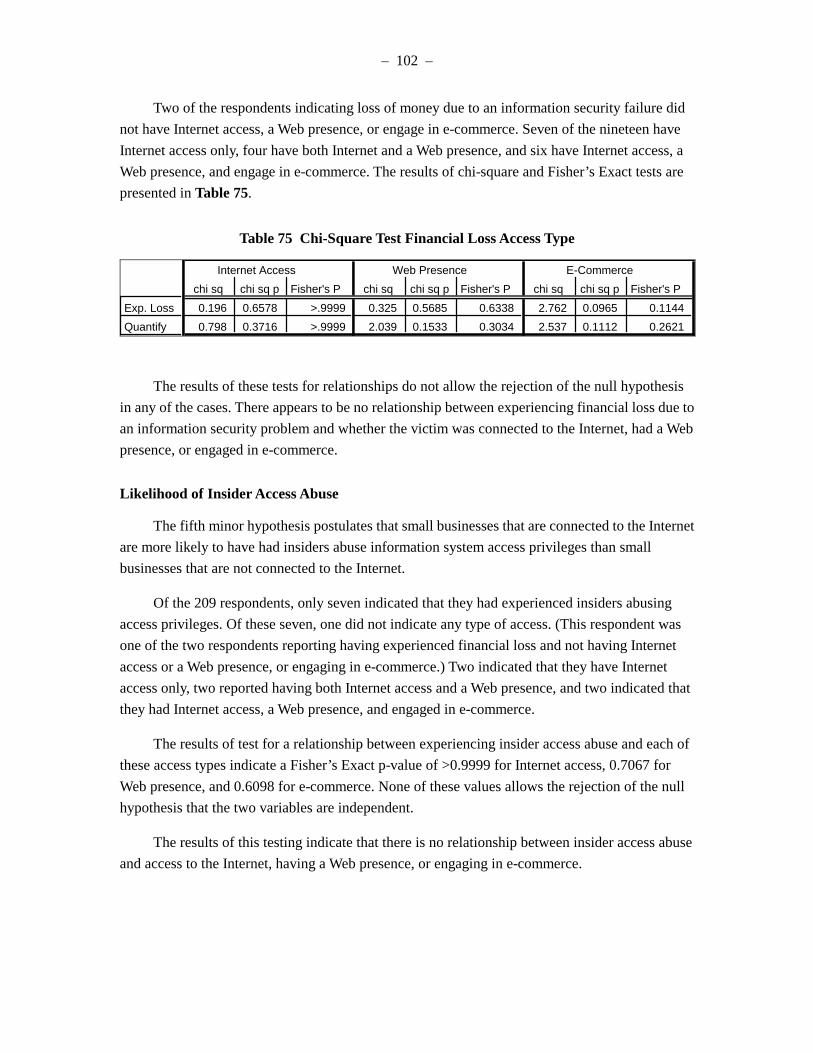
– 102 –
Two of the respondents indicating loss of money due to an information security failure did not have Internet access, a Web presence, or engage in e-commerce. Seven of the nineteen have Internet access only, four have both Internet and a Web presence, and six have Internet access, a Web presence, and engage in e-commerce. The results of chi-square and Fisher’s Exact tests are presented in Table 75.
Table 75 Chi-Square Test Financial Loss Access Type
Internet Access Web Presence E-Commercechi sq chi sq p Fisher's P chi sq chi sq p Fisher's P chi sq chi sq p Fisher's P
Exp. Loss 0.196 0.6578 >.9999 0.325 0.5685 0.6338 2.762 0.0965 0.1144Quantify 0.798 0.3716 >.9999 2.039 0.1533 0.3034 2.537 0.1112 0.2621
The results of these tests for relationships do not allow the rejection of the null hypothesis in any of the cases. There appears to be no relationship between experiencing financial loss due to an information security problem and whether the victim was connected to the Internet, had a Web presence, or engaged in e-commerce.
Likelihood of Insider Access Abuse
The fifth minor hypothesis postulates that small businesses that are connected to the Internet are more likely to have had insiders abuse information system access privileges than small businesses that are not connected to the Internet.
Of the 209 respondents, only seven indicated that they had experienced insiders abusing access privileges. Of these seven, one did not indicate any type of access. (This respondent was one of the two respondents reporting having experienced financial loss and not having Internet access or a Web presence, or engaging in e-commerce.) Two indicated that they have Internet access only, two reported having both Internet access and a Web presence, and two indicated that they had Internet access, a Web presence, and engaged in e-commerce.
The results of test for a relationship between experiencing insider access abuse and each of these access types indicate a Fisher’s Exact p-value of >0.9999 for Internet access, 0.7067 for Web presence, and 0.6098 for e-commerce. None of these values allows the rejection of the null hypothesis that the two variables are independent.
The results of this testing indicate that there is no relationship between insider access abuse and access to the Internet, having a Web presence, or engaging in e-commerce.

– 103 –
Likelihood of Outsider Unauthorized Access
The sixth minor hypothesis for Research Goal Two postulates that small businesses that are connected to the Internet are more likely to have had outsiders attempt to gain unauthorized access to their information assets than small businesses that are not connected to the Internet.
Exploring this hypothesis suffers from the same lack of indicated experiences that the previous hypothesis suffered from. Only four of the 209 respondents indicated that they had experienced outsiders breaking into their information systems. Of these four, three are respondents from companies with less than ten employees and the fourth is from a company with from 51 to one hundred employees.
The testing of relationships between having experienced outsiders breaking in and types of access resulted in Fisher’s Exact p-values of >0.9999 for Internet access, 0.3391 for Web presence, and 0.1450 for e-commerce. These values are not significant enough to allow the rejection of the null hypothesis of independence between the variables. Testing the relationship between an outsider breaking in experience with either having an internal local area network or having an intranet did not result in significant data. However, testing the relationship with having an extranet resulted in a Fisher’s Exact p-value of 0.0095, which is significant enough to reject the null hypothesis of independence.
Likelihood of Having Business Continuity Plans
The seventh minor hypothesis supporting Research Goal Two postulates that small businesses that are connected to the Internet are more likely to have business continuity plans than small businesses that are not connected to the Internet.
Forty-five respondents indicated having business continuity plans. Of those, 38 have Internet access, 26 have a Web presence, and 11 engage in e-commerce. The percentage of those with a business continuity plan and Internet access is 21.1 percent. Those with a business continuity plan but not Internet access is 24.1 percent. The percentage of those with a business continuity plan and a Web presence is 26.8 percent. Those with a business continuity plan but no Web presence is 17.0 percent. The percentage of those with a business continuity plan and engaging in e-commerce is 29.7 percent. Those with a business continuity plan but not engaging in e-commerce is 19.8 percent.
Testing these relationships for significance does not result in values that allow rejection of the null hypothesis in any of the cases. Testing the relationship between having a business continuity plan and Internet access resulted in a chi-square value of 0.135 with an associated p-value of 0.7129 and a Fisher’s Exact p-value of 0.8077. Testing the relationship between having a business continuity plan and having a Web presence resulted in a chi-square value of 2.979 with an associated p-value of 0.0844 and a Fisher’s Exact p-value of 0.0936. Testing the relationship

– 104 –
between having a business continuity plan and e-commerce resulted in a chi-square value of 1.789 with an associated p-value of 0.1811 and a Fisher’s Exact p-value of 0.1904.
Likelihood of Having Security Technology
The eighth minor hypothesis for Research Goal Two postulates that small businesses that are connected to the Internet have more information security technologies incorporated into the workplace than small businesses that are not connected to the Internet. Of the 209 respondents, 205 reported having at least one of the technology choices presented. But, as can be seen in Table 76, no relationship can be concluded between having any one (or more) of the technologies listed on the survey and either Internet access, having a Web presence or engaging in e-commerce.
Table 76 Chi Square Technology and Access
Internet Access Web Presence E-Commercechi sq chi sq p Fisher's P chi sq chi sq p Fisher's P chi sq chi sq p Fisher's P
Any Tech 4.453 0.0348 0.0935 0.752 0.3859 0.6253 0.877 0.3490 >.9999
The case for not rejecting the null hypothesis is very clear for both Web presence and e-commerce, but not so clear for internet access. As can be seen in Table 76 and graphically in Figure 29, the calculated p-value associated with the relationship between any security related technology use and internet connectivity is less than 0.1 for both the chi square test and Fisher’s Exact Test. Further research could provide more insight into this area.
0.0348
0.38590.3490
0.0935
0.6253
0.9999
0
0.1
0.2
0.3
0.4
0.5
0.6
0.7
0.8
0.9
1
Internet Web Presence E-Commerce
Chi Sq P Fisher's P
Figure 29 Technology Use and Connectivity, P Values

– 105 –
The next step in analyzing potential relationships is to consider the total number of technologies used by respondents, comparing those with and without types of access. A new continuous variable was created for this analysis by counting the number of technologies used by each respondent.
Table 77 presents the results of an ANOVA for the computed number of technologies as the continuous dependent variable and Internet access, Web presence, and e-commerce as the nominal independent variables.
One of the examined combinations results in a p-value less than 0.05. The combination of both Internet access and e-commerce with the computed number of technologies used results in a p-value of 0.0372, which allows the rejection of the null hypothesis of independence for only this case.
Table 77 ANOVA Technologies, Access Types
1 16.972 16.972 1.995 .1593 1.995 .2741 5.314 5.314 .625 .4302 .625 .1191 7.692 7.692 .904 .3428 .904 .1491 2.676 2.676 .315 .5755 .315 .0851 37.418 37.418 4.399 .0372 4.399 .5401 16.144 16.144 1.898 .1699 1.898 .2631 14.600 14.600 1.716 .1917 1.716 .242
201 1709.749 8.506
DF Sum of Squares Mean Square F-Value P-Value Lambda PowerInternet AccessWeb PresenceE-CommerceInternet Access * Web PresenceInternet Access * E-CommerceWeb Presence * E-CommerceInternet Access * Web Presence * E-Comm …Residual
ANOVA Table for NumTechs Inclusion criteria: SmallOnly from Returned Survey Data
Respondents with both Internet access and engaging in e-commerce had a mean of 7.343 while those without Internet and e-commerce had a mean of 4.704. The overall mean is 5.526. A one sample t-test for comparison of means between the overall mean number of technologies and those with both Internet and e-commerce results in a p-value of 0.0041, allowing the rejection of the hypothesis that the means are equivalent. All the other cases considering various combinations of access types and use of technologies result in p-values that do not allow the rejection of the null hypothesis.
Examining the relationships further requires that each type of access be examined individually against each type of technology presented on the questionnaire. Table 78 presents an analysis table for considering the relationship between having Internet access and using each of the different types of technologies listed in the survey questionnaire, combined with the chi-square and Fisher’s Exact test results. The same data is shown graphically in Figure 30, sorted by p-value in ascending order.

– 106 –
Table 78 Chi Square Test Internet Access, Technologies
Internet Accesschi sq chi sq p Fisher's P
Anti-Virus Software 9.823 0.0017 0.0046 *Data Backup System 0.682 0.4088 0.4873System Access Control 0.883 0.3475 0.3721Power Surge Protectors 2.215 0.1367 0.1873Redundant Systems 0.769 0.3806 0.4263Shredders 0.712 0.3988 0.4262Data Segregation 3.660 0.0557 0.0754Firewalls 1.298 0.2545 0.3607Encryption 1.172 0.2789 0.6306Intrusion Detection Systems 1.460 0.2269 0.3371System Activity Monitor 2.003 0.1570 0.2691Facility Access Control 0.440 0.5070 0.7750Security Evaluation System 0.697 0.4038 0.5414Dial Back Modem 0.523 0.4697 0.5037Media Degaussers 0.001 0.9745 >.9999
There is only one case where a possible relationship is positively identified—that of a relationship between having Internet access and using anti-virus software. For those with Internet access, 90.0 percent indicated having anti-virus software. For those without Internet access, only 69.0 percent indicated having anti-virus software. The mean for all respondents is 87.1 percent with anti-virus software.
The obvious conclusion is that those with Internet access are more likely to have anti-virus software, but a question remains as to why this should be the case. It could be as a result of deliberate action on the part of the users, or it could reflect the tendency of different classes of service providers, including equipment manufacturers, to provide anti-virus software bundled with equipment and/or services.
However, there is also a non-independent relationship between anti-virus update cycles and Internet access (chi-square p-value of 0.0073). The nature of the relationship is complex, however. For those without Internet access and have anti-virus software, there are none that never update the software. Conversely, 6.7 percent of those with Internet access never update their anti-virus software. Weekly updates are performed by 22.8 percent of those with Internet access but by only 10.3 percent of those without Internet access. This could be a reflection of the ease of updating the software via the Internet. Monthly updates, on the other hand, are performed by 20.6 percent of those with Internet access but by 31.0 percent of those without Internet access. And 32.8 percent of those with Internet access update their anti-virus software only occasionally, while 17.2 percent of those without Internet access update their anti-virus software occasionally. A conclusion is that anti-virus software update behaviors are different dependent on access to the

– 107 –
0 0.2 0.4 0.6 0.8 1
Anti-Virus Software
Data Segregation
Power Surge Protectors
System Activity Monitor
Intrusion Detection Systems
Firewalls
Encryption
System Access Control
Redundant Systems
Shredders
Security Evaluation System
Data Backup System
Dial Back Modem
Facility Access Control
Media Degaussers
chi sq pFisher's P
Figure 30 Technologies and Internet Access, P Values
Internet, but why this should be so is not clear. Further research would be required to determine the influencing factors
To determine if there is a relationship between the total number of technologies used and Internet access, a sum of the technologies indicated by respondents was calculated. This number was then used for unpaired t-tests to determine if the null hypothesis of equality could be rejected. Figure 31 presents a histogram of the calculated total number of technologies used. A normal curve is overlaid.
The distribution is somewhat normal, although the lower tail of the normal curve extends below zero, which isn’t possible for this case.
Table 79 presents the descriptive statistics for the calculated total number of technologies used. Table 79 also shows the descriptive statistics associated with the two subgroups: those with Internet access and those without Internet access. The mean of 5.683 for the subgroup with Internet access is much closer to the sample mean of 5.526 than the mean of the subgroup without Internet access, which is 4.552.

– 108 –
0
5
10
15
20
25
30
35
Cou
nt
-2 0 2 4 6 8 10 12 14 16 18NumTechs
Histogram Inclusion criteria: SmallOnly from Returned Survey Data
Figure 31 Histogram of Total Used Technologies
Table 79 Descriptive Statistics, Total Technologies, Internet Access
5.5263.113
.2150.000
14.0009.693
.526-.2905.0004.000
4.5522.923
.5430.000
14.0008.542
.9862.0524.0004.000
5.6833.122
.2330.000
14.0009.748
.464-.5085.0004.000
MeanStd. Dev.Std. ErrorMinimumMaximumVarianceSkewnessKurtosisMedianMode
NumTechs, Total NumTechs, No NumTechs, Yes
Descriptive Statistics Split By: Internet Access Inclusion criteria: SmallOnly from Returned Survey Data
Table 80 presents the unpaired means comparison test of a possible relationship between the total number of used technologies and Internet access.

– 109 –
Table 80 Unpaired Means Technologies and Internet Access
-1.132 207 -1.827 .0692 -2.353 .090Mean Diff. DF t-Value P-Value 95% Lower 95% Upper
No, Yes
Unpaired Means Comparison for NumTechs Grouping Variable: Internet Access Hypothesized Difference = 0 Inclusion criteria: SmallOnly from Returned Survey Data
As shown in Table 80, the p-value associated with this analysis is 0.0692, which does not allow the rejection of the null hypothesis of independence. The inclusion of zero in the 95 percent confidence values also indicates that rejection of the null hypothesis is warranted.
It appears, therefore, that there is no relationship between the number of technologies used and having Internet access.
Table 81 displays the results of chi-square testing of potential relationships between each technology type and Web presence. Figure 32 displays the p-values graphed in ascending order.
Table 81 Chi-Square Tests Technologies, Web Presence
Web Presencechi sq chi sq p Fisher's P
Anti-Virus Software 7.294 0.0069 0.0072 *Data Backup System 8.587 0.0034 0.0038 *System Access Control 8.670 0.0032 0.0048 *Power Surge Protectors 5.574 0.0182 0.0226 *Redundant Systems 12.930 0.0003 0.0005 *Shredders 0.263 0.6081 0.6759Data Segregation 11.692 0.0006 0.0007 *Firewalls 14.308 0.0002 0.0002 *Encryption 4.166 0.0413 0.0553Intrusion Detection Systems 9.314 0.0023 0.0027 *System Activity Monitor 6.464 0.0110 0.0133 *Facility Access Control 5.778 0.0162 0.0183 *Security Evaluation System 11.696 0.0006 0.0008 *Dial Back Modem 0.119 0.7306 0.8196Media Degaussers 1.823 0.1770 0.2358
Highlighted by the use of an asterisk, eleven of the fifteen choices considered result in significant p-values that allow the rejection of the null hypothesis for each of the individual relationships. The four technologies for which the null hypothesis can not be rejected are shredders, encryption, dial back modems, and media degaussers. The eleven technologies for

– 110 –
which the null hypothesis can be rejected for a relationship with Web presence are anti-virus software, data backup systems, system access control, power surge protectors, redundant systems, data segregation, firewalls, intrusion detection systems, system activity monitors, facility access controls, and security evaluation systems.
0.0 0.2 0.4 0.6 0.8 1.0
Firewalls
Redundant Systems
Data Segregation
Security Evaluation System
Intrusion Detection Systems
System Access Control
Data Backup System
Anti-Virus Software
System Activity Monitor
Facility Access Control
Power Surge Protectors
Encryption
Media Degaussers
Shredders
Dial Back Modem
Fisher's Pchi sq p
Figure 32 Technologies and Web Presence, P Values
This presents an interesting conundrum in the consideration of this hypothesis. While the relationship between having a Web presence and the total number of technologies used by a respondent is seen to be independent by virtue of the previous analysis of variance, there is clearly a much larger number of significant relationships between individual technologies in use by a respondent and having a Web presence.
Examining the data further, Table 82 presents the descriptive statistics for the calculated total number of technologies used, split by the two subgroups of those with a Web presence and those without a Web presence. The means given for the subgroups appear to be quite different, as do the variances. The mean number of technologies used for the subgroup with a Web presence is 6.639 while the mean for the subgroup without a Web presence is 4.562. The overall mean is 5.526. Table 83 presents the result of performing a t-test on this data.

– 111 –
Table 82 Descriptive Statistics Technologies and Web Presence
5.5263.113
.2150.000
14.0009.693
.526-.2905.0004.000
4.5622.724
.2570.000
14.0007.419
.799
.9434.0004.000
6.6393.176
.3220.000
14.00010.087
.203-.8366.0003.000
MeanStd. Dev.Std. ErrorMinimumMaximumVarianceSkewnessKurtosisMedianMode
NumTechs, Total NumTechs, No NumTechs, Yes
Descriptive Statistics Split By: Web Presence Inclusion criteria: SmallOnly from Returned Survey Data
Table 83 Unpaired Means Test Technologies, Web Presence
-2.077 207 -5.089 <.0001 -2.881 -1.272Mean Diff. DF t-Value P-Value 95% Lower 95% Upper
No, Yes
Unpaired Means Comparison for NumTechs Grouping Variable: Web Presence Hypothesized Difference = 0 Inclusion criteria: SmallOnly from Returned Survey Data
The p-value associated with the unpaired means test is given at less than 0.0001, significant enough to reject the null hypothesis of independence. Additionally supporting this is the fact that the 95 percent confidence values do not include zero in their range, which is given as—2.881 for the lower bound and—1.272 for the upper bound.
Table 84 presents the results of chi-square testing of the individual technologies and the respondent engaging in e-commerce activities. Figure 33 presents the p-values graphed in ascending order.

– 112 –
Table 84 Chi-Square Tests Technologies, E-Commerce
E-Commercechi sq chi sq p Fisher's P
Anti-Virus Software 2.256 0.1331 0.1790Data Backup System 0.255 0.6133 0.6805System Access Control 6.143 0.0132 0.0139 *Power Surge Protectors 0.150 0.6986 0.8432Redundant Systems 6.832 0.0090 0.0108 *Shredders 0.285 0.5934 0.7158Data Segregation 4.641 0.0312 0.0441 *Firewalls 18.681 <.0001 <.0001 *Encryption 3.699 0.0544 0.0627Intrusion Detection Systems 4.126 0.0422 0.0515System Activity Monitor 2.463 0.1166 0.1362Facility Access Control 5.873 0.0154 0.0349 *Security Evaluation System 10.687 0.0011 0.0029 *Dial Back Modem 1.893 0.1689 0.2228Media Degaussers 0.058 0.8096 >.9999
Six of the fifteen considered technologies are indicated as being not independent of the access. These six are system access control, redundant systems, data segregation, firewalls, facility access control, and security evaluation systems. Consideration of the other nine technologies did not result in p-values that would allow rejection of the null hypothesis.
Examining the data in aggregate results in the descriptive statistics presented in Table 85. The means for the two subgroups appear very different, at 5.192 for those without e-commerce and at 7.081 for those with e-commerce. Table 86 presents the results of t-tests on these groups. The p-value associated with this unpaired means comparison is given at 0.0007, which is significant enough to allow rejection of the null hypothesis. Supporting this, the 95 percent confidence range, at—2.974 for the lower and—0.805 for the upper, do not include zero.
The analysis of variance indicated that there was a non-independent relationship between the subgroup of those with both Internet access and e-commerce and the number of technologies used. Table 87 presents the set of chi-square analyses examining relationships between having both Internet access and e-commerce with individual technologies. Seven of the relationships are identified as non-independent. The p-values associated with these tested relationships are displayed graphically in ascending order in Figure 34.
Examining the individual responses identified as non-independent reveals some interesting trends between testing. Testing the relationship between Internet access and system access control resulted in a Fisher’s Exact p-value of 0.3721. Testing the relationship between e-commerce and system access control resulted in a Fisher’s Exact p-value of 0.0139. Testing the combination of

– 113 –
Internet access and e-commerce with system access control resulted in a Fisher’s Exact p-value of 0.0062 .
0 0.2 0.4 0.6 0.8 1
Firewalls
Security Evaluation System
Redundant Systems
System Access Control
Facility Access Control
Data Segregation
Intrusion Detection Systems
Encryption
System Activity Monitor
Anti-Virus Software
Dial Back Modem
Shredders
Data Backup System
Power Surge Protectors
Media Degaussers
chi sq pFisher's P
Figure 33 Technologies and E-Commerce, P Values
Table 85 Descriptive Statistics Technologies and E-Commerce
5.5263.113
.2150.000
14.0009.693
.526-.2905.0004.000
5.1922.907
.2220.000
14.0008.448
.514-.1615.0004.000
7.0813.585
.5891.000
14.00012.854
.182-1.0327.0005.000
MeanStd. Dev.Std. ErrorMinimumMaximumVarianceSkewnessKurtosisMedianMode
NumTechs, Total NumTechs, No NumTechs, Yes
Descriptive Statistics Split By: E-Commerce Inclusion criteria: SmallOnly from Returned Survey Data

– 114 –
Table 86 Unpaired Means Test Technologies, E-Commerce
-1.889 207 -3.434 .0007 -2.974 -.805Mean Diff. DF t-Value P-Value 95% Lower 95% Upper
No, Yes
Unpaired Means Comparison for NumTechs Grouping Variable: E-Commerce Hypothesized Difference = 0 Inclusion criteria: SmallOnly from Returned Survey Data
Table 87 Chi Square Technologies, Internet, E-Commerce
Internet and E-Commercechi sq chi sq p Fisher's P
Anti-Virus Software 3.783 0.0518 0.0549Data Backup System 0.536 0.4642 0.5275System Access Control 7.413 0.0065 0.0062 *Power Surge Protectors 0.314 0.5749 0.6868Redundant Systems 9.061 0.0026 0.0030 *Shredders 0.046 0.8305 0.8545Data Segregation 5.941 0.0148 0.0231 *Firewalls 21.502 <.0001 <.0001 *Encryption 3.084 0.0791 0.0904Intrusion Detection Systems 5.180 0.0229 0.0281 *System Activity Monitor 3.114 0.0776 0.1235Facility Access Control 6.912 0.0086 0.0153 *Security Evaluation System 12.077 0.0005 0.0018 *Dial Back Modem 2.341 0.1260 0.1312Media Degaussers 0.031 0.8592 >.9999
The same trend of smaller p-values is seen with the other identified non-independent relationships. Testing the relationship between Internet access and redundant systems resulted in a Fisher’s Exact p-value of 0.4263. Testing the relationship between e-commerce and redundant systems resulted in a Fisher’s Exact p-value of 0.0108. Testing the combination of Internet access and e-commerce with redundant systems resulted in a Fisher’s Exact p-value of 0.0030.
Testing the relationship between Internet access and data segregation resulted in a Fisher’s Exact p-value of 0.0754. Testing the relationship between e-commerce and data segregation resulted in a Fisher’s Exact p-value of 0.0441. Testing the combination of Internet access and e-commerce with data segregation resulted in a Fisher’s Exact p-value of 0.0231.
Testing the relationship between Internet access and firewalls resulted in a Fisher’s Exact p-value of 0.3607. Testing the relationship between e-commerce and firewalls resulted in a Fisher’s Exact p-value of <0.0001. Testing the combination of Internet access and e-commerce with firewalls resulted in a Fisher’s Exact p-value of <0.0001.

– 115 –
0 0.2 0.4 0.6 0.8 1
Firewalls
Security Evaluation System
Redundant Systems
System Access Control
Facility Access Control
Data Segregation
Intrusion Detection Systems
Anti-Virus Software
System Activity Monitor
Encryption
Dial Back Modem
Data Backup System
Power Surge Protectors
Shredders
Media Degaussers
chi sq pFisher's P
Figure 34 Internet and E-Commerce, Technologies, P Values
Testing the relationship between Internet access and intrusion detection systems resulted in a Fisher’s Exact p-value of 0.3371. Testing the relationship between e-commerce and intrusion detection systems resulted in a Fisher’s Exact p-value of 0.0515. Testing the combination of Internet access and e-commerce with intrusion detection systems resulted in a Fisher’s Exact p-value of 0.0281.
Testing the relationship between Internet access and facility access control resulted in a Fisher’s Exact p-value of 0.7750. Testing the relationship between e-commerce and facility access control resulted in a Fisher’s Exact p-value of 0.0349. Testing the combination of Internet access and e-commerce with facility access control resulted in a Fisher’s Exact p-value of 0.0153.
Testing the relationship between Internet access and security evaluation systems resulted in a Fisher’s Exact p-value of 0.5414. Testing the relationship between e-commerce and security evaluation systems resulted in a Fisher’s Exact p-value of 0.0029. Testing the combination of Internet access and e-commerce with security evaluation systems resulted in a Fisher’s Exact p-value of 0.0018.
Clearly there is some set of characteristics surrounding respondents who both have Internet access and engage in e-commerce that is different from those who only have Internet access or a Web presence.

– 116 –
The Overall Impact of the Internet
The fundamental thesis of Research Goal Two was to determine if there was a significant difference in the experiences and activities of small businesses based on whether or not they have Internet access. In examining the data from the returned survey questionnaires, it became clear that considering Internet access alone would not present a complete view of the small business experience. The hypotheses were thus tested against the variables of having a Web presence and engaging in e-commerce. However, no significant differences were noted in the activities and experiences overall, as structured through the hypotheses.
The data in Table 88 summarizes the findings for the testing of the minor hypotheses associated with the first Research Goal. For all but one of the minor hypotheses, no significant difference was found. For the hypothesis regarding the likelihood of having written policies, analysis of the data implies that those respondents with a Web presence or who engage in e-commerce are more likely to have written policies than those who don’t.
While testing the hypotheses, it became clear that some difference exists between the subgroups of those with only Internet access, those with a Web presence, and those who engage in e-commerce. These difference may stem from technology literacy levels, educational differences, or some other set of distinctions. Further research is necessary to understand what these distinctions might be.
Table 88 Research Goal Two Hypotheses Testing Results
With Access Without Access Results
H2a: Concern about security More Less No significant difference
H2b: Written policies More likely to have Less likely to have Only for Web, E-commerce
H2c: Security breach experienced in last 12 months
More likely Less likely No significant difference
H2d: Financial loss due to information security breach
More likely Less likely No significant difference
H2e: Access abuse by insiders More likely Less likely No significant difference
H2f: Unauthorized access by outsiders attempted or achieved
More likely Less likely No significant difference
H2g: Business continuity plans More likely to have Less likely to have No significant difference
H2h: Information security technologies or tools
More likely to have Less likely to have No significant difference

Chapter Nine
Does Size Matter?
As might be expected, there are relationships between the number of employees, the annual revenue, and the number of computers in a company. Table 89 presents a break out of number of computers associated with the company size as reported in terms of number of employees.
Table 89 Number of Computers for Number of Employees
2 0 0 0 0 0 0 2141 8 2 0 0 0 1 152
18 2 1 0 0 0 0 216 5 1 1 0 0 1 141 3 6 0 0 0 0 100 0 0 5 1 1 0 70 0 0 0 1 2 0 3
168 18 10 6 2 3 2 209
Less Than 10 From 11 to 20 From 21 to 50 From 51 to 100 From 101 to 200 From 201 to 500 Unknown TotalsNoneLess than 5From 6 to 10From 11 to 20From 21 to 50From 51 to 100More than 100Totals
Observed Frequencies for Number Computers, Number Employees Inclusion criteria: SmallOnly from Returned Survey Data
Table 90 displays the data associated with the relationship between the size of a company as expressed in annual revenue and the number of computers that the company has. The chi-square p-values resulting from testing each of these relationships are each calculated at <0.0001, which allows the rejection of the null hypotheses of independence.
Table 90 Number of Computers For Size of Business (Annual Revenue)
1113
104101
130
1843000
16
0723710
20
01121229
023
42140
34
2152
211410
73
209
NoneLess than 5From 6 to 10From 11 to 20From 21 to 50From 51 to 100More than 100Totals
Less Than 500K From 500K to 1M From 1 to 5 M More than 5M Unknown Totals
Observed Frequencies for Annual Revenue, Number Computers Inclusion criteria: SmallOnly from Returned Survey Data
The majority of respondents fall into the smallest of the small size category, related to both numbers of employees and annual revenue. Looking at the differences between how the smallest of the small responded to the questionnaire and how all the others responded can provide some

– 118 –
insight into the effect of size on information security experiences and practices. In order to do this, a new nominal variable was constructed by formula, giving the ability to distinguish between the smallest of the small and all others.
Size and Access Practices
Do the smallest businesses with the least amount of computers differ in how they control access to computers and networks? Table 91 displays comparative values for the differences in access practices between the smallest companies and all others. While approximately the same percentages offer access to some employees based on job requirements, access practices differ for almost every other category. Performing a means comparison results in rejection of the null hypothesis of equality for six of the eight relationships: access to all full-time employees, access to part-time employees, access to temporary employees, access to contractors, access to customers, and access to family or friends.
Table 91 Access Practices and Size
Access Types Smallest Others T-testYes Percent Yes Percent p-value
Some Emp, Jobs 47 32.9% 19 28.8% 0.5576All Full-Time Emp 72 50.3% 48 72.7% 0.0022 *Part-Time Emp 17 11.9% 19 28.8% 0.0025 *Temporary Emp 17 11.9% 19 28.8% 0.0063 *Contractors 3 2.1% 11 16.7% <0.0001 *E-Com Partners 1 0.7% 3 4.5% 0.0597Customers 5 3.5% 8 12.1% 0.0163 *Family, Friends 48 33.6% 3 4.5% <0.0001 *
Only approximately half of the smallest companies offer access to all full-time employees, while 72.7 percent of the other businesses offer all full-time employees access. Similarly, larger companies indicated giving part-time and temporary employees access to systems at a higher rate than the smallest companies. This data is not necessarily conclusive, however. The questionnaire did not ask respondents to indicate whether they have each of the kinds of employees mentioned. Further research is needed to determine whether the smallest of the small have the same likelihood of having part-time employees, temporary employees, or contractors.
On the other hand, almost everyone has family and friends, and all companies have customers. The smallest companies indicated that they are less likely to give access to customers: only 3.5 percent of the smallest acknowledged giving customers access, while 12.1 percent of the other companies indicated that practice. The smallest companies indicated that they give family
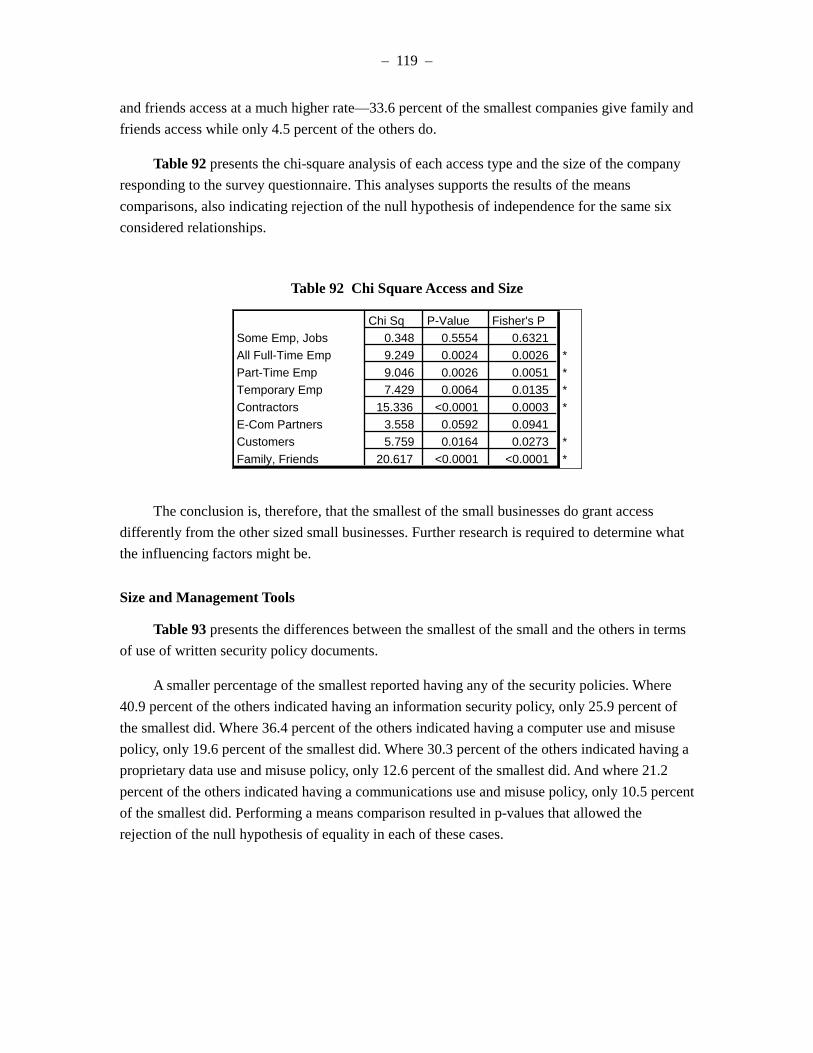
– 119 –
and friends access at a much higher rate—33.6 percent of the smallest companies give family and friends access while only 4.5 percent of the others do.
Table 92 presents the chi-square analysis of each access type and the size of the company responding to the survey questionnaire. This analyses supports the results of the means comparisons, also indicating rejection of the null hypothesis of independence for the same six considered relationships.
Table 92 Chi Square Access and Size
Chi Sq P-Value Fisher's PSome Emp, Jobs 0.348 0.5554 0.6321All Full-Time Emp 9.249 0.0024 0.0026 *Part-Time Emp 9.046 0.0026 0.0051 *Temporary Emp 7.429 0.0064 0.0135 *Contractors 15.336 <0.0001 0.0003 *E-Com Partners 3.558 0.0592 0.0941Customers 5.759 0.0164 0.0273 *Family, Friends 20.617 <0.0001 <0.0001 *
The conclusion is, therefore, that the smallest of the small businesses do grant access differently from the other sized small businesses. Further research is required to determine what the influencing factors might be.
Size and Management Tools
Table 93 presents the differences between the smallest of the small and the others in terms of use of written security policy documents.
A smaller percentage of the smallest reported having any of the security policies. Where 40.9 percent of the others indicated having an information security policy, only 25.9 percent of the smallest did. Where 36.4 percent of the others indicated having a computer use and misuse policy, only 19.6 percent of the smallest did. Where 30.3 percent of the others indicated having a proprietary data use and misuse policy, only 12.6 percent of the smallest did. And where 21.2 percent of the others indicated having a communications use and misuse policy, only 10.5 percent of the smallest did. Performing a means comparison resulted in p-values that allowed the rejection of the null hypothesis of equality in each of these cases.

– 120 –
Table 93 Size and Written Policies
Policies Smallest Others T-testYes Percent Yes Percent p-value
Info Security 37 25.9% 27 40.9% 0.0284 *Comp. Use & Misuse 28 19.6% 24 36.4% 0.0089 *Proprietary Data 18 12.6% 20 30.3% 0.0019 *Comm Use & Misuse 15 10.5% 14 21.2% 0.0373 *
Table 94 presents the results of non-parametric testing for independence in these relationships.
Table 94 Chi Square Size and Policies
Chi Sq P-Value Fisher's PInfo Security 4.805 0.0284 0.0358 *Comp. Use & Misuse 6.806 0.0091 0.0153 *Proprietary Data 9.527 0.0020 0.0034 *Comm Use & Misuse 4.345 0.0371 0.0515
For these relationships, the null can be rejected conclusively four three of the four policy types. For information security policy, computer use and misuse policy, and proprietary data use and misuse policy, both the chi-square and Fisher’s Exact tests result in p-values that allow the rejection of the null hypothesis of independence. For communications use and misuse policy, however, the chi-square test results in a p-value that allows rejection of the null while Fisher’s Exact test results in a p-value that is too large to reject the null hypothesis.
The overall conclusion, however, is that the smallest of the small are less likely to have written security policies than those that are larger small businesses.
Table 95 presents the data relative to the use of other information security management tools and size. Additionally, the p-value related to the means comparison test is displayed for each management too.
Four of the eight given means differences are calculated to be significant: those associated with having information security procedures, information sensitivity levels or coding, computer emergency response plans, and data recovery plans. For each of these, the smallest of the small had a fewer percentage of respondents indicating that they had the particular tool than the larger small businesses. The four categories that did not have significant differences between the two groups are business continuity plans, data destruction procedures, media destruction procedures, and computer emergency response teams.

– 121 –
Table 95 Size and Plans, Procedures
Plans and Procedures Smallest Others T-test
Yes Percent Yes Percent p-valueBus. Cont. Plan 27 18.9% 18 27.3% 0.1717Infosec Procs 25 17.5% 23 34.8% 0.0054 *Data Destruction 17 11.9% 10 15.2% 0.5155Media Destruction 10 7.0% 4 6.1% 0.8032Info Sensitivity 13 9.1% 15 22.7% 0.0070 *CERP 13 9.1% 15 22.7% 0.0070 *CERT 7 4.9% 8 12.1% 0.0604Data Recovery 50 35.0% 33 50.0% 0.0391 *
Table 96 presents the results of performing non-parametric tests of independence on each of these relationships. The same four relationships, size and information security procedures, information sensitivity levels or coding, computer emergency response plans, and data recovery plans, result in a calculated p-value that allows the rejection of the null hypothesis of independence while the other four do not.
Table 96 Chi Square Size and Plans, Procedures
Chi Sq P-Value Fisher's PBus. Cont. Plan 1.882 0.1701 0.2052Infosec Procs 7.698 0.0055 0.0078 *Data Destruction 0.427 0.5132 0.5127Media Destruction 0.063 0.8021 >0.9999Info Sensitivity 7.237 0.0071 0.0147 *CERP 7.237 0.0071 0.0147 *CERT 3.540 0.0599 0.0820Data Recovery 4.264 0.0389 0.0481 *
The conclusion is that the smallest of the small are less likely to have information security procedures, information sensitivity levels or coding, computer emergency response plans, and data recovery plans than the larger small businesses. Additionally, the smallest of the small are equally likely to have business continuity plans, data destruction procedures, media destruction procedures, and computer emergency response teams as the larger small businesses.
Size and Technology Use
Is there a relationship between the size of a company and the use of information security technologies? Table 97 presents the data associated with the use of technologies divided by the two categories, smallest of the small and others. A lower percentage of the smallest of the small

– 122 –
respondents indicated the use of every technology choice except dial back modems and media degaussers. However, means comparison testing indicates that only ten of the means differences are significant. The associated technology choices are data segregation technologies, firewalls, intrusion detection systems, system and facility access controls, redundant systems, system activity monitors, security evaluation systems, shredders, and data backup systems. The technology choices associated with the means comparisons that do not allow rejection of the null hypothesis of equality are anti-virus software, encryption, dial back modems, media degaussers, and power surge protectors.
Table 97 Size and Technology Use
Use of Technologies Smallest Others T-test
Yes Percent Yes Percent p-valueAnti-Virus S/W 121 84.6% 61 92.4% 0.1188Data Segregation 33 23.1% 27 40.9% 0.0079 *Firewalls 22 15.4% 32 48.5% <0.0001 *Intrusion Detection 26 18.2% 21 31.8% 0.0282 *Encryption 35 24.5% 18 27.3% 0.6675System Access Controls 92 64.3% 60 90.9% <0.0001 *Facility Access Controls 12 8.4% 18 27.3% 0.0003 *Dial-back Modem 15 10.5% 6 9.1% 0.7560Redundant Systems 57 39.9% 38 57.6% 0.0167 *System Activity Monitor 15 10.5% 18 27.3% 0.0019 *Media Degaussers 5 3.5% 2 3.0% 0.8626Power Surge Protectors 95 66.4% 52 78.8% 0.0697Security Evaluation 10 7.0% 14 21.2% 0.0026 *Shredders 57 39.9% 36 54.5% 0.0473 *Data Backup Systems 101 70.6% 56 84.8% 0.0271 *
Based on these numbers, the larger small businesses are much more likely to use ten of the technologies than the smallest of the small. The largest differences are seen in the use of firewalls, facility access controls, system activity monitors, and security evaluation systems.
One striking difference is while 90.9 percent of the larger small businesses indicated using system access controls such as passwords, only 64.3 percent of the smallest indicated using system access controls.
The percentage of larger small businesses indicating the use of data segregation techniques is 1.77 times the percentage of the smallest of the small.

– 123 –
The percentage of larger small businesses indicating the use of firewalls and intrusion detection systems are 3.15 and 1.75 times the percentages of the smallest indicating the use of those technologies.
The percentage of larger small businesses using system and facility access controls are 1.41 and 3.25, respectively, times the percentages of the smallest indicating the use of those technologies.
The percentage of larger small businesses indicating the use of redundant systems is 1.44 times the percentages of the smallest indicating the use of those technologies.
The percentage of larger small businesses indicating the use of system activity monitors is 2.6 times the percentages of the smallest indicating the use of those technologies.
The percentage of larger small businesses indicating the use of security evaluation systems is 3.03 times the percentages of the smallest indicating the use of those technologies.
The percentage of larger small businesses indicating the use of shredders is 1.37 times the percentages of the smallest indicating the use of those technologies.
The percentage of larger small businesses indicating the use of data backup systems is 1.2 times the percentages of the smallest indicating the use of those technologies.
Table 98 presents the results of non-parametric tests on the relationships between the bifurcated size variable and the technology choices.
Table 98 Chi Square Size and Technologies
Chi Sq P-Value Fisher's PAnti-Virus S/W 2.448 0.1177 0.1817Data Segregation 7.016 0.0081 0.0131 *Firewalls 25.82 <0.0001 <0.0001 *Intrusion Detection 4.817 0.0282 0.0332 *Encryption 0.187 0.6657 0.7328System Access Controls 16.077 <0.0001 <0.0001 *Facility Access Controls 13.095 0.0003 0.0006 *Dial-back Modem 0.098 0.7546 >0.9999Redundant Systems 5.716 0.0168 0.0246 *System Activity Monitor 9.566 0.0020 0.0037 *Media Degaussers 0.030 0.8618 >0.9999Power Surge Protectors 3.303 0.0691 0.0751Security Evaluation 8.982 0.0027 0.0045 *Shredders 3.943 0.0471 0.0526Data Backup Systems 4.885 0.0271 0.0380 *

– 124 –
Based on the results of the chi-square tests, the null hypothesis of independence can be rejected for the same ten technology choices. Based on the results of Fisher’s Exact tests, the null hypothesis of independence cannot be rejected for one of those relationships: that of size and use of shredders. The p-value calculated for this relationship through the chi-square test is 0.0471 while the p-value calculated through Fisher’s Exact test is 0.0526.
The overall conclusion remains, however: that the smallest of the small are less likely to use information security technologies than the larger small businesses. Further research is required to determine what the influencing factors are in this area.
Size and Data Importance
Does the size of a business influence how it views the importance of different kinds of information? Table 99 displays the data for two levels: size and those regarding a given data type as either highly or extremely important.
Table 99 Size and Data Importance
Data Importance(Extreme or High) Smallest Others T-test
Ex,H Percent Ex,H Percent p-valueProprietary Data 61 44.5% 34 57.6% 0.0932Trade Secrets 35 25.5% 23 39.0% 0.0592Privacy Data 73 53.3% 39 66.1% 0.0972Customer Data 95 69.3% 46 78.0% 0.2198Competitive Data 54 39.4% 32 54.2% 0.0555Market Data 55 40.1% 25 42.4% 0.7725
While a higher percentage of larger small businesses indicated that each given data type was of high or extreme importance to them than the smallest businesses did, no significant differences were discovered. Means comparison testing did not identify any of the means differences as significant. The null hypothesis of equality cannot be rejected for any of the data types.
Table 100 displays the results of non-parametric testing of the relationships between extreme or high importance of each data type and size.

– 125 –
Table 100 Chi Square Size and Data Importance
(Extreme or High) Chi Sq P-Value Fisher's PProprietary Data 2.834 0.0923 0.1190Trade Secrets 3.573 0.0587 0.0632Privacy Data 2.766 0.0963 0.1161Customer Data 1.519 0.2178 0.2314Competitive Data 3.679 0.0551 0.0612Market Data 0.085 0.7711 0.8742
None of the resulting p-values allows the rejection of the null hypothesis of independence.
However, there does seem to be in aggregate a relationship between size and the importance of proprietary data and the importance of privacy data. Table 101 displays the result of chi-square tests examining the relationship between the bifurcated size variable and each of the data importance types.
Table 101 Chi Square Size and Data Importance (All)
All Levels Chi Sq P-ValueProprietary Data 10.025 0.0400 *Trade Secrets 6.890 0.1418Privacy Data 12.916 0.0117 *Customer Data 3.105 0.5404Competitive Data 6.615 0.1577Market Data 7.124 0.1295
The calculated p-value for the relationships with proprietary data and privacy data both allow the rejection of the null hypothesis of independence. Examining the individual relationships within the data itself, as presented in Table 102, reveals that while generally the smallest of the small are more likely to regard data of all types as unimportant, there are some anomalies
Table 102 Size and Data Importance
All Levels Not Important Low Moderate High ExtremeSmall Others Small Others Small Others Small Others Small Others
Proprietary Data 31.4% 11.9% 8.0% 6.8% 16.1% 23.7% 16.1% 15.3% 28.5% 42.3%Trade Secrets 47.5% 28.8% 11.7% 11.9% 15.3% 20.3% 5.1% 10.2% 20.4% 28.8%Privacy Data 23.4% 8.5% 8.0% 10.2% 15.3% 15.3% 10.2% 27.1% 43.1% 39.0%Customer Data 8.8% 8.5% 3.7% 3.4% 18.2% 10.2% 15.3% 11.9% 54.0% 66.1%Competitive Data 27.0% 13.6% 9.5% 11.9% 24.1% 20.3% 12.4% 22.0% 27.0% 32.2%Market Data 24.1% 18.6% 5.1% 13.6% 30.7% 25.4% 9.5% 16.9% 30.7% 25.4%

– 126 –
A total of 31.4 percent of the smallest rated proprietary data as not important, while only 11.9 percent of the others rated it as not important. Conversely, 42.3 of the others rated proprietary data as extremely important, while only 28.5 percent of the smallest did.
With regard to privacy data, the smallest of the small split the majority of their responses between the two extremes, with 43.1 percent indicating that privacy data is extremely important while 23.4 percent indicated it was not important. The larger small businesses’ responses were much more linear, starting with 8.5 percent considering privacy data to be not important and progressing to 39.0 percent considering it extremely important.
One conclusion that can be reached is that the smallest of the small have a much more varied opinion on data importance than the larger small businesses. This may reflect on the amount of structure in the individual businesses or even the types of business being done. Further research is required in order to understand what the influencing factors might be with regards to opinions on data importance.
Size and Experiences
Table 103 presents the comparisons between the smallest of the small and the other small businesses with regards to the types of experiences over the previous twelve months.
Generally speaking, the smallest of the small were less likely to experience any of the given incidents. One incident type that the smallest did experience apparently more frequently was having problems with the reliability of information systems. However, when the means were compared using the t-test, the computed p-value does not allow the rejection of the null hypothesis that the means are equivalent.
Performing means comparison testing does identify eight of the thirteen experience incident types as being significantly distinct. These eight are experiencing an information security incident, being the victim of a natural disaster, having had proprietary data stolen, having had problems with viruses or other malicious software, having had secret information divulged, having had computer equipment stolen, having had employees abuse Internet access privileges, and having lost money due to an information security problem. For each of these, the larger small businesses were much more likely to have experienced the problem than the smallest of the small.
Table 104 presents the results of non-parametric tests of independence between the bifurcated size variable and each of the incident types. In this analysis, relationships with five of the thirteen incident types resulted in p-values from both the chi-square test and Fisher’s Exact test that allow the rejection of the null hypothesis of independence. These five incident types are experiencing an information security incident, being the victim of a natural disaster, having had secret information divulged, having had computer equipment stolen, and having had employees abuse Internet access privileges.

– 127 –
Table 103 Size and Experiences
Experiences inPast 12 month: Smallest Others T-test
Yes Percent Yes Percent p-valueInfo security incident 5 3.5% 13 19.7% <0.0001 *Natural disaster 2 1.4% 5 7.6% 0.0210 *Fraud 3 2.1% 5 7.6% 0.0554Insider access abuse 3 2.1% 4 6.1% 0.1402Outsider access abuse 1 0.7% 3 4.5% 0.0597Theft proprietary data 0 0.0% 2 3.0% 0.0366 *Viruses 24 16.8% 19 28.8% 0.0462 *Secret data divulged 0 0.0% 4 6.1% 0.0028 *Data corruption, lost 36 25.2% 24 36.4% 0.0974Reliability problems 27 18.9% 11 16.7% 0.7013Theft computers 0 0.0% 6 9.1% 0.0002 *Employees abuse I'net 5 3.5% 9 13.6% 0.0063 *Financial loss 9 6.3% 10 15.2% 0.0386 *Any of the Above 60 42.0% 41 62.1% 0.0065 *
Table 104 Chi Square Size and Experiences
Chi Sq P-Value Fisher's PInfo security incident 15.058 0.0001 0.0003 *Natural disaster 5.323 0.0210 0.0335 *Fraud 3.681 0.0550 0.1123Insider access abuse 2.191 0.1389 0.2106Outsider access abuse 3.558 0.0592 0.0941Theft proprietary data 4.375 0.0365 0.0987Viruses 3.982 0.0460 0.0646Secret data divulged 8.836 0.0030 0.0093 *Data corruption, lost 2.762 0.0965 0.1029Reliability problems 0.149 0.6996 0.8473Theft computers 13.384 0.0003 0.0008 *Employees abuse I'net 7.429 0.0064 0.0135 *Financial loss 4.287 0.0384 0.0665Any of the Above 7.352 0.0067 0.0075 *
Three others resulted in chi-square p-values that would allow the rejection of the null hypothesis but the p-values associated with Fisher’s Exact test would not. These three incident types are having had proprietary data stolen, having had problems with viruses or other malicious software, and having lost money due to an information security problem.
On the whole, the larger small companies experienced more information security related incidents in the previous twelve months than the smallest of the small did. Why this should be so

– 128 –
could relate to the amount of publicity, the turn-over rate in employees, or many other factors. Further research is required to determine what the influencing factors might be.
Size and Level of Concern
Is there a difference between the levels of concern that the smallest of the small and the other small businesses have with regards to the potential for problems? Comparing the two bifurcated variables of size and concern results in the values identified in Table 105.
The levels of high or extreme concern indicated are remarkably consistent between the two size groups with just a few exceptions. A much higher percentage of the larger small businesses are concerned with the potential for insider access abuse, at the rate of 21.5 percent to 8.6 percent for the smallest of the small.
Performing a means comparison identifies this as a meaningful distinction, with a t-test p-value of 0.0093. Sixty percent of the larger businesses are very concerned about the potential for data integrity problems while only 42.1 percent of the smallest are. The associated t-test p-value of 0.0171 indicates that the null hypothesis of equality can be rejected. The third area with a significant distinction is that of the potential for outsider access abuse. For this area, 44.6 percent of the larger businesses considered it a high or extreme concern while only 28.6 percent of the smallest did so. With an associated p-value of 0.0237, the null hypothesis can be rejected for this set as well.
Table 105 Size and Concern
Concern(Extreme or High) Smallest Others T-test
Ex,H Percent Ex,H Percent p-valueInsider Access Abuse 12 8.6% 14 21.5% 0.0093 *Viruses 73 52.1% 36 55.4% 0.6670Power Failure 49 35.0% 25 38.5% 0.6331Software Problems 58 41.4% 24 36.9% 0.5423Data Integrity 59 42.1% 39 60.0% 0.0171 *Transaction Integrity 64 45.7% 34 52.3% 0.3816Outsider Access Abuse 40 28.6% 29 44.6% 0.0237 *Data Secrecy 51 36.4% 30 46.2% 0.1868Data Availability 64 45.7% 39 60.0% 0.0574Data Theft 39 27.9% 27 41.5% 0.0514Data Sabotage 41 29.3% 26 40.0% 0.1293User Errors 42 30.0% 17 26.2% 0.5736Natural Disaster 31 22.1% 14 21.5% 0.9230Fraud 33 23.6% 17 26.2% 0.6904

– 129 –
Table 106 presents the results of non-parametric testing of the relationships. The same three areas are identified as being non-independent with the bifurcated size variable: insider access abuse, data integrity, and outsider access abuse.
The nature, however, of the relationships between size and the three identified concern areas is not apparent. Further research is required to identify influencing factors on these elements of concern. However, an overall conclusion is that there is no overwhelming relationship between size and concern for potential problem areas.
Table 106 Chi Square Size and Concern
(Extreme or High) Chi Sq P-Value Fisher's PInsider Access Abuse 6.740 0.0094 0.0130 *Viruses 0.187 0.6651 0.7638Power Failure 0.231 0.6311 0.6422Software Problems 0.375 0.5400 0.6460Data Integrity 5.673 0.0172 0.0239 *Transaction Integrity 0.773 0.3792 0.4528Outsider Access Abuse 5.117 0.0237 0.0270 *Data Secrecy 1.757 0.1850 0.2198Data Availability 3.624 0.0570 0.0716Data Theft 3.806 0.0511 0.0557Data Sabotage 2.316 0.1280 0.1505User Errors 0.32 0.5714 0.6217Natural Disaster 0.009 0.9225 >0.9999Fraud 0.161 0.6887 0.7280
Conclusion: Size Does Matter
Fewer of the smallest of the small grant all full-time employees access to computers and networks than do other size small businesses (50.3 percent versus 72.7 percent) but more give family or friends access (33.6 percent versus 4.5 percent).
Fewer of the smallest of the small have security policies than do larger small businesses. In fact, the larger small businesses are almost twice as likely to have security policies as the smallest of the small.
Size seems not to make a difference in whether a business has a continuity plan, data or media destruction procedures, or a computer emergency response team. Size does seem to matter in whether a business uses information sensitivity levels or coding or has information security procedures, a computer emergency response plan, or data recovery procedures. The larger small businesses report having these four management tools more often than the smallest of the small.

– 130 –
Size matters in the use of some technologies as well. A higher percentage of larger small businesses indicated use of data segregation, firewalls, intrusion detection systems, system and facility access controls, redundant systems, system activity monitors, security evaluation systems, shredders, and data backup systems.
For some of the technologies indicated, size played no role. The smallest of the small are equally likely to use anti-virus software, encryption, dial-back modems, media degaussers, and power surge protectors as the larger small businesses. These technology areas represent some of the most popular and the least popular of the fifteen technology choices. For the two of the more popular choices, anti-virus software and power surge protectors, small businesses were equally likely to report using the technology. For three of the less popular choices, encryption, dial-back modems, and media degaussers, the smallest of the small were equally unlikely to report using the technology.
Size plays little role in the view importance of data. While the smallest of the small tend to generally view data as less important than the larger small businesses, they are equally likely to view all the types of data as of extreme or high importance as the larger small businesses.
The smallest small businesses are less likely in aggregate to have experienced any information security incident in the previous twelve months. Of the thirteen choices, the smallest of the small reported having experienced eight of the choices at lower rates than the larger small businesses. The five areas with no significant differences include fraud, insider access abuse, outsider access abuse, data corruption or loss, and experiencing problems with the reliability of information systems.
The smallest of the small share the same concerns as the larger small businesses. For only three of the fourteen choices was the difference significant. Those three areas include concern over insider access abuse, data integrity, and outsider access abuse. For each of these three areas, a higher percentage of larger small businesses reported these as being of extreme or high concern than did the smallest of the small.

Chapter Ten
Are Services Businesses Different?
Fifty-seven percent of the small businesses responding to this survey listed their business area as that of Services. The others were distributed across the other given areas. This section will examine whether there is any distinguishable difference in the attitude, experiences and practices of those respondents in the Services business area and those in other areas.
Services and Access Practices
Table 107 presents the access practices of businesses in the Services area and in all other areas. For most of the access types, the percentages are fairly close. For example, 6.7 percent of respondents in the Services area indicated giving access to contractors and 6.7 percent of respondents in other business areas also indicated giving access to contractors. Similarly, 18.5 percent of respondents in the Services business area indicated giving access to part-time employees while 15.6 percent of all the others indicated giving access to part-time employees. The only access practice that looks like there might be a significant difference is in giving access to all full time employees. Access to all full time employees was indicated by 63.9 percent of respondents in the Services business area but only by 48.9 percent of all other respondents. Performing a means comparison on these two values results in a p-value of 0.0302, which is sufficient to reject the null hypothesis of equality. For all other access types, the comparison of means did not result in p-values sufficient to reject the null hypothesis.
Table 107 Services and Access
Access Types Services Others T-testYes Percent Yes Percent p-value
Some Emp, Jobs 32 26.9% 34 37.8% 0.0945All Full-Time Emp 76 63.9% 44 48.9% 0.0302 *Part-Time Emp 22 18.5% 14 15.6% 0.5805Temporary Emp 10 8.4% 4 4.4% 0.2591Contractors 8 6.7% 6 6.7% 0.9873E-Com Partners 2 1.7% 2 2.2% 0.7785Customers 9 7.6% 4 4.4% 0.3577Family, Friends 30 25.2% 21 23.3% 0.7558
Table 108 presents the non-parametric tests for independence between the access types and the bifurcated business areas of Services and all others.

– 132 –
Table 108 Chi-Square Services and Access
Chi Sq P-Value Fisher's PSome Emp, Jobs 2.811 0.0936 0.1006All Full-Time Emp 4.701 0.0301 0.0346 *Part-Time Emp 0.309 0.5783 0.7118Temporary Emp 1.285 0.2570 0.4028Contractors 0.0003 0.9872 >0.9999E-Com Partners 0.08 0.7772 >0.9999Customers 0.854 0.3553 0.4019Family, Friends 0.098 0.7544 0.8710
The calculated p-values between the business area bifurcated variable and access to all full-time employees resulted in a chi-square p-value of 0.0301 and a Fisher’s Exact p-value of 0.0346, both of which are sufficient to reject the null hypothesis of independence. None of the other considered relationships is identifiable as non-independent.
Why the Services business area should be more inclined to give access to all full-time employees could be related to many different influencing factors. One strong influence may be the nature of the actual service being performed by the individual businesses. Further research is required to identify both the influencing factors and the level of influence on access procedures.
Services and Management Tools
Table 109 displays the data describing the use of information security related policies by respondents in the Services business area and all others. All of the percentages appear to be fairly even and a means comparison test does not result in any p-values that would allow the rejection of the null hypothesis of equality.
Table 109 Services and Policies
Services Others T-testYes Percent Yes Percent p-value
Info Security 35 29.4% 29 32.2% 0.6643Comp. Use & Misuse 26 21.8% 26 28.9% 0.2458Proprietary Data 20 16.8% 18 20.0% 0.5556Comm Use & Misuse 14 11.8% 15 16.7% 0.3124
Table 110 presents the results of non-parametric testing for independence between the given security policy types and the bifurcated business type of Services and all others. None of the resulting p-values allow the rejection of the null hypothesis of independence.

– 133 –
There appears to be no meaningful difference in the use of written information security policies by those in the Services business area and all other business areas.
Table 110 Chi-Square Services and Policies
Chi Sq P-Value Fisher's PInfo Security 0.191 0.6625 0.7620Comp. Use & Misuse 1.359 0.2437 0.2614Proprietary Data 0.351 0.5534 0.5899Comm Use & Misuse 1.030 0.3101 0.3204
Table 111 displays the percentages of those in the Services business area and all others regarding use of various plans and procedures. Similar to the use of written security policies, there appears to be fairly equivalent use of the identified plans and procedures. Performing a means comparison test also does not result in any p-value that would allow the rejection of the null hypothesis of equality.
Table 111 Services and Plans, Procedures
Plans and Procedures Services Others T-testYes Percent Yes Percent p-value
Bus. Cont. Plan 26 21.8% 19 21.1% 0.8984Infosec Procs 30 25.2% 18 20.0% 0.3777Data Destruction 17 14.3% 10 11.1% 0.5004Media Destruction 7 5.9% 7 7.8% 0.5894Info Sensitivity 17 14.3% 11 12.2% 0.6664CERP 18 15.1% 10 11.1% 0.4012CERT 10 8.4% 5 5.6% 0.4321Data Recovery 46 38.7% 37 41.1% 0.7210
Table 112 presents the result of non-parametric tests of independence on the given plans and procedures and the bifurcated business area identification of Services and all others. Again, none of the calculated p-values for either the chi-square test or Fisher’s Exact test allow the rejection of the null hypothesis of independence. There appears to be no identifiable relationship between being in the Services business area and use of any of the identified plans or procedures.

– 134 –
Table 112 Chi-Square Services and Plans, Procedures
Chi Sq P-Value Fisher's PBus. Cont. Plan 0.017 0.8978 >0.9999Infosec Procs 0.786 0.3752 0.4098Data Destruction 0.459 0.4981 0.5388Media Destruction 0.295 0.5873 0.5904Info Sensitivity 0.188 0.6645 0.6882CERP 0.712 0.3988 0.4214CERT 0.624 0.4296 0.5902Data Recovery 0.129 0.7194 0.7758
Services and Technology Use
Table 113 displays the percentages of respondents in the Services area and in all other business areas indicating the use of the identified technologies.
Table 113 Services and Technology Use
Use of Technologies Services Others T-testYes Percent Yes Percent p-value
Anti-Virus S/W 107 89.9% 75 83.3% 0.1616Data Segregation 32 26.9% 28 31.1% 0.5066Firewalls 29 24.4% 25 27.8% 0.5794Intrusion Detection 27 22.7% 20 22.2% 0.9366Encryption 31 26.1% 22 24.4% 0.7928System Access Controls 86 72.3% 66 73.3% 0.8650Facility Access Controls 13 10.9% 17 18.9% 0.1049Dial-back Modem 11 9.2% 10 11.1% 0.6584Redundant Systems 58 48.7% 37 41.1% 0.2750System Activity Monitor 23 19.3% 10 11.1% 0.1077Media Degaussers 2 1.7% 5 5.6% 0.1243Power Surge Protectors 76 63.9% 71 78.9% 0.0185 *Security Evaluation 12 10.1% 12 13.3% 0.4680Shredders 51 42.9% 42 46.7% 0.5853Data Backup Systems 84 70.6% 73 81.1% 0.0822
The use of technologies appears to be fairly constant across the two groups. For example, 89.9 percent of the respondents in the Services business area indicated the use of anti-virus software while 83.3 of those in all other business areas indicated the use of anti-virus software. The use of shredders was indicated by 42.9 percent of those in the Services business area and by 46.7 percent of those in the other business areas.

– 135 –
Only four technology areas appeared to be used at different rates by the two groups: facility access controls, system activity monitors, power surge protectors, and data backup systems. Facility access controls are used by 10.9 percent of the respondents in the Services business area and by 18.9 percent in all other business areas. Conversely, system activity monitors are used by 19.3 percent of the respondents in the Services business area and by 11.1 percent in all other business areas. Power surge protectors are used by 63.9 percent of the respondents in the Services business area but by 78.9 percent in all other business areas. And data backup systems are used by 70.6 percent of the respondents in the Services business area but by 81.1 percent in all other business areas.
Comparison means testing of these figures resulted in only one significant relationship: that of the use of power surge protectors. The p-value calculated for that means comparison is 0.0185, which allows the rejection of the null hypothesis of equality. The p-values calculated for the other three means comparisons are 0.1049 for facility access controls, for system activity monitors, and for data backup systems. None of these values allow the rejection of the null hypothesis of equality.
Table 114 displays the non-parametric tests for relationships between each of the technologies indicated and the Services business area. Only one of the fifteen examined relationships resulted in a computed p-value that allows the rejection of the null hypothesis of independence. That relationship was with power surge protectors.
Table 114 Chi Square Services and Technology Use
Chi Sq P-Value Fisher's PAnti-Virus S/W 1.974 0.1600 0.2113Data Segregation 0.446 0.5043 0.5389Firewalls 0.311 0.5773 0.6333Intrusion Detection 0.006 0.9362 >0.9999Encryption 0.070 0.7916 0.8729System Access Controls 0.029 0.8642 0.8769Facility Access Controls 2.644 0.1036 0.1146Dial-back Modem 0.198 0.6566 0.6514Redundant Systems 1.203 0.2728 0.3263System Activity Monitor 2.602 0.1067 0.1270Media Degaussers 2.377 0.1231 0.1429Power Surge Protectors 5.543 0.0186 0.0219 *Security Evaluation 0.532 0.4657 0.5150Shredders 0.301 0.5832 0.6734Data Backup Systems 3.036 0.0814 0.1058
The conclusion reached is that small businesses in all business areas use technologies in pretty much the same way, with the exception of power surge protectors. More respondents who

– 136 –
are not in the Services business area use power surge protectors than respondents who are in the Services business area. Further research is required in order to determine why this may be the case. It may have something to do with the infrastructure associated with the businesses in other areas, the experiences of the people running the businesses, or cultural assumptions in the different business areas.
Services and Data Importance
Is there a difference between how important respondents in the Services business area see specific types of data to be as opposed to how important respondents in other business areas see the data? Table 115 presents the data associated with the percentages of respondents in the Services business area and all other business areas who consider the types of data presented to be either of extreme or high importance. For each of the indicated categories of data, the percentages of respondents considering these areas extremely important or of high importance are fairly similar. For example, 40.5 percent of respondents in the Services business area consider market data to be of extreme or high importance, while 41.2 percent of all others consider market data to be of that level of importance.
Table 115 Services and Data Importance
Data Importance(Extreme or High) Services Others T-test
Ex,H Percent Ex,H Percent p-valueProprietary Data 58 52.3% 37 43.5% 0.2280Trade Secrets 31 27.9% 27 31.8% 0.5621Privacy Data 67 60.4% 45 52.9% 0.3007Customer Data 85 76.6% 56 65.9% 0.0996Competitive Data 48 43.2% 38 44.7% 0.8390Market Data 45 40.5% 35 41.2% 0.9289
The two data types with the widest disparity between the percentages are proprietary data and customer data. For these two data types, 52.3 and 76.6 percent of respondents in the Services business area indicated that they were of extreme or high importance, while only 43.5 and 65.9 percent of respondents in all other business areas thought the data types were of extreme or high importance. Performing means comparison testing did not result in identification of any significant distinction however; none of the computed p-values allow the rejection of the null hypothesis of equality.
Table 116 displays the results of non-parametric testing of the relationships between each of the data type and the Services business area. None of the tests performed resulted in a computed p-value that would allow the rejection of the null hypothesis of independence. The conclusion

– 137 –
then is that respondents in the Services business area are equally likely to regard each of the data types as extremely or highly important.
Table 116 Chi Square Services and Data Importance
(Extreme or High) Chi Sq P-Value Fisher's PProprietary Data 1.466 0.2259 0.2504Trade Secrets 0.34 0.5598 0.6362Privacy Data 1.082 0.2983 0.3117Customer Data 2.727 0.0987 0.1104Competitive Data 0.042 0.8380 0.8850Market Data 0.008 0.9285 >0.9999
Services and Experiences
Is there any difference between the experiences in the previous twelve months for those in the Services business area and all others? Table 117 displays the percentages of those in the Services area and all others indicating each type of experience.
Table 117 Services and Experiences
Experiences Services Others T-testYes Percent Yes Percent p-value
Info security incident 10 8.4% 8 8.9% 0.9020Natural disaster 2 1.7% 5 5.6% 0.1243Fraud 3 2.5% 5 5.6% 0.2597Insider access abuse 2 1.7% 5 5.6% 0.1243Outsider access abuse 1 0.8% 3 3.3% 0.1945Theft proprietary data 1 0.8% 1 1.1% 0.8431Viruses 26 21.8% 17 18.9% 0.6022Secret data divulged 2 1.7% 2 2.2% 0.7785Data corruption, lost 35 29.4% 25 27.8% 0.7972Reliability problems 19 16.0% 19 21.1% 0.3420Theft computers 3 2.5% 3 3.3% 0.7292Employees abuse I'net 8 6.7% 6 6.7% 0.9873Financial loss 12 10.1% 7 7.8% 0.5680Any of the Above 57 47.9% 44 48.9% 0.8879
Many of the experience types were indicated by only a few respondents, such as theft of computers (indicated by a total of six respondents), outsider access abuse (reported by a total of four respondents) and theft of proprietary data (reported by a total of two respondents). Other types of experiences were reported by many more respondents. Forty-three respondents reported

– 138 –
having had problems with viruses and sixty respondents reported having data become corrupted or lost.
Glancing at the percentages, the experiences seem to be fairly similar for each of the two groups. Having experienced an information security incident was reported by 8.4 percent of respondents in the Services area and by 8.9 percent of all others. Similarly, 21.8 percent of respondents in the Services business area reported having had problems with viruses while 18.9 percent of all others reported such problems. Performing a means comparison test on the data reveals no significant differences. None of the calculated p-values allow the rejection of the null hypothesis of equality.
Table 118 presents the results of non-parametric testing of relationships between the Services business area and each of the indicated experiences.
None of the relationships results in a calculated p-value that allows the rejection of the null hypothesis.
The conclusion that is reached is that respondents in the Services business area are neither more likely nor less likely to experience any of the given problem areas.
Table 118 Chi Square Services and Experiences
Chi Sq P-Value Fisher's PInfo security incident 0.015 0.9014 >.9999Natural disaster 2.377 0.1231 0.1429Fraud 1.282 0.2576 0.2942Insider access abuse 2.377 0.1231 0.1429Outsider access abuse 1.697 0.1927 0.3169Theft proprietary data 0.040 0.8422 >0.9999Viruses 0.275 0.6002 0.7300Secret data divulged 0.080 0.7772 >0.9999Data corruption, lost 0.067 0.7960 0.8776Reliability problems 0.912 0.3396 0.3688Theft computers 0.121 0.7277 >0.9999Employees abuse I'net 0.0003 0.9872 >0.9999Financial loss 0.330 0.5658 0.6334Any of the Above 0.020 0.8873 0.8899
Services and Level of Concern
Do respondents who work in the Services business area have the same concerns as those in other business areas? Table 119 presents the percentages of respondents in the Services business area and all others reporting a high or extreme level of concern for the indicated items.

– 139 –
While the percentages for some types of concern were very similar, for other types the percentages varied by apparently a large amount. For example, 15.3 percent of those in the Services business area indicated an extreme or high level of concern for insider access abuse, while only 9.2 percent of all others reported that level of concern. Similarly, 52.5 percent of those in the Services business area indicated that transaction integrity was of extreme or high concern, while only 41.4 percent of all other indicated that level of concern.
However, in means comparison testing, only one difference resulted in a p-value that allows the rejection of the null hypothesis of equality—that of data secrecy. For data secrecy, 45.8 percent of respondents in the Services business area indicated that it was of extreme or high concern, while 31.0 percent of all others indicated that level of concern. The calculated p-value associated with the means comparison test is 0.0331, indicating that the null hypothesis of equality can be rejected.
Table 120 presents the results of non-parametric testing of relationships between the concern elements and the Services sector respondents. One relationship shows up as being non-independent—that of data secrecy and the Services business area. The p-value associated with the chi-square test is 0.0330 and with Fisher’s Exact test is 0.0428, both of which allow rejection of the null hypothesis of independence.
Table 119 Services and Concerns
Concern(Extreme or High) Services Others T-test
Ex,H Percent Ex,H Percent p-valueInsider Access Abuse 18 15.3% 8 9.2% 0.1994Viruses 65 55.1% 44 50.6% 0.5248Power Failure 42 35.6% 32 36.8% 0.8618Software Problems 51 43.2% 31 35.6% 0.2753Data Integrity 59 50.0% 39 44.8% 0.4661Transaction Integrity 62 52.5% 36 41.4% 0.1149Outsider Access Abuse 43 36.4% 26 29.9% 0.3286Data Secrecy 54 45.8% 27 31.0% 0.0331 *Data Availability 66 55.9% 37 42.5% 0.0583Data Theft 42 35.6% 24 27.6% 0.2272Data Sabotage 40 33.9% 27 31.0% 0.6675User Errors 30 25.4% 29 33.3% 0.2183Natural Disaster 28 23.7% 17 19.5% 0.4764Fraud 30 25.4% 20 23.0% 0.6900
The conclusion is that the respondents in the Services business area share many of the same concerns as those in other areas, with the exception of data secrecy. In regards to data secrecy,

– 140 –
those in the Services business area are more likely to regard it as extremely important or of high importance than those in other business areas.
Table 120 Chi Square Services and Concerns
(Extreme or High) Chi Sq P-Value Fisher's PInsider Access Abuse 1.660 0.1976 0.2118Viruses 0.409 0.5224 0.5721Power Failure 0.031 0.8610 0.8838Software Problems 1.201 0.2730 0.3136Data Integrity 0.537 0.4637 0.4825Transaction Integrity 2.501 0.1138 0.122Outsider Access Abuse 0.964 0.3262 0.3709Data Secrecy 4.545 0.0330 0.0428 *Data Availability 3.599 0.0578 0.0668Data Theft 1.471 0.2252 0.2898Data Sabotage 0.187 0.6657 0.7634User Errors 1.528 0.2163 0.2746Natural Disaster 0.513 0.4739 0.4998Fraud 0.161 0.6882 0.7437
Conclusion: Services are a Little Different
Whether a respondent was in the Services business area or any other has little influence on their answers to the questionnaire in general.
Services businesses are more likely to give all full-time employees access to computers and networks than non-Services businesses, but the other access practices are not significantly different.
There is no meaningful difference in the use of information security management tools by Services and non-Services businesses. Businesses in the Services area use information security related technologies similarly to other businesses, with one exception: the use of power surge protectors. Businesses in the Services area are less likely to use power surge protectors than other businesses.
There is no meaningful distinction in how businesses in the Services area view the data types as extremely or highly important. Nor is there meaningful distinction in the types of experiences reported by businesses in the Services area.
And finally, there is only one area of concern where there is meaningful distinction: that of data secrecy. Businesses in the Services area are more likely to view it as of extreme or high concern than businesses in other areas.

Chapter Eleven
Are Maryland Businesses Different?
Businesses within Maryland accounted for 40 percent of all solicited businesses (298 out of 741) and 45.3 percent of all responses (96 out of 212). This section of the additional analysis examines whether there are differences in how Maryland businesses responded in comparison to the respondents from other states.
Maryland and Access Practices
Table 121 displays the comparative data between Maryland responses and all others in regards to granting access to computers and networks.
Table 121 Maryland and Access Practices
Access Types Maryland Others T-testYes Percent Yes Percent p-value
Some Emp, Jobs 24 25.0% 42 37.2% 0.0597All Full-Time Emp 62 64.6% 58 51.3% 0.0538Part-Time Emp 18 18.8% 18 15.9% 0.5925Temporary Emp 7 7.3% 7 6.2% 0.7533Contractors 9 9.4% 5 4.4% 0.1552E-Com Partners 3 3.1% 1 0.9% 0.2409Customers 7 7.3% 6 5.3% 0.5566Family, Friends 21 21.9% 30 26.5% 0.4355
In two of the access types, the numbers appear to be substantially different. For 64.6 percent of the Maryland respondents, all full-time employees are granted access, while only 51.3 percent of the other respondents grant all full-time employees access. Conversely, only 25.0 percent of Maryland respondents grant access to some employees based on job requirements, while 37.2 percent of other respondents limit access in that manner.
Means comparison testing, however, indicate that these differences are not significant. The p-values associated with testing these two comparisons are 0.0597 and 0.0538, neither of which allows rejection of the null hypothesis of equality at the 95 percent confidence level.
Table 122 presents the results of non-parametric testing of relationships between the access types and Maryland respondents. Again, none of the relationships testing results in a p-value that allows the rejection of the null hypothesis of independence.

– 142 –
Thus the conclusion is that there is no significant distinction between how the respondents from Maryland grant access and how all others grant access.
Table 122 Chi-Square Maryland and Access
Chi Sq P-Value Fisher's PSome Emp, Jobs 3.557 0.0593 0.0732All Full-Time Emp 3.730 0.0534 0.0679Part-Time Emp 0.290 0.5904 0.7136Temporary Emp 0.100 0.7519 0.7873Contractors 2.035 0.1537 0.1745E-Com Partners 1.387 0.2388 0.3354Customers 0.350 0.5544 0.5789Family, Friends 0.615 0.4331 0.5185
Maryland and Management Tools
Maryland is the home state of the National Security Agency and home to many federal government workers. Could this affect the propensity for Maryland businesses to use written information security related policy documents? Table 123 presents the comparative values for what percentages of Maryland respondents and all others indicated use of each written policy tools. A significant difference is noted for only one of the four policy documents: use of a proprietary data use and misuse policy. Use of this policy was indicated by 24.0 percent of Maryland respondents but only by 13.3 percent of all other respondents.
Table 123 Maryland and Policy Use
Maryland Others T-testYes Percent Yes Percent p-value
Info Security 28 29.2% 36 31.9% 0.6757Comp. Use & Misuse 24 25.0% 28 24.8% 0.9708Proprietary Data 23 24.0% 15 13.3% 0.0462 *Comm Use & Misuse 15 15.6% 14 12.4% 0.5024
Table 124 presents the results of non-parametric testing of the relationships. Only one of the relationships tests resulted in p-values that allow the rejection of the null hypothesis of independence. That one was with proprietary data use and misuse policy, which has a chi-square test p-value of 0.0460 and a Fisher’s Exact test p-value of 0.0499.
Table 125 presents the comparative data associated with the use of other information security related management tools by those in Maryland and all others. For only one of these do

– 143 –
the comparative percentages appear to be quite different—that of the use of a Computer Emergency Response Team. Use of Computer Emergency Response Teams was indicated by 10.4 percent of respondents in Maryland while only 4.4 percent of all others indicated the use of Computer Emergency Response Teams. Performing a means comparison test, however, results in a p-value of 0.0953, which is not significant enough to reject the null hypothesis of equality.
Table 124 Chi-Square Maryland and Policy Use
Chi Sq P-Value Fisher's PInfo Security 0.177 0.6739 0.7636Comp. Use & Misuse 0.001 0.9706 >.09999Proprietary Data 3.983 0.0460 0.0499 *Comm Use & Misuse 0.455 0.5001 0.5503
Table 125 Maryland and Plans, Procedures
Plans and Procedures Maryland Others T-testYes Percent Yes Percent p-value
Bus. Cont. Plan 22 22.9% 23 20.4% 0.6552Infosec Procs 25 26.0% 23 20.4% 0.3323Data Destruction 15 15.6% 12 10.6% 0.2845Media Destruction 5 5.2% 9 8.0% 0.4294Info Sensitivity 14 14.6% 14 12.4% 0.6445CERP 16 16.7% 12 10.6% 0.2027CERT 10 10.4% 5 4.4% 0.0953Data Recovery 40 41.7% 43 38.1% 0.5968
Table 126 presents the results of non-parametric tests of the relationships between Maryland respondents and each of the remaining information security related management tools. No relationship is identified as being non-independent.
The use of information security related management tools by small businesses in Maryland and all others appears to be very similar in nature, with the single exception of the use of proprietary data use and misuse policies.

– 144 –
Table 126 Chi-Square Maryland and Plans, Procedures
Chi Sq P-Value Fisher's PBus. Cont. Plan 0.202 0.6533 0.7362Infosec Procs 0.949 0.33 0.4096Data Destruction 1.156 0.2823 0.3068Media Destruction 0.631 0.4270 0.5809Info Sensitivity 0.215 0.6426 0.6869CERP 1.636 0.2009 0.2256CERT 2.797 0.0944 0.1116Data Recovery 0.283 0.5947 0.6708
Maryland and Technology Use
Small businesses in Maryland appear to use information security related technologies in equivalent percentages as other small businesses. Table 127 presents the comparative percentages of use between Maryland respondents and all others.
Table 127 Maryland and Technology Use
Use of Technologies Maryland Others T-testYes Percent Yes Percent p-value
Anti-Virus S/W 85 88.5% 97 85.8% 0.5640Data Segregation 32 33.3% 28 24.8% 0.1747Firewalls 24 25.0% 30 26.5% 0.8000Intrusion Detection 17 17.7% 30 26.5% 0.1284Encryption 25 26.0% 28 24.8% 0.8353System Access Controls 68 70.8% 84 74.3% 0.5731Facility Access Controls 14 14.6% 16 14.2% 0.9310Dial-back Modem 7 7.3% 14 12.4% 0.2238Redundant Systems 42 43.8% 53 46.9% 0.6502System Activity Monitor 15 15.6% 18 15.9% 0.9524Media Degaussers 5 5.2% 2 1.8% 0.1702Power Surge Protectors 66 68.8% 81 71.7% 0.6457Security Evaluation 12 12.5% 12 10.6% 0.6727Shredders 45 46.9% 48 42.5% 0.5261Data Backup Systems 70 72.9% 87 77.0% 0.4995
Two technology areas appeared to have substantial differences in use percentages—7.3 percent of Maryland respondents indicated use of dial-back modems as compared to 12.4 percent of all others, and 5.2 percent of Maryland respondents indicated use of media degaussers as compared to 1.8 percent of all others. However, the p-values calculated for the means testing of these selections are 0.2238 and 0.1702, both of which do not allow the rejection of the null

– 145 –
hypothesis of equality. Means comparison testing revealed no significant differences in any of the technology choice areas.
Table 128 presents the results of non-parametric testing of relationships between Maryland respondents and technology areas. None of the relationship tests resulted in p-values that would allow the rejection of the null hypothesis of independence. The conclusion, therefore, is that there are no significant differences between the use of technologies by respondents within Maryland and elsewhere.
Table 128 Chi-Square Maryland and Technology Use
Chi Sq P-Value Fisher's PAnti-Virus S/W 0.337 0.5618 0.6800Data Segregation 1.856 0.1731 0.2196Firewalls 0.065 0.7988 0.8744Intrusion Detection 2.327 0.1271 0.1379Encryption 0.044 0.8343 0.8740System Access Controls 0.321 0.5709 0.6408Facility Access Controls 0.008 0.9306 >0.9999Dial-back Modem 1.492 0.2219 0.2549Redundant Systems 0.208 0.6483 0.6775System Activity Monitor 0.004 0.9521 >0.9999Media Degaussers 1.896 0.1686 0.2513Power Surge Protectors 0.214 0.6438 0.6519Security Evaluation 0.181 0.6709 0.6711Shredders 0.406 0.5238 0.5772Data Backup Systems 0.461 0.4971 0.5329
Maryland and Data Importance
Table 129 presents the comparative percentages of Maryland respondents and all others regarding each given data type as extremely or highly important. Only one area seems to have a wide amount of difference between the two groups—customer data. Customer data was indicated as extremely or highly important by 76.3 percent of Maryland respondents but only by 68.0 percent of all other respondents. However, a means comparison test results in a p-value of 0.1940, which is not significant enough to reject the null hypothesis of equality.
Table 130 presents the non-parametric tests of the relationships between the Maryland respondents and each of the given data types. None of the relationship tests resulted in a p-value that would allow the rejection of the null hypothesis of independence. The conclusion is that Maryland small businesses are very much like other respondents in how they view the importance of the different information types.

– 146 –
Table 129 Maryland and Data Importance
Data Importance(Extreme or High) Maryland Others T-test
Ex,H Percent Ex,H Percent p-valueProprietary Data 44 47.3% 51 49.5% 0.7595Trade Secrets 29 31.2% 29 28.2% 0.6449Privacy Data 53 57.0% 59 57.3% 0.9673Customer Data 71 76.3% 70 68.0% 0.1940Competitive Data 42 45.2% 44 42.7% 0.7324Market Data 39 41.9% 41 39.8% 0.7634
Table 130 Chi-Square Maryland and Data Importance
(Extreme or High) Chi Sq P-Value Fisher's PProprietary Data 0.095 0.758 0.7764Trade Secrets 0.215 0.6429 0.7542Privacy Data 0.002 0.9671 >0.9999Customer Data 1.701 0.1921 0.2064Competitive Data 0.118 0.7307 0.7741Market Data 0.092 0.7620 0.7731
Maryland and Experiences
Table 131 presents the comparative percentages of responses from small businesses in Maryland and elsewhere regarding experiences in the previous twelve months. Looking at the data, more of the respondents from other areas seem to indicate having experienced each of the incidents identified than respondents from Maryland, with the exception of having secret information divulged, theft of computers, and employees abusing Internet access privileges.
For one of these areas, the difference is quite noticeable: 5.2 percent of Maryland respondents versus 0.9 percent of all other respondents indicate having experienced theft of computer equipment. However, when means comparison testing is performed on the data, none of the resulting p-values allows the null hypothesis of equality to be rejected for any of the incident types.
Table 132 presents the results of non-parametric tests of relationships between Maryland respondents and each of the experience incident types. None of the relationships tested resulted in a computed p-value that would allow the rejection of the null hypothesis of independence.

– 147 –
Table 131 Maryland and Experiences
Experiences inPast 12 month: Maryland Others T-test
Yes Percent Yes Percent p-valueInfo security incident 6 6.3% 12 10.6% 0.2640Natural disaster 2 2.1% 5 4.4% 0.3509Fraud 3 3.1% 5 4.4% 0.6275Insider access abuse 3 3.1% 4 3.5% 0.8689Outsider access abuse 0 0.0% 4 3.5% 0.0632Theft proprietary data 0 0.0% 2 1.8% 0.1920Viruses 15 15.6% 28 24.8% 0.1038Secret data divulged 2 2.1% 2 1.8% 0.8699Data corruption, lost 27 28.1% 33 29.2% 0.8644Reliability problems 15 15.6% 23 20.4% 0.3795Theft computers 5 5.2% 1 0.9% 0.0626Employees abuse I'net 8 8.3% 6 5.3% 0.3860Financial loss 6 6.3% 13 11.5% 0.1896Any of the Above 43 44.8% 58 51.3% 0.3484
Table 132 Chi-Square Maryland and Experiences
Chi Sq P-Value Fisher's PInfo security incident 1.259 0.2618 0.3264Natural disaster 0.879 0.3485 0.4563Fraud 0.238 0.6255 0.7287Insider access abuse 0.028 0.8681 >0.9999Outsider access abuse 3.465 0.0627 0.1264Theft proprietary data 1.716 0.1903 0.5009Viruses 2.661 0.1028 0.1231Secret data divulged 0.027 0.8691 >0.9999Data corruption, lost 0.03 0.8636 0.8793Reliability problems 0.78 0.3771 0.4721Theft computers 3.479 0.0621 0.0962Employees abuse I'net 0.759 0.3836 0.4173Financial loss 1.734 0.1879 0.2313Any of the Above 0.888 0.3461 0.4050
The conclusion that must be reached is that equivalent percentages of respondents in Maryland as the rest of the nation experienced the identified incidents. The low number of respondents over all, however, make these conclusions a bit problematic. Further research to either confirm the low number of incident rates for small businesses or to identify a sample population more reflective of the national experience is required to shed light on this area.

– 148 –
Maryland and Level of Concern
Table 133 presents the comparative data regarding the percentages of Maryland and all other respondents considering the identified areas as extreme or high concerns. Several of the comparative responses stand out as being potentially different—viruses, transaction integrity, and data secrecy. Extreme or high concern for viruses was indicated by 59.1 percent of Maryland respondents, but only by 48.2 percent of all other respondents. Extreme or high concern for transaction integrity was indicated by 54.8 percent of Maryland respondents, but only by 42.0 percent of all other respondents. Extreme or high concern for data secrecy was indicated by 45.2 percent of Maryland respondents, but only by 34.8 percent of all other respondents.
Means comparison tests on each of these comparative values, however, did not result in any p-values sufficient to allow the rejection of the null hypothesis of equality. The calculated p-value from the means comparison test for viruses is 0.1198, the calculated p-value from the means comparison test for transaction integrity is 0.0667,and the calculated p-value from the means comparison test for data secrecy is 0.1329.
Table 133 Maryland and Concern
Concern(Extreme or High) Maryland Others T-test
Ex,H Percent Ex,H Percent p-valueInsider Access Abuse 14 15.1% 12 10.7% 0.3551Viruses 55 59.1% 54 48.2% 0.1198Power Failure 33 35.5% 41 36.6% 0.8684Software Problems 40 43.0% 42 37.5% 0.4251Data Integrity 47 50.5% 51 45.5% 0.4778Transaction Integrity 51 54.8% 47 42.0% 0.0667Outsider Access Abuse 32 34.4% 37 33.0% 0.8369Data Secrecy 42 45.2% 39 34.8% 0.1329Data Availability 50 53.8% 53 47.3% 0.3609Data Theft 33 35.5% 33 29.5% 0.3609Data Sabotage 34 36.6% 33 29.5% 0.2832User Errors 27 29.0% 33 29.5% 0.9425Natural Disaster 18 19.4% 27 24.1% 0.4156Fraud 21 22.6% 29 25.9% 0.5846
Table 134 presents the results of non-parametric tests of relationships between Maryland respondents and each of the areas of concern. None of the calculated p-values allows the rejection of the null hypothesis of independence for any of the considered relationships.

– 149 –
The conclusion is that respondents from Maryland not particularly different from other respondents but are equally likely as respondents from other areas to consider the areas listed as of extreme or high concerns.
Table 134 Chi-Square Maryland and Concern
(Extreme or High) Chi Sq P-Value Fisher's PInsider Access Abuse 0.864 0.3526 0.4025Viruses 2.436 0.1186 0.1248Power Failure 0.028 0.8676 0.8849Software Problems 0.643 0.4227 0.4748Data Integrity 0.509 0.4754 0.4863Transaction Integrity 3.375 0.0662 0.0699Outsider Access Abuse 0.043 0.8359 0.8825Data Secrecy 2.273 0.1317 0.1521Data Availability 0.843 0.3584 0.4009Data Theft 0.843 0.3584 0.3717Data Sabotage 1.162 0.2810 0.2983User Errors 0.005 0.9422 >0.9999Natural Disaster 0.67 0.4131 0.4984Fraud 0.302 0.5825 0.6265
Conclusion: Maryland is Normal
In all the considered areas, there is only one that is identified as being significantly different for Maryland respondents as compared to all others. That is the use of proprietary data use and misuse policies. Maryland respondents are more likely to have a proprietary data use and misuse policy than other respondents.
In all other areas, there are no significant differences.


Chapter Twelve
Some Other Insights
While performing the hypothesis testing and looking at all the data, it became clear that a wealth of information relating practices, concerns, and experiences could be extracted through statistical analysis. While doing these analyses, most proved to be meaningless but some turned out to be interesting. This section presents the most interesting of those analyses.
Experiences and Policies
Are those respondents who have experienced difficulties with information systems or attacks more likely to have written security policies? Table 135 displays the numbers of respondents indicating that one or more experience happened in the previous twelve months and also the numbers indicating that they have one or more of the four written policy choices.
There appears to be little if any correlation between the data. In order to test for relationships between the policy variables and each incident type, non-parametric testing was performed on each relationship.
Table 135 Experiences and Policies
Internet Access Web Presence E-Commerce Any of 3Yes No Yes No Yes No Yes No
Information Security Yes 88 13 60 41 18 83 91 10Experiences (Any) No 92 16 37 71 19 89 93 15Written Yes 75 13 47 41 26 62 78 10Policy No 105 16 50 71 11 110 106 15
Table 136 presents the results of that testing for the relationships with information security policies and computer use and misuse policies. Table 137 presents the results of that testing for the relationships with proprietary data and communications use and misuse policies. Few of the relationships for any of the policy types are identified as non-independent and none of the relationships associated with proprietary data use and misuse are identified as non-independent.
Testing the relationship between information security policy and having experienced an information security incident was one that was identified as non-independent. The p-value resulting from the chi-square test is 0.0033 and from Fisher’s Exact test is 0.0061. These values allow the rejection of the null hypothesis of independence.
Testing the relationship between information security policy and having experienced fraud was one that resulted in mixed judgements. The p-value resulting from the chi-square test is

– 152 –
0.0461 and from Fisher’s Exact test is 0.0593. The chi-square p-value allows the rejection of the null hypothesis of independence, but the Fisher’s Exact test p-value does not.
Testing the relationship between information security policy and having experienced problems with viruses was also one that was identified as non-independent. The p-value resulting from the chi-square test is 0.0112 and from Fisher’s Exact test is 0.0155. These values allow the rejection of the null hypothesis of independence.
Table 136 Chi-Square Experience and Policy (1)
Information Security Policy and … Computer Use & Misuse Policy and …Past 12 month: chi sq chi sq p Fisher's P chi sq chi sq p Fisher's PInfo security incident 8.618 0.0033 0.0061 * 13.833 0.0002 0.0007 *Natural disaster 2.398 0.1215 0.2044 1.252 0.2631 0.3690Fraud 3.979 0.0461 0.0593 c 2.808 0.0938 0.1079Insider access abuse 2.398 0.1215 0.2044 8.396 0.0038 0.0113 *Outsider access abuse 3.780 0.0519 0.0864 1.377 0.2406 0.2587Theft proprietary data 0.891 0.3451 >0.9999 0.669 0.4135 >0.9999Viruses 6.434 0.0112 0.0155 * 1.708 0.1913 0.2346Secret data divulged 0.061 0.8054 >0.9999 5.481 0.0192 0.0484 *Data corruption, lost 0.043 0.8353 0.8690 2.074 0.1498 0.1604Reliability problems 0.020 0.8875 >0.9999 0.051 0.8210 0.8370Theft computers 3.778 0.0519 0.0726 2.086 0.1487 0.1646Employees abuse I'net 2.652 0.1034 0.1330 2.594 0.1072 0.1176Financial loss 2.759 0.0967 0.1181 5.655 0.0174 0.0253 *
Table 137 Chi-Square Experience and Policy (2)
Prop Data Use & Misuse Policy and … Comms Use & Misuse Policy and …Past 12 month: chi sq chi sq p Fisher's P chi sq chi sq p Fisher's PInfo security incident 1.219 0.2695 0.3333 6.240 0.0125 0.0237 *Natural disaster 0.074 0.7857 >0.9999 0.001 0.9745 >0.9999Fraud 1.849 0.1740 0.3556 0.861 0.3533 0.3069Insider access abuse 1.609 0.2046 0.3547 0.001 0.9745 >0.9999Outsider access abuse 0.127 0.7211 0.5548 0.422 0.5158 0.4524Theft proprietary data 0.449 0.5029 >0.9999 0.325 0.5684 >0.9999Viruses 0.275 0.6001 0.6578 3.986 0.0459 0.0795 cSecret data divulged 2.775 0.0957 0.1519 4.453 0.0348 0.0935 cData corruption, lost 0.187 0.6654 0.6938 0.021 0.8856 >0.9999Reliability problems 0.257 0.6120 0.6433 0.142 0.7059 0.7951Theft computers 0.953 0.3289 0.2995 1.957 0.1618 0.1957Employees abuse I'net 1.229 0.2676 0.4734 0.002 0.9633 >0.9999Financial loss 0.080 0.7767 >0.9999 0.901 0.3426 0.3103

– 153 –
Testing the relationship between computer use and misuse policy and having experienced an information security incident was one that was identified as non-independent. The p-value resulting from the chi-square test is 0.0002 and from Fisher’s Exact test is 0.0007. These values allow the rejection of the null hypothesis of independence.
Testing the relationship between computer use and misuse policy and having had an insider abuse access privileges was one that was identified as non-independent. The p-value resulting from the chi-square test is 0.0038 and from Fisher’s Exact test is 0.0113. These values allow the rejection of the null hypothesis of independence.
Testing the relationship between computer use and misuse policy and having had secret information was one that was identified as non-independent. The p-value resulting from the chi-square test is 0.0192 and from Fisher’s Exact test is 0.0484. These values allow the rejection of the null hypothesis of independence.
Testing the relationship between computer use and misuse policy and having lost money due to an information security failure was one that was identified as non-independent. The p-value resulting from the chi-square test is 0.0174 and from Fisher’s Exact test is 0.0253. These values allow the rejection of the null hypothesis of independence.
None of the relationships tested with proprietary data use and misuse resulted in p-values that would allow the rejection of the null hypothesis of independence. The two that might have been thought to have some relationship—theft of proprietary data and having had secret information divulged—resulted in chi-square p-values of 0.5029 and 0.0957 respectively. Neither of those allows the rejection of the null hypothesis of independence.
Testing the relationship between communications use and misuse policy and having experienced an information security incident was one that was identified as non-independent. The p-value resulting from the chi-square test is 0.0125 and from Fisher’s Exact test is 0.0237. These values allow the rejection of the null hypothesis of independence.
Testing the relationship between communications use and misuse and having had problems with viruses was one that resulted in mixed judgements. The p-value resulting from the chi-square test is 0.0459 and from Fisher’s Exact test is 0.0795. The chi-square p-value allows the rejection of the null hypothesis of independence, but the Fisher’s Exact test p-value does not.
Testing the relationship between communications use and misuse and having had secret information divulged was another one that resulted in mixed judgements. The p-value resulting from the chi-square test is 0.0348 and from Fisher’s Exact test is 0.0935. The chi-square p-value allows the rejection of the null hypothesis of independence, but the Fisher’s Exact test p-value does not.

– 154 –
For those combinations that are indicated as non-independent, Table 138 presents the data regarding how the relationship is reflected in the data. As might be expected, a higher percentage of respondents who had indicated having had experienced the indicated experience type also indicated having the given policy type. But only six of the thirteen identified experience types are identified as being related to a policy document.
A total of 64 respondents indicated having an information security policy. Of those, 17.2 percent had experienced an information security incident. Of the ones without an information security policy, only 4.8 percent indicated having experienced an information security incident. A means comparison test results in a p-value of 0.0032, which allows the rejection of the null hypothesis of equality.
Similarly, 21.2 percent of those who had experienced an information security incident had a computer use and misuse policy, while only 4.5 percent of those without such a policy indicated having experienced an information security incident. And 20.7 percent of those with such an experience reported having a communications use and misuse policy, while only 6.7 percent of those without such a policy indicated having experienced such an incident.
Table 138 Percentages Policies and Experiences
Experiences inPast 12 month: Infosec Policy All Others T-test
Yes Percent Yes Percent p-valueInfo security incident 11 17.2% 7 4.8% 0.0032Fraud 5 7.8% 3 2.1% 0.0463Viruses 20 31.3% 23 15.9% 0.0111
Computer Misuse Policy All Others T-testYes Percent Yes Percent p-value
Info security incident 11 21.2% 7 4.5% 0.0002Insider access abuse 5 9.6% 2 1.3% 0.0036Secret data divulged 3 5.8% 1 0.6% 0.0192Financial loss 9 17.3% 10 6.4% 0.0173
Comms Misuse Policy All Others T-testYes Percent Yes Percent p-value
Info security incident 6 20.7% 12 6.7% 0.0124Viruses 10 34.5% 33 18.3% 0.0461Secret data divulged 2 6.9% 2 1.1% 0.0350
The conclusion is that those respondents who had experienced a given incident type were more likely to have one of the given policies, although only six of the experience types seemed to influence the existence of policy documents.

– 155 –
The interesting thing here is how many of the given experience types are not tightly coupled with a policy document. The seven experience types that are not related to a policy type are having been a victim of natural disaster, had an outsider break into information systems, had proprietary data stolen, had data get corrupted or partially lost, had problems with the reliability of information systems, had computer equipment stolen, and had employees abuse Internet access privileges.
Virus Concern and Use of Anti-Virus Software
A relationship was discovered between the concern with viruses and the use of anti-virus software.
Viruses were rated as being of extreme concern to 66, or 32.1 percent, of respondents. Forty-three more rated them as being of high concern; a total of 109 rated viruses as being either of high or extreme concern. Only 36 total respondents indicated that viruses were of low or no concern.
This expressed level of concern is mirrored in the numbers of respondents indicating their use of anti-virus software. A chi-square analysis of the two results in a chi-square value of 34.973 with an associated p-value of <0.0001, which indicates that the null hypothesis of variable independence can be rejected.
A further analysis considering the relationship between level of concern and the frequency with which the respondents updated the anti-virus software results in a chi-square value of 49.747 with an associated p-value of 0.0002, also allowing the rejection of the null hypothesis of independence.
What this indicates that is the more concerned a respondent is about viruses, the more likely it is that the respondent will both have anti-virus software and update it frequently.
Data Availability Concern and Practices
Data availability was rated in aggregate to be of the next highest level of concern. Fifty-nine respondents rated it as being of extreme concern, 44 rated it as being of high concern, and 48 rated it as being of moderate concern. Thirteen said that it was of low concern while 41 indicated that it was of no concern.
No relationship was discovered between concern for data availability and either having data recovery procedures or having data backup systems. No probable relationship was discovered with the likelihood of having data recovery procedures (chi-square value of 7.687 and an associated p-value of 0.1037) nor of having data backup systems (chi-square value of 6.785 and an associated p-value of 0.1477).

– 156 –
A possible relationship between the concern for data availability and redundant communications systems may exist, though: a chi-square analysis of these two elements results in a chi-square value of 16.123 with an associated p-value of 0.0029, which allows the rejection of the null hypothesis of independence.
Data Integrity Concern and Practices
No relationship was discovered between concern for data integrity and having data backup systems, using cryptography, or using firewalls, although a relationship was discovered with the use of anti-virus software.
Data integrity was rated somewhat similarly to data availability in terms of level of concern. Fifty-eight respondents indicated that data availability was of extreme concern and 40 indicated that it was of high concern. It was of moderate concern to 49 respondents. To 22 respondents, it was of low concern and of no concern at all to 36 respondents.
No relationship was discovered between concern for data integrity and having data backup systems (chi-square value of 5.456 and an associated p-value of 0.2436), using cryptography (chi-square value of 6.875 and an associated p-value of 0.1426), or having firewalls (chi-square value of 9.079 and an associated p-value of 0.0592).
A possible relationship was discovered with the use of anti-virus software—a chi-square analysis resulted in a chi-square value of 12.726 with an associated p-value of 0.0127, which is sufficient to reject the null hypothesis of independence.
Another possible relationship was discovered with off-site storage for data back-ups—a chi-square analysis resulted in a chi-square value of 12.494 with an associated p-value of 0.0140, which is sufficient to reject the null hypothesis of independence.
Transaction Integrity Concern and Practices
Concern for transaction integrity seems to be linked with the use of specific technologies to ensure that integrity.
Relationships were discovered between concern for transaction integrity and the use of anti-virus software (chi-square value p-value of 0.0306), use of encryption with communications (chi-square value p-value of 0.0305), use of redundant power systems (chi-square p-value of 0.0266), use of redundant communications (chi-square p-value of 0.0434), and the use of power surge protectors (chi-square p-value of 0.0098).

– 157 –
Insider Access Abuse
The fact that so few small businesses have apparently experienced insider access abuse may be a reflection on the size of the business itself. Of the seven respondents who indicated that they had experienced insider access abuse, four have less than ten employees, one has between eleven and twenty employees, one has between 21 and fifty employees, and one has from 51 to one hundred employees. Moreover, chi-square testing of this possible relationship between number of employees and experiencing insider access abuse resulted in a chi-square of 5.654 with an associated p-value of 0.4631.
There was no commonality found in business area, either. The seven respondents came from six different business areas. Nor was there a link with size of company as measured in annual revenue or number of computers.
However, a relationship does appear to exist with the use of an internal local area network. Testing that relationship resulted in a chi-square of 9.331 with an associated p-value of 0.0023 and a Fisher’s Exact p-value of 0.0053. This result makes sense, in that it both means and access for access abuse are provided to insiders when a local area network is used.
Additionally, probable relationships were found between insider access abuse and having a computer use and abuse policy (chi-square p-value of 0.0038), concern expressed about insiders (chi-square p-value of 0.0365), and a variety of other experiences. These other experiences include having experienced financial loss due to an information security problem (chi-square p-value of 0.0148), having had employees abuse Internet privileges (chi-square p-value of <0.0001), having had problems with the reliability of information systems (chi-square p-value of <0.0001), having had data get corrupted or partially lost (chi-square p-value of 0.0110), and having had problems with viruses or other malicious software (chi-square p-value of 0.0149).


Chapter Thirteen
Conclusions
This research effort was designed to describe the attitudes and experiences of small businesses with regards to information security. It achieved that goal, but in the process uncovered many more questions. There seems to be only a small influence on behavior exerted by experience—what then is influencing behavior? Is it educational levels, advertising, or other social effects? Further research must be performed to discover the influencing factors.
The results are in some ways at odds with the accepted wisdom. SBA research indicates that fraud is the predominant security concern of small businesses. (SBA E-Commerce 1999) This research shows that fraud was only experienced by 3.8 percent of the respondents and that concern about potential fraud is next to last in an ordered list. Only 35 respondents indicated that fraud was an extreme concern and only 15 indicated it was a high concern. Conversely, 80 indicated it was of no concern and 30 indicated it was of low concern. The only area of concern that was rated lower by the respondents was concern for insider access abuse. Both of these areas rated lower than concern about natural disasters.
The top five information security related concerns of small businesses identified in this research are viruses, data availability, data integrity, transaction integrity, and software problems.
The top five information security related experiences of small businesses are having had data get corrupted or stolen, having had problems with viruses or other malicious software, having had problems with the reliability of information systems, having had employees abuse internet access privileges, and having been the victim of fraud.
For those respondents that reported a financial loss associated with an information security incident, over half quantified the amount. Of those, the mean amount of loss was $19,620.00. The median was $2,750.00. The maximum was $120,000.00 and the minimum was $250.00.
Comparing this research with the previously conducted surveys revealed some similarities and some dissimilarity.
A smaller percentage of small businesses have written security policies than the results indicated in the other surveys, but an equivalent percentage of small businesses have experienced breaches in security.
A higher percentage of small businesses than those businesses previously surveyed are able to characterize financial losses from information security breaches.
Much lower percentages of small businesses have experienced either insiders abusing information system access or outsiders attempting to break in to information systems.

– 160 –
A lower percentage of small businesses consider viruses or data theft to be top level concerns, but a higher percentage of small businesses consider power failure to be a top level concern.
Considering the influence of Internet access revealed few influences. Small businesses with a Web presence or who engage in e-commerce are more likely to have written policies than those who don’t. However, no such distinction is possible based solely on Internet access.
Having Internet access seems to make no difference in experiences, behaviors, or concerns. It is possible that getting access to the Internet is so easy that it is as commonplace as having a telephone, with the associated lack of distinguishability that devolves from that ubiquity.
However, it does seem clear that some difference exists between the subgroups of those with only Internet access, those with a Web presence, and those who engage in e-commerce. These difference may stem from technology literacy levels, educational differences, or some other set of distinctions. Further research is necessary to understand what these distinctions might be.
What does seem clear is that, within the limited scope of this study, size matters. Why this is so is not clear. It may be that the smallest businesses have been in business for a shorter period of time and thus simply haven’t had the opportunity to develop plans and procedures or experience the full range of problem areas that larger small businesses have. Or it could be that the smallest businesses simply operate on a different paradigm than larger businesses. Further research is necessary to understand the influences that may be in play.
Fewer of the smallest of the small grant all full-time employees access to computers and networks than do other size small businesses but more give family or friends access.
Fewer of the smallest of the small have security policies than do larger small businesses. In fact, the larger small businesses are almost twice as likely to have security policies as the smallest of the small.
Size seems not to make a difference in whether a business has a continuity plan, data or media destruction procedures, or a computer emergency response team.
Size does seem to matter in whether a business uses information sensitivity levels or coding or has information security procedures, a computer emergency response plan, or data recovery procedures. The larger small businesses report having these four management tools more often than the smallest of the small.
Size matters in the use of some technologies as well. A higher percentage of larger small businesses indicated use of data segregation, firewalls, intrusion detection systems, system and

– 161 –
facility access controls, redundant systems, system activity monitors, security evaluation systems, shredders, and data backup systems.
For some of the technologies indicated, size played no role. The smallest of the small are equally likely to use anti-virus software, encryption, dial-back modems, media degaussers, and power surge protectors as the larger small businesses. These technology areas represent some of the most popular and the least popular of the fifteen technology choices. For the two of the more popular choices, anti-virus software and power surge protectors, small businesses were equally likely to report using the technology. For three of the less popular choices, encryption, dial-back modems, and media degaussers, the smallest of the small were equally unlikely to report using the technology.
Size plays little role in the view of importance of data. While the smallest of the small tend to generally view data as less important than the larger small businesses, they are equally likely to view all the types of data as of extreme or high importance as the larger small businesses.
The smallest small businesses are less likely in aggregate to have experienced any information security incident in the previous twelve months. Of the thirteen choices, the smallest of the small reported having experienced eight of the choices at lower rates than the larger small businesses. The five areas with no significant differences include fraud, insider access abuse, outsider access abuse, data corruption or loss, and experiencing problems with the reliability of information systems.
The smallest of the small share the same concerns as the larger small businesses. For only three of the fourteen choices was the difference significant. Those three areas include concern over insider access abuse, data integrity, and outsider access abuse. For each of these three areas, a higher percentage of larger small businesses reported these as being of extreme or high concern than did the smallest of the small.
Business area does not seem to matter much in how small businesses approach information security. Respondents in the Services business area reported using power surge protectors at a lower rate than all the others combined. Services businesses are, however, more likely to give full time employees access to computers and networks and are more likely to be concerned about data secrecy. Other than those three areas, small businesses in the Services area are very similar to all other businesses.
There seems to be not much difference between small businesses in Maryland and small businesses elsewhere in the United States in terms of information security, with the exception of one item. Small businesses in Maryland are more likely to have proprietary data use and misuse policies than small businesses elsewhere.
There is, on the whole, little correlation between experiences and policies. This may be explained away based on those who had experiences in previous years adopted policies and

– 162 –
procedures to counteract them in the period of time this study covered. There were some relationships that were identified as being non-independent.
Those respondents that had experienced an information security incident in the previous twelve months were more likely to have one or more of an information security policy, a computer use and misuse policy, or a communications use and misuse policy.
Those that had experienced problems with viruses were more likely to also have an information security policy or a communications use and misuse policy.
Those that had had secret information divulged were more likely to also have a computer use and misuse policy or a communications use and misuse policy.
Those who had experienced fraud were more likely to have an information security policy. Those who had experienced insider access abuse or who had lost money due to an information security incident were more likely to have a computer use and misuse policy.
Concern for viruses was linked to behavior regarding anti-virus software, including both having the software and the frequency of updating it.
Concern for data availability was not linked to any variable except redundant communications. While those expressing a high degree of concern for data availability were more likely to have redundant communications, they were not more likely to have data recovery procedures or data backup systems.
Similarly, no relationship was discovered between concern for data integrity and having data backup systems, cryptography, or firewalls. A relationship was discovered with the use of anti-virus software: those with a high degree of concern for data integrity were found to be more likely to have anti-virus software.
Concern for transaction integrity, however, was found to be related to use of technologies that could assist in assuring transaction integrity, such as anti-virus software, communications encryption, redundant power systems, redundant communications, and power surge protectors.
A relationship was discovered between having experienced insider access abuse and having a local area network: six of the seven reporting insider access abuse also have local area networks. Conversely, those reporting having experienced insider access abuse were less likely to report having experienced financial loss due to an information security incident.
This study presents a lot of data and gives a fairly comprehensive picture of the experiences, practices, and concerns of small businesses regarding information security related issues. However, further research is required to identify and explain why small businesses adopt some management tools but not others, why they use some technologies but not others, and how their experience base affects how they operate.

– 163 –
With the increased level of education regarding all information technology issues and with its increasing ubiquity, the penetration of more powerful information technologies into even the smallest of the small businesses is likely. Performing follow-up research to determine whether security techniques and technologies are keeping pace with that penetration will start to build a data set that can be used to extrapolate trend lines.
It is clear based on this research that the current state of information security practice in small business is fairly spotty. Low percentages of respondents report using even common technologies, with the exception of anti-virus software and password protection on systems. Advertising and other cultural influences may be powerful determinants in this, as may well be the availability and ease of use. Individual backgrounds may also be determinants.
On the other hand, small businesses do not seem to be experiencing problems related to information security at a rate that should cause concern. The targets may be too small to be of interest at this point in time or small businesses may not have the capability to determine or detect if they are being attacked or misused, perhaps as a host for one part of a distributed denial of service attack. This also should be studied further.
In 20-20 hindsight, it would have been useful to have collected information on how small businesses use their computer systems. The findings on levels of concern and use of management and technology tools could be placed into context by being able to partner those elements with data on specific computer uses. For example, if small businesses don’t use their computers to store trade secrets or proprietary data, the level of concern for things like theft of proprietary data or access abuses might be lower.
Based on this, there are several areas of further research that would prove useful to developing a comprehensive understanding of small business behavior with regards to information security related issues.
One such follow up study to develop understanding of computer use within the same target population would provide context to the findings provided in this study. This area of follow-up research should include identifying specific uses for computer systems, such as accounting, product development, research, customer outreach, and service support. It should also identify practices regarding the level of mixing of information types within systems. For example, do small businesses allow each user to store data as that user sees fit, or are segregation rules developed and enforced? This kind of information would give additional level of context to the data contained in this research study on access practices and levels of concern.
Another follow up study would be to repeat this research effort, with the same target population and with other target populations. Trend information could be developed by repeated research efforts, which could prove valuable in understanding evolution of organizational

– 164 –
behavior and perhaps provide insight into the level of understanding regarding information security related issues.
Organizational behavior issues would also be an important area for further research. Developing the understanding of why businesses choose certain technologies but not others, why they use certain management tools but not others, and any relationship to experiences on both a personal and corporate level could provide valuable insight into security related behavior issues. This area of research would benefit from both a case study approach as well as causal relationship examinations.

Bibliography
“Computer Crimes Cost Firms $137 Million,” Electric Light & Power, v76 n5 (May 1998): 16-18.
“E-Theft Costs $2.4 Billion A Year, Report Says,” American Banker, v162 n238 (December 1997): 2-3.
“NetSafe: Information Theft in the Computer Age. Surveying the Scene: Information Theft 1995 to 1997” http://www.ozemail.com.au/~netsafe/95-97.html, accessed 16 November 1999.
“Trendy Goof-ups in Computer Related Crime,” Crypt Newsletter. http://www.soci.niu.edu/~crypt/other/brainded.htm, accessed 16 November 1999.
American Society for Industrial Security/PricewaterhouseCoopers Trends in Proprietary Information Loss Survey Report. http://www.pwcglobal/External/docid/36951F0F6E3C1F9E85267FD006348C5, accessed 27 October 1999.
Anthes, Gary H. “DOD on Red Alert to Fend Off Info Attacks,” Computerworld, v31 n1 (January 1997): 1-2.
———. “Hack Attack: Cyberthieves Siphon Millions From US Firms,” Computerworld, v30 n16 (April 1996): 81-82.
———. “Security Plans Lag Computer Crime Rate,” Computerworld, v29 n45 (November 1995): 20-21.
———. “White House Drives Safety Plan for SuperHighway,” Computerworld, v29 n26 (June 1995): 12-13.
Ascierto, Jerry. “High-Tech Theft Abounds: Study Suggests a $5 Billion Impact in Hardware Theft,” Electronic News (1991), v45 i12 (March 1999): 10-11.
Benjamin, Robert and Rolf Wigand. “Electronic Markets and Virtual Value Chains on the Information Superhighway,” Sloan Management Review, v36 n2 (Winter 1995): 62—73.
Berger, David L. Security for Small Businesses. Woburn, Mass: Butterworth Inc., 1981.
Bruno, Lee. “Cloak and Printer,” Data Communications, 7 July 1999: 14.
Budgets and Products Purchasing Trends. Infosecurity Magazine, July 1999. http://www.infosecuritymag.com/july99/chart2.htm, accessed 23 September 1999.
Chelimsky, Eleanor, Frank C. Jordan, Linda Sue Russell, and John R. Strack. Security and the Small Business Retailer. Washington DC: Government Printing Office, 1979.
Cole, Richard B. “What Trends Are Shaping Security’s Future?” Security Management, v42 n7 (July 1998): 150-152.
Commission on Protecting And Reducing Government Secrecy, Report Of The Commission on Protecting And Reducing Government Secrecy: Senate Document 105-2. Washington, D.C.: United States Government, 1997.

– 166 –
Computer Security Institute. 1999 CSI-FBI Survey Results. http://www.gocsi.com/summary.htm, accessed 44 October 1999.
———. Annual Costs of Computer Crime Rise Alarmingly: Organizations Report $136 Million in Losses. 4 March 1998. http://www.gocsi.com/preleall.htm, accessed 4 October 1999.
———. Cyber Attacks Rise From Outside and Inside Corporations: Dramatic Increase in Reports to Law Enforcement. 5 March 1999. http://www.gocsi.com/prelea990301.htm, accessed 7 July 1999.
———. The Cost of Computer Crime. http://www.gocsi.com/losses.htm, accessed 4 October 1999.
Creative Research Systems. “Survey Design” The Survey System’s Tutorial. Revised July 2000. http://www.surveysystem.com/sdesign.htm, accessed 18 July 2000.
———. Sample Size Calculator 23 February 1999. http://www.surveysystem.com/sscalc.htm, accessed 18 July 2000.
Curtin, Leah and Roy Simpson. “You Want Me To Do What?” Health Management Technology, v20 i9 (October 1999): 30.
Dalton, Gregory. Acceptable Risks. InformationWeek Online, 31 August 1998. http://www.informationweek.com/698/98iursk.htm, accessed 4 October 1999.
Defense Science Board. Report of the Defense Science Board Task Force on Information Warfare -- Defense. Washington, D.C.: United States Government, 1996.
DiDio, Laura. “Special FBI Unit Targets Online Fraud, Gambling,” Computerworld, v32 n17 (April 1998): 47-48.
Doman, Andrew. “IPsec Alert,” Data Communications, 7 October 1999: 13.
Doney, Lloyd D. “The Growing Threat of Computer Crime in Small Businesses,” Business Horizons, v41 n3 (May-June 1998): 81-87.
Ernst & Young LLP. 2nd Annual Global Information Security Survey. Ernst & Young LLP, 1998. http://www.ey.com/security, accessed 4 October 1999.
Gay, Lorraine R. and P.L. Diehl. Research Methods for Business and Management. New York: Macmillan, 1991.
General Accounting Office. Information Security: Computer Attacks at Department of Defense Pose Increasing Risks, GAO/AIMD 96-84. Washington D.C.: United States Government Printing Office, 1996.
Germain, Colin. Actual and Perceived Security Risk. 15 September 1997. http://www.soft.net.uk/cgermain/security.html, accessed 7 July 1999.
Gips, Michael A. “Is Your Web Site a Hacker’s Delight?” Security Management, v43 i8 (August 1999): 64-70.

– 167 –
Gustavon, Ron. Is Year 2000 A Drain on E-Commerce?—Survey. CNNfn digital jam, 28 September 1998. http://www.cnnfn.com/digitaljam/newsbytes/118749.html, accessed 4 October 1999.
Haapaneimi, Peter. “There are Spies—and Hackers—Among Us,” Chief Executive (US), 15 February 1998: 24-27.
Harper, Doug. “Beware of Hackers,” Industrial Distribution, November 1998.
How We Got The Numbers. InformationWeek Online News in Review, 8 September 1997. http://www.iweek.com/647/47iunum.htm, accessed 4 October 1999.
Howard, John Douglas. An Analysis of Security Incident on the Internet 1989—1995. PhD Dissertation, Carnegie Mellon University, 1997.
Information Security Survey Launched. Rediff On The Net, 25 January 1999. http://www.rediff.com/computer/1999/jan/25kpmg.htm, accessed 4 October 1999.
Information Security Survey. KoreaLink InfoTech. 26 February 1999. http://www.dailysports.co.kr/14_5/199902/t4551112.htm, accessed 4 October 1999.
Internet Security Concerns. 2 November 1997. http://multiplex.com/GreensheetIssues/971102-/971102-11.html, accessed 4 October 1999.
Joint Security Commission. Redefining Security: A Report by the Joint Security Commission. Washington, D.C.: United States Government, 1994.
Keogh, James E. The Small Business Security Handbook. Englewood Cliffs, New Jersey: Prentice-Hall, Inc., 1981.
Kerstetter, Jim and John Madden. “Web Attacks Raise Chilling Questions for IT,” Zdnet eWeek, 11 February 2000. http://www.zdnet.com/eweek/stories/general/0,11011,2436607,00.html, accessed 3 August 2000.
KPMG. National Computer Security Survey 1996. http://kpmg.co.uk/uk/services/irm/survey/, accessed 4 October 1999.
Maglitta, Joseph E. “Cyberterrorism is a Serious Threat,” Computerworld, 19 April 1999: 35.
Maldacker, Frank and Stuart A. Varden. Privacy and Ethics Survey Among Computer Professionals. February 1997. http://www.cmsu.edu/englphil/varden.htm, accessed 16 November 1999.
Martin, Shannon Elizabeth. Principles of Federal Information Control in a Technological Age: A Study of Three U.S. Government Actions from 1983 to 1992. PhD Dissertation, The University of North Carolina at Chapel Hill, 1993.
McCollum, Tim. “Computer Crime,” Nation’s Business, v85 n11 (November 1997): 18—26.
Meyers, Jason. “From Rhetoric to Reality: Industry and Government Shape the NII,” Telephony, v228 n23 (June 1995): 7-9.

– 168 –
National Counter-Intelligence Center. Annual Report to Congress on Foreign Collection and Industrial Espionage. 1998. http://www.nacic.gov/fy98.htm, accessed 4 October 1999.
NCC Info: Information Security Breaches Are A Major Threat to British Business, According to NCC’s Latest Survey. 24 March 1998. http://www.ncc.co.uk/nccinfo/biss98.html, accessed 4 October 1999.
NCC Info: NCC Puts Business Continuity First at the Infosecurity 98 Exhibition. 28 April 1998. http://www.ncc.co.uk/nccinfo/infosec.html, accessed 4 October 1999.
Panettieri, Joseph C. Information Security Survey. InformationWeek, 27 November 1995. http://www.hermesgroup.com/whitepapers/security/survey.html, accessed 4 October 1999.
President’s Commission on Critical Infrastructure Protection. Critical Foundations: Thinking Differently. Washington, D.C.: United States Government, 1997.
PricewaterhouseCoopers/InformationWeek Survey Verifies Link Between E-Commerce and Security Risks: Global Information Security Survey Reflects IT Professionals’ Views Worldwide. CMPNet, 31 August 1998. http://www.cmp.com/cmppr/releases/980831.htm, accessed 4 October 1999.
Radcliff, Deborah. “Physical Security: The Danger Within,” InfoWorld, v20 n16 (April 1998): 95-97.
Schafer, Sarah. “On-Line Crime (Part II),” Inc., v18 n8 (June 1996): 123—124.
Securing the E-Business 1999 Survey Results: Infosecurity Magazine Survey. http://194.202.195.4/survey/results_1999.html, accessed 4 October 1999.
Security A Priority. Computer Dealer News (23 July 1999), 22.
Security Overview and Executive Summary. Infosecurity Magazine, July 1999. http://www.infosecuritymag.com/july99/chart1.htm, accessed 4 October 1999.
Small Business Administration. Small Business Administration Frequently Asked Questions. http://www.sba.gov/, accessed 4 October 1999.
———. “Small Business Answer Card” Office of Advocacy Small Business Answer Card. http://www.sba.gov/advo/stats/ec_anscd.html, accessed 5 November 1999.
———. “Small Business: Heart of the Maryland Economy” Small Business State Profile, 1998. http://www.sba.gov/ADVO/stats/profiles/98mid.html, accessed 8 November 1999.
———. “Employer Firms, Establishments, Employment, Annual Payroll, and Estimated Receipts by Firm Size, and State, 1996” Small Business State Profile, 1998. http://www.sba.gov/ADVO/stats/st95_96.pdf, accessed 8 November 1999.
Smith, George. “An Electronic Pearl Harbor? Not Likely,” Issues In Science And Technology Online, Fall 1998. http://205.130.85.236/issues/15.1/smith.htm, accessed 16 November 1999.

– 169 –
Solak, James A. Identification and Validation of Information Processing Competencies Needed by Office Workers with Implications for Curriculum Development. EDD dissertation, University of Pittsburgh, 1998.
The Status of Defense. http://www.sevenlocks.com/security/SCBStatusofDefense.htm, accessed 4 October 1999.
WarRoom Research LLP. Summary of Results for Information Systems Security Survey. 21 November 1996. http://warroomresearch.com/ResearchCollabor/SurveyResults.htm, accessed 4 October 1999.


Glossary
Availability. Ready access to information systems and assets when and to the extent desired. Availability is violated by denial of service, deletion of information, or otherwise limiting the ability of authorized users to access and use information systems or assets.
Business continuity plan. A plan anticipating potential problems and laying out a set of actions for how those problems could be recovered from.
Compusec. See computer security.
Computer security. Practices and technologies that assist in preventing the misuse of computer systems by persons or programs. Also called compusec.
Computer virus. A type of malicious software that is parasitic and self-replicating, which may or may not cause damage.
Confidentiality. Secrecy. Confidentiality is violated by theft, eavesdropping, or otherwise diluting the secrecy element.
Denial of service attack. Actions that result in the loss of availability of information systems or assets to authorized users.
E-business. See e-commerce.
E-commerce. Commercial transactions conducted in part or in whole over communications networks.
Information assurance. The entire range of actions, management tools, technologies, and integrating strategies that assure access to and the ability to exploit useful and useable information.
Information security policy. The vision and goals of the enterprise with regards to information security, the rules that the enterprise will hold themselves accountable for regarding information security, and the authorities and responsibilities of those empowered to enforce the policy statements.
Information security procedures. A list of actions that support the achievement of the information security policy.
Information security. That set of technologies, policies, procedures, and engineering principles that contribute to protecting the confidentiality, integrity, and availability of information systems and assets; detecting attempts to compromise the confidentiality, integrity, or availability of information systems or assets; and recovering from problems with or attacks upon information systems or assets. Also called infosec.
Information technology. That set of technologies which enable the automated handling of information, including computers, communications systems, and software.
Infosec. See information security.
Insider. Any person with some level of assigned trust within an enterprise, including employee, vendor, temporary employee, and contractor.

– 172 –
Integrity. Wholeness of information; assurance that no unauthorized changes have occurred to the information. Integrity is violated by changes, deletions, increased noise, or otherwise diluting the wholeness of the information or transaction.
Interconnectivity. The connection of systems that can operate independently for efficiency or by happenstance.
Internet. A virtual network predicated upon the use of a common set of communications standards and protocols, most notably the Transmission Control Protocol/Internet Protocol (TCP/IP).
Knowledge age. The age where the driving economic factors are knowledge based technologies and services. Contrast to industrial age, where the driving economic factor was mechanization.
National information infrastructure. All existing and planned supporting elements of information technology within the nation, including but not limited to telephone systems, data transfer systems, and information processing systems.
Network security. The application of policies, practices, and technologies to prevent and detect the misuse and abuse of networked information systems by persons or programs.
Outsider. Any person with no valid internal role within an enterprise.
Proprietary data. Data that is owned by someone, real or artificial.
Security breach. A violation of security policy or law.
Small business. A business with less than five hundred employees.
Spam. Unsolicited electronic messages that are sent to large numbers of recipients nearly simultaneously.
Standard Industrial Classification Codes. Four digit standard codes defining areas of business in categories. Used for developing statistics on economic activity. Being replaced by the North American Industry Classification System, the transition to which will be completed in 2001.
Unauthorized access. Using information systems or assets without permission or in violation of access limitations.
Web. See World Wide Web.
World Wide Web. A graphics-oriented Internet application allowing the easy exchange of text and graphics over Internet communications. Also called the Web.

Acronyms
$ K Thousands of dollars $ M Millions of dollars CSI Computer Security Institute DC District of Columbia DISA Defense Information Systems Agency, U.S. Department of Defense DSB Defense Science Board E&Y Ernst & Young LLP FBI Federal Bureau of Investigation GAO U.S. General Accounting Office ISM Information Security Magazine JSC Joint Security Commission NII National Information Infrastructure PCCIP President’s Commission on Critical Infrastructure Protection PWC PricewaterhouseCoopers SBA Small Business Administration SIC Standard Industrial Classification US United States WWW World Wide Web

INCJRYAN INCJRYAN
*ISBN1879716755* ISBN 1-879716-75-5