progress on incorporating climate change into...
TRANSCRIPT

This article was originally published in Climatic Change as: (2008) Anderson, J., F. Chung, M. Anderson, L. Brekke, D. Easton, M. Ejeta, R. Peterson, and R. Snyder, “Progress on Incorporating Climate Change into Management of California’s Water Resources”, Climatic Change, Springer, Netherlands, Volume 89, Supplement 1, March 2008, pg 91-108. Published online 12-22-2007. ISSN: 0165-0009 (Print) 1573-1480 (Online) DOI: 10.1007/s10584-007-9353-1 The original publication can is available at www.springerlink.com. The direct link to the article is http://springerlink.com/content/tk10720k416377j5/.
Progress on Incorporating Climate Change into Management of
California’s Water Resources
Jamie Anderson1, Francis Chung1, Michael Anderson1, Levi Brekke2, Daniel Easton1, Messele Ejeta1, Roy Peterson1, and Richard Snyder3
1California Department of Water Resources, Sacramento, CA 2U.S. Bureau of Reclamation, Technical Service Center, Denver, CO
3Department of Land, Air and Water Resources, University of California, Davis, CA Abstract: This paper presents preliminary efforts by agencies managing California’s water resources to incorporate climate change research into their planning and management tools. Projected increases in air temperature may lead to changes in the precipitation patterns, runoff timing and volume, sea level rise, and changes in the amount of irrigation water needed due to modified evapotranspiration rates. Historical observations of climate change related to California’s water resources are shown. Results from preliminary modeling studies of potential impacts of climate change to operations of the State Water Project and Central Valley Project, Delta water quality and water levels, flood forecasting and evapotranspiration rates are presented. Future directions to incorporate risk assessment are discussed

1
Progress on Incorporating Climate Change into Management of California’s Water Resources Jamie Anderson1, Francis Chung1, Michael Anderson1, Levi Brekke2, Daniel Easton1,
Messele Ejeta1, Roy Peterson1, and Richard Snyder3 1California Department of Water Resources, Sacramento, CA
2U.S. Bureau of Reclamation, Technical Service Center, Denver, CO 3Department of Land, Air and Water Resources, University of California, Davis, CA
Abstract: This paper presents preliminary efforts by agencies managing California’s water resources to incorporate climate change research into their planning and management tools. Projected increases in air temperature may lead to changes in the precipitation patterns, runoff timing and volume, sea level rise, and changes in the amount of irrigation water needed due to modified evapotranspiration rates. Historical observations of climate change related to California’s water resources are shown. Results from preliminary modeling studies of potential impacts of climate change to operations of the State Water Project and Central Valley Project, Delta water quality and water levels, flood forecasting and evapotranspiration rates are presented. Future directions to incorporate risk assessment are discussed.
1 Introduction California water planners are concerned about potential climate change effects on the State’s water resources. Projected increases in air temperature may lead to changes in the timing, amount and form of precipitation - rain or snow, changes in runoff timing and volume, increases in sea level, and changes in the amount of irrigation water needed due to modified evapotranspiration rates. More than 20 million Californians rely on two large water projects: the State Water Project (SWP) and federal Central Valley Project (CVP) (Figure 1). These complex water storage and conveyance systems are operated by the California Department of Water Resources (DWR) and the U.S. Bureau of Reclamation (Reclamation) for water supply, flood management, environmental protection and recreation. On June 1, 2005, Gov. Arnold Schwarzenegger issued Executive Order S-3-05 establishing greenhouse gas emission targets for California and requiring biennial reports on potential climate change effects on several areas, including water resources. In response to that executive order, a DWR-Reclamation work team prepared a technical memorandum report titled “Progress on Incorporating Climate Change into Management of California’s Water Resources” (DWR, 2006a). This paper provides an overview of the efforts documented in that report on integrating climate change into existing water resources planning and management tools and methodologies. This paper presents analysis of historical data for trends related to climate change, and preliminary results from modeling studies of projected climate change conditions. Preliminary climate change impacts analyses focus on a) snowpack, b) runoff, c) operations of the SWP and CVP, d) water quality and water levels in the Sacramento-San Joaquin Delta for both present and future sea level rise conditions, and e) evapotranspiration rates. These analyses represent first steps in incorporating climate change into the planning and management process for the SWP and CVP. Continuing efforts and future directions with an emphasis on moving towards probability/risk assessment are presented at the end of the paper.

2
Figure 1: State Water Project and Central Valley Project with Delta Highlighted
2 Climate Change in California For California, over the past century there have been observed changes in air temperatures, annual precipitation, runoff, and sea levels. It is possible that these changes will be accentuated as the global climate continues to warm. These changes may lead to impacts to California’s water resources and water project operations. An overview of the observed changes in air temperature, precipitation, runoff and sea level is presented here as a reference point for the later discussions of climate change impacts on management of California’s water resources.
3
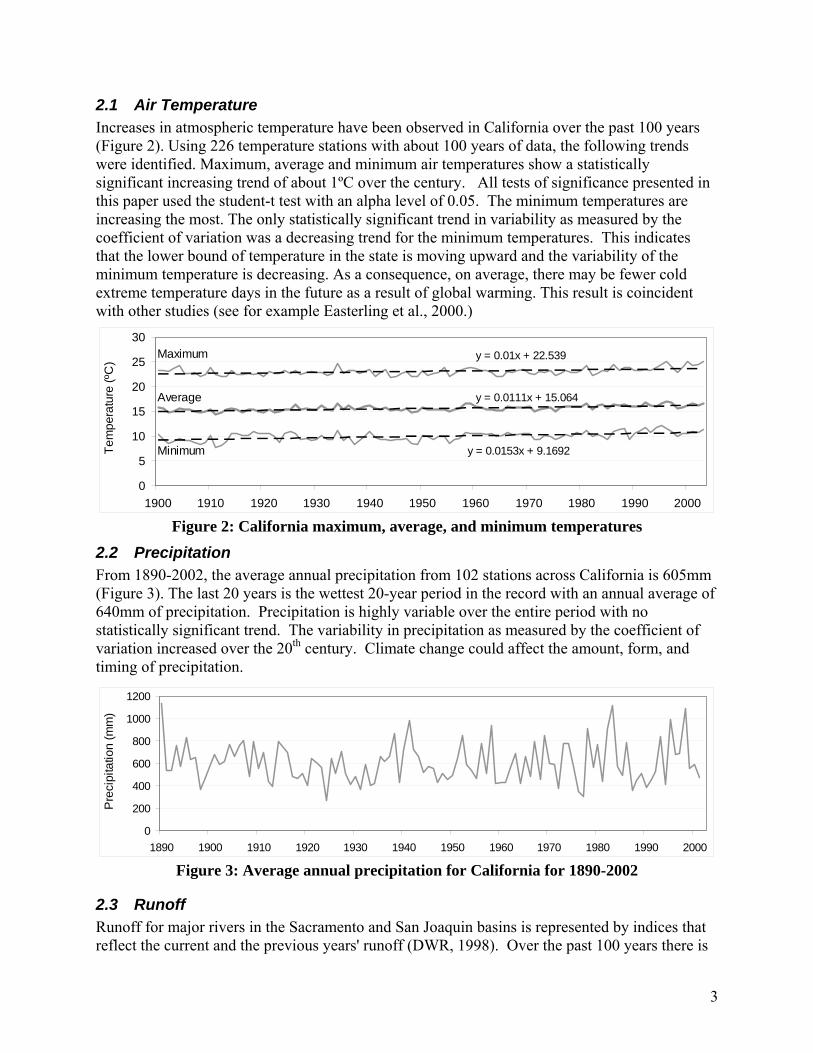
2.1 Air Temperature Increases in atmospheric temperature have been observed in California over the past 100 years (Figure 2). Using 226 temperature stations with about 100 years of data, the following trends were identified. Maximum, average and minimum air temperatures show a statistically significant increasing trend of about 1ºC over the century. All tests of significance presented in this paper used the student-t test with an alpha level of 0.05. The minimum temperatures are increasing the most. The only statistically significant trend in variability as measured by the coefficient of variation was a decreasing trend for the minimum temperatures. This indicates that the lower bound of temperature in the state is moving upward and the variability of the minimum temperature is decreasing. As a consequence, on average, there may be fewer cold extreme temperature days in the future as a result of global warming. This result is coincident with other studies (see for example Easterling et al., 2000.)
y = 0.01x + 22.539
y = 0.0111x + 15.064
y = 0.0153x + 9.1692
0
5
10
15
20
25
30
1900 1910 1920 1930 1940 1950 1960 1970 1980 1990 2000
Tem
pera
ture
(ºC
) Maximum
Minimum
Average
Figure 2: California maximum, average, and minimum temperatures
2.2 Precipitation From 1890-2002, the average annual precipitation from 102 stations across California is 605mm (Figure 3). The last 20 years is the wettest 20-year period in the record with an annual average of 640mm of precipitation. Precipitation is highly variable over the entire period with no statistically significant trend. The variability in precipitation as measured by the coefficient of variation increased over the 20th century. Climate change could affect the amount, form, and timing of precipitation.
0
200
400
600
800
1000
1200
1890 1900 1910 1920 1930 1940 1950 1960 1970 1980 1990 2000
Pre
cipi
tatio
n (m
m)
Figure 3: Average annual precipitation for California for 1890-2002
2.3 Runoff Runoff for major rivers in the Sacramento and San Joaquin basins is represented by indices that reflect the current and the previous years' runoff (DWR, 1998). Over the past 100 years there is
4
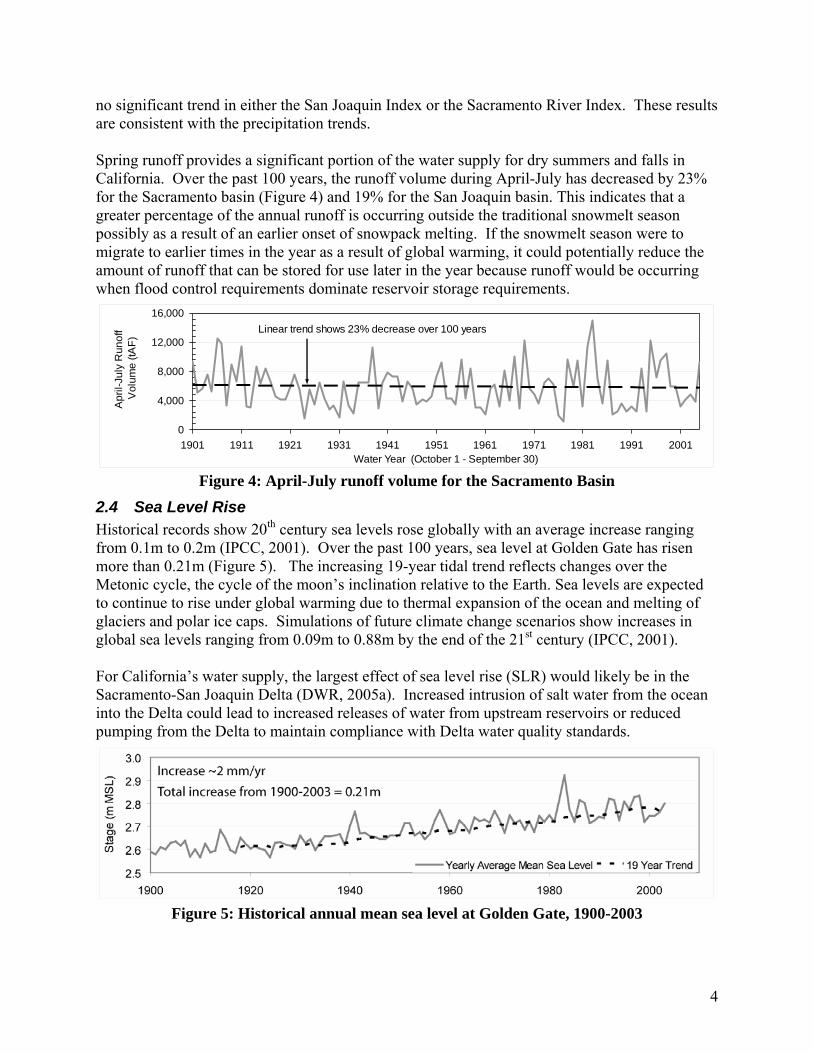
no significant trend in either the San Joaquin Index or the Sacramento River Index. These results are consistent with the precipitation trends. Spring runoff provides a significant portion of the water supply for dry summers and falls in California. Over the past 100 years, the runoff volume during April-July has decreased by 23% for the Sacramento basin (Figure 4) and 19% for the San Joaquin basin. This indicates that a greater percentage of the annual runoff is occurring outside the traditional snowmelt season possibly as a result of an earlier onset of snowpack melting. If the snowmelt season were to migrate to earlier times in the year as a result of global warming, it could potentially reduce the amount of runoff that can be stored for use later in the year because runoff would be occurring when flood control requirements dominate reservoir storage requirements.
0
4,000
8,000
12,000
16,000
1901 1911 1921 1931 1941 1951 1961 1971 1981 1991 2001Water Year (October 1 - September 30)
Apr
il-Ju
ly R
unof
f V
olum
e (tA
F)
Linear trend shows 23% decrease over 100 years
Figure 4: April-July runoff volume for the Sacramento Basin
2.4 Sea Level Rise Historical records show 20th century sea levels rose globally with an average increase ranging from 0.1m to 0.2m (IPCC, 2001). Over the past 100 years, sea level at Golden Gate has risen more than 0.21m (Figure 5). The increasing 19-year tidal trend reflects changes over the Metonic cycle, the cycle of the moon’s inclination relative to the Earth. Sea levels are expected to continue to rise under global warming due to thermal expansion of the ocean and melting of glaciers and polar ice caps. Simulations of future climate change scenarios show increases in global sea levels ranging from 0.09m to 0.88m by the end of the 21st century (IPCC, 2001). For California’s water supply, the largest effect of sea level rise (SLR) would likely be in the Sacramento-San Joaquin Delta (DWR, 2005a). Increased intrusion of salt water from the ocean into the Delta could lead to increased releases of water from upstream reservoirs or reduced pumping from the Delta to maintain compliance with Delta water quality standards.
Figure 5: Historical annual mean sea level at Golden Gate, 1900-2003

5
3 Approach 3.1 Climate Change Scenarios Preliminary impacts assessments were conducted on four climate change scenarios that represent two green house gas emissions scenarios (A2 and B1 from the Intergovernmental Panel on Climate Change’s Fourth Assessment, IPCC4 ) simulated by two different Global Climate Models (GFDL and PCM) (Cayan et al., 2006). All four scenarios project increases in air temperature. The PCM B1 scenario showed a slight increase in precipitation, while all other scenarios projected decreases in precipitation. No probabilities of occurrence have been associated with these scenarios, thus potential impacts to water resources are shown relative to one another, but no likelihoods are associated with these impacts. Due to space limitations in this paper, results will be shown for the scenarios with the most and least warming, GFDL A2 and PCM B1 respectively. See DWR (2006a) for analysis of all scenarios.
3.2 Modeling Approach To examine the potential impacts of the climate change scenarios on California’s water resources, a sequence of models were used to translate global scenarios to regional and local impacts (Figure 6).
Figure 6: Approach for Analyzing Potential Water Resources Impacts of Climate Change
3.2.1 Global Scale Modeling Global Climate Models (GCMs) provided global scale results including projections for air temperature and precipitation. The GCM results are archived at the Lawrence Livermore National Laboratory’s Program for Climate Model Diagnosis and Intercomparison (PCMDI). Various input data, including rainfall and snowmelt runoff, used in modeling regional water projects, such as the SWP and the CVP, are represented at the local level. Thus, it is necessary to establish the appropriate links between GCM global scale meteorological output data and local scale model input data (Figure 6). Projected data centered around 2050 (2035-2064) were compared to GCM representations of historical conditions centered around 1976 (1961-1990) (Table 1).
6
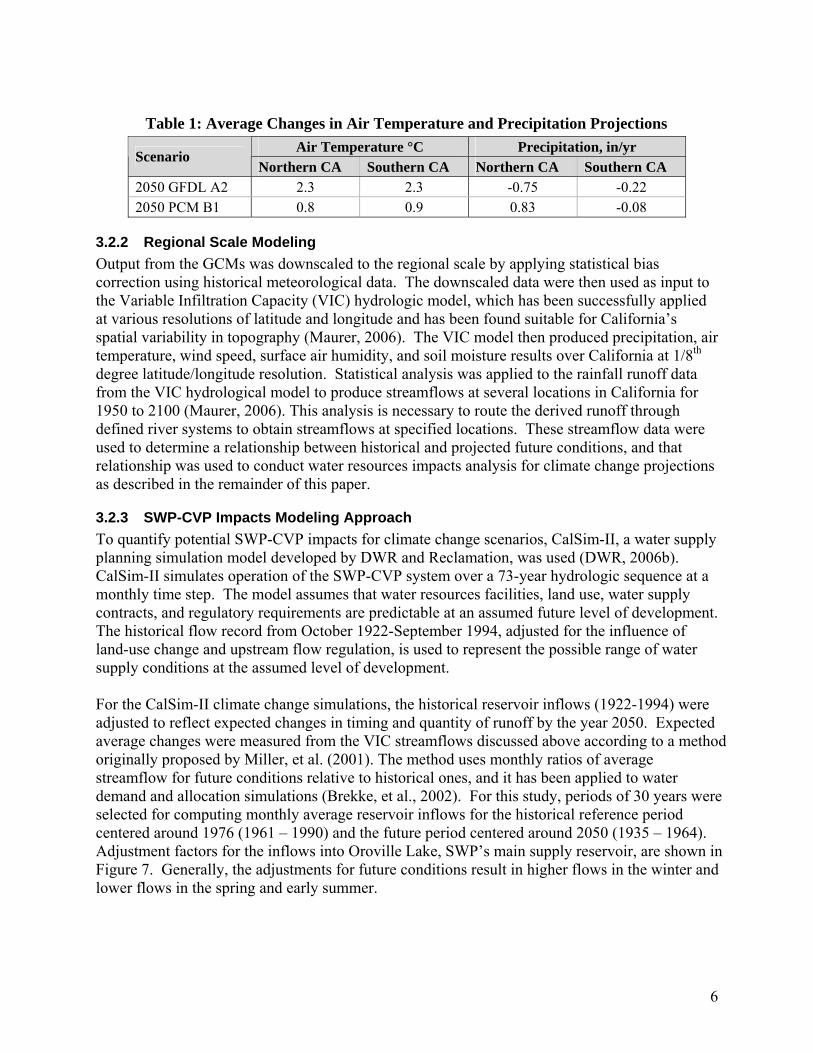
Table 1: Average Changes in Air Temperature and Precipitation Projections
Air Temperature °C Precipitation, in/yr Scenario
Northern CA Southern CA Northern CA Southern CA 2050 GFDL A2 2.3 2.3 -0.75 -0.22 2050 PCM B1 0.8 0.9 0.83 -0.08
3.2.2 Regional Scale Modeling Output from the GCMs was downscaled to the regional scale by applying statistical bias correction using historical meteorological data. The downscaled data were then used as input to the Variable Infiltration Capacity (VIC) hydrologic model, which has been successfully applied at various resolutions of latitude and longitude and has been found suitable for California’s spatial variability in topography (Maurer, 2006). The VIC model then produced precipitation, air temperature, wind speed, surface air humidity, and soil moisture results over California at 1/8th degree latitude/longitude resolution. Statistical analysis was applied to the rainfall runoff data from the VIC hydrological model to produce streamflows at several locations in California for 1950 to 2100 (Maurer, 2006). This analysis is necessary to route the derived runoff through defined river systems to obtain streamflows at specified locations. These streamflow data were used to determine a relationship between historical and projected future conditions, and that relationship was used to conduct water resources impacts analysis for climate change projections as described in the remainder of this paper.
3.2.3 SWP-CVP Impacts Modeling Approach To quantify potential SWP-CVP impacts for climate change scenarios, CalSim-II, a water supply planning simulation model developed by DWR and Reclamation, was used (DWR, 2006b). CalSim-II simulates operation of the SWP-CVP system over a 73-year hydrologic sequence at a monthly time step. The model assumes that water resources facilities, land use, water supply contracts, and regulatory requirements are predictable at an assumed future level of development. The historical flow record from October 1922-September 1994, adjusted for the influence of land-use change and upstream flow regulation, is used to represent the possible range of water supply conditions at the assumed level of development. For the CalSim-II climate change simulations, the historical reservoir inflows (1922-1994) were adjusted to reflect expected changes in timing and quantity of runoff by the year 2050. Expected average changes were measured from the VIC streamflows discussed above according to a method originally proposed by Miller, et al. (2001). The method uses monthly ratios of average streamflow for future conditions relative to historical ones, and it has been applied to water demand and allocation simulations (Brekke, et al., 2002). For this study, periods of 30 years were selected for computing monthly average reservoir inflows for the historical reference period centered around 1976 (1961 – 1990) and the future period centered around 2050 (1935 – 1964). Adjustment factors for the inflows into Oroville Lake, SWP’s main supply reservoir, are shown in Figure 7. Generally, the adjustments for future conditions result in higher flows in the winter and lower flows in the spring and early summer.

7
-50%-40%-30%-20%-10%
0%10%20%30%40%50%
OCT NOV DEC JAN FEB MAR APR MAY JUN JUL AUG SEP
Mon
thly
Inflo
w A
djus
tmen
ts (%
)
GFDL A2 PCM B1 Figure 7: Change in average monthly inflow to Oroville Reservoir for 2050 projections
Several assumptions were made for the climate change simulations. In the climate change and base simulations, a 2020 level of development – the highest available for CalSim-II at the time of analysis – was assumed. The 2020 level of development does not take into account any impact climate change may have on water demands. Current management practices and existing facilities were incorporated in all simulations. While project operations responded to changed inflows during simulation, rules of operation were not changed to mitigate the impacts. Lastly, impacts of sea level rise on project operations were not considered.
3.2.4 Delta Impacts Modeling Approach The Delta Simulation Model 2 (DSM2) was used to examine how changes in SWP and CVP operations would affect flow rates, water levels and water quality in the Sacramento-San Joaquin Delta (Figure 1). The CalSim-II results provide Delta inflows and exports resulting from operation of the SWP and CVP for 2050 projected changes in reservoir inflows. Thus the results for the Delta reflect adjustments in reservoir operations and exports for climate change. Due to increased computational requirements, the Delta studies use a 16-year analysis period (Oct 1976 to Sept 1991) that is a subset of the CalSim-II results that contains a range of wet and dry conditions that reflects the hydrologic variability of the system. Although DSM2 simulations were run for both present sea level and projected 0.3m sea level rise scenarios, Delta inflows and exports provided by CalSim-II do not account for sea level rise.
4 SWP-CVP Impacts Using current management practices and existing system facilities, shifts in precipitation and runoff will directly affect deliveries and reservoir storage levels for the SWP and CVP. Analysis of the climate change CalSim-II simulations is provided below.
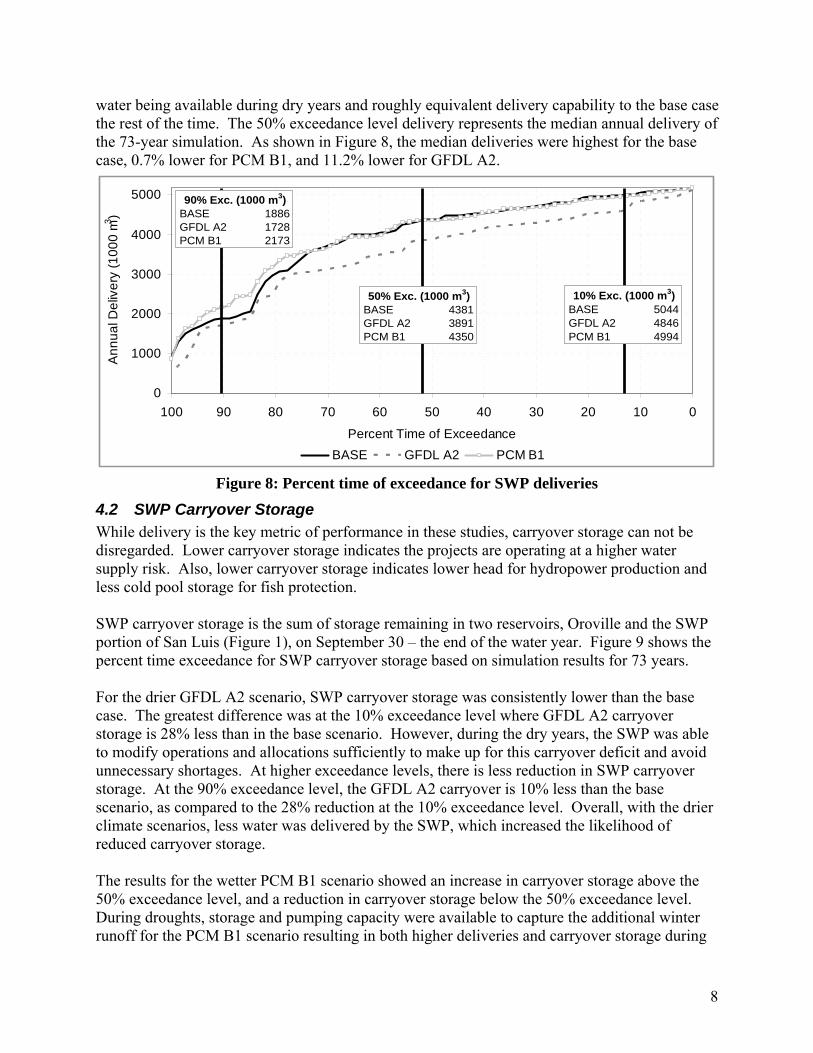
4.1 SWP Deliveries Annual water deliveries in the base and climate change CalSim-II simulations were compared to assess impacts on the SWP and CVP. Annual delivery percent time exceedance curves were assembled from the 73-year annual values. Figure 8 shows the percent time exceedance curves for annual SWP deliveries. The drier climate and significant shift in seasonal runoff for the GFDL A2 scenario resulted in consistently lower delivery capability. The slightly wetter climate and slight reduction in runoff in the late spring and summer for the PCM B1 scenario resulted in higher delivery capability for the SWP at the lower end of the delivery spectrum due to more
8
water being available during dry years and roughly equivalent delivery capability to the base case the rest of the time. The 50% exceedance level delivery represents the median annual delivery of the 73-year simulation. As shown in Figure 8, the median deliveries were highest for the base case, 0.7% lower for PCM B1, and 11.2% lower for GFDL A2.
0
1000
2000
3000
4000
5000
0102030405060708090100
Percent Time of Exceedance
Ann
ual D
eliv
ery
(100
0 m3 )
BASE GFDL A2 PCM B1
BASE 4381GFDL A2 3891PCM B1 4350
50% Exc. (1000 m3)BASE 5044GFDL A2 4846PCM B1 4994
10% Exc. (1000 m3)
BASE 1886GFDL A2 1728PCM B1 2173
90% Exc. (1000 m3)
Figure 8: Percent time of exceedance for SWP deliveries
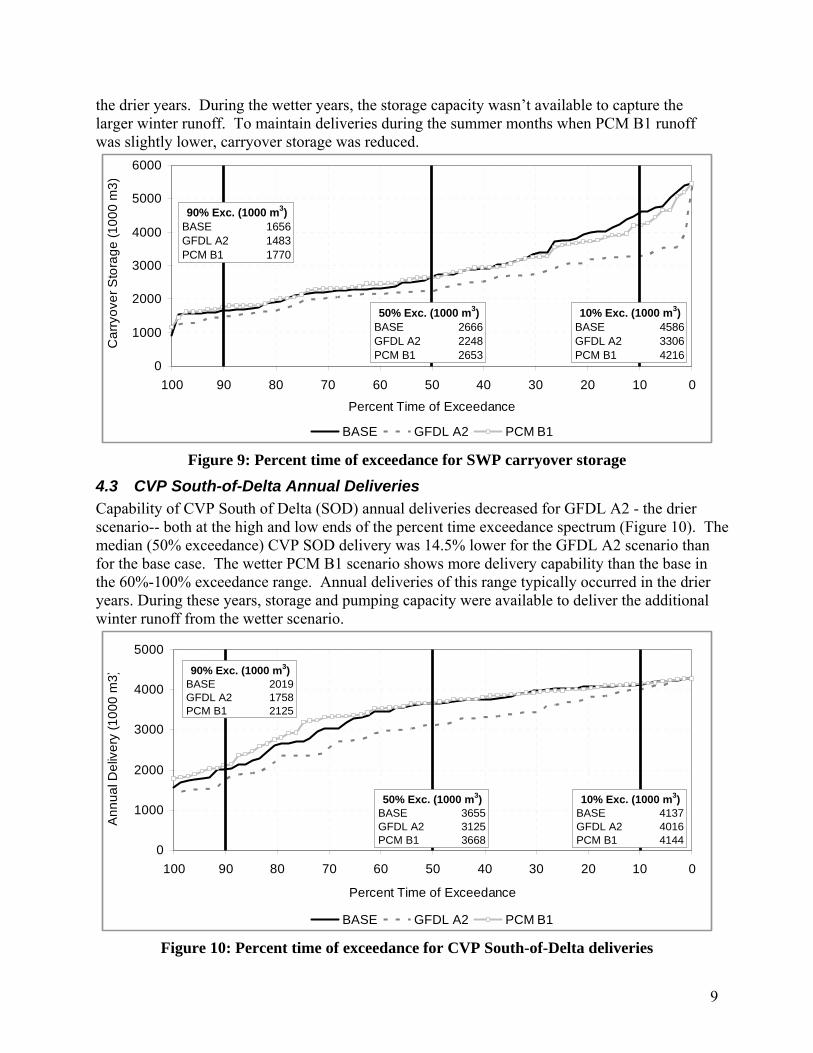
4.2 SWP Carryover Storage While delivery is the key metric of performance in these studies, carryover storage can not be disregarded. Lower carryover storage indicates the projects are operating at a higher water supply risk. Also, lower carryover storage indicates lower head for hydropower production and less cold pool storage for fish protection. SWP carryover storage is the sum of storage remaining in two reservoirs, Oroville and the SWP portion of San Luis (Figure 1), on September 30 – the end of the water year. Figure 9 shows the percent time exceedance for SWP carryover storage based on simulation results for 73 years. For the drier GFDL A2 scenario, SWP carryover storage was consistently lower than the base case. The greatest difference was at the 10% exceedance level where GFDL A2 carryover storage is 28% less than in the base scenario. However, during the dry years, the SWP was able to modify operations and allocations sufficiently to make up for this carryover deficit and avoid unnecessary shortages. At higher exceedance levels, there is less reduction in SWP carryover storage. At the 90% exceedance level, the GFDL A2 carryover is 10% less than the base scenario, as compared to the 28% reduction at the 10% exceedance level. Overall, with the drier climate scenarios, less water was delivered by the SWP, which increased the likelihood of reduced carryover storage. The results for the wetter PCM B1 scenario showed an increase in carryover storage above the 50% exceedance level, and a reduction in carryover storage below the 50% exceedance level. During droughts, storage and pumping capacity were available to capture the additional winter runoff for the PCM B1 scenario resulting in both higher deliveries and carryover storage during
9
the drier years. During the wetter years, the storage capacity wasn’t available to capture the larger winter runoff. To maintain deliveries during the summer months when PCM B1 runoff was slightly lower, carryover storage was reduced.
0
1000
2000
3000
4000
5000
6000
0102030405060708090100
Percent Time of Exceedance
Car
ryov
er S
tora
ge (1
000
m3)
BASE GFDL A2 PCM B1
BASE 2666GFDL A2 2248PCM B1 2653
50% Exc. (1000 m3)BASE 4586GFDL A2 3306PCM B1 4216
10% Exc. (1000 m3)
BASE 1656GFDL A2 1483PCM B1 1770
90% Exc. (1000 m3)
Figure 9: Percent time of exceedance for SWP carryover storage
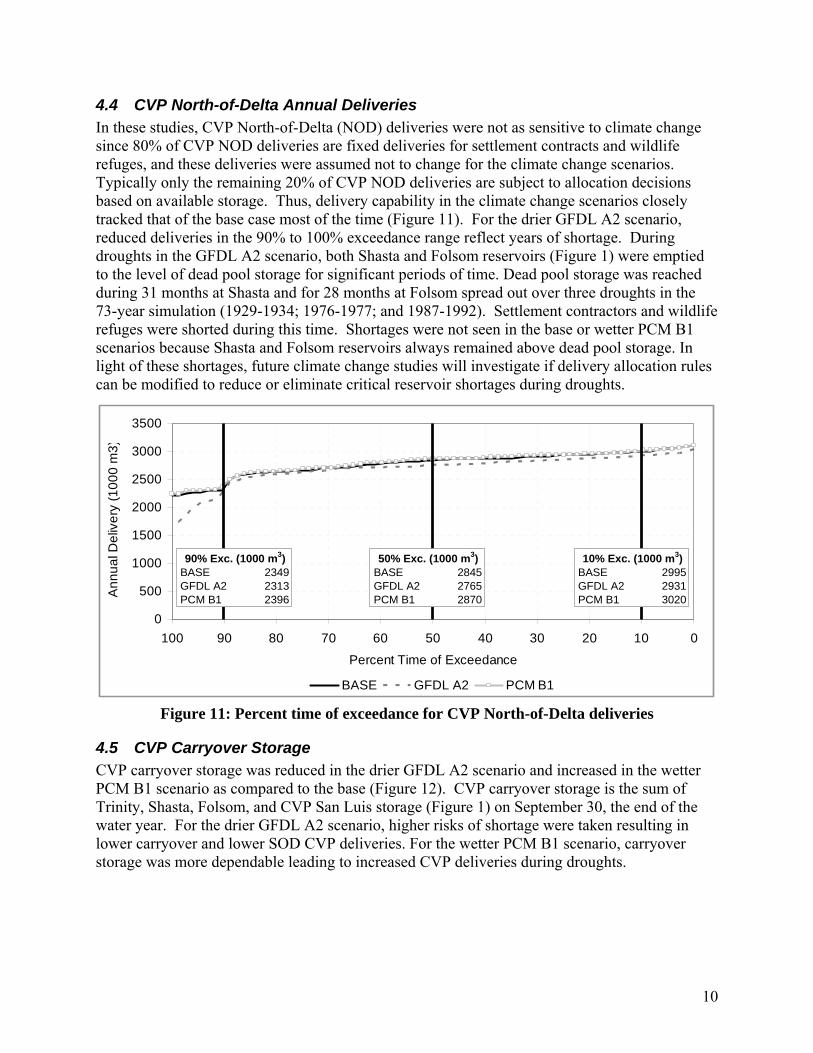
4.3 CVP South-of-Delta Annual Deliveries Capability of CVP South of Delta (SOD) annual deliveries decreased for GFDL A2 - the drier scenario-- both at the high and low ends of the percent time exceedance spectrum (Figure 10). The median (50% exceedance) CVP SOD delivery was 14.5% lower for the GFDL A2 scenario than for the base case. The wetter PCM B1 scenario shows more delivery capability than the base in the 60%-100% exceedance range. Annual deliveries of this range typically occurred in the drier years. During these years, storage and pumping capacity were available to deliver the additional winter runoff from the wetter scenario.
0
1000
2000
3000
4000
5000
0102030405060708090100
Percent Time of Exceedance
Ann
ual D
eliv
ery
(100
0 m
3)
BASE GFDL A2 PCM B1
BASE 3655GFDL A2 3125PCM B1 3668
50% Exc. (1000 m3)BASE 4137GFDL A2 4016PCM B1 4144
10% Exc. (1000 m3)
BASE 2019GFDL A2 1758PCM B1 2125
90% Exc. (1000 m3)
Figure 10: Percent time of exceedance for CVP South-of-Delta deliveries
10
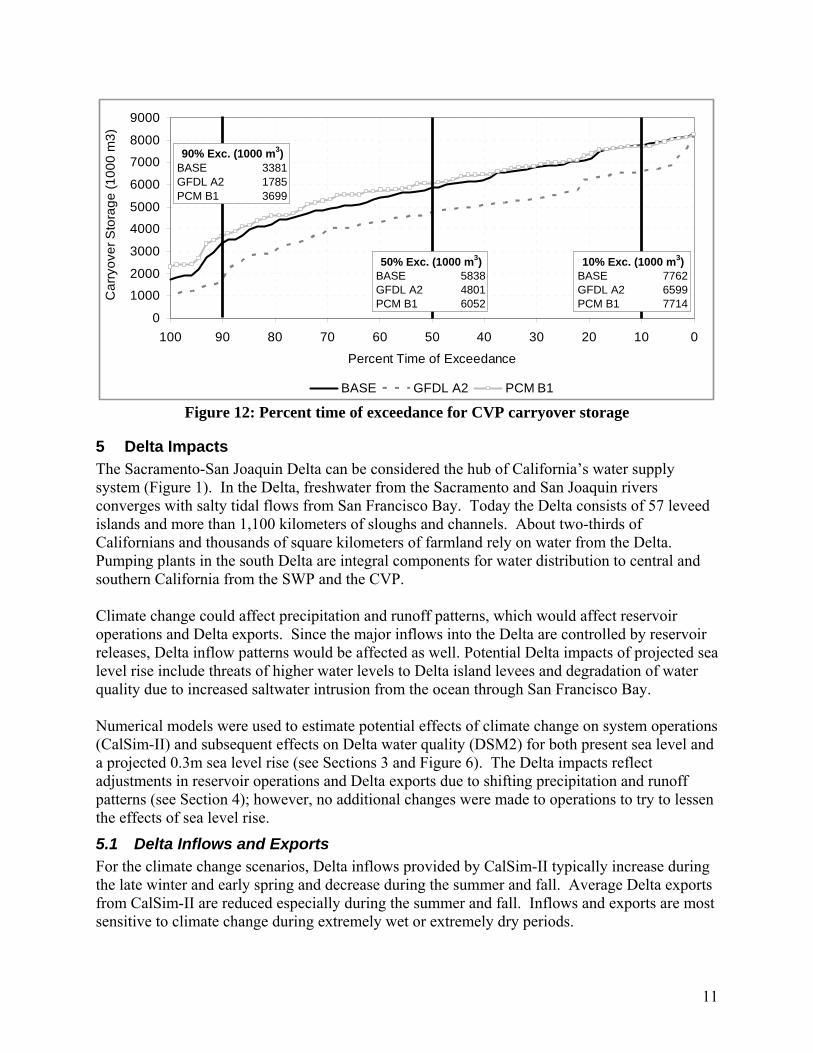
4.4 CVP North-of-Delta Annual Deliveries In these studies, CVP North-of-Delta (NOD) deliveries were not as sensitive to climate change since 80% of CVP NOD deliveries are fixed deliveries for settlement contracts and wildlife refuges, and these deliveries were assumed not to change for the climate change scenarios. Typically only the remaining 20% of CVP NOD deliveries are subject to allocation decisions based on available storage. Thus, delivery capability in the climate change scenarios closely tracked that of the base case most of the time (Figure 11). For the drier GFDL A2 scenario, reduced deliveries in the 90% to 100% exceedance range reflect years of shortage. During droughts in the GFDL A2 scenario, both Shasta and Folsom reservoirs (Figure 1) were emptied to the level of dead pool storage for significant periods of time. Dead pool storage was reached during 31 months at Shasta and for 28 months at Folsom spread out over three droughts in the 73-year simulation (1929-1934; 1976-1977; and 1987-1992). Settlement contractors and wildlife refuges were shorted during this time. Shortages were not seen in the base or wetter PCM B1 scenarios because Shasta and Folsom reservoirs always remained above dead pool storage. In light of these shortages, future climate change studies will investigate if delivery allocation rules can be modified to reduce or eliminate critical reservoir shortages during droughts.
0
500
1000
1500
2000
2500
3000
3500
0102030405060708090100
Percent Time of Exceedance
Ann
ual D
eliv
ery
(100
0 m
3)
BASE GFDL A2 PCM B1
BASE 2845GFDL A2 2765PCM B1 2870
50% Exc. (1000 m3)BASE 2995GFDL A2 2931PCM B1 3020
10% Exc. (1000 m3)BASE 2349GFDL A2 2313PCM B1 2396
90% Exc. (1000 m3)
Figure 11: Percent time of exceedance for CVP North-of-Delta deliveries
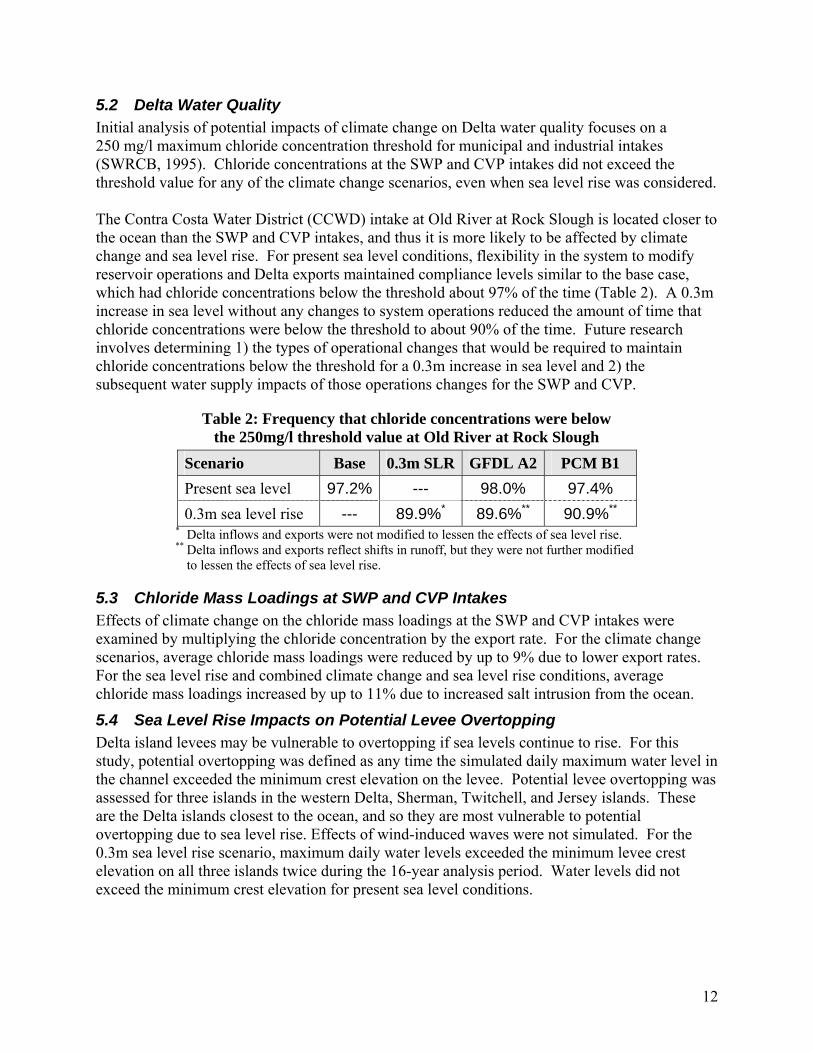
4.5 CVP Carryover Storage CVP carryover storage was reduced in the drier GFDL A2 scenario and increased in the wetter PCM B1 scenario as compared to the base (Figure 12). CVP carryover storage is the sum of Trinity, Shasta, Folsom, and CVP San Luis storage (Figure 1) on September 30, the end of the water year. For the drier GFDL A2 scenario, higher risks of shortage were taken resulting in lower carryover and lower SOD CVP deliveries. For the wetter PCM B1 scenario, carryover storage was more dependable leading to increased CVP deliveries during droughts.
11
0
1000
2000
3000
4000
5000
6000
7000
8000
9000
0102030405060708090100
Percent Time of Exceedance
Car
ryov
er S
tora
ge (1
000
m3)
BASE GFDL A2 PCM B1
BASE 5838GFDL A2 4801PCM B1 6052
50% Exc. (1000 m3)BASE 7762GFDL A2 6599PCM B1 7714
10% Exc. (1000 m3)
BASE 3381GFDL A2 1785PCM B1 3699
90% Exc. (1000 m3)
Figure 12: Percent time of exceedance for CVP carryover storage
5 Delta Impacts The Sacramento-San Joaquin Delta can be considered the hub of California’s water supply system (Figure 1). In the Delta, freshwater from the Sacramento and San Joaquin rivers converges with salty tidal flows from San Francisco Bay. Today the Delta consists of 57 leveed islands and more than 1,100 kilometers of sloughs and channels. About two-thirds of Californians and thousands of square kilometers of farmland rely on water from the Delta. Pumping plants in the south Delta are integral components for water distribution to central and southern California from the SWP and the CVP. Climate change could affect precipitation and runoff patterns, which would affect reservoir operations and Delta exports. Since the major inflows into the Delta are controlled by reservoir releases, Delta inflow patterns would be affected as well. Potential Delta impacts of projected sea level rise include threats of higher water levels to Delta island levees and degradation of water quality due to increased saltwater intrusion from the ocean through San Francisco Bay. Numerical models were used to estimate potential effects of climate change on system operations (CalSim-II) and subsequent effects on Delta water quality (DSM2) for both present sea level and a projected 0.3m sea level rise (see Sections 3 and Figure 6). The Delta impacts reflect adjustments in reservoir operations and Delta exports due to shifting precipitation and runoff patterns (see Section 4); however, no additional changes were made to operations to try to lessen the effects of sea level rise.
5.1 Delta Inflows and Exports For the climate change scenarios, Delta inflows provided by CalSim-II typically increase during the late winter and early spring and decrease during the summer and fall. Average Delta exports from CalSim-II are reduced especially during the summer and fall. Inflows and exports are most sensitive to climate change during extremely wet or extremely dry periods.
12
5.2 Delta Water Quality Initial analysis of potential impacts of climate change on Delta water quality focuses on a 250 mg/l maximum chloride concentration threshold for municipal and industrial intakes (SWRCB, 1995). Chloride concentrations at the SWP and CVP intakes did not exceed the threshold value for any of the climate change scenarios, even when sea level rise was considered. The Contra Costa Water District (CCWD) intake at Old River at Rock Slough is located closer to the ocean than the SWP and CVP intakes, and thus it is more likely to be affected by climate change and sea level rise. For present sea level conditions, flexibility in the system to modify reservoir operations and Delta exports maintained compliance levels similar to the base case, which had chloride concentrations below the threshold about 97% of the time (Table 2). A 0.3m increase in sea level without any changes to system operations reduced the amount of time that chloride concentrations were below the threshold to about 90% of the time. Future research involves determining 1) the types of operational changes that would be required to maintain chloride concentrations below the threshold for a 0.3m increase in sea level and 2) the subsequent water supply impacts of those operations changes for the SWP and CVP.
Table 2: Frequency that chloride concentrations were below the 250mg/l threshold value at Old River at Rock Slough
Scenario Base 0.3m SLR GFDL A2 PCM B1 Present sea level 97.2% --- 98.0% 97.4% 0.3m sea level rise --- 89.9%* 89.6%** 90.9%**
* Delta inflows and exports were not modified to lessen the effects of sea level rise. ** Delta inflows and exports reflect shifts in runoff, but they were not further modified
to lessen the effects of sea level rise.
5.3 Chloride Mass Loadings at SWP and CVP Intakes Effects of climate change on the chloride mass loadings at the SWP and CVP intakes were examined by multiplying the chloride concentration by the export rate. For the climate change scenarios, average chloride mass loadings were reduced by up to 9% due to lower export rates. For the sea level rise and combined climate change and sea level rise conditions, average chloride mass loadings increased by up to 11% due to increased salt intrusion from the ocean.
5.4 Sea Level Rise Impacts on Potential Levee Overtopping Delta island levees may be vulnerable to overtopping if sea levels continue to rise. For this study, potential overtopping was defined as any time the simulated daily maximum water level in the channel exceeded the minimum crest elevation on the levee. Potential levee overtopping was assessed for three islands in the western Delta, Sherman, Twitchell, and Jersey islands. These are the Delta islands closest to the ocean, and so they are most vulnerable to potential overtopping due to sea level rise. Effects of wind-induced waves were not simulated. For the 0.3m sea level rise scenario, maximum daily water levels exceeded the minimum levee crest elevation on all three islands twice during the 16-year analysis period. Water levels did not exceed the minimum crest elevation for present sea level conditions.
13
6 Flood Forecasting Consideration of climate change in flood forecasting presents many challenges. While climate change refers to long-term averages in variables such as air temperature and precipitation, flooding results from individual weather events. From year to year, there is large variability in winter rainfall and associated runoff patterns. This large variability creates uncertainty when evaluating changes in weather events due to climate change. Since GCM results relate to long-term climate properties and not to short term-weather patterns, results cannot be used directly to evaluate changes in specific rainfall and runoff patterns leading to floods or to changes in frequency of floods or droughts. However, climate model simulation data can be used to compare simulated future and historical trends in air temperature, precipitation and runoff. The model-derived trends also can be used to guide extrapolation of historical trends. Watershed models can then be used to estimate changes in runoff. Such analyses are just a starting point for evaluating climate change impacts on water supply or flood forecasting in California.
Increasing atmospheric temperatures due to climate change could impact both water supply and flood control operations in California. Higher atmospheric temperatures leading to higher snow lines will cause increased direct runoff after storms. The reduced snowpack will lead to less spring runoff from snowmelt. Both types of runoff changes are explored here. Other studies on this topic are highlighted in a special issue of Climatic Change (Vol. 62, 2004).
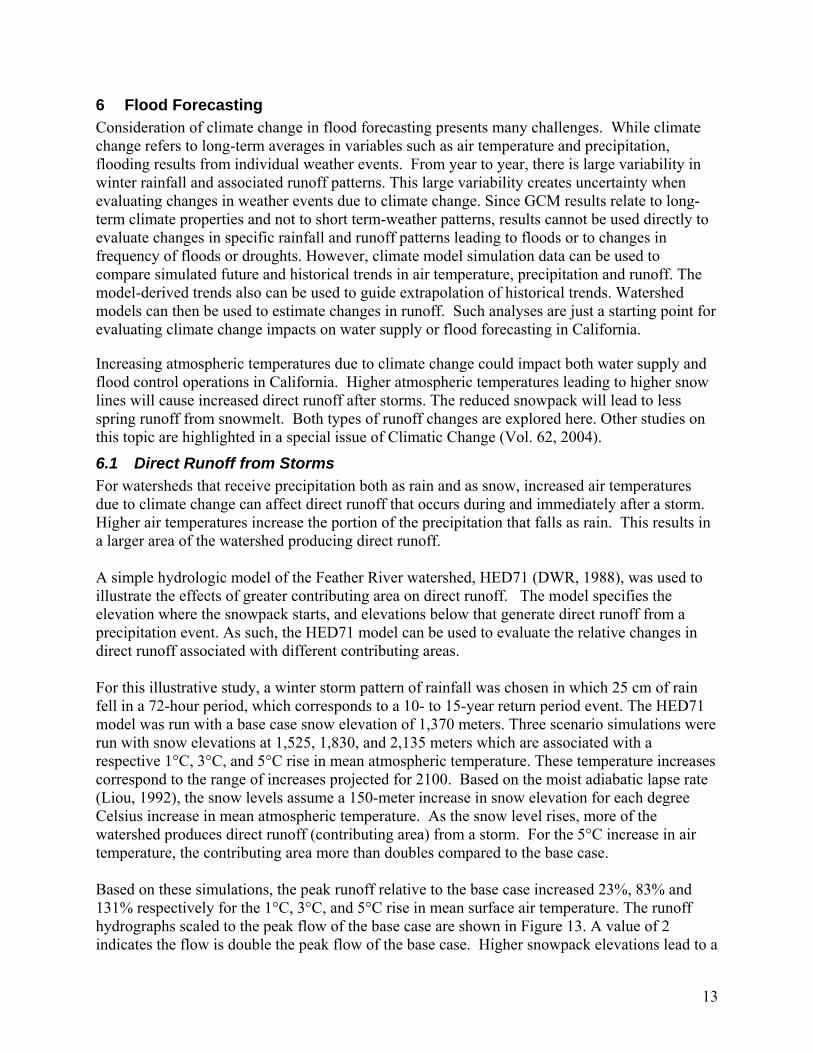
6.1 Direct Runoff from Storms For watersheds that receive precipitation both as rain and as snow, increased air temperatures due to climate change can affect direct runoff that occurs during and immediately after a storm. Higher air temperatures increase the portion of the precipitation that falls as rain. This results in a larger area of the watershed producing direct runoff. A simple hydrologic model of the Feather River watershed, HED71 (DWR, 1988), was used to illustrate the effects of greater contributing area on direct runoff. The model specifies the elevation where the snowpack starts, and elevations below that generate direct runoff from a precipitation event. As such, the HED71 model can be used to evaluate the relative changes in direct runoff associated with different contributing areas. For this illustrative study, a winter storm pattern of rainfall was chosen in which 25 cm of rain fell in a 72-hour period, which corresponds to a 10- to 15-year return period event. The HED71 model was run with a base case snow elevation of 1,370 meters. Three scenario simulations were run with snow elevations at 1,525, 1,830, and 2,135 meters which are associated with a respective 1°C, 3°C, and 5°C rise in mean atmospheric temperature. These temperature increases correspond to the range of increases projected for 2100. Based on the moist adiabatic lapse rate (Liou, 1992), the snow levels assume a 150-meter increase in snow elevation for each degree Celsius increase in mean atmospheric temperature. As the snow level rises, more of the watershed produces direct runoff (contributing area) from a storm. For the 5°C increase in air temperature, the contributing area more than doubles compared to the base case. Based on these simulations, the peak runoff relative to the base case increased 23%, 83% and 131% respectively for the 1°C, 3°C, and 5°C rise in mean surface air temperature. The runoff hydrographs scaled to the peak flow of the base case are shown in Figure 13. A value of 2 indicates the flow is double the peak flow of the base case. Higher snowpack elevations lead to a
14
significant increase in direct runoff volume due to the increased contributing area of the watershed. Over time, the higher peak flows due to increased runoff would lead to changes in the return periods flood peaks which would change flood risk estimates. This example is for the Feather River Basin. Because each watershed has its own area-elevation curve, the runoff volume impact will vary by watershed. Lower elevation watersheds such as those found in the Sacramento River Basin will show a larger snowpack/runoff response to increased air temperatures than higher elevation watersheds such as those found in the upper reaches of the San Joaquin Basin.
0.0
0.5
1.0
1.5
2.0
2.5
0 6 12 18 24 30 36 42 48 54 60 66 72 78 84 90 96 102 108 114 120 126 132 138 144
Hours after Start of Storm
Run
off S
cale
d to
Pea
kR
unof
f of B
ase
Cas
e Base Case +1°C+3°C +5°C
Figure 13: Change in direct runoff due to increasing contributing area of watershed
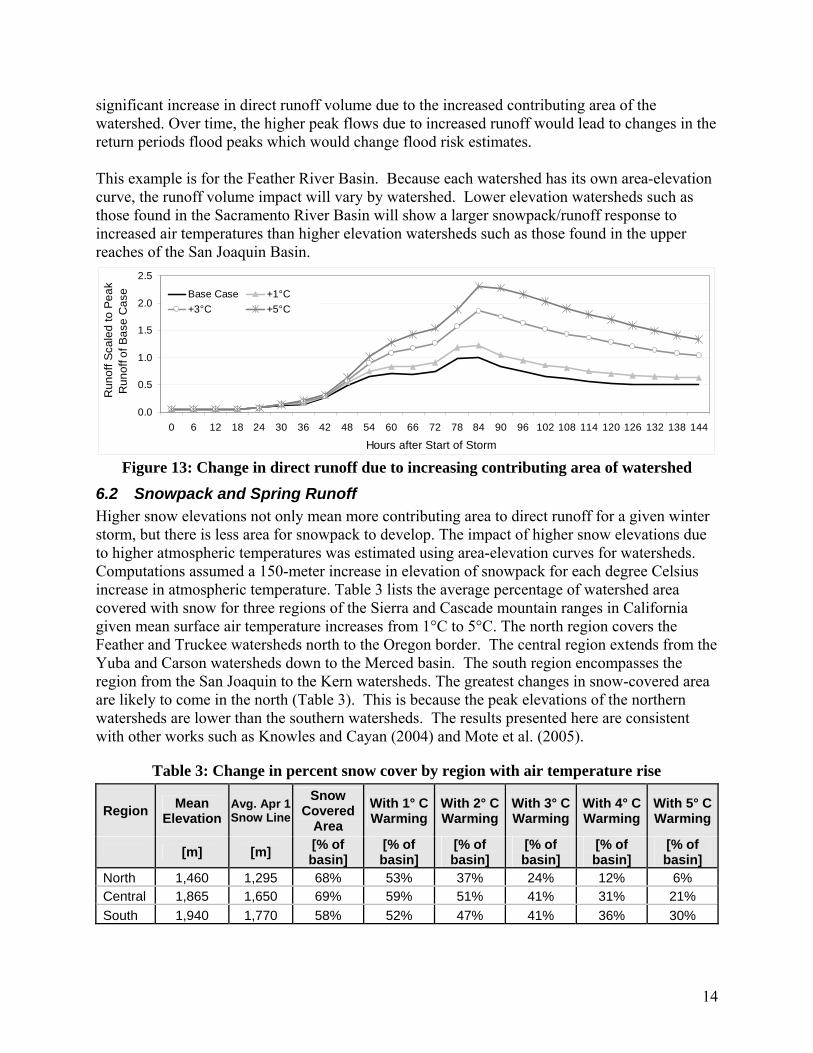
6.2 Snowpack and Spring Runoff Higher snow elevations not only mean more contributing area to direct runoff for a given winter storm, but there is less area for snowpack to develop. The impact of higher snow elevations due to higher atmospheric temperatures was estimated using area-elevation curves for watersheds. Computations assumed a 150-meter increase in elevation of snowpack for each degree Celsius increase in atmospheric temperature. Table 3 lists the average percentage of watershed area covered with snow for three regions of the Sierra and Cascade mountain ranges in California given mean surface air temperature increases from 1°C to 5°C. The north region covers the Feather and Truckee watersheds north to the Oregon border. The central region extends from the Yuba and Carson watersheds down to the Merced basin. The south region encompasses the region from the San Joaquin to the Kern watersheds. The greatest changes in snow-covered area are likely to come in the north (Table 3). This is because the peak elevations of the northern watersheds are lower than the southern watersheds. The results presented here are consistent with other works such as Knowles and Cayan (2004) and Mote et al. (2005).
Table 3: Change in percent snow cover by region with air temperature rise
Region Mean Elevation
Avg. Apr 1 Snow Line
Snow Covered
Area With 1° C Warming
With 2° C Warming
With 3° C Warming
With 4° C Warming
With 5° C Warming
[m] [m] [% of basin]
[% of basin]
[% of basin]
[% of basin]
[% of basin]
[% of basin]
North 1,460 1,295 68% 53% 37% 24% 12% 6% Central 1,865 1,650 69% 59% 51% 41% 31% 21% South 1,940 1,770 58% 52% 47% 41% 36% 30%
15
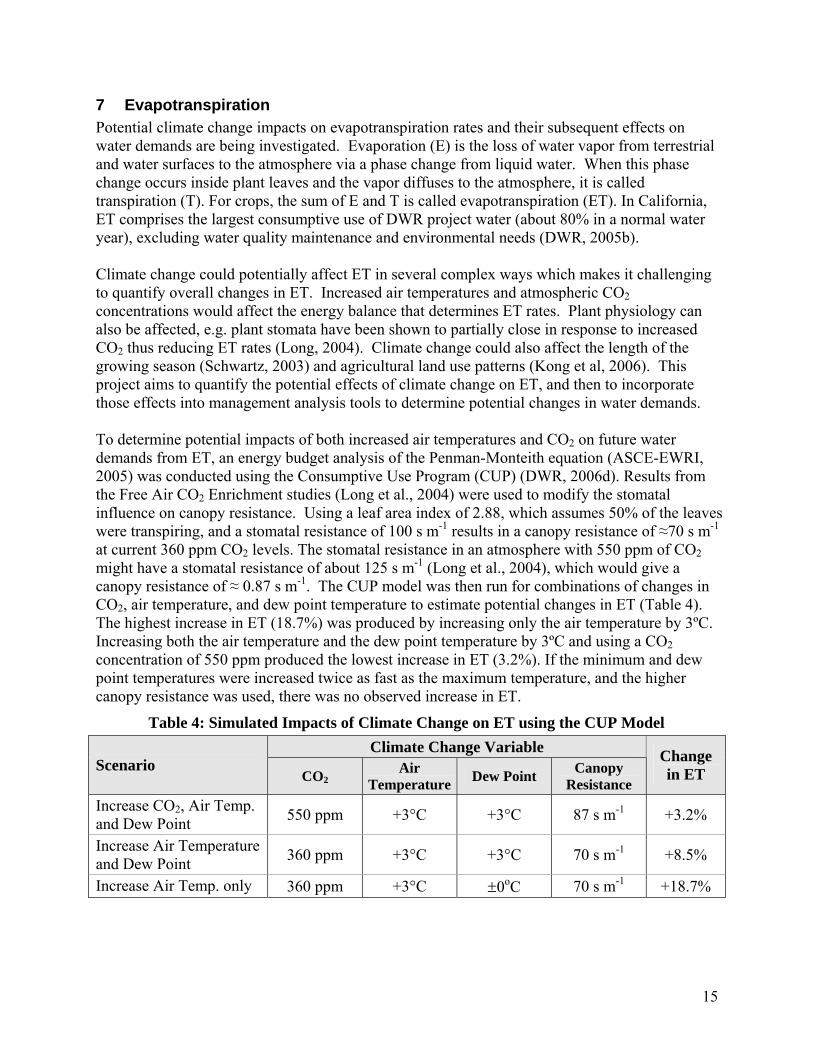
7 Evapotranspiration Potential climate change impacts on evapotranspiration rates and their subsequent effects on water demands are being investigated. Evaporation (E) is the loss of water vapor from terrestrial and water surfaces to the atmosphere via a phase change from liquid water. When this phase change occurs inside plant leaves and the vapor diffuses to the atmosphere, it is called transpiration (T). For crops, the sum of E and T is called evapotranspiration (ET). In California, ET comprises the largest consumptive use of DWR project water (about 80% in a normal water year), excluding water quality maintenance and environmental needs (DWR, 2005b). Climate change could potentially affect ET in several complex ways which makes it challenging to quantify overall changes in ET. Increased air temperatures and atmospheric CO2 concentrations would affect the energy balance that determines ET rates. Plant physiology can also be affected, e.g. plant stomata have been shown to partially close in response to increased CO2 thus reducing ET rates (Long, 2004). Climate change could also affect the length of the growing season (Schwartz, 2003) and agricultural land use patterns (Kong et al, 2006). This project aims to quantify the potential effects of climate change on ET, and then to incorporate those effects into management analysis tools to determine potential changes in water demands. To determine potential impacts of both increased air temperatures and CO2 on future water demands from ET, an energy budget analysis of the Penman-Monteith equation (ASCE-EWRI, 2005) was conducted using the Consumptive Use Program (CUP) (DWR, 2006d). Results from the Free Air CO2 Enrichment studies (Long et al., 2004) were used to modify the stomatal influence on canopy resistance. Using a leaf area index of 2.88, which assumes 50% of the leaves were transpiring, and a stomatal resistance of 100 s m-1 results in a canopy resistance of ≈70 s m-1 at current 360 ppm CO2 levels. The stomatal resistance in an atmosphere with 550 ppm of CO2 might have a stomatal resistance of about 125 s m-1 (Long et al., 2004), which would give a canopy resistance of ≈ 0.87 s m-1. The CUP model was then run for combinations of changes in CO2, air temperature, and dew point temperature to estimate potential changes in ET (Table 4). The highest increase in ET (18.7%) was produced by increasing only the air temperature by 3ºC. Increasing both the air temperature and the dew point temperature by 3ºC and using a CO2 concentration of 550 ppm produced the lowest increase in ET (3.2%). If the minimum and dew point temperatures were increased twice as fast as the maximum temperature, and the higher canopy resistance was used, there was no observed increase in ET.
Table 4: Simulated Impacts of Climate Change on ET using the CUP Model Climate Change Variable
Scenario CO2
Air Temperature Dew Point Canopy
Resistance
Change in ET
Increase CO2, Air Temp. and Dew Point 550 ppm +3°C +3°C 87 s m-1 +3.2%
Increase Air Temperature and Dew Point 360 ppm +3°C +3°C 70 s m-1 +8.5%
Increase Air Temp. only 360 ppm +3°C ±0oC 70 s m-1 +18.7%
16
The results of this study are being explored for incorporation into the Simulation of Evapotranspiration of Applied Water model (SIMETAW) (DWR, 2006d) to determine how climate change effects on ET rates could affect future agricultural water demands.
8 Future Directions and Risk Assessment The studies presented here are first steps in investigating potential effects of climate change on management of California’s water resources. Results from this assessment show that for future warming scenarios, there is general consensus among the expected impacts. Greater amounts of winter-season runoff combined with static flood protection rules would lead to greater uncontrolled releases from SWP and CVP reservoirs. Reduced spring-season runoff into the reservoirs would lead to decreased water supplies and deliveries to SWP and CVP water users. Both impacts would pose challenges to maintaining SWP and CVP performance levels at present-day conditions. While there is general consensus in their trend, the magnitudes and onset-timing of impacts discussed in this paper are uncertain and are scenario-dependent. It is of interest for long-term system planners to understand likelihood aspects of such impacts so that preparations and/or system modifications might be strategized in a timely manner. To support development of such strategies, the analysis activities described in this paper must be expanded from assessing potential impacts to assessing risk. Risk assessment involves integrated consideration of three factors: 1) a spectrum of potential scenarios that would cause impacts, 2) respective impacts associated with each scenario, and 3) estimates of relative scenario probabilities. The impacts assessment procedures of this paper would be repeated, but for an expanded set of scenarios. Relative scenario probabilities could be estimated by analyzing climate projection consensus among the available scenarios. Upon defining scenarios, evaluating their impacts, and assigning probabilities, risk could then be assessed as the integration of probability-weighted impacts across the set of scenarios. Such information would allow water resources planners and managers to consider relative likelihoods of threshold-level impacts in their decision making processes. Following this premise, a project is underway involving collaboration between Reclamation, DWR, and climate researchers, demonstrating how to apply risk assessment principles in the study of climate change implications for CVP/SWP operations. The assessment applies elements of the impacts assessment presented in this paper to a larger ensemble of IPCC4 climate change scenarios. The project will also explore risk mitigation involving non-infrastructure strategies. Other future efforts will involve addressing data and analysis gaps that were identified during these preliminary studies. For example, an analysis tool is needed to incorporate consideration of sea level rise into determination of system operations. Collaboration will continue with climate change scientists to develop criteria for determining appropriate scenarios for analysis and to assist with interpretation of impacts and risk assessments. The evolving assessment methodologies described in this paper aim to provide water resources managers with climate change information that can be used to develop planning, mitigation and adaptation strategies.
17
9 Acknowledgements The authors would like to acknowledge contributions by Michael Floyd, Morteza Orang, Hongbing Yin and all other co-authors of the report upon which this paper is based (DWR, 2006a). Editorial assistance was provided by Michael Durant.
10 References ASCE-EWRI. (2005). The ASCE Standardized Reference Evapotranspiration Equation. Technical Committee report to the Environmental and Water Resources Institute of the American Society of Civil Engineers from the Task Committee on Standardization of Reference Evapotranspiration. 173 p. Cayan, D.R., E.P. Maurer, M.D. Dettinger, M. Tyree and K. Hayhoe, (2006). Climate change scenarios for the California region, Journal of Climatic Change (in review). DWR (2006a) Progress on Incorporating Climate Change into Management of California’s Water Resources, Technical Memorandum Report, California Department of Water Resources http://baydeltaoffice.water.ca.gov/climatechange.cfm. DWR (2006b) CalSim Water Resources Simulation Model website, California Department of Water Resources, Bay-Delta Office, Modeling Support Branch, http://modeling.water.ca.gov/hydro/model/index.html cited 20 April 2006. DWR (2006c) Delta Simulation Model 2 (DSM2) website, California Department of Water Resources, Bay-Delta Office, Modeling Support Branch, Delta Modeling Section, http://baydeltaoffice.water.ca.gov/modeling/deltamodeling/models/dsm2/dsm2.cfm cited 20 April 2006 DWR (2006d) Consumptive Use Program (CUP) and Simulation of Evapotranspiration of Applied Water Program (SIMETAW) website, California Department of Water Resources, Division of Planning and Local Assistance, http://www.landwateruse.water.ca.gov/ basicdata/agwateruse/cropmodels.cfm cited November 2, 2006. DWR (2005a) California Water Plan Update 2005, Volume 1-Stategic Plan, Chapter 4: Preparing for an Uncertain Future, California Department of Water Resources, Sacramento, CA. DWR (2005b) California Water Plan Update 2005, Volume 1-Stategic Plan, Chapter 3: California Water Today, California Department of Water Resources, Sacramento, CA. DWR (1998). Bulletin 160-98. The California Water Plan Update. Volume 1. California Department of Water Resources. DWR (1988). Program Manual: HED71 for Headwater Runoff Forecasting. California Department of Water Resources, Division of Flood Management.
18
Easterling et al. (2000) Observed Variability and Trends in Extreme Climate Events: A Brief Review. [D.R. Easterling, J.L. Evans, P. Ya. Groisman, T.R. Karl1, K.E. Kunkel, P. Ambenje] Bulletin of the American Meteorological Society, 81, March 2000, 417-425. IPCC (2001). Intergovernmental Panel on Climate Change, Climate Change 2001: The Scientific Basis, Contribution of Working Group I to the Third Assessment Report of the IPCC, J. T. Houghton, Y. Ding, D.J. Griggs, M. Noguer, P. J. van der Linden and D. Xiaosu (Eds.), Cambridge University Press, UK. pp 944. Knowles, N. and D.R. Cayan (2004). “Elevational dependence of projected hydrologic changes in the San Francisco estuary and watershed”, Climatic Change, 62, 319-336. Kong, A, Cahill, K, Hristova, K, and Jackson, L. (2006). Land use change in California agricultural landscapes in response to climate change. Chapter 8. In Cavagnaro, TR, Jackson, LE and Scow, KM, eds. Climate Change: Challenges and Solutions for California Agricultural Landscapes. California. CEC-500-2005-189-SF. California Climate Change Center, Liou, K. N. (1992). Radiation and Cloud Processes in the Atmosphere. Oxford Monographs on Geology and Geophysics No. 20. Oxford University Press. Long, S.P., Ainsworth, E.A., Rogers, A. and Ort, D.R. (2004). Rising atmospheric carbon dioxide: plants FACE the future. Ann. Rev. Plant Biol. 55, 591-628. Maurer, E. P. (2006) Uncertainty in hydrologic impacts of climate change in the Sierra Nevada Mountains, California under two emissions scenarios, Journal of Climatic Change (in press). Miller et al. (2001). Climate Change Sensitivity Study of California Hydrology: A Report to the California Energy Commission, LBNL Technical Report No. 49110. Mote, PW, AF Hamlet, MP Clark, and DP Lettenmaier (2005). Declining mountain snowpack in western North America, Bulletin of the American Meteorological Society, 86:39-49. Schwartz, MD. (2003). Phenology: An Integrative Environmental Science. Kluwer Academic Publishers. Boston, MA, USA. pp564. SWRCB (1995). Water Quality Control Plan for the San Francisco Bay/Sacramento San Joaquin Delta Estuary, 95-1WR, State Water Resources Control Board, California Environmental Protection Agency, Sacramento, CA, May 1995.