project background trip generation methodology and results
TRANSCRIPT

\\vhb\gbl\proj\Raleigh\39134.00 Flora TIA\tech\Trip Gen Update_Nov 2020\Flora Farms Trip Gen Update.docx
VHB Engineering NC, P.C (C-3705) 940 Main Campus Drive Suite 500 Raleigh, NC 27606
To: Mark S. Bissell, PE Bissell Professional Group
Date: December 16, 2020
Project #: 39134.00
From: Andrew Topp, PE, PTOE Senior Project Manager
Re: Flora Farms Trip Generation Update – Moyock, North Carolina
Project Background VHB Engineering NC, P.C (VHB) completed the Flora Farms Subdivision TIA (dated April 14th, 2020) to analyze the impacts that the proposed Flora Farms development would have on the surrounding roadway network in Moyock, North Carolina. The site plan is being amended to reduce multiple land uses that were proposed in the traffic analysis. This memorandum states the new land use totals that will be proposed with the Flora Farms site and summarizes the differences between the existing trip generation for the site (from April 2020) and the new trip generation reduction that will be expected with the updated land use totals.
Trip Generation Methodology and Results Trip generation calculations for the Flora Farms site were prepared using the ITE Trip Generation Manual, 10th Edition and guidance from the NCDOT Congestion Management Rate vs. Equation Spreadsheet. Based on the available guidance, it was determined that LUC 210 (Single-Family Detached Housing), LUC 220 (Multifamily Housing (Low-Rise), and LUC 820 (General Retail) would be the most appropriate uses to include for the trip generation calculations.
April 2020 Trip Generation Results Originally, the Flora Farms site proposed to construct 285 single-family homes, 125 multifamily units (apartments or townhomes), and 100,000 square feet (sf) of general retail space. Table 1 shows the trip generation results for the site plan that was submitted in April 2020. As shown in Table 1, the site was expected to generate 8,380 daily external site trips with 463 external site trips (189 entering, 274 exiting) occurring during the AM peak hour and 717 external site trips (393 entering, 324 exiting) occurring during the PM peak hour. Of the expected 717 PM peak hour external site trips, a total of 155 trips were calculated to be pass-by site trips.

From: Andrew Topp, PE, PTOE Ref: Flora Farms Trip Generation Update December 16, 2020 Page 2
\\vhb\gbl\proj\Raleigh\39134.00 Flora TIA\tech\Trip Gen Update_Nov 2020\Flora Farms Trip Gen Update.docx
VHB Engineering NC, P.C (C-3705) 940 Main Campus Drive Suite 500 Raleigh, NC 27606
Table 1: April 2020 Trip Generation Results
November 2020 Trip Generation Update The Flora Farms site plan will be amended to reduce the size of the total development. The site now proposes to construct 277 single-family homes and up to 7,500-sf of general retail space. Table 2 shows the trip generation results for the new land use totals. As shown in Table 2, the site is now expected to generate 3,652 daily external site trips with 352 external site trips (144 entering, 208 exiting) occurring during the AM peak hour and 348 external site trips (207 entering, 141 exiting) occurring during the PM peak hour.
Enter Exit Total Enter Exit Total
210 Single-Family Detached Housing 285 du 2,725 52 155 207 175 103 278220 Multifamily Housing (Low-Rise) 125 du 904 14 45 59 45 27 72820 General Retail 100,000 sf 6,012 125 77 202 261 282 543
9,641 191 277 468 481 412 893
210 Single-Family Detached Housing 285 du 406 1 2 2 54 16 70220 Multifamily Housing (Low-Rise) 125 du 129 0 0 1 14 4 18820 General Retail 100,000 sf 726 1 1 2 20 68 88
1,262 2 3 5 88 88 176
210 Single-Family Detached Housing 285 du 2,319 51 153 204 121 87 208220 Multifamily Housing (Low-Rise) 125 du 775 14 45 59 31 23 54820 General Retail 100,000 sf 5,286 124 76 200 241 214 455
8,380 189 274 463 393 324 717
210 Single-Family Detached Housing 285 du 0 0 0 0 0 0220 Multifamily Housing (Low-Rise) 125 du 0 0 0 0 0 0820 General Retail 100,000 sf 0 0 0 77 78 155
0 0 0 77 78 155
210 Single-Family Detached Housing 285 du 51 153 204 121 87 208220 Multifamily Housing (Low-Rise) 125 du 14 45 59 31 23 54820 General Retail 100,000 sf 124 76 200 164 136 300
189 274 463 316 246 562Notes:1. Land Use Code and trip generation rates are determined based on ITE Trip Generation, 10th Edition2. Total site trips are determined based on the suggested method in the NCDOT Rate Vs Equation Spreadsheet3. Internal capture was based on NCHRP 684 method and NCDOT IC calculation spreadsheet4. Unconstrained pass-by trips are calculated based on ITE Trip Generation Handbook, 3rd Edition. The final projections are not expected to exceed 10% of adjacent street volumes.
Development Total
Land Use Code1 Land Use Unit ADT AM Peak Hour PM Peak Hour
Total Site Trips²
Development TotalTrip Reduction Due to Internal Capture3
Development TotalTotal External Site Trips
Pass-by Site Trips4
Development TotalNo-Pass-by Site Trips
Development Total

From: Andrew Topp, PE, PTOE Ref: Flora Farms Trip Generation Update December 16, 2020 Page 3
\\vhb\gbl\proj\Raleigh\39134.00 Flora TIA\tech\Trip Gen Update_Nov 2020\Flora Farms Trip Gen Update.docx
VHB Engineering NC, P.C (C-3705) 940 Main Campus Drive Suite 500 Raleigh, NC 27606
Table 2: November 2020 Trip Generation Results
Findings and Conclusions As a result, the updated Flora Farms site is expected to generate fewer total trips than what was analyzed in April 2020. Table 3 shows the percent reduction in site trips for the calculated daily, AM peak hour, and PM peak hour external site trips. The lane use totals are expected to reduce the AM peak hour trips by approximately 24% and the PM peak hour site trips by approximately 51%.
Enter Exit Total Enter Exit Total
210 Single-Family Detached Housing 277 du 2,655 50 151 201 170 100 270820 General Retail 7,500 sf 1,033 96 60 156 38 42 80
3,688 146 211 357 208 142 350
210 Single-Family Detached Housing 277 du 23 1 2 3 1 0 1820 General Retail 7,500 sf 13 1 1 2 0 1 1
36 2 3 5 1 1 2
210 Single-Family Detached Housing 277 du 2,632 49 149 198 169 100 269820 General Retail 7,500 sf 1,020 95 59 154 38 41 79
3,652 144 208 352 207 141 348
210 Single-Family Detached Housing 277 du 0 0 0 0 0 0820 General Retail 7,500 sf 0 0 0 13 14 27
0 0 0 13 14 27
210 Single-Family Detached Housing 277 du 49 149 198 169 100 269820 General Retail 7,500 sf 95 59 154 25 27 52
144 208 352 194 127 321Notes:1. Land Use Code and trip generation rates are determined based on ITE Trip Generation, 10th Edition2. Total site trips are determined based on the suggested method in the NCDOT Rate Vs Equation Spreadsheet3. Internal capture was based on NCHRP 684 method and NCDOT IC calculation spreadsheet4. Unconstrained pass-by trips are calculated based on ITE Trip Generation Handbook, 3rd Edition. The final projections are not expected to exceed 10% of adjacent street volumes.
Development Total
Land Use Code1 Land Use Unit ADT AM Peak Hour PM Peak Hour
Total Site Trips²
Development TotalTrip Reduction Due to Internal Capture3
Development TotalTotal External Site Trips
Pass-by Site Trips4
Development TotalNon-Pass-by Site Trips
Development Total

From: Andrew Topp, PE, PTOE Ref: Flora Farms Trip Generation Update December 16, 2020 Page 4
\\vhb\gbl\proj\Raleigh\39134.00 Flora TIA\tech\Trip Gen Update_Nov 2020\Flora Farms Trip Gen Update.docx
VHB Engineering NC, P.C (C-3705) 940 Main Campus Drive Suite 500 Raleigh, NC 27606
Table 3: Trip Generation Differences
Therefore, the new site plan does not warrant an update to the Flora Farms Subdivision TIA. The trips projected in the TIA will account for all traffic that is now proposed for the site. The trip generation pages for each land use code from the ITE Trip Generation Manual, 10th Edition are attached at the end of this memorandum.
Enter Exit Total Enter Exit Total
8,380 189 274 463 393 324 7173,652 144 208 352 207 141 348
-56.4% -23.8% -24.1% -24.0% -47.3% -56.5% -51.5%
- 0 0 0 77 78 155- 0 0 0 13 14 27- - - - -83.1% -82.2% -82.6%
- 189 274 463 316 246 562- 144 208 352 194 127 321- -23.8% -24.1% -24.0% -38.6% -48.4% -42.9%
Pass-By Trips
Total External Site Trips
% DiffferenceNovember 2020 Update
April 2020 TIA
% DiffferenceNovember 2020 Update
April 2020 TIA
Non-Pass-By Trips
PM Peak HourADTTrip Type
April 2020 TIA
% DiffferenceNovember 2020 Update
AM Peak Hour

Appendix

12/15/2020 https://www.itetripgen.org/PrintGraph.htm?code=210&ivlabel=UNITS210&timeperiod=AWDVTE&x=277&edition=385&locationCode=Ge…
https://www.itetripgen.org/PrintGraph.htm?code=210&ivlabel=UNITS210&timeperiod=AWDVTE&x=277&edition=385&locationCode=General Urban/S… 1/1
Single-Family Detached Housing(210)
Vehicle Trip Ends vs: Dwelling UnitsOn a: Weekday
Setting/Location: General Urban/SuburbanNumber of Studies: 159
Avg. Num. of Dwelling Units: 264Directional Distribution: 50% entering, 50% exiting
Vehicle Trip Generation per Dwelling UnitAverage Rate Range of Rates Standard Deviation
9.44 4.81 - 19.39 2.10
Data Plot and Equation
T =
Trip
End
s
X = Number of Dwelling Units
Study Site Average RateFitted Curve
Fitted Curve Equation: Ln(T) = 0.92 Ln(X) + 2.71 R²= 0.95
Trip Gen Manual, 10th Edition Institute of Transportation Engineers
0 500 1,000 1,500 2,000 2,500 3,0000
5,000
10,000
15,000
20,000
277
26152655
12/15/2020 https://www.itetripgen.org/PrintGraph.htm?code=210&ivlabel=UNITS210&timeperiod=TASIDE&x=277&edition=385&locationCode=Gen…
https://www.itetripgen.org/PrintGraph.htm?code=210&ivlabel=UNITS210&timeperiod=TASIDE&x=277&edition=385&locationCode=General Urban/Sub… 1/1
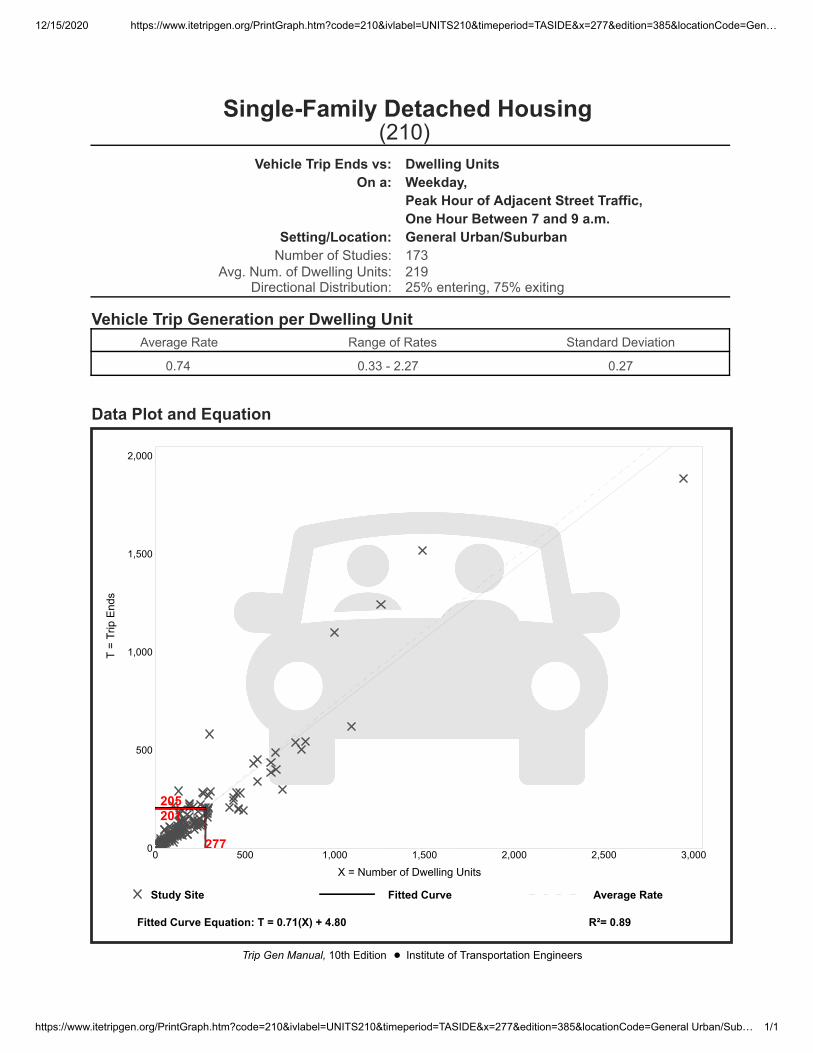
Single-Family Detached Housing(210)
Vehicle Trip Ends vs: Dwelling UnitsOn a: Weekday,
Peak Hour of Adjacent Street Traffic,One Hour Between 7 and 9 a.m.
Setting/Location: General Urban/SuburbanNumber of Studies: 173
Avg. Num. of Dwelling Units: 219Directional Distribution: 25% entering, 75% exiting
Vehicle Trip Generation per Dwelling UnitAverage Rate Range of Rates Standard Deviation
0.74 0.33 - 2.27 0.27
Data Plot and Equation
T =
Trip
End
s
X = Number of Dwelling Units
Study Site Average RateFitted Curve
Fitted Curve Equation: T = 0.71(X) + 4.80 R²= 0.89
Trip Gen Manual, 10th Edition Institute of Transportation Engineers
0 500 1,000 1,500 2,000 2,500 3,0000
500
1,000
1,500
2,000
277
205201

12/15/2020 https://www.itetripgen.org/PrintGraph.htm?code=210&ivlabel=UNITS210&timeperiod=TPSIDE&x=277&edition=385&locationCode=Gen…
https://www.itetripgen.org/PrintGraph.htm?code=210&ivlabel=UNITS210&timeperiod=TPSIDE&x=277&edition=385&locationCode=General Urban/Sub… 1/1
Single-Family Detached Housing(210)
Vehicle Trip Ends vs: Dwelling UnitsOn a: Weekday,
Peak Hour of Adjacent Street Traffic,One Hour Between 4 and 6 p.m.
Setting/Location: General Urban/SuburbanNumber of Studies: 190
Avg. Num. of Dwelling Units: 242Directional Distribution: 63% entering, 37% exiting
Vehicle Trip Generation per Dwelling UnitAverage Rate Range of Rates Standard Deviation
0.99 0.44 - 2.98 0.31
Data Plot and Equation
T =
Trip
End
s
X = Number of Dwelling Units
Study Site Average RateFitted Curve
Fitted Curve Equation: Ln(T) = 0.96 Ln(X) + 0.20 R²= 0.92
Trip Gen Manual, 10th Edition Institute of Transportation Engineers
0 500 1,000 1,500 2,000 2,500 3,0000
500
1,000
1,500
2,000
2,500
277
274270

11/6/2020 https://www.itetripgen.org/PrintGraph.htm?code=820&ivlabel=TQGFQ&timeperiod=AWDVTE&x=7.5&edition=385&locationCode=General…
https://www.itetripgen.org/PrintGraph.htm?code=820&ivlabel=TQGFQ&timeperiod=AWDVTE&x=7.5&edition=385&locationCode=General Urban/Subu… 1/1
Shopping Center(820)
Vehicle Trip Ends vs: 1000 Sq. Ft. GLAOn a: Weekday
Setting/Location: General Urban/SuburbanNumber of Studies: 147
Avg. 1000 Sq. Ft. GLA: 453Directional Distribution: 50% entering, 50% exiting
Vehicle Trip Generation per 1000 Sq. Ft. GLAAverage Rate Range of Rates Standard Deviation
37.75 7.42 - 207.98 16.41
Data Plot and Equation
T =
Trip
End
s
X = 1000 Sq. Ft. GLA
Study Site Average RateFitted Curve
Fitted Curve Equation: Ln(T) = 0.68 Ln(X) + 5.57 R²= 0.76
Trip Gen Manual, 10th Edition Institute of Transportation Engineers
0 500 1,000 1,5000
10,000
20,000
30,000
40,000
50,000
60,000
81033

11/6/2020 https://www.itetripgen.org/PrintGraph.htm?code=820&ivlabel=TQGFQ&timeperiod=TASIDE&x=7.5&edition=385&locationCode=General …
https://www.itetripgen.org/PrintGraph.htm?code=820&ivlabel=TQGFQ&timeperiod=TASIDE&x=7.5&edition=385&locationCode=General Urban/Suburb… 1/1
Shopping Center(820)
Vehicle Trip Ends vs: 1000 Sq. Ft. GLAOn a: Weekday,
Peak Hour of Adjacent Street Traffic,One Hour Between 7 and 9 a.m.
Setting/Location: General Urban/SuburbanNumber of Studies: 84
Avg. 1000 Sq. Ft. GLA: 351Directional Distribution: 62% entering, 38% exiting
Vehicle Trip Generation per 1000 Sq. Ft. GLAAverage Rate Range of Rates Standard Deviation
0.94 0.18 - 23.74 0.87
Data Plot and Equation
T =
Trip
End
s
X = 1000 Sq. Ft. GLA
Study Site Average RateFitted Curve
Fitted Curve Equation: T = 0.50(X) + 151.78 R²= 0.50
Trip Gen Manual, 10th Edition Institute of Transportation Engineers
0 500 1,000 1,5000
500
1,000
1,500
87
156

11/6/2020 https://www.itetripgen.org/PrintGraph.htm?code=820&ivlabel=TQGFQ&timeperiod=TPSIDE&x=7.5&edition=385&locationCode=General …
https://www.itetripgen.org/PrintGraph.htm?code=820&ivlabel=TQGFQ&timeperiod=TPSIDE&x=7.5&edition=385&locationCode=General Urban/Subur… 1/1
Shopping Center(820)
Vehicle Trip Ends vs: 1000 Sq. Ft. GLAOn a: Weekday,
Peak Hour of Adjacent Street Traffic,One Hour Between 4 and 6 p.m.
Setting/Location: General Urban/SuburbanNumber of Studies: 261
Avg. 1000 Sq. Ft. GLA: 327Directional Distribution: 48% entering, 52% exiting
Vehicle Trip Generation per 1000 Sq. Ft. GLAAverage Rate Range of Rates Standard Deviation
3.81 0.74 - 18.69 2.04
Data Plot and Equation
T =
Trip
End
s
X = 1000 Sq. Ft. GLA
Study Site Average RateFitted Curve
Fitted Curve Equation: Ln(T) = 0.74 Ln(X) + 2.89 R²= 0.82
Trip Gen Manual, 10th Edition Institute of Transportation Engineers
0 500 1,000 1,500 2,0000
2,000
4,000
6,000
8,000
880

Flora MXR Rezoning Request
December 16, 2020
Scheduled Time/Place: 6:00pm, Eagle Creek Pavilion
The meeting began at 6:00pm/Meeting Ended: at approximately 7:40pm
Comments from the Community How Addressed
Will the Ranchland property line ditch still be improved?
Yes, the ditch will be improved, laid back and put on positive grade to the outlet at Rowland Creek
Will the Ranchland property be affected? The plan will be to do this the way it has been approved at Moyock Farms, with no excavation taking place beyond the top of the existing ditch on the Ranchland side, and widening taking place on the Flora side of the ditch.
The back of the Flora tract is being cleared, but it looks like sections of trees are to remain.
Yes, the company that is harvesting the timber has been asked to keep several stands of trees within the environmentally sensitive areas.
Will the proposed berm go all the way back? The berm, which will be located on the Flora side of the improved ditch, will go back at least to the wetlands in the back.
It would be good if it could extend back farther. We will look into permitting to extend it across the wetlands as well.
Will the ditch be constructed first (what will the timing be)?
It is proposed that drainage improvements such as completing the Rowland Creek improvements and the Ranchland/Eagle Creek property line ditch improvements be constructed with the first phase of development.
What about a school? Decisions about a school site have been delayed since the existing schools are being expanded. A 22 acre parcel is being reserved for possible future use as a school site.
Attendees: (See attached sign-in sheets)
Also: Laurie LoCicero, Currituck County Justin Old, Developer Mark Bissell, Engineer

Summary:
Six residents attended, all from Ranchland. Their questions were addressed and they seemed satisfied.
There being no further questions or comments the meeting was adjourned. Several residents stayed for
informal discussions.
What will the price of houses be? It will be about 2 years before any houses are constructed so it is uncertain what the pricing will be at this time.
What improvements will take place in Phase 1? Phase 1 will involve drainage improvements up near Survey Road, as well as drainage improvements in the back along the common line with Ranchland and Eagle Creek. Drainage ponds will be constructed phase by phase.
What is the status of Moyock Farms? It is in the final stages of permitting and should get under construction in the spring.
How close will the hydrants be to Ranchland? Can we get any insurance benefit?
There will a couple of hydrants about 500’ from the Ranchland boundary so they may be within 1000’ of some of the homes.
The development is going to happen so lets work together to help solve the drainage problems. We think the ditches will be a big benefit.
We agree and will commit to making this happen.
Who will be responsible for maintaining Rowland Creek?
The HOA will have responsibility and will be funded. There will also be a stormwater association that will work with the Fost association to maintain the major drainage way.
Lariat road is a problem on the side which drains to Guinea Mill. Will any improvements be done to Guinea Mill?
The Guinea Mill drainage district needs to become active and make decisions on spending its existing fund balance. Laurie LoCicero will pass information on to Eric Weatherly.
Why was the development plan changed? The county commissioners thought that the previous plan was too intense for the property.
We are glad to see that the Flora development has been scaled back from what was proposed before and like this better.
Thank you.

Com
munity M
eeting Sign-In SheetFlora Tract
Decem
ber 16, 2020