project final report - cordis pressurized combined oxidation and corrosion tests on zl3 tubes 24 6.3...
TRANSCRIPT

23/09/2016 1
PROJECT FINAL REPORT
Grant Agreement number: 309916 Project acronym: Z-Ultra Project title: Z phase strengthened steels for ultra-supercritical power plants Funding Scheme: FP7-CP-SICA Period covered: from 01.02.2013 to 31.07.2016 Name of the scientific representative of the project's co-ordinator1, Title and Organisation: Professor Dr. Hermann Riedel Fraunhofer Institute for Mechanics of Materials IWM, Freiburg Tel: +49 761 5142 103 Fax: +49 761 5142 510 E-mail: [email protected]
Project website address www.z-ultra.eu
1 Usually the contact person of the coordinator as specified in Art. 8.1. of the Grant Agreement.

23/09/2016 2
Table of contents
Description of the main S&T results/foregrounds 3
Work Package 1: Material development and welding 3 1.1 Material development (SSF, DTU, RWE, IPP) 3 1.1.1 Background 3 1.1.2 The new alloy generations 4 1.2 Welding (Paton, DTU, IPP) 5
Work Package 2: Nanoscale experiments 7
Work Package 3: Ageing, corrosion, creep and internal friction tests: macroscale experiments 9 3.1 Aging and creep tests 9 3.2 Oxidation tests 10 3.3 Internal friction and shear modulus 12
Work Package 4: Nano- and microscale modelling 13 4.1 Nanoscale models 13 4.2 Thermodynamic/kinetic (microscale) models 16 4.2.1 Preliminary studies based on the MatCalc software 16 4.2.2 A model for the formation of Z-phase particles 16
Work Package 5: Meso - and macroscale modelling 18 5.1 Constitutive model 18 5.1.1 Governing equations 18 5.1.2 Model validation 18 5.2 User defined material routine for a finite element program 19 5.3 Finite element analysis of a demonstration example 20
Work Package 6: Demonstration, Upscaling 22 6.1 Large forging (SSF) 22 6.2 Pressurized combined oxidation and corrosion tests on ZL3 tubes 24 6.3 Pressurized creep rupture tests on ZL3 tubes 26 6.4 Superheater tubes installed in power plants (IPP) 27

23/09/2016 3
Description of the main S&T results/foregrounds The consortium combines the expertise of a steelmaker, a utility company, an engineering consultant company and eight research organizations and universities from the European Union and from three Eastern Partnership Countries (see the attached document Z-Ultra_Consortium.pdf).
Work Package 1: Material development and welding
1.1 Material development (SSF, DTU, RWE, IPP)
1.1.1 Background Many attempts have been made to develop martensitic 9-12Cr steels, which are stronger than the best commercial alloys, e.g. P92. This could enable construction of steam power plants with higher steam parameters than the current 300 bar and 600⁰C. At higher tempera-tures, 12%Cr content is needed for resistance against steam oxidation. Higher Cr content, however, accelerates the transformation of the fine MN nitrides into coarse CrMN Z-phase nitrides, and the disappearance of the fine nitrides causes a severe loss of creep strength within 5,000-30,000 hours at 600-650⁰C.
Microstructure studies of the formation mechanism of Z phase have shown that the Z phase does not nucleate on its own in martensitic steels. Instead it forms by diffusion of Cr from the steel matrix into the MN particles. This slowly transforms the MN particles into Z phases. On the atomic scale this transformation is seen as the formation of double atomic layers of Cr inside the MN cubic crystal. These Cr planes gradually transform the cubic MN crystal into the tetragonal Z-phase crystal, Fig. 1.1.
Fig 1.1.
Atomic scale images of the transformation of a cubic TaN (a) into a tetragonal CrTaN Z-phase (d). Double atomic layers of Cr (dark) form in the MN crystal.
The idea to use fine Z-phase particles as strengthening agents, rather than trying to avoid them, was presented in 2008: By strong acceleration of the Z-phase transformation the growth of Z-phase particles could be suppressed, and a fine distribution of Z-phase particles could be achieved, which would provide stable long-term precipitation hardening. In order to

23/09/2016 4
accelerate the Z-phase transformation the Cr content should be high, C should be as low as possible, and Z-phase should be of the type CrNbN or CrTaN. The need for high Cr indicated that it could be possible to produce a stable 12Cr martensitic creep resistant steel, which could provide oxidation resistance for steam temperatures up to 650⁰C.
The first alloys based on this idea, called Z3 and Z4, exhibited good creep resistance, similar to P92, but they were brittle at room temperature and they developed isothermal austenite during creep; both features are not acceptable in a creep resistant steel.
The analysis of these problems led to the alloy called ZL3, which was designed and melted prior to Z-Ultra, where it served as the reference alloy. During the project it turned out that the envisaged heat treatment did not lead to the desired microstructure. A special two-step treatment had to be developed, which caused an initial delay. Nevertheless the goals of Z-Ultra were finally reached.
After the heat treatment ZL3 showed clear improvements of the impact toughness and there was little propensity to isothermal austenite formation. However, the creep strength was lower than that of Z4 and P92, though better than that of P91.
1.1.2 The new alloy generations Based on the mechanical tests and on the microstructural investigations on ZL3, the next generation of alloys, called ZU1 to ZU3 was designed. The ideas were to enhance the formation of the Z phase by lowering the C content, to improve the toughness by reducing the content of Laves phase, especially in the form of films on grain boundaries, to supress the formation of coarse BN particles, and to try Z-phases based on a mixture of Ta and Nb. The resulting proposed compositions are shown in Table 1.1.
Table 1.1. Target compositions of test melts ZU1, ZU2 and ZU3, together with the reference alloy ZL3 and the alloy Z4 from a previous project
Saarschmiede (SSF) manufactured the three test melts using induction melting and vacuum arc remelting. Ingots were forged to 40 mm x 40 mm square bars. Based on dilatometry tests appropriate two-step heat treatments were developed and applied.
Creep tests showed that ZU1 has the best creep strength, even better than P92. The tough-ness is also good, and the oxidation resistance is excellent. Investigations of ZU2 indicated that mixed Z phases of Nb and Ta were less favourable than the pure Ta based Z phases. The ZU3 with Mo and W based Laves phase and without Cu showed grain growth in the HAZ of weldments.
The development of the next alloy generation, called ZU4 to ZU7, was guided by the ideas to enhance Z phase formation further by reducing the C content, to supress BN formation by lowering the B and N contents, to control delta ferrite by using Co and Cu as the main austenite formers, and to exploit the Laves phase as an additional strengthening precipitate by increasing W, however, without compromising toughness. The resulting proposed compositions are shown in Table 1.2.
wt%, bal. FeCr C B Ta Nb N W Mo Ni Co Cu Mn Si
Z4 11,79 0,005 0,004 0,39 0 0,033 2,9 0 0,5 7,3 0 0,48 0,3ZL3 12,1 0,06 0,0063 0,36 0 0,049 2,47 0 0,19 3,5 1,95 0,21 0,31ZU1 11 0,03 0,004 0,4 0,04 2 0 0,2 3 2 0,1 0,3ZU2 11 0,03 0,004 0,2 0,15 0,04 2 0 0,2 3 2 0,1 0,3ZU3 11 0,05 0,004 0,4 0 0,04 1,8 0,5 0,2 3,5 0 0,1 0,2

23/09/2016 5
Table 1.2. Target compositions of test melts ZU4-7, compared to ZU1
Figure 1.2 shows the calculated equilibrium amount of precipitates in the new alloys at 650⁰C compared with alloys Z4, ZL3 and ZU1.
Fig 1.2.
Equilibrium precipitate phases in new steels as compared with Z4, ZL3 and ZU1, calculated with Thermocalc ver. 3.1 and database TCFE7.
The materials were manufactured and heat treated according to the same principles as the previous alloys. The impact toughness of ZU5-7 was found to be rather low; ZU4 exhibits acceptable toughness.
The new steels show the desired martensitic microstructure (see WP2). The creep strength and the oxidation resistance are excellent (see WP3); ZU4 has the best properties. Finally at the end of the project, an alloy composition, called Z-Ultra, is proposed which should maintain the advantages of the ZU4 alloy, but with improved toughness.
1.2 Welding (Paton, DTU, IPP) For all new steels developed in Z-Ultra appropriate welding procedures were worked out. This includes the choice of the welding method, the consumables, the flux, the process parameters, and the post weld heat treatment (PWHT). A document with technological recommendations has been prepared. For Submerged Arc Welding (SAW), ferritic-martensitic consumables are recommended if the foreseen service temperature is up to 625°C. For higher temperatures nickel base consumables with moderate Cr content are recommended. Root passes are preferably welded by Tungsten Inert Gas (TIG) welding.
Obeying the recommendations one can weld thick-section specimens of the new alloys without cold cracking, without excessive grain coarsening and without delta ferrite formation in the HAZ. The welds are approximately as strong as the base metal. Some of the welded creep specimens brake in the weld, others brake in the base metal.
The demonstration pipes which were inserted into two power plants in Kiev were welded successfully into the superheaters of the boilers (WP6).
wt%, bal. FeCr C B Ta N W Ni Co Cu Mn Si
ZU1 11 0,03 0,004 0,4 0,04 2 0,2 3 2 0,1 0,3ZU4 11,5 0,015 0,003 0,4 0,035 2 0,1 4 2 0,1 0,3ZU5 11,5 0,015 0,003 0,4 0,035 2,5 0,1 5,5 1 0,1 0,3ZU6 11,5 0,01 0,003 0,4 0,035 2,3 0,1 5 2 0,1 0,3ZU7 11,5 0,01 0,003 0,4 0,035 2,7 0,1 5,5 1,5 0,1 0,3

23/09/2016 6
The good weldability of the new steels was also demonstrated for multipass welding of a large ring cut from a 12 ton forging, which was made to demonstrate the feasibility of a welded turbine rotor (WP6). Figure 1.3 shows the welding process and the final welded part.
Fig. 1.3. Filling of the circumferential groove by SAW and the final welded ring
Visual control and ultrasonic inspection of the weld showed no faults in the HAZ and the weld metal, except for two small slag inclusions.
The welding of the large ring was also simulated using the finite element method. The simulation gives the temperature history at each point in the material. As a final result one obtains, e.g., the distribution of the residual stresses (Fig. 1.4). After welding the maximum hoop stress is as high as 1000 MPa. PWHT at 760°C for 4 h reduces the maximum hoop stress to 70 MPa. The color codes in Fig. 1.4 range from -780 MPa (blue) to +1012 MPa (red) in the top picture and from -43 to +71 MPa in the bottom picture).
Fig. 1.4.
Hoop stresses in the welded ring after welding (top) and after PWHT (bottom)
The color codes range from -780 MPa (blue) to +1012 MPa (red) in the top picture and from -43 to +71 MPa in the bottom picture

23/09/2016 7
Work Package 2: Nanoscale experiments The objectives of this work package are to document the microstructures of the new steels, and their evolution during creep and ageing tests and during welding. Evolving phases are identified and the kinetics of precipitation is investigated. The goal is to provide explanations for the macroscopic, technologically relevant material properties. Remedies for adverse pro-perties can then be proposed, and beneficial effects can be enhanced. Thus the microstruc-tural findings are valuable input for the other work packages.
To reach this goal, a microstructure characterization toolbox was developed combining light optical microscopy, scanning electron microscopy (SEM), transmission electron microscopy (TEM), and atom probe tomography (APT). These methods were refined and adjusted for the specifics of Z-phase strengthened steels.
With this toolbox all relevant precipitates can be identified, often including their precise chemical composition. All steels contain primary particles, BN, MnS, TaO and/or TaC. Also NbC exists in trial alloy ZU2. Figure 2.1 shows an example. These primary particles are often detrimental for the toughness and should be avoided. For example, the poor lifetime found in the 650°C/80 MPa creep test on ZU1 was probably caused by oxide inclusions.
Fig. 2.1.
a) SEM secondary electron micrograph showing a TaC and a BN particle; EDS spectra for b) TaC and c) BN.
Figure 2.2 demonstrates the reduction of BN particles in the first alloy generation.
Fig. 2.2.
BN area fraction in ZL3 and ZU1-3 trial steels.
Cu particles form in all Cu containing steels. They are considered as nucleation sites for the Laves phase, which would otherwise form continuous grain boundary films, which is detrimental for the toughness. Further, the removal of Cu during the first step of tempering

23/09/2016 8
from the matrix increases the Ac1 temperature and thus allows for a higher tempering temperature in the second tempering step without the risk of reverse austenite formation. Figure 2.3 shows the distribution of Cu atoms in an Atomic Probe Tomography (APT) picture. The picture also shows a particle with a composition close to the Z phase.
Figure 2.3.
An APT reconstruction of ZU7 in the as-tempered condition showing Cu (orange), Ta (purple), TaN (dark purple), C (brown), and N (green) ions. The chemical composition of the particle is provided in the table. Note the low amount of C in the precipitate.
The poor toughness of ZU5-7 is attributed to W rich films (Laves phase?) on grain bounda-ries (Fig. 2.4). It is suspected that the low C content leads to the absence of M23C6 particles, which contribute to the nucleation of isolated Laves phase particles.
Fig. 2.4.
STEM/HAADF micrograph of ZU7 showing equiaxed Laves-phase (white contrast)as well as W-rich films at the lath boundaries. Black contrast indicates the location of Cu particles, which have, however, been removed by the specimen preparation
In Z-Ultra it is important to understand the formation of the Z phase. Figure 2.5 demonstrates the effect of the composition of particles. If the particles contain too much carbon, they do not incorporate Cr easily, so that Z phase cannot be formed readily. For low C concentrations, nearly the ideal Z-phase composition is found. Also the Nb/Ta ratio has a positive effect on the Cr uptake of the particles.

23/09/2016 9
Fig. 2.5.
Concentration of Cr and Ta+Nb as a function of C/N ratio in carbonitrides and Z-phase precipitates in ZU2.
Work Package 3: Ageing, corrosion, creep and internal friction tests: macroscale experiments In WP3 the results of the macroscopic experiments are presented. In relation to the aims of the project the results of the creep tests are most important. It is found that the Z-phase strengthened steels developed in this project exhibit superior creep strength compared to the best commercial martensitic steels, e.g. P92. Also the oxidation resistance is much better than that of the 9%Cr steels due to the higher Cr content.
3.1 Aging and creep tests Twenty aging tests were carried out on ZL3 and ZU1-4 at temperatures 625°C and 650°C for times up to 17 327 h. The microstructure of the aged specimens was examined in WP2.
Thirty creep tests on ZL3 and ZU1-7 plus 16 tests on cross-welded specimens were carried out at 600°C, 625°C and 650°C. Creep rupture times lay in the range 100 h to about 8 000 h. Figures 3.1 shows the creep curves measured at 600°C/200 MPa.
Fig. 3.1. Creep curves of all test alloys for tests at 600°C/200 MPa
0
10
20
30
40
50
0.0 0.2 0.4 0.6 0.8 1.0 1.2 1.4
Con
cent
ratio
n of
Cr,
Ta+N
b [a
t. %
]
Ratio of concentrations C/N
Cr and (Ta+Nb)- concentration as a function of C/N-ratio in NbTaCN(Cr) in steel ZU2
Ta+Nb
Cr
0 500 1000 1500 2000 2500 3000TIME [h]
0.00
0.05
0.10
0.15
0.20
0.25
0.30
ELO
NGAT
ION ZL3
600°Cσ = 200 MPa
ZU3 (939)
ZU2 (941)
ZU1 (940)
0 2000 4000 6000 8000TIME [h]
0.00
0.05
0.10
0.15
0.20
ELO
NGAT
ION
T = 600°Cσ = 200 MPa
ZU7
ZU6
ZU5ZU4

23/09/2016 10
The creep curves clearly show that the creep strength of the first test alloy generation, ZU1-3, is better than that of the reference alloy, ZL3, and the last alloy generation, ZU4-7, exhibits significantly longer lifetimes than all previous alloys.
Figure 3.2 shows a comparison with the best commercial 9Cr ferritic-martensitic steel, P92.
Fig. 3.2.
Creep rupture times of Z-Ultra test alloys compared to data on P92 from [Kazuhiro Kimura, Yukio Takahashi, Evaluation of Long-Term Creep Strength of ASME Grades 91, 92, and 122 Type Steels, Proc. of the ASME 2012 Pressure Vessels & Piping Conference, July 15-19, 2012, Toronto, Canada]
The specimens ZU4 and ZU5 broke only after the end of the project; see creep curves in Fig. 3.1.
Apparently, the reference alloy of the Z-Ultra project, ZL3, exhibits a creep rupture strength between P91 and P92, and thus already fulfils the requirement of milestone MS9 (“Material exhibits martensitic microstructure, creep strength better than P91”). Among the first-year test alloys (ZU1-3) ZU1 was the best. Its creep rupture strength was better than P92 except the test at 650°C/80 MPa; the poor lifetime of this test could be attributed to an unusual population of oxide particles. The final set of test alloys (ZU4-7) clearly outperformed ZU1. Some of the specimens (ZU4 and ZU5) broke two months after the end of the project.
3.2 Oxidation tests Long-term (up to 4500 h) corrosion tests in air were carried out on all test alloys at 650˚C and 750˚C. Table 3.1 shows the mass change by oxidation after 3000 hours exposure time.
Temperature T in ˚C
Exposure time in h
Mass change in mg/cm2
ZL3 ZU1 ZU2 ZU3 ZU4 ZU5 ZU6 ZU7
650 3000 0.035 0.035 0.041 0.040 0.024 0.022 0.023 0.025
750 3000 0.165 0.170 0.233 0.141 0.166 0.180 0.201 0.169
Table 3.1. Mass change after 3000 hours exposure time at 650˚C and 750˚C in air.

23/09/2016 11
The main reason for developing 11-12%Cr steels is the expected better oxidation resistance compared to the current 9% Cr steels. In fact the experiments in Z-Ultra show that the mass gain after 3000 h in air at 650°C is as low as 0.022 to 0.041 mg/cm2 for the new alloys, whereas the current 9% Cr steels exhibit a weight gain around 8 mg/cm2 (for P92) under these conditions.
At short times the weight gain qualitatively shows the parabolic behavior, which is expected for diffusion controlled oxide growth. At 750°C the curves continue to increase (Fig. 3.3), while at 650°C the mass gain becomes very slow, or even comes to a standstill. The most creep resistant steels, ZU4 and ZU5, also have excellent oxidation resistance at 650°C.
Fig. 3.3. Mass change vs. exposure time of ZU4-7 at 750˚C in air.
After 3000 h exposure time in air the specimen surfaces of all steels were examined using the SEM-EDX technique in order to study the morphology and chemical composition of the oxidized surfaces. As an example, Fig. 3.4 shows the SEM image and the corresponding EDX spectrum taken from the surface of ZU4 oxidized at 750°C. Apparently Cr is the main constituent in the oxide layer.
Fig. 3.4. SEM image and the EDX spectrum from ZU4 after oxidation at 750˚C/3000h
0.00
0.10
0.20
0.30
0 500 1000 1500 2000 2500 3000 3500
Mas
s cha
nge,
mg/
cm2
Exposure time, h
Oxidation at 750°C in air
ZU4
ZU5
ZU6
ZU7
3 2 4, 1
23/09/2016 12
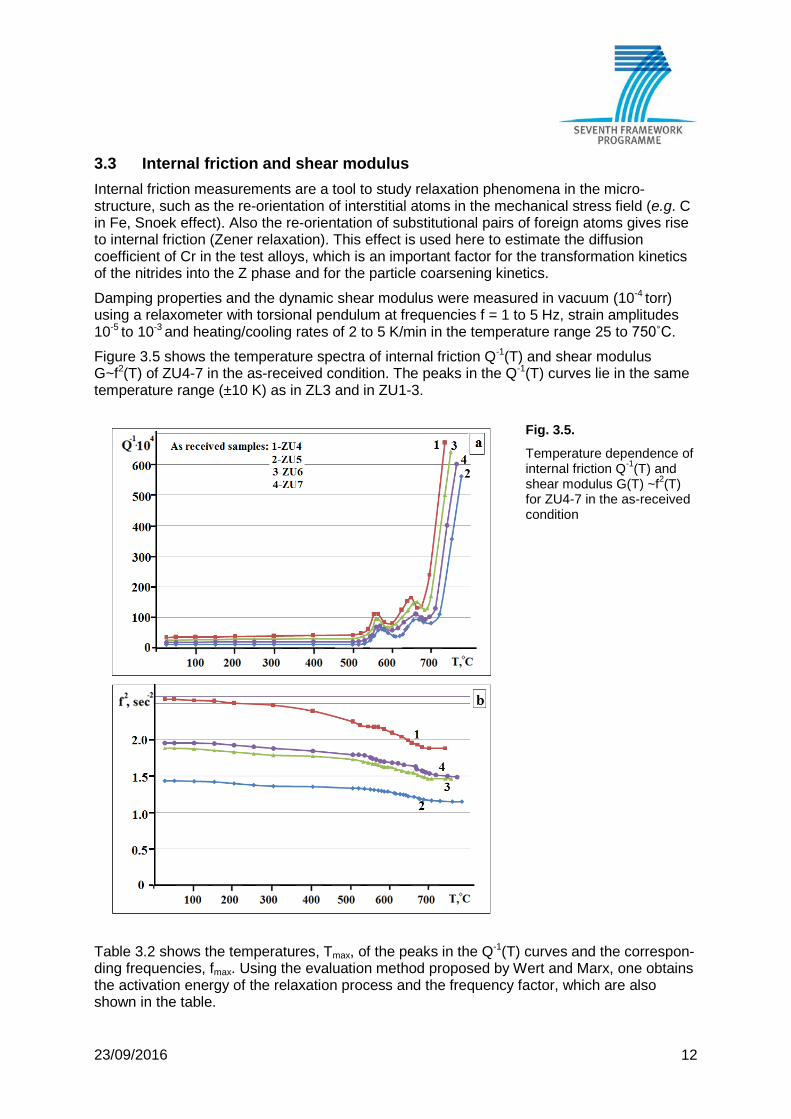
3.3 Internal friction and shear modulus Internal friction measurements are a tool to study relaxation phenomena in the micro-structure, such as the re-orientation of interstitial atoms in the mechanical stress field (e.g. C in Fe, Snoek effect). Also the re-orientation of substitutional pairs of foreign atoms gives rise to internal friction (Zener relaxation). This effect is used here to estimate the diffusion coefficient of Cr in the test alloys, which is an important factor for the transformation kinetics of the nitrides into the Z phase and for the particle coarsening kinetics.
Damping properties and the dynamic shear modulus were measured in vacuum (10-4 torr) using a relaxometer with torsional pendulum at frequencies f = 1 to 5 Hz, strain amplitudes 10-5 to 10-3 and heating/cooling rates of 2 to 5 K/min in the temperature range 25 to 750˚C. Figure 3.5 shows the temperature spectra of internal friction Q-1(T) and shear modulus G~f2(T) of ZU4-7 in the as-received condition. The peaks in the Q-1(T) curves lie in the same temperature range (±10 K) as in ZL3 and in ZU1-3.
Fig. 3.5.
Temperature dependence of internal friction Q-1(T) and shear modulus G(T) ~f2(T) for ZU4-7 in the as-received condition
Table 3.2 shows the temperatures, Tmax, of the peaks in the Q-1(T) curves and the correspon-ding frequencies, fmax. Using the evaluation method proposed by Wert and Marx, one obtains the activation energy of the relaxation process and the frequency factor, which are also shown in the table.

23/09/2016 13
Steel IF peaks Tmax, °C
IF peaks fmax, sec-1
Activation energy H, kJ/mol
Frequency factor, τ0
-1, sec-1
ZU4 555 1,48 207 3.1014
650 1,40 238.5 2.1014
ZU5 575 1,06 220 1,85.1014
665 1,05 244 1,9.1014
ZU6 560 1,30 217 2,3.1014
665 1,23 243 1,95.1014
ZU7 565 1,30 216 1,8.1014
660 1,28 241 1,9.1014
Table 3.2. Activation characteristics of relaxation processes in ZU4-7
The relaxation peak at 570˚C, exhibits all features of a peak caused by the Zener relaxation mechanism. In addition, the high value of the frequency factor (~1014 sec-1) and the half-width of the peak, which is less than 35˚C, leads to the conclusion that a single relaxation process is active, namely the reorientation of Cr atom pairs in the sign-changing stress field of the torsional vibrations. With this interpretation, the diffusion coefficient of Cr can be calculated:
𝐷 = 2.88 ∙ exp −𝐻𝑅𝑅 (in cm2/s)
Where 𝐷 is a mean coefficient of Cr diffusion in the reference steel, H is the activation energy given in the Table above, R is the gas constant and T the absolute temperature.
The activation energies for the peak at 55 to 575°C in Table 3.2 lie in the range 207 to 220 kJ/mol, which is consistent with the value 218 kJ/mol used in the MatCalc database. Also the pre-exponential factor, 2.88 cm2/s, agrees approximately with the MatCalc database.
Work Package 4: Nano- and microscale modelling There are world-wide efforts to complement the classical methods of material development by Integrated Computational Material Science and Engineering. The Z-Ultra project is intended to contribute substantially to the progress of this field. On the nanoscale, the Z-Ultra activities rely mainly on Density Functional Theory (DFT) and, to a smaller extent, on the Tight Binding (TB) method. On the microscale, thermodynamic/kinetic models are developed to describe and understand the transformation of the precursory nitrides to Z phase.
4.1 Nanoscale models In a systematic DFT study formation energies, structural parameters and bulk moduli were calculated for the transition metals Ti, V, Nb, Ta, Cr, for their binary mono- and semi-nitrides and -carbides, and for the ternary nitrides CrVN, CrNbN, and CrTaN and carbides CrVC, CrNbC, and CrTaC with the Z-phase structure. Table 4.1 shows that the Z phase nitrides are energetically favorable compared to the B1 structure of the mono-nitrides, which generally prevail in steels.

23/09/2016 14
Compound M V/f.u. [A3] K [GPa] Eform w.r.t.
MN(B1)+Cr [eV/f.u.] Eform w.r.t.
MN(Bh)+Cr [eV/f.u.]
CrMN V 58,30 295 -0,272 0,075 Nb 67,41 289 -0,344 -0,004 Ta 68,30 300 -0,564 0,133
Table 4.1: Structural and cohesive properties for the Z-phase nitrides. Formation energies for the Z-phase are given with respect to the formation from MN(B1)+Cr(AFM), or from MN(Bh)+Cr(AFM). Negative formation energies are highlighted by bold font.
Next the formation energies of defects in the binary mono-nitrides VN, NbN and TaN and semi-nitrides V2N, Nb2N and Ta2N were calculated. The results indicate that migration of Cr atoms in the transition-metal nitrides will occur via a vacancy hopping mechanism and not via interstitial atom positions, which are energetically highly unfavorable.
The transformation of the nitrides to Z phase involves the diffusion of atoms in the nitrides. Migration paths for both, host metal (M) and Cr-substitutional diffusion via a vacancy-hopping mechanism were determined for the two mono-nitride structures B1 and Bh (Fig. 4.1). The corresponding migration energies over the saddle points between neighboring stable posi-tions are given in Table 4.2.
(a) (b) (c)
or
Figure 4.1: Diffusion paths in (a) the cubic (B1) MN lattice and (b),(c) the hexagonal (Bh) MN lattice.
M-diffusion via vacancy Cr-diffusion via vacancy Crystal x-y-plane z-direction x-y-plane z-direction
B1 VN 1.73 eV 1.82 eV NbN 2.19 eV 1.29 eV TaN 1.56 eV 1.47 eV
Bh VN 2.58 eV 2.43 eV 2.81 eV 1.89 eV NbN 2.95 eV 1.87 eV 2.26 eV 0.19 eV TaN 3.62 eV 2.05 eV 2.61 eV 0.17 eV
Table 4.2: Energy barriers for M- and CrM-diffusion via a vacancy-hopping mechanism in the MN lattice of B1 and Bh symmetry.
The sum of the formation and migration energies of the lattice defects determines the diffusion coefficient which is needed in the thermodynamic/kinetic models. In these models it is customary to express activation energies in kJ/mol; 1 eV corresponds to 96 kJ/mol.
23/09/2016 15
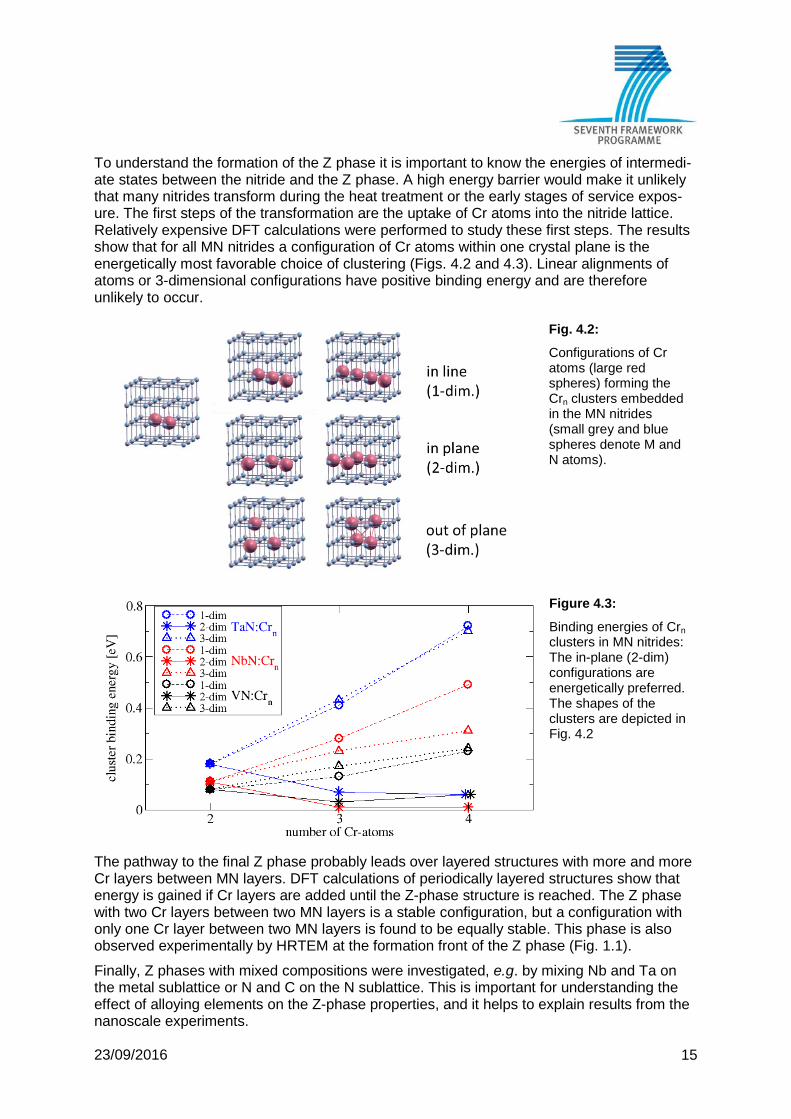
To understand the formation of the Z phase it is important to know the energies of intermedi-ate states between the nitride and the Z phase. A high energy barrier would make it unlikely that many nitrides transform during the heat treatment or the early stages of service expos-ure. The first steps of the transformation are the uptake of Cr atoms into the nitride lattice. Relatively expensive DFT calculations were performed to study these first steps. The results show that for all MN nitrides a configuration of Cr atoms within one crystal plane is the energetically most favorable choice of clustering (Figs. 4.2 and 4.3). Linear alignments of atoms or 3-dimensional configurations have positive binding energy and are therefore unlikely to occur.
Fig. 4.2:
Configurations of Cr atoms (large red spheres) forming the Crn clusters embedded in the MN nitrides (small grey and blue spheres denote M and N atoms).
Figure 4.3:
Binding energies of Crn clusters in MN nitrides: The in-plane (2-dim) configurations are energetically preferred. The shapes of the clusters are depicted in Fig. 4.2
The pathway to the final Z phase probably leads over layered structures with more and more Cr layers between MN layers. DFT calculations of periodically layered structures show that energy is gained if Cr layers are added until the Z-phase structure is reached. The Z phase with two Cr layers between two MN layers is a stable configuration, but a configuration with only one Cr layer between two MN layers is found to be equally stable. This phase is also observed experimentally by HRTEM at the formation front of the Z phase (Fig. 1.1).
Finally, Z phases with mixed compositions were investigated, e.g. by mixing Nb and Ta on the metal sublattice or N and C on the N sublattice. This is important for understanding the effect of alloying elements on the Z-phase properties, and it helps to explain results from the nanoscale experiments.

23/09/2016 16
4.2 Thermodynamic/kinetic (microscale) models
4.2.1 Preliminary studies based on the MatCalc software Although the database for the Z phase in ThermoCalc and in MatCalc is rather scarce and the specific formation mechanism of the Z phase is not taken into account, a rough picture of the phase evolution can be obtained by MatCalc. The software was used, for example, to simulate the heat treatment of the ZU4 steel (austenizing 1100°C/1h, two-step tempering 650°C/4h + 750°C/2h) with subsequent service exposure at 650°C. Figure 4.4 shows the calculated evolution of the phase fractions and of the particle radius.
102 103 104 105 106 107 108 10910-4
10-3
10-2
10-1
ZU4 target composition
Laves
M7C3Volu
me
fract
ion
Time in s
Cu
M23C6NbN
Z
102 103 104 105 106 107 108 1090.1
1
10
100
1000
10000ZU4 target composition
Mea
n pa
rticl
e ra
dius
in n
m
Time in s
NbN
Cu
M23C6
Z
M7C3
Laves
Fig. 4.4. Phase evolution in ZU4 during heat treatment and subsequent service at 650°C
As the picture shows, MatCalc (with the chosen input parameters) would predict that the Z phase forms easily during the heat treatment and co-exists with the nitride for a long time. Only after 108 s (167,000 h) the Z-phase fraction grows at the expense of the nitride. This prediction is probably not realistic, because the present version of MatCalc does not include the peculiarities of Z-phase formation.
4.2.2 A model for the formation of Z-phase particles At the beginning of the project the idea was that the formation of Z phase could be modelled by simply extending the approach on which the MatCalc software is based. To include a spectrum of nucleation sites was expected to improve the theory substantially. However, it turned out that no great improvement could be achieved by this idea.
Since the formation of Z phase occurs by the transformation of the pre-existing nitrides, we developed a model for Z-phase formation based on this specific mechanism. The transforma-tion is associated with a large volume change. The resulting pressure on the particle would cause a very high nucleation barrier, unless the excess volume is accommodated by a mechanism such as diffusion or elastic and creep deformation. The growth of the particles would come to a standstill without such an accommodation mechanism. Conventional models for particle precipitation do not take this aspect into account properly.
In the model developed in Z-Ultra the nitride is gradually transformed into Z phase by uptake of Cr. In order to limit the confining pressure, which would develop as a result of the excess volume, the particle must release Nb and N into the matrix. The model is worked out using the thermodynamic extremal principle (TEP). Gibbs energies of the matrix and of the particle are taken from the standard thermodynamic literature and the appropriate data banks.

23/09/2016 17
The model is applied to a quaternary Fe-Cr-Nb-N system with the chemical composition cor-responding to alloy ZU4 (Fe 11.5Cr 0.4Ta 0.035N in wt%), in which atoms of Ta are replaced by Nb. The following parameters are chosen: T = 650°C, unit cell size Z = 300 nm, starting radius R0 = 1 nm. The results of simulations are summarized in Fig. 4.5, showing the evolu-tion of geometrical, mechanical and chemical variables.
Fig. 4.5. a) Precipitate radius R, b) pressure p, c) site fraction u2 of Cr in the precipitate,
d) site fraction 𝑢1 of Nb in the matrix. Labels indicate different values of the interface activity coefficient: (0) W = ∞ (interface reaction easy) to (8) W = 0 (interface reaction suppressed)
The results indicate that the growth of the particle (a) is accompanied by a pressure on the particle (b), which is relaxed when the growth ceases due to the drop of the Nb content in the matrix to its equilibrium value (d). When the Nb supply from the matrix decreases, the particle starts to incorporate Cr (c), which means that it transforms into Z phase. This is associated with another increase of volume and pressure.
10-2 10-1 100 101 102 103 104 105 106 1071
10
0.01 0.1 1 10 100 1000 10000 1000001000000 1E7
1
10
0
8
17
65432
504030
20
86
34
2
R/nm
t/s10-5 10-4 10-3 10-2 10-1 100 101 102 103 104 105 106 107
0
5
10
15
0.01 0.1 1 10 100 1000 10000 1000001000000 1E7
0
5
10
15
0
78
65432
1p/G
Pa
t/s
103 104 105 106 107
0.0
0.1
0.2
0.3
0.4
0.51000 10000 100000 1000000 1E7
0.0
0.
0.2
0.3
0.4
0.5
0-3 4 5 6 7
8
u 2
t/s101 102 103 104 105 106 107
10-7
10-6
10-5
10-4
10-3
10 100 1000 10000 100000 1000000 1E7
1E
1E
1E
1E
1E
0-2 3 4 56
78
_ u 1
t/s
a)
c) d)
b)

23/09/2016 18
Work Package 5: Meso- and macroscale modelling The work in WP5 comprises the development of a constitutive model (Section 5.1), the implementation of a constitutive model in a finite element code (Section 5.2) and a demonstration example (Section 5.3).
5.1 Constitutive model
5.1.1 Governing equations
The model comprises a set of coupled evolution equations for the strain rate 𝜀, for three types of dislocation densities, 𝜌𝑚, 𝜌𝑑𝑑𝑑, 𝜌𝑏 for the subgrain size 𝑅𝑠𝑏𝑠, for the damage caused by particle coarsening 𝐷𝑑𝑑𝑝, and for grain boundary cavitation damage 𝐷𝑐𝑐𝑐.
𝜀 = 𝑏·𝜌𝑚·𝑐𝑔𝑀·(1−𝐷𝑝𝑝𝑝)·(1−𝐷𝑐𝑐𝑐)
(5.1)
𝑑𝜌𝑚𝑑𝑝
= 𝑐𝑔ℎ𝑚𝜌𝑚 + 𝑐𝑔
ℎ𝑏𝑅𝑠𝑏𝑠 − 𝑐𝑔
2𝑅𝑠𝑏𝑔𝜌𝑚 − 8𝜌𝑚3/2𝑣𝑐𝑚 − 𝑑𝑐𝑎ℎ(𝜌𝑚 + 𝜌𝑑𝑑𝑑)𝜌𝑚𝑣𝑠 (5.2)
𝑑𝜌𝑑𝑑𝑝𝑑𝑝
= 𝑐𝑔2𝑅𝑠𝑏𝑔
𝜌𝑚 − 𝑐𝑐𝑑ℎ𝑏𝜌𝑑𝑑𝑑 − 𝜌𝑑𝑑𝑝
ℎ𝑑𝑑𝑝𝑣𝑐𝑑 − 𝑑𝑐𝑎ℎ𝜌𝑑𝑑𝑑𝜌𝑚𝑣𝑠 (5.3)
𝑑𝜌𝑏𝑑𝑝
= 𝐾 𝑐𝑐𝑑ℎ𝑏𝜌𝑑𝑑𝑑 − 𝑀𝑠𝑏𝑃𝑠𝑏 − 2𝜋∑ 𝑟𝑚𝑚𝑐𝑎,𝑑
2 𝑁𝑐,𝑑8𝑑=1 𝛾𝑠𝑏
𝜌𝑚𝑅𝑠𝑏𝑔
(5.4)
𝑑𝑅𝑠𝑏𝑔𝑑𝑝
= 𝑀𝑠𝑏𝑃𝑠𝑏 − 2𝜋∑ 𝑟𝑚𝑚𝑐𝑎,𝑑2 𝑁𝑐,𝑑
8𝑑=1 𝛾𝑠𝑏 − 𝐺𝜂𝑐𝐾𝑐𝑅𝑠𝑏𝑠 (𝜌𝑚 + 𝜌𝑑𝑑𝑑)1/2 − 𝐾𝑐
𝑅𝑠𝑏𝑔 Ω𝐷𝑠𝑘𝑅
(5.5)
𝑐𝑐𝑐 = 𝐴 ɛ ɛ (5.6)
𝑑𝑑𝑝 = 𝑘𝑝(𝑙−1)
· 1 −𝐷𝑑𝑑𝑝𝑙 (5.7)
𝑟𝑚𝑚𝑐𝑎,𝑑 and 𝑁𝑐,𝑑 are the size and the number density of precipitate particles, 𝑃𝑠𝑏 is the capillary pressure exerted by the subgrain boundary. All other model parameters are explained in previous reports and in the publications of TUG.
5.1.2 Model validation Figure 5.1 shows the creep curves for ZU2 simulated at different stresses at 650°C. The modelled creep curves show good agreement with experimental curves including the tertiary creep stage.
The constitutive model was also applied to the steels P91 and P92, since for these materials many experimental data are available, which can be used to further validate the model. The measured creep curves can be described well by the model. Also measured and calculated microstructural quantities (dislocation densities and subgrain size) are consistent. In Fig. 5.2, for example, a SEM picture of the subgrain structure is compared with the model prediction.

23/09/2016 19
Fig. 5.1.
Modelled creep curve compared with experiments on ZU2
Figure 5.2. Subgrain growth in P91 during creep exposure (a) simulation
(b) FEG-SEM image of 7000 hours creep loaded specimen at 600°C and 60 MPa
5.2 User defined material routine for a finite element program A material model similar to the one described in Section 5.1 was implemented as a user defined material routine in the finite element program ABAQUS using a radial return algorithm together with the efficient stress integration algorithm of Simo and Taylor. To test the routine it was applied to the nickel base alloy 617B, for which sufficient experimental data were available at the time of the deliverable report D5.4.
As a demonstration example the model was applied to a superheater header. If components of power plants need to be replaced, it may be advisable to use a stronger material than the original one. The advantage is that a stronger material requires smaller wall thicknesses. Smaller wall thickness allows for faster start/stop cycles, since thermal stresses are smaller, which means less fatigue.
Figure 5.3 shows the result of a study to demonstrate the advantage to use Alloy 617B for a superheater header instead of P91 for retrofit. The 617B component requires a much smaller wall thickness than the P91 component for a comparable creep life. However, the fatigue life-

23/09/2016 20
time of the 617B component is predicted to be 8 times greater than that of the P91 component (70,000 vs. 8,600 cycles).
Fig. 5.3. Superheater header. Comparison of design based on P91 (left) and Alloy 617B (right).
Predicted number of cycles to technical crack, NA
This case study demonstrates one of the advantages of using a more creep resistant material in existing power plants. In this case a rather expensive nickel base alloy was considered, but the general conclusion is valid also for Z-phase strengthened steels with superior creep strength.
5.3 Finite element analysis of a demonstration example Another demonstration example was worked out, when a few data on ZU1-3 became available. To demonstrate the superiority of the new Z-phase strengthened steels, a Y-shaped pipe branching is considered (Fig. 5.4).
Fig. 5.4.
Geometry of the Y-shaped branch. The right half is sectioned to show the stress distribution in the interior.
The wall thickness of the pipe at the bottom is 36.5 mm

23/09/2016 21
The part is installed in power plants of project partner RWE and has been made of the classical 12%Cr steel with German designation X20CrMoV12-1. Service temperature and pressure are typically 535°C and 180 bar.
For the present study, the creep properties of the new steel ZU1 are used, and the service temperature is increased compared to X20 to either 600°C or 650°C. A rather slow cycle is considered, since long-time creep, rather than fatigue, is the relevant aspect in Z-Ultra. It corresponds to constant base load during weekdays and shut down during the weekend. The service temperature is either 600°C or 650°C, the pressure is 180 bar or 280 bar. Ten such loading cycles are simulated. Figure 5.5 shows a contour plot of the equivalent creep strain.
Fig. 5.5. Equivalent creep strain at the end of the tenth cycle (a) for 600°C/180 bar, (b) for 600°C/280 bar, (c) for 650°C/180 bar.
The maximum creep strain develops at the inner surface of the main pipe at a small distance below the weld with the wye branch. For 600°C/180 bar the accumulated strain after 10 cycles (corresponding to 10 weeks) is 0.011%, which means 1% strain after about 20 years. In the other two cases shown in Fig. 5.5 the strain is substantially greater and would not be acceptable in a power plant.
In conclusion the considered wye branch, which has been operated at typically 535°C/180 bar, could be operated at 600°C/180 bar if the previous steel X20CrMoV12-1 were replaced by the Z phase strengthened steel ZU1. Alternatively the wall thickness could be reduced, which renders the part less susceptible to thermal fatigue, if a more flexible operation mode is required. The steels ZU4 and ZU5 are even more creep resistant than ZU1. Based on the sparse data available at the end of the project, about 600°C/220 bar or 615°C/180 bar would be possible.
b) a) c)

23/09/2016 22
Work Package 6: Demonstration, Upscaling All tasks of Work Package 6 have been completed by the end of the project. Saarschmiede (SSF) has demonstrated the possibility of upscaling the production of the new steels by producing a 12 ton forging.
StandZeit, as a subcontractor of RWE, has developed and carried out innovative tests to investigate the corrosion and creep resistance of the new steels under conditions very close to the conditions in boilers of real power plants.
IPP has organized the installation of tubes manufactured by SSF in two power plants of Kievenergo. The tubes were removed towards the end of the project. Testing continues in a test rig installed in a power plant of RWE beyond the end of the project.
6.1 Large forging (SSF) Within WP6 the Task “Manufacturing of a large forging for welded turbine rotor part with about 10 to 12 t weight and a diameter of around 1,100 mm” was carried out. The projected final dimensions of the rotor part are 1,100 mm diameter and 1,600 mm length. Alloy ZU1was chosen for the large forging.
The sequence of production steps is shown in Table 6.1 and the total production time was calculated to 34 weeks after decision for start of manufacturing.
Table 6.1. Production steps and time schedule for the manufacturing of the large forging.
Manufacturing of the full scale forging started with the melting of the electrodes in the vacu-um induction furnace (VIM) for Electro-Slag-Remelting (ESR). For the scheduled size of the rotor three electrodes with a total weight of ca. 22 tons were produced. The electrodes were remelted to an ESR-ingot with a diameter of 1,300 mm and a weight of ca. 21.3 tons, Fig. 6.1. During remelting several samples for checking the chemical composition were taken.

23/09/2016 23
Fig. 6.1.
ESR Ingot, diam. 1300 mm, during homogenizing before forging
After remelting, the ESR ingot was transferred in hot state directly to the forging shop and was first homogenized at a temperature of 1180°C for 50 hours. The forging procedure consisted of a combination of several drawing operations and a two-time upsetting process. For forging a hydraulic press with a capacity of 85 MN was used. The forgability of the Alloy ZU1 proved to be good and no severe cracks occurred during the forging process.
Subsequently the forging was subjected in hot state to a first heat treatment (preliminary heat treatment) in order to cool down the forging without cracks and to achieve a sufficient machinability. After the preliminary heat treatment the forging was machined for quality heat treatment and the first ultrasonic inspection (UT), Fig. 6.2. UT-inspection revealed no internal defects and a sufficiently low minimum detectable defect size in the centre of the forging for further processing (quality heat treatment).
Fig. 6.2.
Machined part before quality heat treatment
The final heat treatment (quality heat treatment) to achieve the required mechanical proper-ties was performed in the same way as for the trial melt ZU1. However, in order to achieve a fully martensitic structure in the centre of a large forging it is necessary to quench the part in oil instead of air-cooling for the small bars. Also longer tempering times compared to the trial melt are needed to achieve a homogeneous temperature in the large forging.

23/09/2016 24
After another machining and ultrasonic testing mechanical tests were performed. The forging shows homogenous tensile properties over the axial length. The impact toughness is very high compared with other creep resistant 9-12% Cr-steels. On the other hand, the yield stress is rather low for a turbine steel. This is probably caused by the long tempering time, which was considered to be necessary for the thick-section part. Light microscopy showed that the microstructure is fully martensitic without δ-ferrite. The target chemical analysis was almost achieved in the final product.
A ring was cut from the forging and sent to Paton Institute for welding tests (see Work Package 1).
6.2 Pressurized combined oxidation and corrosion tests on ZL3 tubes In a pressurized combined oxidation and corrosion test a tube of ZL3 was tested at Standzeit GmbH (Subcontract RWE). The tube (dimension Ø42 x 7 mm, l = 430 mm) was delivered by Saarschmiede to Standzeit. Figure 6.3 shows the test tube in front of the test rig. Weldments at the connections to the steam line were performed with TIG wire S Ni 6082. An additional longitudinal weld bead without filler metal was applied on 3-o’clock position along the tube axis to investigate the influence of oxidation and corrosion on the microstructure of the heat-affected zone.
Fig. 6.3.
Test tube after welding
The tube is pressurized by flowing water vapour supplied from a natural circuit evaporator with 24 bars static. The outside of the tube is exposed to synthetic flue gas with atmospheric pressure. The area around the 12-o’clock-position is covered with a layer of hard coal ashes taken from the hard-coal fired, pulverized coal RWE power plant Gersteinwerk.
To allow testing the corrosion behavior at different temperatures in one test, a temperature gradient in the range 610 to 670°C along the tube axis is accomplished by a furnace with three control circuits.
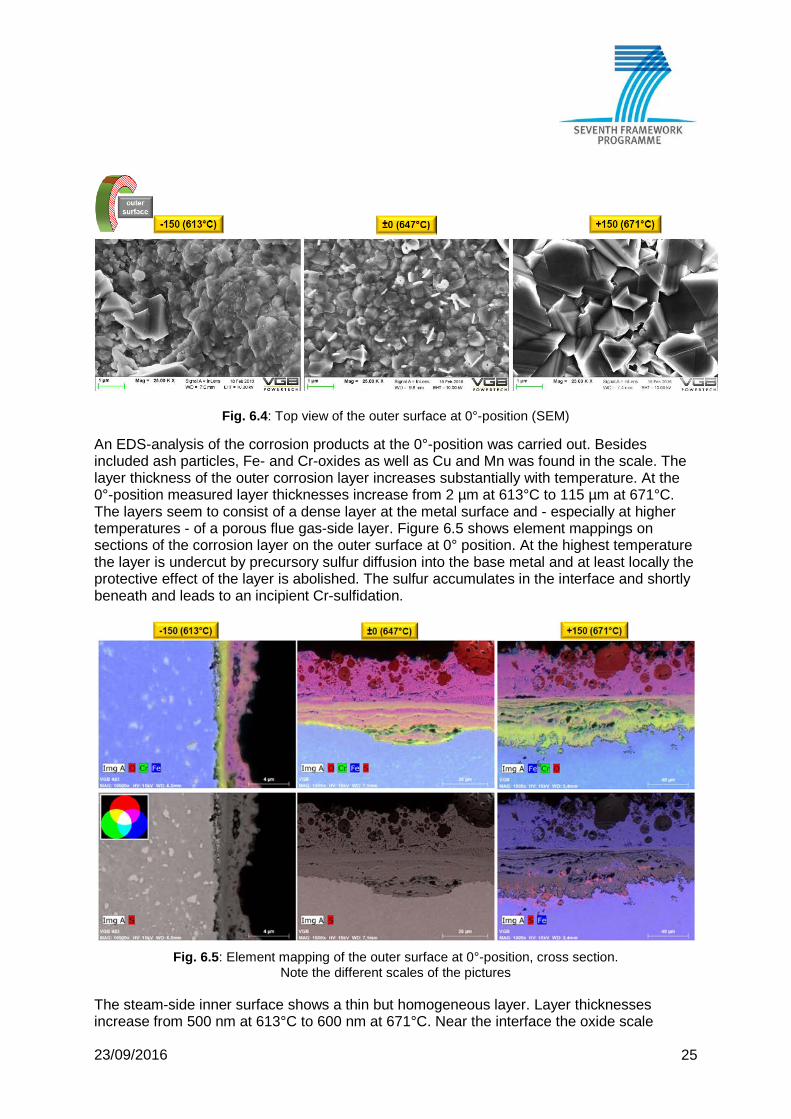
After 7,613 h the test was terminated and the test tube was examined by VGB Material Laboratory at three positions along the tube axis, where temperatures 613, 647 und 671°C had been measured during the test. At each axial position the outer surface (the flue gas side) was examined at 0° (under ash layer), at 180° (ash free) and at 90° at the blind weld. Figure 6.4 shows the top view of the corrosion layer on the outer surface at 0°-position (under the ash layer).
23/09/2016 25
Fig. 6.4: Top view of the outer surface at 0°-position (SEM)
An EDS-analysis of the corrosion products at the 0°-position was carried out. Besides included ash particles, Fe- and Cr-oxides as well as Cu and Mn was found in the scale. The layer thickness of the outer corrosion layer increases substantially with temperature. At the 0°-position measured layer thicknesses increase from 2 µm at 613°C to 115 µm at 671°C. The layers seem to consist of a dense layer at the metal surface and - especially at higher temperatures - of a porous flue gas-side layer. Figure 6.5 shows element mappings on sections of the corrosion layer on the outer surface at 0° position. At the highest temperature the layer is undercut by precursory sulfur diffusion into the base metal and at least locally the protective effect of the layer is abolished. The sulfur accumulates in the interface and shortly beneath and leads to an incipient Cr-sulfidation.
Fig. 6.5: Element mapping of the outer surface at 0°-position, cross section.
Note the different scales of the pictures
The steam-side inner surface shows a thin but homogeneous layer. Layer thicknesses increase from 500 nm at 613°C to 600 nm at 671°C. Near the interface the oxide scale
23/09/2016 26
exhibits increased chromium content. The layer contains magnetite, hematite and Cr2O3 at the interface.
In conclusion the oxidation resistance on the steam side is very good. On the flue gas side the corrosion resistance is acceptable up to 650°C, while at 671°C sulfidation occurs under the thick and porous corrosion layers.
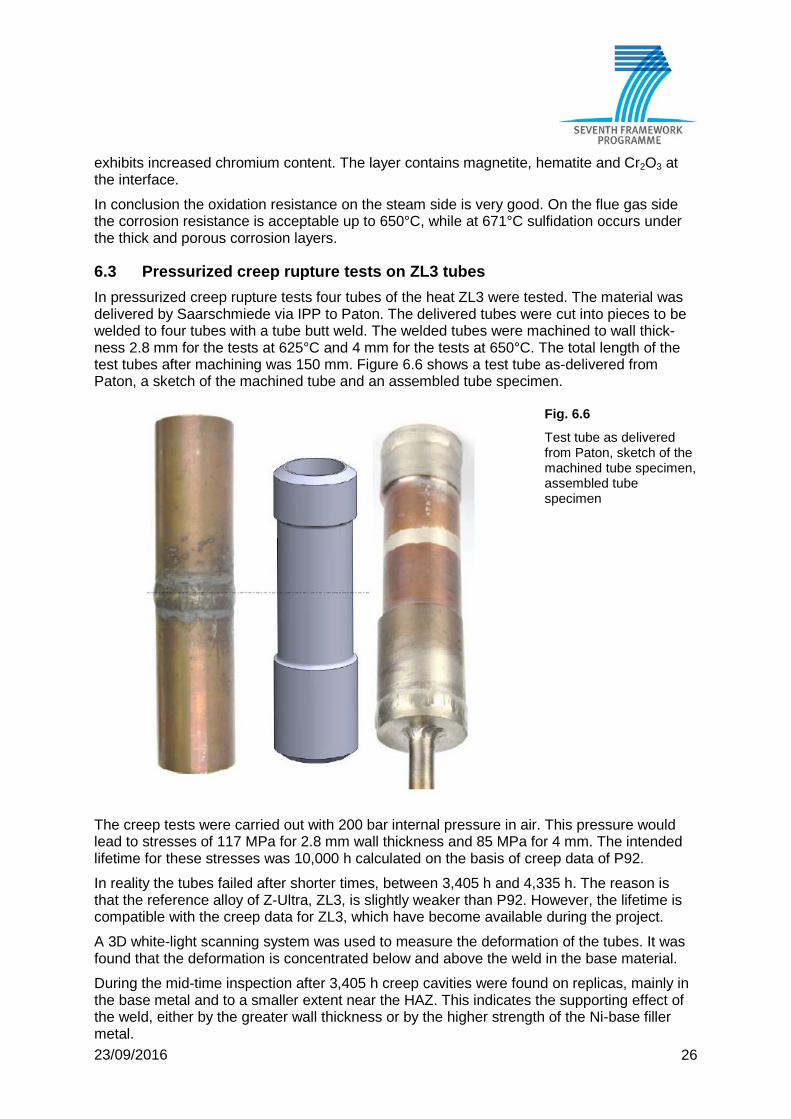
6.3 Pressurized creep rupture tests on ZL3 tubes In pressurized creep rupture tests four tubes of the heat ZL3 were tested. The material was delivered by Saarschmiede via IPP to Paton. The delivered tubes were cut into pieces to be welded to four tubes with a tube butt weld. The welded tubes were machined to wall thick-ness 2.8 mm for the tests at 625°C and 4 mm for the tests at 650°C. The total length of the test tubes after machining was 150 mm. Figure 6.6 shows a test tube as-delivered from Paton, a sketch of the machined tube and an assembled tube specimen.
Fig. 6.6
Test tube as delivered from Paton, sketch of the machined tube specimen, assembled tube specimen
The creep tests were carried out with 200 bar internal pressure in air. This pressure would lead to stresses of 117 MPa for 2.8 mm wall thickness and 85 MPa for 4 mm. The intended lifetime for these stresses was 10,000 h calculated on the basis of creep data of P92. In reality the tubes failed after shorter times, between 3,405 h and 4,335 h. The reason is that the reference alloy of Z-Ultra, ZL3, is slightly weaker than P92. However, the lifetime is compatible with the creep data for ZL3, which have become available during the project.
A 3D white-light scanning system was used to measure the deformation of the tubes. It was found that the deformation is concentrated below and above the weld in the base material.
During the mid-time inspection after 3,405 h creep cavities were found on replicas, mainly in the base metal and to a smaller extent near the HAZ. This indicates the supporting effect of the weld, either by the greater wall thickness or by the higher strength of the Ni-base filler metal.

23/09/2016 27
Figure 6.7 shows tube No. 2, which was tested at 650°C and failed after 3,405 h, and the microstructure of the leakage area. A crack in longitudinal direction of approx. 15 mm length is located in the base metal below the HAZ. In the vicinity of the leakage, the material deve-loped numerous linear chained voids. Similar pictures were obtained from the other tubes.
Fig. 6.7: Overview of tube No. 2 and the microstructure of the leakage area
6.4 Superheater tubes installed in power plants (IPP) Four tubes were made from the alloy ZL3 by SSF and were installed in two power plants of Kievenergo in Kiev. Two tubes (#1 and #2, Ø42x6x735 mm) were installed in a platen high-pressure superheater from boiler TGM-96A of PP5, Fig. 6.8. The other tubes (#3 and #4, Ø42x7x735 mm) were installed in a high-pressure convective steam superheater from boiler TGMP-344A of PP6, Fig. 6.9. Figure 6.10 shows the installed tubes in PP6.
Fig. 6.8. Platen high pressure (‘folding screen’) superheater from boiler TGM-96A of PP5.

23/09/2016 28
Fig. 6.9. Two blocks of the high pressure superheater from boiler TGMP-344A of PP6
Fig. 6.10. Demonstration tubes #3 and #4 in PP6. Locations in the boiler.
The tubes remained in the power plants for 12,045 h (tube #1), 3,832 h (tube #2), 11,134 h (tube #3) and 3,859 h (tube #4). The temperature of tubes #1 and #2 was 540°C, while tube #3 was exposed to 520°C - 530°C and tube #4 to 475°C - 502°C.
The tubes removed from the boilers were sent to RWE for further testing in an in-plant test rig, and to Chalmers for microscopic inspection. On the outer surface of tube #2 (the flue gas side) RWE found a corrosion layer with a thickness of 24 µm. The corrosion layer on the outer surface of tube #4 has a thickness of 51 µm. On the inner surface tube #2 (the steam side) has an oxide scale with a thickness of 33 µm. Due to the low service temperature of tube #4 the oxide scale on its inner surface has a thickness of only 15 µm.